Abstract
Inaccurate and untimely adjustments of cleaning parameters during the operation of wheat combine harvesters lead to high cleaning losses and impurity rates. For this reason, a self-made 4 L-2.5 threshing and cleaning experiment table was employed for cleaning parameter optimization experiments for wheat combine harvesters in this paper. The influence of the cleaning parameters on the cleaning loss and impurity rates was analyzed, and the optimum combination of cleaning parameters was predicted and verified. The contribution hierarchy of cleaning parameters to cleaning loss rate is as follows: crank speed of shale shaker > opening of chaffer > operation speed > fan speed > throttle opening. Meanwhile, the contribution hierarchy of cleaning parameters to impurity rate is as follows: operation speed > fan speed > throttle opening > crank speed of shale shaker > opening of chaffer. The predicted optimum combination of cleaning parameters, i.e., when the cleaning loss and impurity rates are both at a minimum and the feed quantity is at the maximum, is as follows: operating speed—2.2 m/s; opening of chaffer—26 mm, throttle opening—20°; fan speed—1100 r/min; and Crank speed of shale shaker—350 r/min. With these settings, the cleaning loss rate was 1.5% and the impurity rate was 1.9%. In the validation experiment, the average cleaning loss rate was found to be 1.47%, the average impurity rate was 1.96%, and the relative error of the predicted values was 0.03% and 0.06%, respectively. Compared with the cleaning index of combine harvesters with commonly used parameters, the cleaning loss rate was reduced by 0.12% and the impurity rate was reduced by 0.19%.
1. Introduction
The cleaning device is one of the core structures of a wheat combine harvester; it is used to perform threshing mixture cleaning operations in order to complete the separation of wheat grains and impurities, as well to clean the wheat grain itself [1,2,3,4,5]. Therefore, the operative quality of the cleaning device is directly related to the overall operating quality of the combine harvester [6,7]. Cleaning parameters refer to adjustable settings that affect the operation quality of the cleaning device of the combined harvester, whereas the cleaning loss and impurity rates are evaluation indexes for the cleaning quality of the harvester [8,9,10].
Extensive research has been conducted on the optimization of wheat harvester cleaning parameters and their influence on cleaning quality. Zhong et al. [11] undertook orthogonal experiments on the cleaning components of a 4lz-1.0q rice wheat combine harvester; the results of wheat field tests were analyzed using the fuzzy comprehensive evaluation method. The optimal parameter combinations of vibrating screen crank speed, screen surface structure, centrifugal fan speed, and vibrating screen amplitude in the cleaning process, as well as the primary and secondary order cleaning parameters affecting cleaning performance, were obtained, thereby improving the machine’s adaptability and ensuring good harvesting quality. Geng et al. [12] attempted to optimize the cleaning parameters, such as cleaning screen amplitude, cleaning screen frequency, fan wind speed, and air flow direction angle, of a wheat combine harvester to investigate their effect on the cleaning loss and impurity content rates. In their study, the optimal combination of cleaning parameters was determined, providing a reference for the parameter selection and optimization. Jin et al. [13,14] undertook a bench optimization test on the main operating parameters (feed rate, air door opening, fan speed, and angle of upper and lower air guide plates) of a double outlet, multi-air duct cleaning device. Those authors studied the influence of these factors on the cleaning loss rate, impurity content rate, and secondary impurity content rate, determining the optimal parameter combination thereof. A response surface bench test was carried out with the mass fraction of grains, stems, and sundries in the total mass of the desorbed matter of a double desorber as the test index. Feed rate, the opening of the air door, fan speed and the angle of the upper and lower air guide plates were used as test factors. The influences of these factors on the test index were analyzed, and the best matching parameters were obtained, serving as a reference for the study of the harvester’s performance and the structural design of a multi air channel cleaning device. Li et al. [15] carried out a wheat bench test on the main influences (feed rate, air door opening and fan speed) on the operation of a multi duct centrifugal fan with double outlets. The impact of each factor on the cleaning quality evaluation index (cleaning loss rate and impurity content) was investigated, and the optimal parameter combination was determined, providing a reference for research and design of multi duct centrifugal fans. Tong et al. [16] proposed improvements to the fan structure, i.e., longitudinal axial flow full feed double air channels and six outlets. Those authors then performed an orthogonal optimization simulation of fan speed, fan incidence angle, and fish scale screen angle using the improved cleaning device. The influence law of various factors on the airflow field was analyzed, and the optimal parameter combination was obtained to improve the performance of the cleaning device even further. Using the cleaning device of a small-scale semi-feeding wheat combine harvester in intercropping mode as the research object, Zhang et al. [17] took the cleaning and loss rates as evaluation indices, and the feeding speed, suction pressure, cylinder height, and angle of the lower cone as test factors in an orthogonal simulation of the cleaning process. In this way, the optimal cleaning parameter combination was identified. Furthermore, a field test validated the simulation optimization results in order to improve the cleaning performance of a wheat combine harvester in intercropping mode. Using the test-bed of a cyclone separation and cleaning system with double threshers and taking wheat as the test object, the rotation speed of the first-stage thresher, second-stage thresher, and suction fan as test factors, and cleaning rate as the test index, Shi et al. [18,19,20] performed orthogonal and regression tests to optimize the parameters, providing a basis for the design of a portable grain chopper cleaning system. Using the cyclone separation system of the double thresher within a micro grain combine harvester as the research object, the rotation speed of the two-stage thresher and the suction fan as test factors, and the grain cleaning rate, cleaning loss rate, and grain crushing rate as test indexes, a cleaning performance regression test was performed and the motion parameters for the cleaning system were optimized; this research serves as an experimental foundation for the parameter design of cleaning systems for micro-grain combine harvesters. As a result of that research, a composite device was developed for conveying, separating, and cleaning grain effluent; the optimal parameters of this device were obtained through indoor tests, and its cleaning capacity was improved. Using orthogonal tests, general rotation combination tests, and a novel design, Ni et al. [21] reported the optimum combination of structural parameters and motion parameters of each part of the cyclone separation and cleaning system without a guide vane in the separation cylinder. The results revealed improved cleaning performance of the micro wheat combine harvester. Liu et al. [22] selected the main parameters that affect the cleaning performance index using a self-made cleaning system test-bed with the upper cone angle of the separation cylinder, the height of the cylinder, the number of guide vanes, the speed of the suction fan, and the speed of the thresher as design variables. The optimal combination of parameters and performance were obtained through orthogonal tests, a second general rotation combination test, and a novel design, which serves as a further foundation for the design of cleaning systems for micro wheat combine harvesters.
In spite of the aforementioned studies, research on the optimization of wheat harvester cleaning parameters and their impact on cleaning quality is still insufficient. The cleaning parameters studied are few and incomplete, resulting in inaccurate and untimely cleaning parameter adjustments during wheat combine harvester field operation. Wheat machine cleaning is often inefficient; it restricts the cleaning operation level of the combine harvester and limits the annual wheat crop output.
In light of these issues, this paper takes all five adjustable parameters (operation speed, chaffer opening, throttle opening, fan speed, and shale shaker crank speed) that affect the cleaning quality of wheat combine harvesters as cleaning parameters, takes cleaning loss rate and impurity rate as cleaning quality evaluation indicators, and uses Design Expert software to complete the response surface experiment design. A bench test of the optimized wheat harvester cleaning parameters was completed using a self-made 4 L-2.5 threshing and cleaning test bed. The contribution rate and response effect of the five cleaning parameters relative to the two cleaning quality evaluation indexes were analyzed using the contribution rate and response surface methods, and the hierarchy of wheat mechanical cleaning parameters was obtained. The present research is an expansion and improvement of previous research on the optimization of existing wheat machine cleaning parameters and their influence on cleaning quality. The research findings can be used to guide the setting and adjustment of cleaning parameters during the field operation of wheat combine harvesters, as well as to provide a theoretical foundation for the research and development of future wheat combine harvester adaptive cleaning systems.
2. Materials and Methods
2.1. 4 L-2.5 Threshing and Cleaning Experiment Table and Cleaning Device Structure
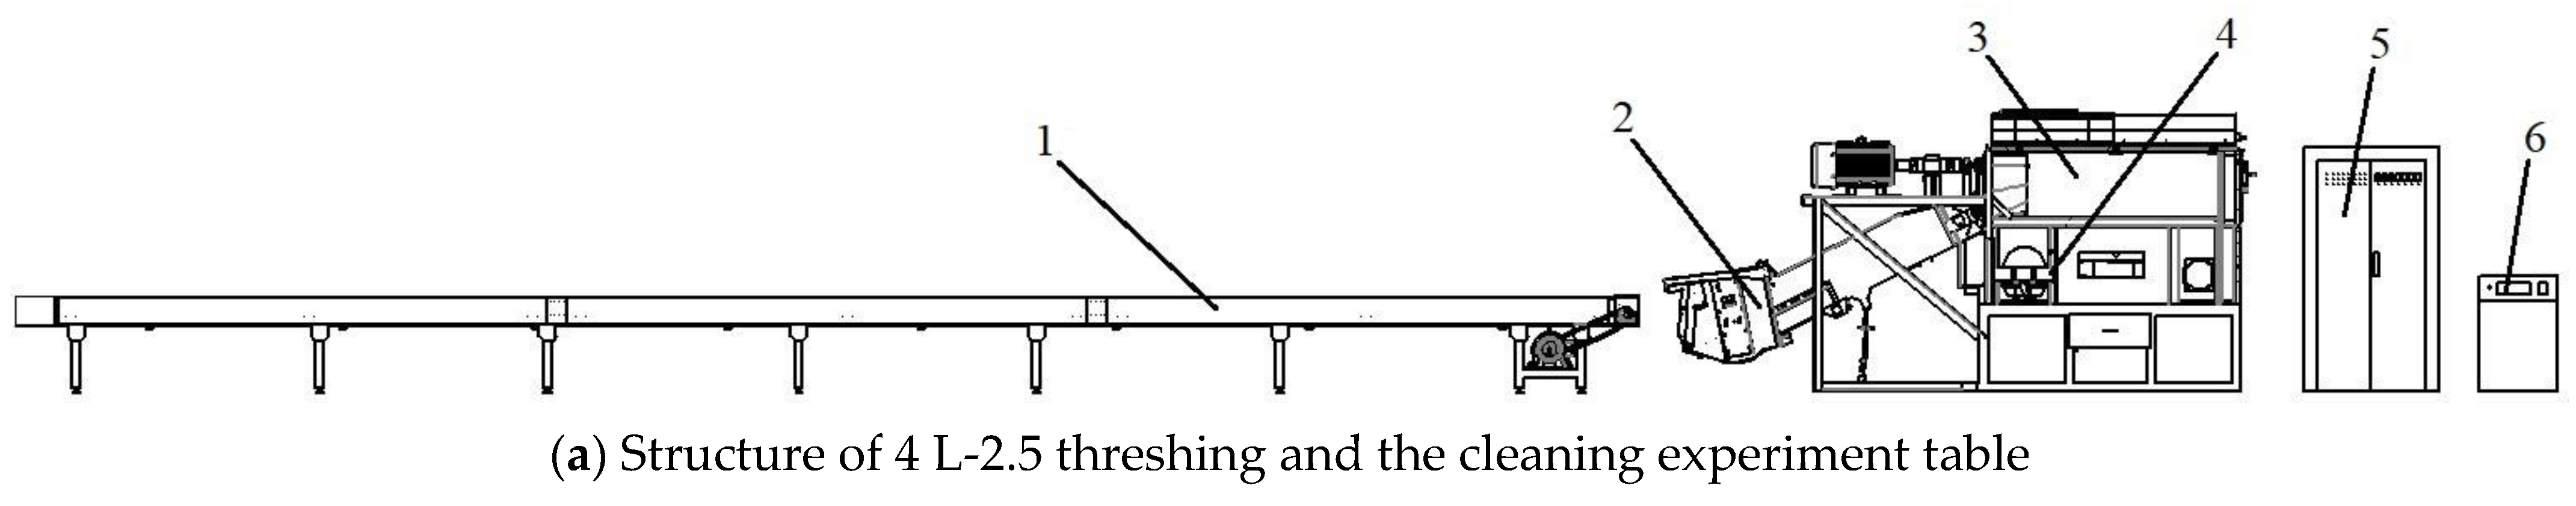
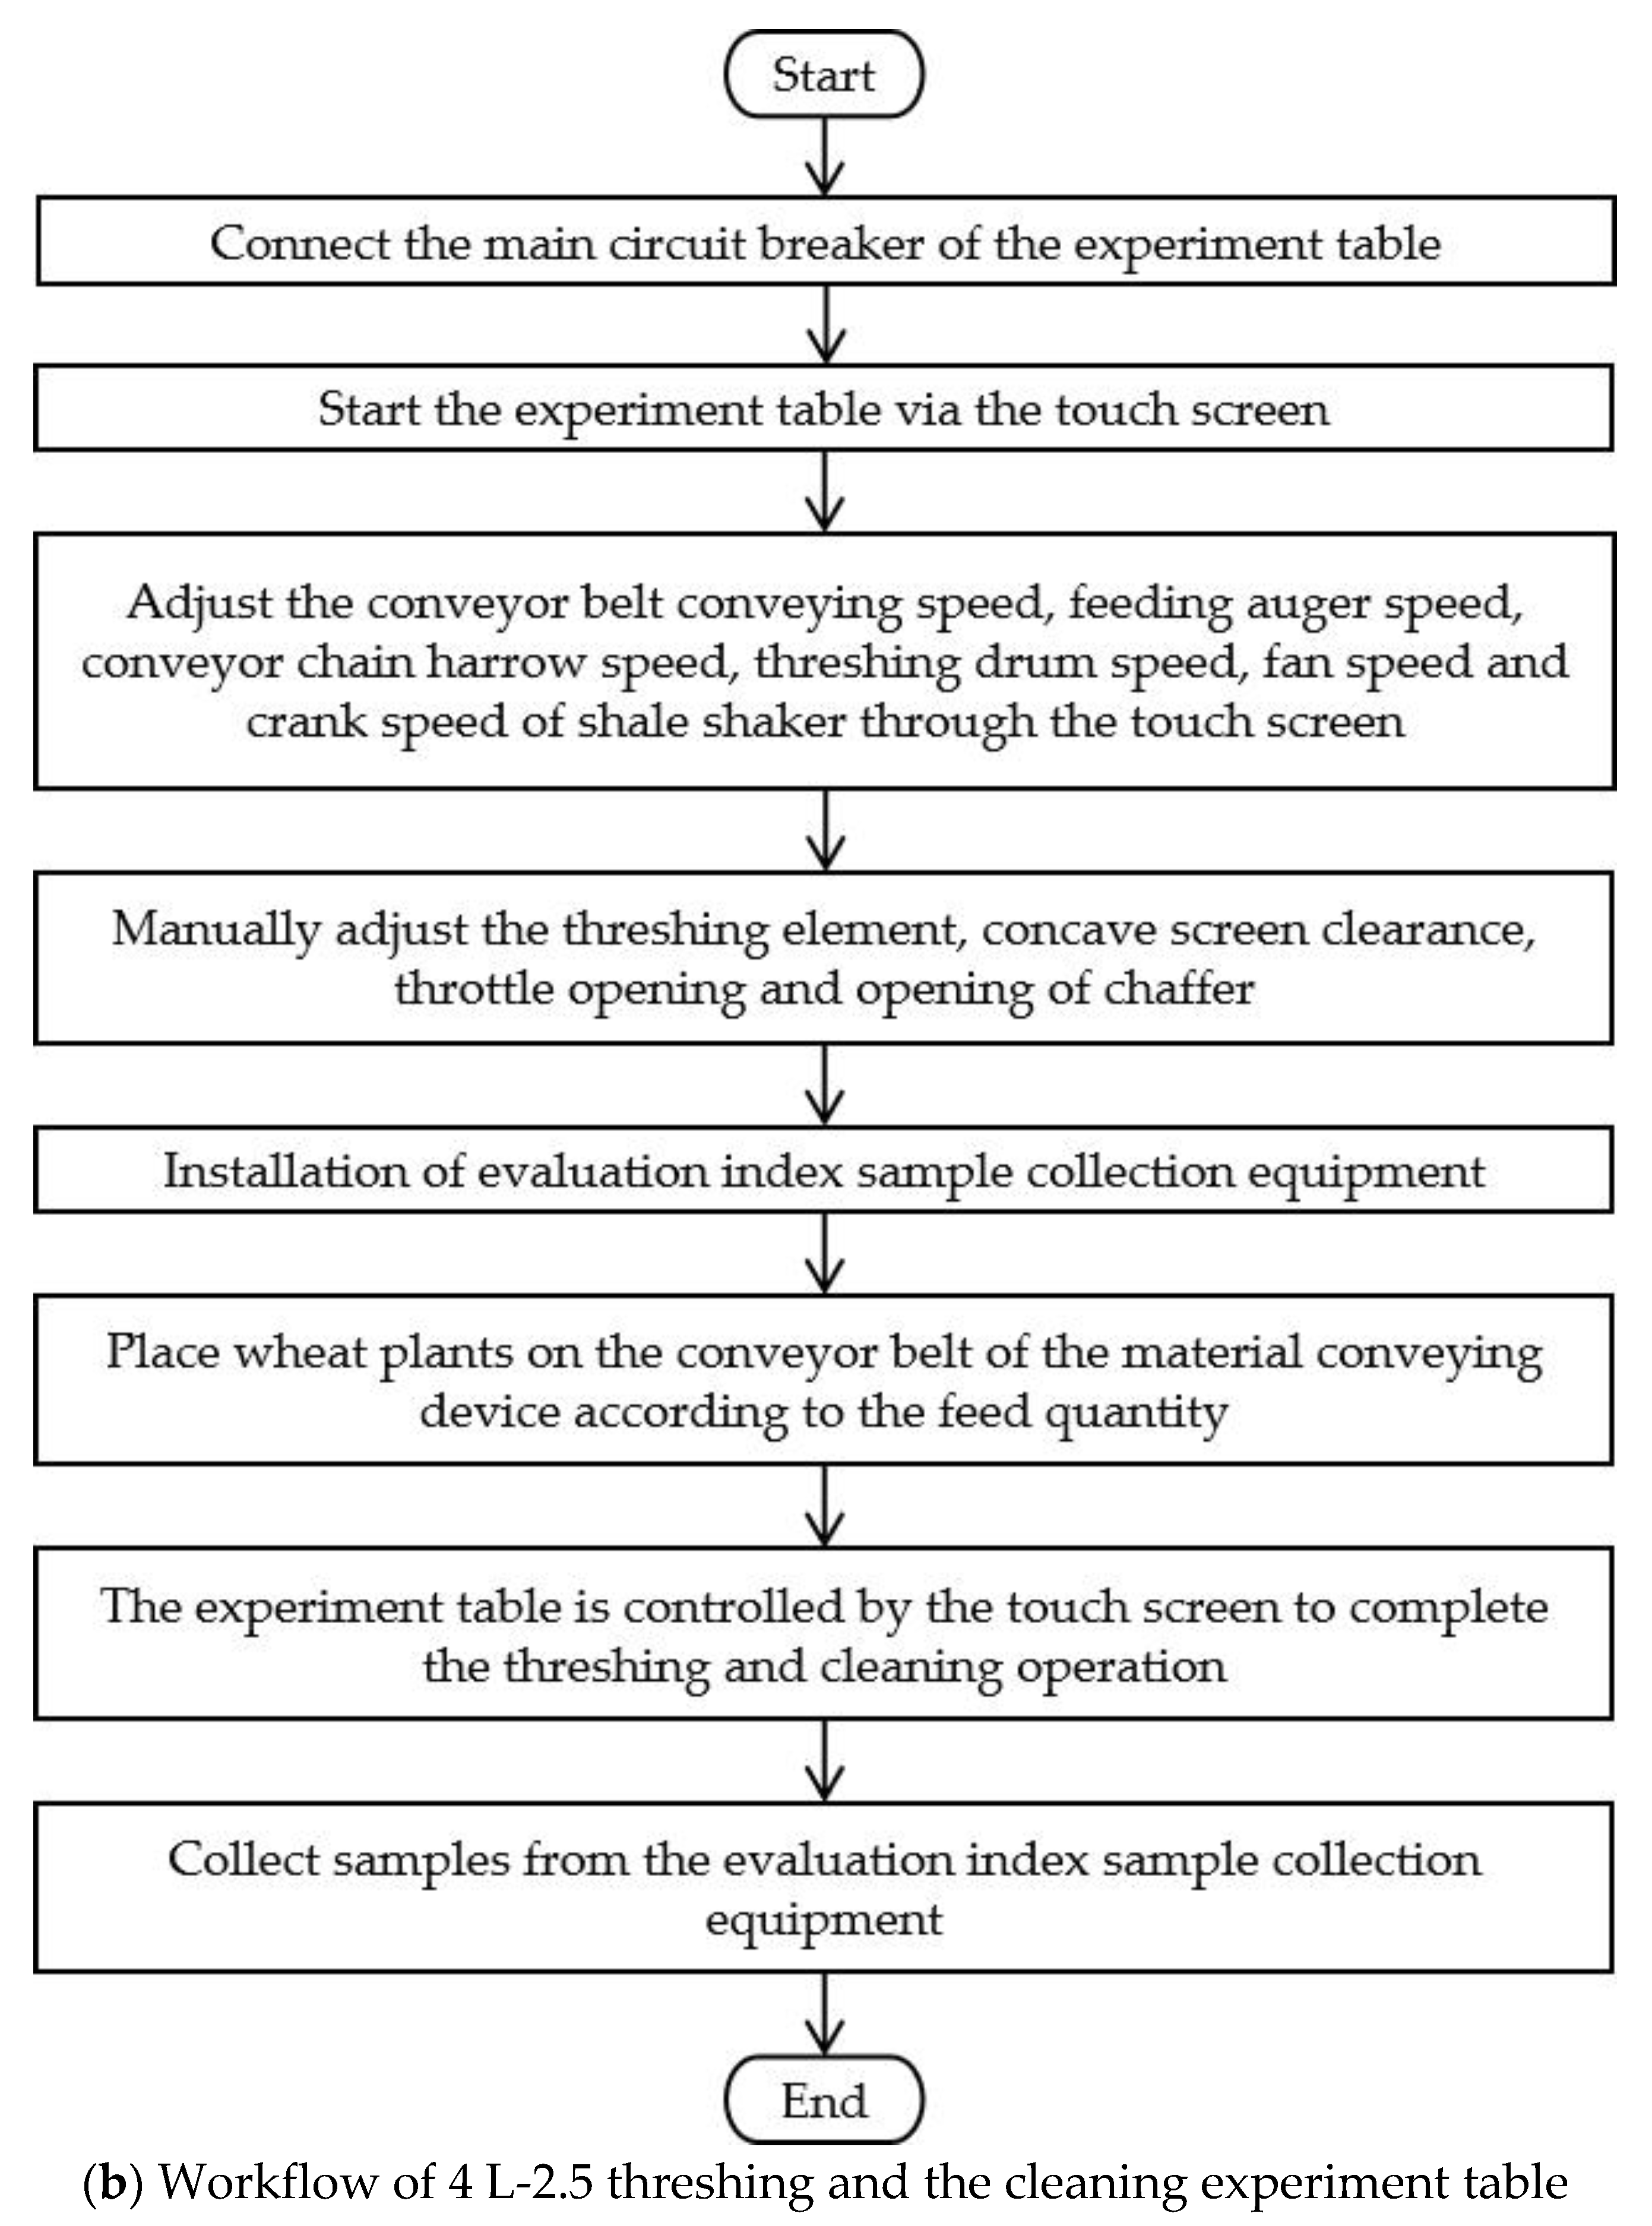
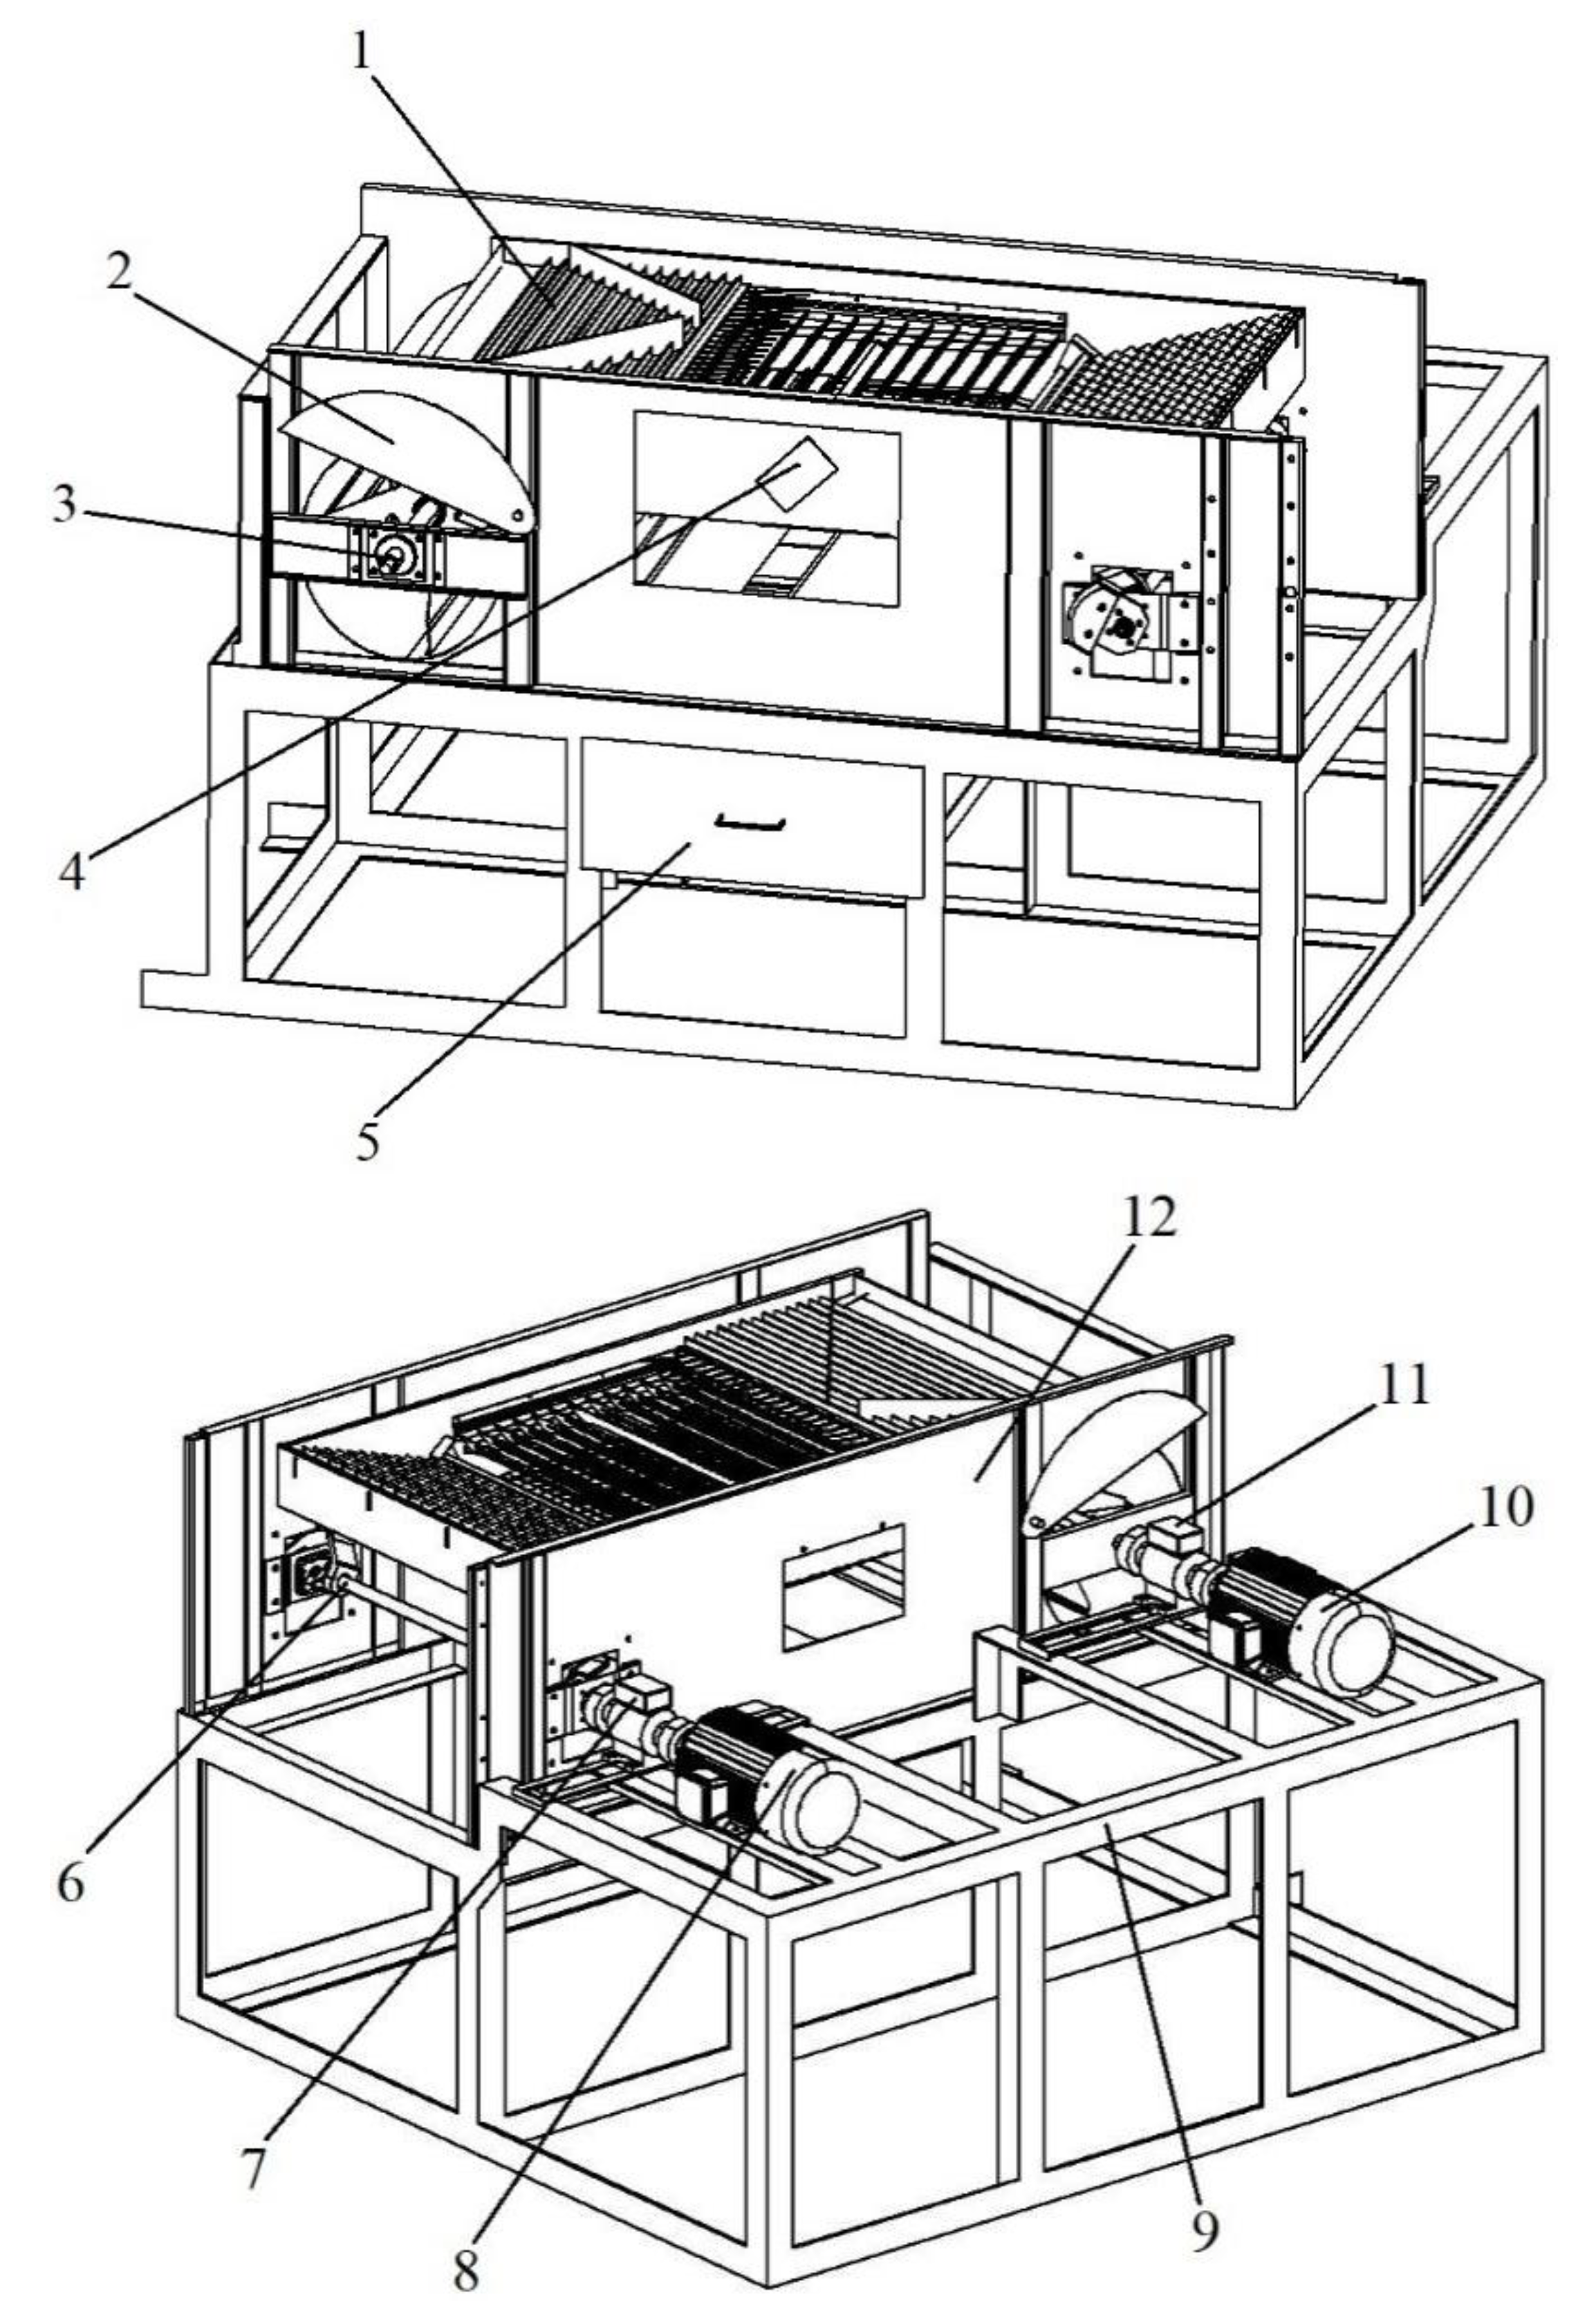
The 4 L-2.5 threshing and cleaning experiment table was composed of a material conveying device, a material feeding device, a threshing device, a cleaning device, a control system, and a touch screen to electronically control of the operation speed, feed auger speed, conveyor chain harrow speed, threshing drum speed, and fan speed. In contrast, the crank speed of the shale shaker opening as well as the opening of the chaffer were adjusted manually. Figure 1 shows the structure and workflow of the 4 L-2.5 threshing and the cleaning experiment table.
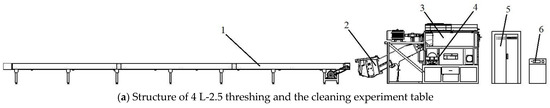
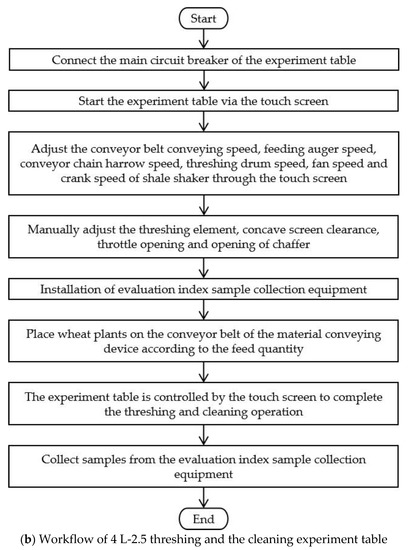
Figure 1.
Structure and workflow of the 4 L-2.5 threshing machine and the cleaning experiment table. 1. Material conveying device. 2. Material feeding device. 3. Threshing device. 4. Cleaning device. 5. Control system. 6. Touch screen.
The cleaning device consisted of a shale shaker, throttle opening adjusting plate, screen opening adjusting plate, sampling box, crank connecting rod mechanism, crank torque sensor, crank motor, fan motor, fan torque sensor, fan, and a frame and subframe. The structure is shown in Figure 2.

Figure 2.
4 L-2.5 Threshing and cleaning experiment table. 1. Shale shaker. 2. Throttle opening adjusting plate. 3. Fan. 4. Screen opening adjusting plate. 5. Sampling box. 6. Crank connecting rod mechanism. 7. Crank torque sensor. 8. Crank motor. 9. Subframe. 10. Fan motor. 11. Fan torque sensor. 12. Frame.
2.2. Control Method of Cleaning Parameters
The cleaning parameters affecting cleaning operations are operation speed, fan speed, throttle opening, crank speed of the shale shaker, and the opening of the chaffer. Therefore, this paper studied the optimization of these parameters. To improve the accuracy of the experiment, the five parameters needed to be adjusted with a high degree of precision. Operation speed, fan speed, crank speed of shale shaker, and the other devices were set via a touch screen interface, while throttle opening and the opening of chaffer were adjusted manually. The experiment table was controlled by a touch screen interface. The opening of chaffer X describes the vertical distance between the adjacent parallel screens, and the throttle opening is the relative change angle between the throttle opening regulator and the fan support plate. Figure 3 shows the manual adjustment mechanism of the cleaning device.
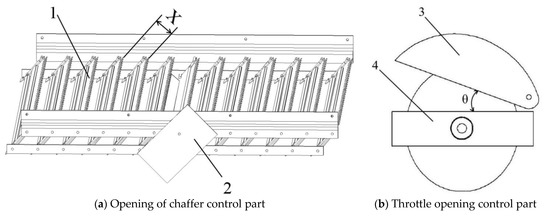
Figure 3.
Manual control of cleaning parameters. 1. Chaffer sieve. 2. Screen opening adjusting plate. 3. Throttle opening regulator. 4. Fan support plate. X. Opening of chaffer. θ. Throttle opening.
2.3. Experiment Parameters
The collection of 1 m2 wheat plant samples and the measurements of parameters were completed at the Hedong wheat experimental base, Linyi City, Shandong Province, China. Statistics are provided in Table 1.

Table 1.
Wheat characteristics.
The implemented operation parameters were determined in various ways, i.e., by taking measurements on the experiment table, using previous field experiment research and relevant literature, and field wheat harvest practical experience, as shown in Table 2 [23,24,25,26,27,28,29,30,31,32,33,34].
Table 2.
Implemented parameters.
2.4. Experiment Data Calculation Method
We referred to relevant literature to set the calculation equation of the feed quantity, cleaning loss rate, and impurity rate [13,15].
The feed quantity was calculated using Equation (1) as follows:
where Q is the Feed quantity in kg/s; W is wheat plant quantity in kg; T is operation time in seconds; M is 1 m2 wheat plant quantity; B is cut width in meters; L is operation distance in meters, and V is operation speed in m/s.
The cleaning loss rate was calculated using Equation (2) as follows:
where S is the percentage of cleaning loss; S0/(B × L) is 1 m2 loss quality of wheat cleaning in g/m2; S0 is loss quality of wheat cleaning; B × L is the Harvest area in m2; Wsh is the wheat cleaning loss quality of 1 m2 in g/m2; Wch is 1 m2 wheat harvest quality in g/m2; B is the cut width in meters; and L is operation distance in meters.
The impurity rate was calculated using Equation (3) as follows:
where Z is the percentage of impurity; Wz is the quality of impurities in samples containing impurities; and Wzy is the quality of the impurity samples.
2.5. Experiment Design and Data Statistics
The values and ranges of the five cleaning parameters during the routine operation of a wheat combine harvester were selected based on relevant literature and field experience [11,12,13,14,15,16,17,18,19,20,21,22]. During routine operation the values of the five parameters were set to the middle their respective ranges. The codes −1, 0, and 1 represent the low, middle, and high values of the cleaning parameter range, as determined by the conversion function in the Design Expert software. The following is the code-to-actual-value conversion formula, as well as the representative symbols for the five cleaning parameters:
where X represents five cleaning parameters; 1 represents the maximum value for each parameter; 0 represents the middle value; −1 represents the minimum value; A is operation speed in m/s; B is opening of chaffer in mm; C is throttle opening degree; D is the fan speed in r/min; and E is the crank speed of the shale shaker in r/min.
The Design Expert software was applied for the design of five factors and three horizontal response surface experiments. The calculation and analysis of the cleaning loss and the impurity rates were completed using the experiment data calculation method. Table 3 and Table 4 show the statistics for the five cleaning parameter levels and the cleaning loss and impurity rates.
Table 3.
Cleaning parameters.
Table 4.
Experiment data for five factors and three horizontal response surfaces.
2.6. Experiment Process
Experiments were conducted from 1 July 2019, to 9 July 2019 at the Agricultural Machinery Research Office of the School of Agricultural Engineering and Food Science, Shandong University of Technology, China. Before the experiments, it was determined that the quality of the harvested wheat plants was to be 5.4 × 1600 g with to a cutting width of 1.8 m. 5.4 × 1600 g. Plants were evenly distributed at a distance of 2 m or more from the conveyor belt surface to the header, with a sharing area of 3 m × 1.8 m in order to ensure that the feed quantity was consistent.
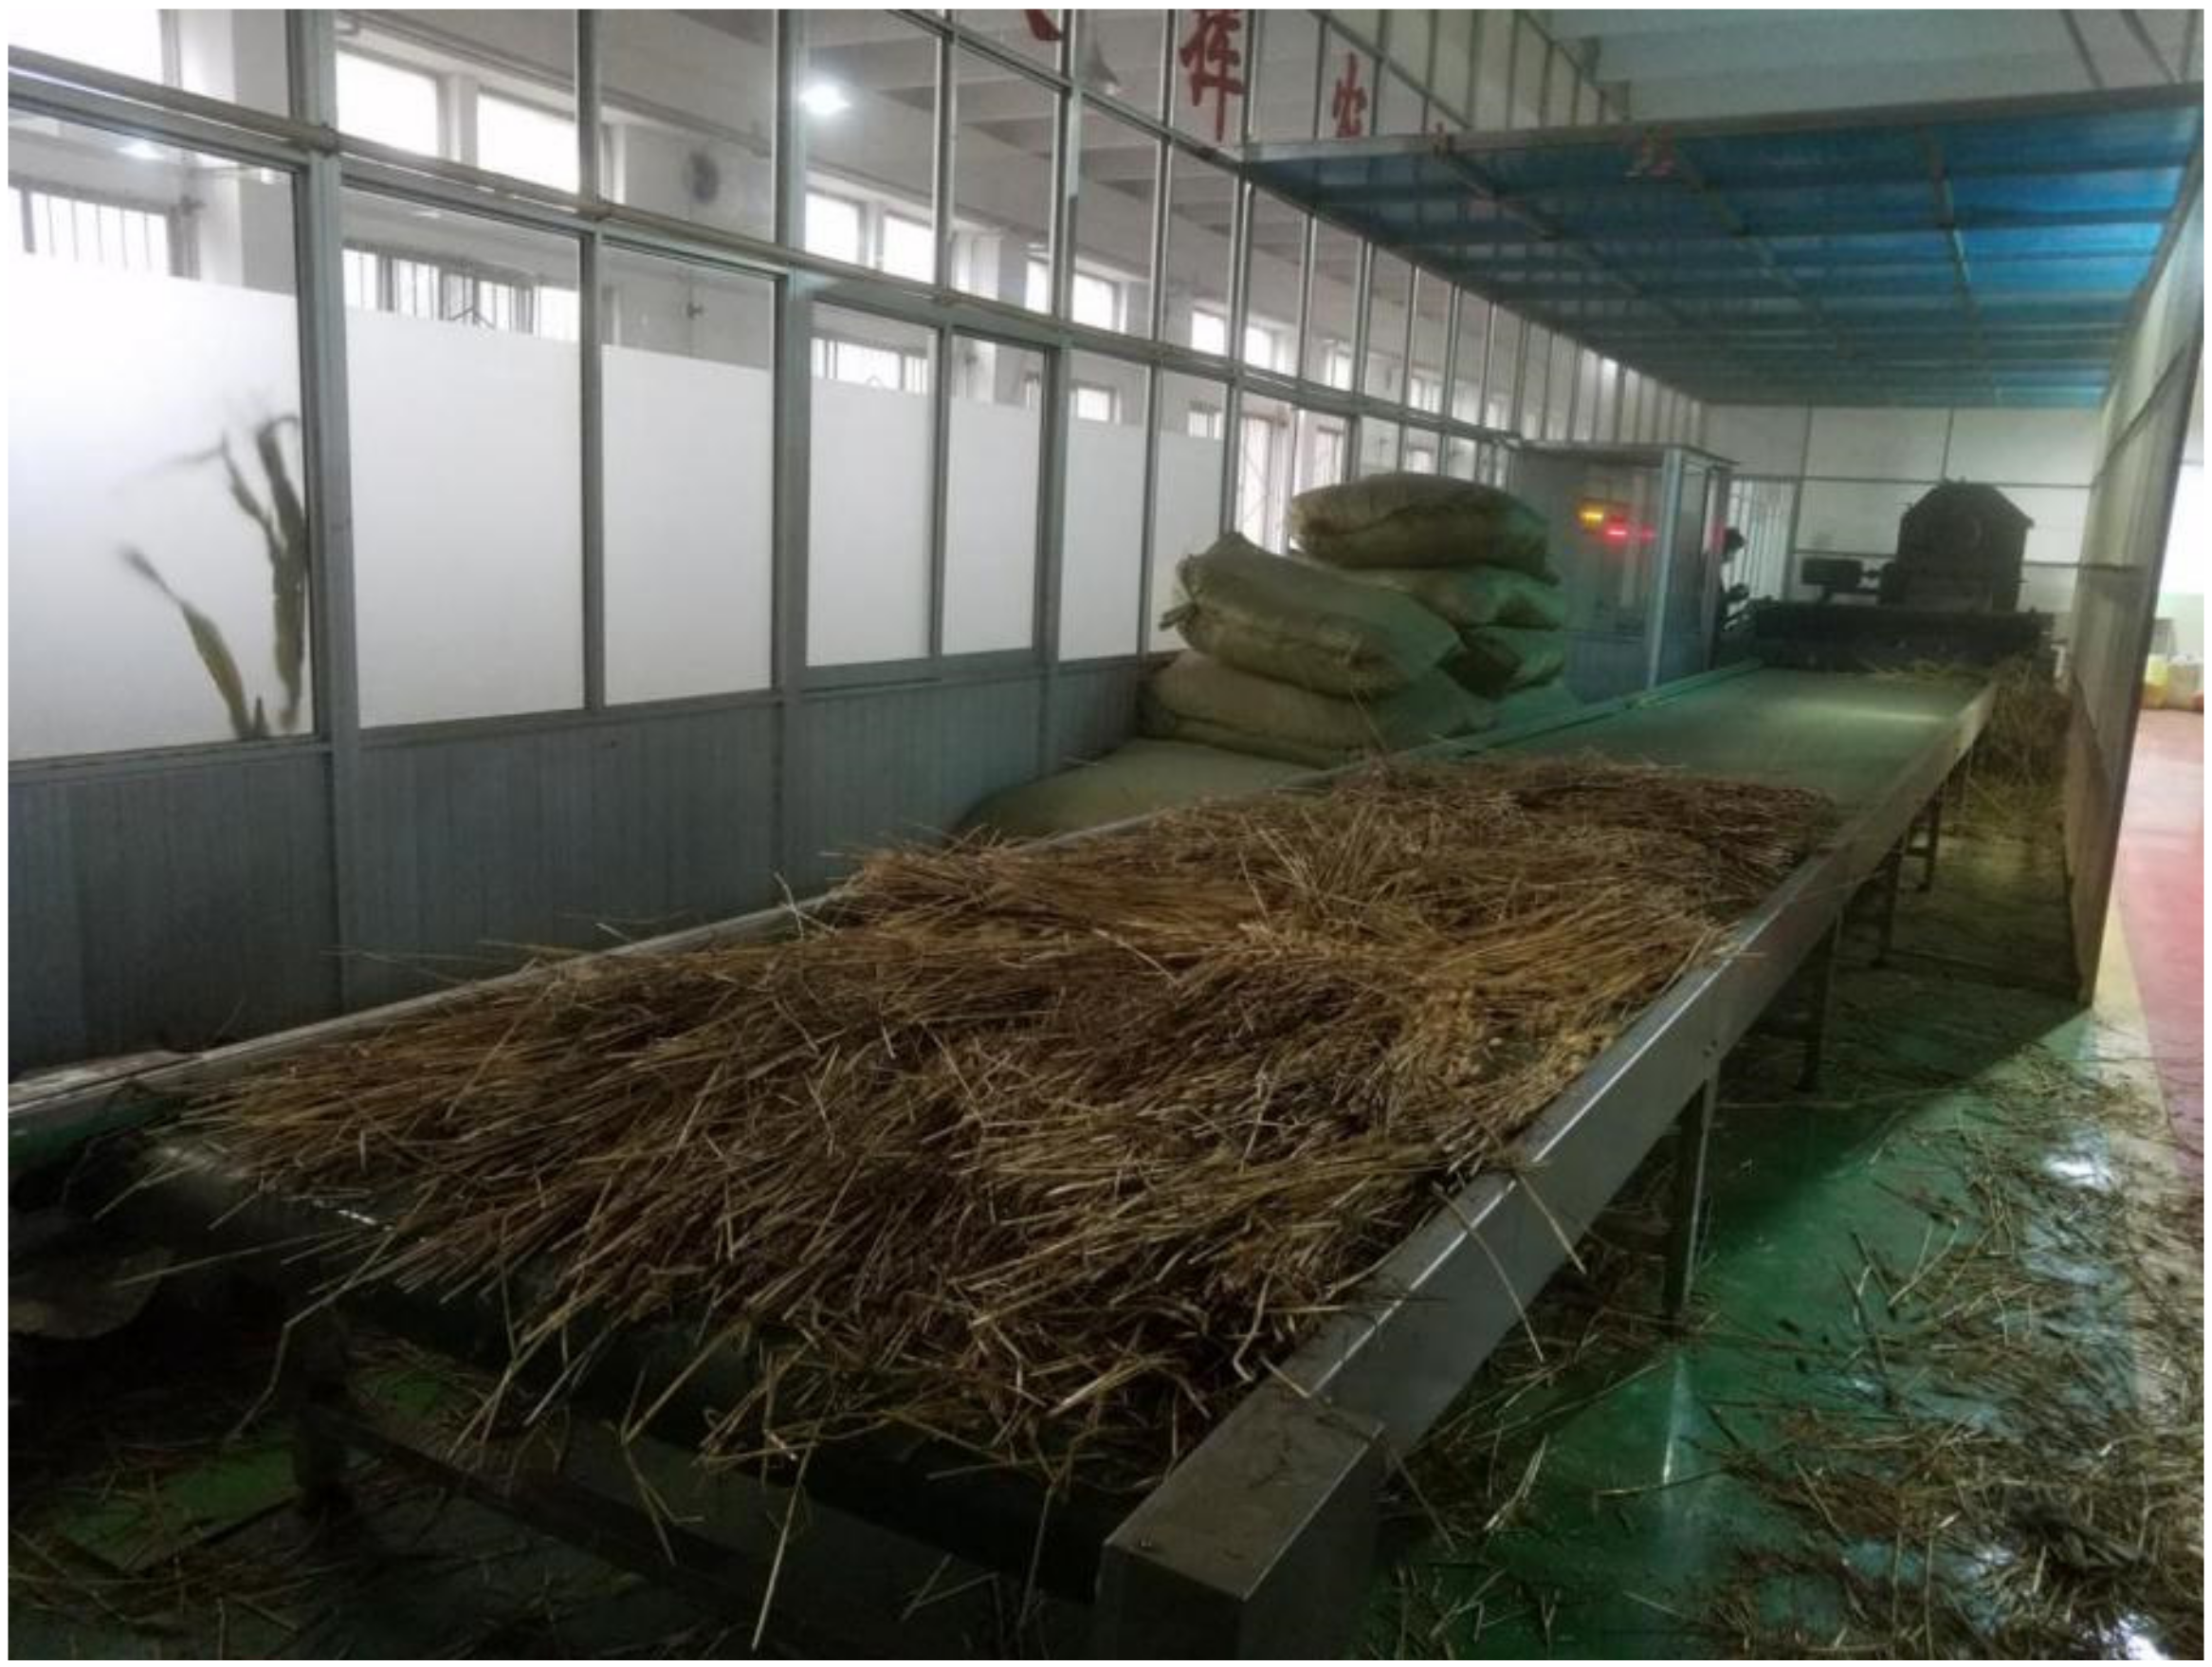
A cleaning loss collection bag was fixed at the outlet of the cleaning room to collect the cleaning loss samples, while a sampling box was used to collect miscellaneous samples at the grain collection auger. The optimization bench experiment and sample processing of the cleaning parameters were performed according to the response surface experiment design table. Then, cleaning loss and impurity quantity and quality data were recorded. The experimental setup is shown in Figure 4.
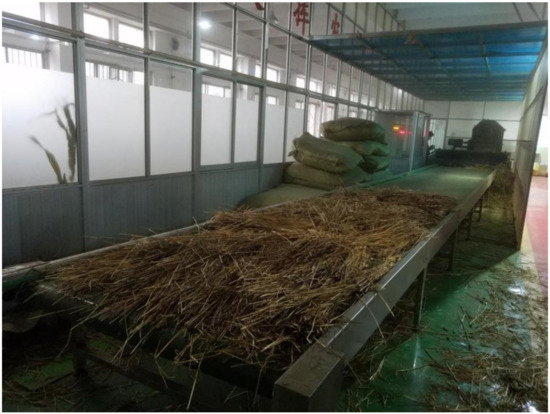
Figure 4.
Experiment table.
3. Results
3.1. Cleaning Loss Rate
3.1.1. Establishment of the Regression Model of Cleaning Loss Rate and Significance Test
According to the experiment results shown in Table 4, a variance analysis of the cleaning loss rate was undertaken; the results are shown in Table 5. The p-value is used to analyze the significance of objects; p ≤ 0.01 implies that the response model is extremely significant, p ≤ 0.05 means that it is relatively significant, and p > 0.05 means that it is insignificant. The regression equation of the cleaning loss rate was as follows:
S = 1.59 + 1.18A − 0.51B + 0.060C + 0.063D + 0.29E − 0.017AB + 0.017AC + 0.000AD + 0.19AE − (2.500E − 003BC) − (5.000E − 003BD) − (2.500E − 003BE) − 0.088CD + (2.500E − 003CE) + (5.000E − 003DE) + 0.065A2 + 0.15B2 + 0.031C2 + 0.035D2 + 0.11E2
Table 5.
Analysis of variance of cleaning loss rate.
From Table 5, it can be seen that the p-value of the cleaning loss rate model was less than 0.01, indicating that the established model was extremely significant. The decision coefficient R2 of the model was 0.9713, indicating that the model reflected a response value change of 97.13%. In the regression model, the p-values of A, B, and E were less than 0.01, while those of AE and B2 were greater than 0.01 but less than 0.05. The p-values of the other items were greater than 0.05.
3.1.2. Contribution of Each Parameter to Cleaning Loss Rate
Contribution rate ∆j reflects the degree of influence of a given parameter on the established regression model; the greater the value of ∆j, the greater the degree of influence. ∆j may be calculated as follows:
where F is the value of variance analysis; δ is the assessment value; Δj is the contribution rate of the first power term of the j-th factor; Δjj is the contribution rate of the second power term of the j factor; and Δij is the contribution rate of interaction between the factor j and other factors.
According to Equations (6) and (7), the contribution of each parameter to the cleaning loss rate was calculated, as shown in Table 6. The hierarchy of the cleaning parameters relative to the cleaning loss rate was as follows: crank speed of shale shaker E > opening of chaffer B > operation speed A > fan speed D > throttle opening C.
Table 6.
Contribution of each parameter to cleaning loss rate.
3.1.3. Analysis of Response of Each Parameter to Cleaning Loss Rate
From the data provided in Table 5 and Table 6, it can be seen that operation speed (A), the opening of chaffer (B), and the crank speed of shale shaker (E) had a greater impact on the cleaning loss rate than throttle opening (C) and fan speed (D). From Figure 5a–d, it can be seen that operation speed (A) had a positive correlation with the cleaning loss rate, and that operation speed A and the crank speed of the shale shaker (E) interacted with the cleaning loss rate, as the former determines the feeding quantity, and a larger feeding quantity leads to an increase in the cleaning quantity of the threshing mixture over time. The cleaning device failed to separate the grains and impurities, increasing the quantity of such materials that was discharged out of the cleaning room. The crank speed of shale shaker (E) determines the rate of separation and the discharge speed of the threshing mixture, and the interaction of these variables increases the cleaning loss rate. Additionally, the opening of chaffer B had a negative correlation and a secondary effect on the cleaning loss rate due to the increase of opening b of the chaffer. As the distance between the adjacent parallel sieves increased, the number of wheat grains passing through the shaker increased proportionally, and the loss of wheat grains was reduced, along with the loss rate due to cleaning. Furthermore, throttle opening C had a positive correlation with the cleaning loss rate, since the former determines the air inlet area of the fan, and increasing this variable increased the air inlet area and volume of the air field in the cleaning room. As the wind force on the threshing mixture increased, the number of grains discharged from the cleaning chamber by the threshing mixture and the cleaning loss rate also increased. Additionally, fan speed D had a positive correlation with the cleaning loss rate, since the former determines the wind speed in the cleaning room. The number of seeds blown out of the cleaning room by the threshing mixture over time increased, and the cleaning loss rate increased accordingly. Finally, the crank speed of the shale shaker (E) had a positive correlation with the cleaning loss rate, because the former determines the frequency of the shale shaker, and as such, with an increase in speed, the frequency of the threshing mixture pushed back and forth by the vibrating screen, the number of grains discharged from the cleaning chamber by the threshing mixture, and the cleaning loss rate increased.
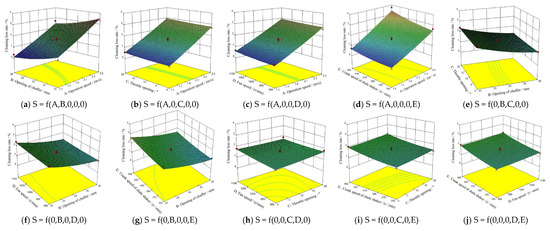
Figure 5.
Response surface analysis of the effect of each parameter on cleaning loss rate.
3.2. Impurity Rate
3.2.1. Establishment of the Regression Model of Impurity Rate and Significance Test
According to the experiment results shown in Table 4, variance analysis was carried out for the impurity rate; the results are shown in Table 7. The regression equation for the impurity rate was as follows:
Z = 2.15 + 1.15A + (9.375E − 003)B − 0.24C − 0.38D − 0.067E + (2.500E − 003)AB − 0.015AC − 0.30AD + 0.038AE + (7.500E − 003)BC − (7.500E − 003)BD + 0.000BE + (1.000E − 002)CD + (2.500E − 003)CE − (2.500E − 003)DE − 0.27A2 − 0.056B2 + 0.028C2 + 0.093D2 − 0.043E2
Table 7.
Analysis of variance according to impurity rate.
From Table 7, it can be seen that the p-value of the impurity rate model was less than 0.01, indicating that the established regression model was extremely significant. Furthermore, the decision coefficient R2 of the model was 0.9783, which implies that the model can reflect a response value change of 97.83%, indicating that the obtained linear regression equation fitting effect was very good. In the regression model, the p-values of A, C, D, AD, and A2 were all less than 0.01, indicating that the influence on the model was very significant. The p-values of the other items were greater than 0.05, indicating insignificant influence.
3.2.2. Contribution of Each Parameter to Impurity Rate
Equations (6) and (7) were used to quantify the contribution of each parameter to the impurity rate, as shown in Table 8. The hierarchy of these parameters was as follows: operation speed A > fan speed D > throttle opening C > crank speed of shale shaker E > opening of chaffer B.
Table 8.
Hierarchy of parameters relative to impurity rate.
3.2.3. Analysis of the Response Effect of Each Parameter to the Impurity Rate
From the data provided in Table 7 and Table 8, it can be seen that operation speed (A), throttle opening (C), and fan speed (D) had greater impacts on the impurity rate than the chaffer (B) and crank speed of shale shaker E. From Figure 6, it can be seen that operation speed (A) had a positive correlation with the impurity rate. The operation speed of A and fan speed D influenced the impurity rate, with the former having a secondary effect, as it determined the feeding quantity, and an increase in feeding quantity leads to an increase in threshing mixture cleaning. The cleaning device was unable to separate the grains and impurities in a timely manner. As such, the number of grains and impurities passing through the vibrating screen increased, and the impurity rate increased accordingly. An increase of fan speed D increased the separation amount in the threshing mixture and the number of impurities blown out while reducing the impurity rate. As also shown in Figure 6, the opening of chaffer B had a positive correlation with the impurity rate, as with an increased distance between the adjacent parallel sieves of the chaffer, the sieve penetration of the threshing mixture increased, and the separation of the grain and the impurity decreased, thereby increasing the impurity rate. Additionally, throttle opening C had a negative correlation with the impurity rate, because this parameter determines the air inlet area of the fan; with a greater air inlet area and air volume of the air field in the cleaning room, the wind force on the threshing mixture, the amount of separation between the threshing mixture and the impurities, and the number of impurities blown out all increase while the impurity rate decreases. Furthermore, fan speed D had a negative correlation with the impurity rate, as increasing the fan speed increased the wind field speed, thereby increasing the amount of separation of the threshing mixture grain and impurity, as well as the amount of impurity blown out, resulting in a decrease in the impurity rate. Finally, the crank speed of shale shaker E had a negative correlation with the impurity rate, as this factor determines the frequency of the shale shaker. With an increase in the crank speed, the frequency and screening rate of the threshing mixture pushed back and forth by the vibrating screen increased, as did the amount of separation of wheat threshing mixture grain and impurities and the number of impurities blown out, thereby reducing the impurity rate.
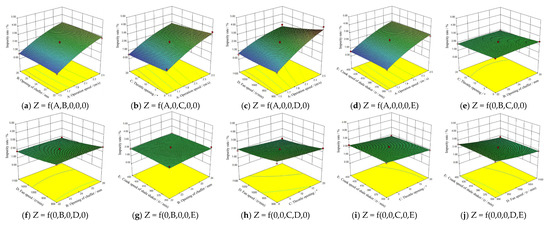
Figure 6.
Response surface analysis of each parameter on impurity rate.
3.3. Optimization and Verification of Cleaning Parameters
3.3.1. Optimization of Cleaning Parameters
It is desirable that the cleaning loss and impurity rates are as low as possible and the operation speed is maximal to achieve the optimum cleaning operation level and the maximum feed quantity. According to the response effect analysis of each parameter relative to cleaning loss rate, it can be seen that to ensure the minimum cleaning loss rate, it is necessary to ensure the maximum opening of the chaffer and the minimum throttle opening, fan speed, operation speed, and crank speed of a shale shaker. To minimize the impurity rate, it is necessary use the minimum operation speed and opening of chaffer and the maximum throttle opening, fan speed and crank speed. To ensure the collection efficiency and undertake an effective cleaning operation of a wheat machine, the feed quantity and the operation speed are required to be at the maximum values. To predict the optimum combination of the cleaning parameters when the cleaning loss and impurity rates were the smallest and the feed quantity was the largest, it was necessary to perform an optimization analysis of five cleaning parameters. To this end, the following model was established:
By using the Design Expert software to optimize the cleaning parameters, it was concluded that the optimum combination of parameters was as follows: operation speed—2.2 m/s; opening of chaffer—26 mm; throttle opening—20°, fan speed—1099.8 r/min; and crank speed of shale shaker—350 r/min. By applying these settings, a cleaning loss rate of 1.5% and an impurity rate of 1.9% were obtained.
3.3.2. Verification of the Optimum Cleaning Parameters
From 1 July 2019, to 9 July 2019, the optimum combination of cleaning parameters was verified in the Agricultural Machinery Research Office of the School of Agricultural Engineering and Food Science, Shandong University of Technology, China. Table 1 shows the wheat characteristic parameters for the wheat plants used in the experiment. Since it was difficult to set the fan and crank speeds of the shale shaker to 1 decimal place, to facilitate the smooth operation of the experiment, the cleaning parameter combination was adjusted as follows: operation speed—2.2 m/s; opening of chaffer—26 mm; throttle opening—20°; fan speed—1100 r/min; and crank speed of shale shaker—350 r/min. Using this combination of parameters, three sets of bench verification experiments were carried out; see Table 2.
The cleaning loss and impurity rates of the three groups of validation experiments were calculated using Equations (2) and (3) and average values of 1.47% and 1.96%, respectively, were calculated, as shown in Table 9. The relative errors between the experimental data and the predicted values were 0.03% and 0.06%, respectively.
Table 9.
Optimum cleaning parameter combination verification experiment data.
4. Discussion
Our bench test and analysis of cleaning parameter optimization of a 4 L-2.5 wheat combine harvester are an extension and improvement on previous research on the optimization of cleaning parameters of wheat combine harvesters and their influence on cleaning quality. To complete the research in this paper, a bench test under closed conditions was used, i.e., excluding the influence of complex working conditions such as weather, environmental conditions, and the driver’s level of experience. Such an approach provides more realistic results than a simulation test. The cleaning parameters investigated included all five adjustable parameters that influence the cleaning quality of wheat combine harvesters. Notably, we investigated how to effectively reduce the loss rate and impurity content of wheat harvester cleaning, as well as how to effectively improve the accuracy and timeliness of cleaning parameter setting and adjustment during field operation.
The cleaning parameters of the six groups of experiments (see Table 4) with test numbers 7, 14, 18, 22, 29, and 38 were the same. These six groups of experiments revealed average cleaning loss and impurity rates of 1.59% and 2.15%, respectively. The cleaning loss and impurity rates obtained using the optimum cleaning parameter combination were reduced by 0.12% and 0.19%, respectively, when compared to the experimental data of the optimum cleaning parameter combination.
The apparatus studied in this paper was an air screen cleaning device, similar to those discussed in the literature [11,12,13,14,15,16]. The cleaning parameters studied in the literature have included shale shaker crank speed and centrifugal fan speed (fan speed) [11], cleaning screen frequency (crank speed of shale shaker), fan wind speed (throttle opening) [12], feed quantity (operation speed), throttle opening, and fan speed [13], feed quantity (operation speed), throttle opening, and fan speed [14], feed quantity (operation speed), throttle opening and fan speed [15], and fan speed and the included angle of the fish scale screen (opening of chaffer) [16]. Given that in each of these papers, only two or three parameters were studied, it may be stated that the optimization of cleaning parameters in this paper and the study of their impact on cleaning quality are more comprehensive.
5. Conclusions
An optimization bench experiment of the cleaning parameters of a wheat combine harvester was completed by using the bench experiment method. The contribution rate method was used to analyze the experimental data, and the influences of operation speed, fan speed, throttle opening, the opening of chaffer, and crank speed of the shale shaker on the cleaning quality were determined. The contribution hierarchy of cleaning parameters relative to cleaning loss rate is as follows: crank speed of shale shaker > opening of chaffer > operation speed > fan speed > throttle opening. Meanwhile, the contribution hierarch of the cleaning parameters relative to impurity rate is as follows: operation speed > fan speed > throttle opening > crank speed of shale shaker > opening of chaffer. The response effects of five cleaning parameters on cleaning loss rate and impurity rate were obtained by analyzing the response surface graph. An optimization model was established, and a response surface data analysis was carried out using Design Expert software. The optimal combination of cleaning parameters (operation speed—2.2 m/s; opening of chaffer—26 mm; throttle opening—20°; fan speed—1100 r/min; and crank speed of shale shaker—350 r/min) was predicted when the cleaning loss and impurity rates were at the minima and the feed quantity was at the maximum. Subsequently, using a 4 L-2.5 threshing and cleaning experiment table, a bench experiment intended to determine the optimum cleaning parameters combination was carried out. The result revealed a cleaning loss rate of 1.47% and an impurity rate of 1.96%. Compared with the evaluation indexes of the cleaning quality of the combine harvester with routine cleaning parameters, the cleaning loss rate was reduced by 0.12% and the impurity rate by 0.19%. The results of this paper provide a theoretical basis for the research and development of a self-adaption cleaning system for wheat combine harvesters.
Author Contributions
Conceptualization, P.L.; methodology, P.L.; formal analysis, P.L.; investigation, P.L.; data curation, P.L.; writing—original draft, P.L.; visualization, P.L.; supervision, X.W.; resources, C.J. All authors have read and agreed to the published version of the manuscript.
Funding
This research was funded by the National Natural Science Foundation of China, grant number 32171911.
Institutional Review Board Statement
Not applicable.
Informed Consent Statement
Not applicable.
Data Availability Statement
Not applicable.
Conflicts of Interest
The authors declare no conflict of interest.
References
- Xu, L.; Li, Y.; Li, Y.; Chai, X.; Qiu, X. Research progress on cleaning technology and device of grain combine harvester. Trans. Chin. Soc. Agric. Mach. 2019, 50, 1–16. [Google Scholar]
- Guo, H.; Jin, C.; Yin, X.; Kang, Y.; Ning, X.; Liu, P. Research status of the cleaning system of the corn combine harvester. J. Chin. Agric. Mech. 2020, 41, 26–36. [Google Scholar]
- He, X.; Chen, X.; Qu, Z.; Lan, M.; Wang, W. Review on application research and development of intelligent technology in the process of wheat harvest. J. Henan Agric. Univ. 2022, 56, 341–354. [Google Scholar]
- Yang, M.; Hu, Z.; Zhang, Y.; Xu, H.; Gu, F.; Wu, F. Research status and prospect of pneumatic cleaning device for agricultural granular materials. J. Chin. Agric. Mech. 2020, 41, 121–127. [Google Scholar] [CrossRef]
- Wu, P. Cleaning technology and adaptability analysis of grain combine harvester. Agric. Mach. Us Main. 2020, 36–37. [Google Scholar]
- Liu, D.; Lu, W.; Wang, X.; Li, X.; Xie, F. Research status and development trend of cyclone separating cleaning unit of combine harvesters. Agric. Equipm. Veh. Eng. 2016, 54, 8–13. [Google Scholar]
- Su, T.; Han, Z.; Cui, J.; Wang, G.; Hao, X.; Hao, F.; Han, K. Research status and development trend of cleaning unit of cereal combine harvesters. J. Agric. Mech. Res. 2016, 38, 6–11. [Google Scholar]
- Liu, P.; Jin, C.; Yin, X.; Ning, X.; Li, Q. Research progress of soybean combine harvester cleaning equipment and key technologies. Acta Agric. Zhejiangensis 2019, 31, 1758–1766. [Google Scholar]
- Liu, P.; Jin, C.; Liu, Z.; Zhang, G.; Cai, Z.; Kang, Y.; Yin, X. Optimization of field cleaning parameters of soybean combine harvester. Trans. Chin. Soc. Agric. Eng. 2020, 36, 35–45. [Google Scholar]
- Ning, X.; Jin, C.; Yin, X.; Liu, P.; Li, Q. Research status and development trend of air-and-screen cleaning device for cereal combine harvesters. J. Chin. Agric. Mech. 2018, 39, 5–10. [Google Scholar]
- Zhong, T.; Hu, Z.; Gu, F.; Cao, M.; Chen, N.; Wang, H. Optimization and experiment for threshing and cleaning parts of 4LZ-1.0 Q cereal combine harvester. Trans. Chin. Soc. Agric. Mach. 2012, 43, 76–81. [Google Scholar]
- Geng, D.; Mu, X.; Zhang, G.; Wang, Z.; Zhu, J.; Xu, H. Analysis and optimization of cleaning mechanism of wheat combine harvester. J. Jilin Univ. (Eng. Technol. Ed.) 2022, 52, 219–230. [Google Scholar]
- Jin, C.; Li, Q.; Ni, Y.; Wang, T.; Yin, X. Experimental study on double air outlet multi-ducts cleaning device of wheat combine harvester. Trans. Chin. Soc. Agric. Eng. 2020, 36, 26–34. [Google Scholar]
- Jin, C.; Li, Q. Test and parameter optimization of regaining and cleaning in multiple-pass cleaning device. J. Jiangsu Univ. (Nat. Sci. Ed.) 2021, 42, 331–338. [Google Scholar]
- Li, Q.; Jin, C.; Teng, Y.; Ning, X.; Liu, P. Experimental optimization of main parameters of multi-channel centrifugal fan with double outlet. J. Agric. Mech. Res. 2021, 43, 190–196. [Google Scholar]
- Tong, S.; Shen, Q.; Tang, N.; Jia, Y.; Cong, F.; Gu, W. Numerical simulation and optimization experiment of mixed flow field on longitudinal axial flow cleaning device. Tran. Chin. Soc. Agric. Mach. 2016, 47, 135–142. [Google Scholar]
- Zhang, K.; Fan, H.; Sun, B.; Chai, Q. The CFD-DEM gas-solid coupling simulation and experimental verification of cleaning device of wheat combine harvester for intercropping system. Agric. Res. Arid. Areas 2019, 37, 268–274. [Google Scholar]
- Shi, Q.; Ma, M.; Yan, W.; Zhou, H.; Yuan, H.; Li, Y. Two-stage winnower cyclone separating cleaning system performance testing and optimization. Trans. Chin. Soc. Agric. Mach. 2014, 45, 124–128. [Google Scholar]
- Shi, Q.; Zhang, X.; Geng, L.; Wang, S.; Lu, X. Experiment of cleaning system of micro grain combine harvester. J. Henan Univ. Sci. Technol. (Nat. Sci.) 2015, 36, 9, 82–86. [Google Scholar]
- Shi, Q.; Xu, Z.; Geng, L.; Wang, S.; Luo, H. Composite device for new grain transportation separation and cleaning. J. Henan Univ. Sci. Technol. (Nat. Sci.) 2017, 38, 7, 61–66. [Google Scholar]
- Ni, C.; Zhang, L.; Liu, S.; Shi, Q.; Gao, C.; Geng, L. Experimental analysis on cyclone separating cleaning system of no-guide vanes. Trans. Chin. Soc. Agric. Eng. 2008, 24, 135–138. [Google Scholar]
- Liu, S.; Zhang, L.; Shi, Q.; Ni, C.; Wang, G.; Geng, L. Experimental research on cyclone separating cleaning system used on micro-combine harvester of wheat. Trans. Chin. Soc. Agric. Mach. 2006, 37, 45–48. [Google Scholar]
- Teng, Y.; Jin, C.; Chen, Y.; Liu, P.; Yin, X.; Wang, T.; Yu, K. Design and optimization of segmented threshing device of combine harvester for rice and wheat. Trans. Chin. Soc. Agric. Eng. 2020, 36, 1–12. [Google Scholar]
- Wang, J.; Wang, D.; Shang, S.; Wang, Y.; Kuai, J. Development and experiment on 4LZZ-1.0 type plot grain combine. Trans. Chin. Soc. Agric. Eng. 2016, 32, 19–25. [Google Scholar]
- Fu, J.; Zhang, Y.; Cheng, C.; Chen, Z.; Tang, X.; Ren, L. Design and experiment of bow tooth of rigid flexible coupling for wheat threshing. J. Jilin Univ. (Eng. Technol. Ed.) 2020, 50, 730–738. [Google Scholar]
- Li, X.; Han, Z.; Dai, F.; Gao, A.; Wei, L. Simulation research on working parameters of threshing device on plot-bred wheat based on EDEM. Agric. Res. Arid. Areas 2016, 34, 292–298. [Google Scholar]
- Zhou, H.; Shi, Q.; Geng, L.; Ma, M.; Yuan, H.; Li, Y. Experiment of wheat supported threshing apparatus based on free-cutting harvest. Trans. Chin. Soc. Agric. Mach. 2013, 44, 31, 52–56. [Google Scholar]
- Li, X.; Lei, Y.; Shi, Q.; Geng, L.; Wang, S. Experiment of double row wheat threshing device without cutting. J. Henan Univ. Sci. Technol. (Nat. Sci.) 2016, 37, 72–77. [Google Scholar]
- Tang, Z.; Li, Y.; Xu, L.; Li, H.; Pang, J. Experiment and evaluating indicators of wheat threshing and separating on test-bed of longitudinal axial-threshing unit. Trans. Chin. Soc. Agric. Eng. 2012, 28, 14–19. [Google Scholar]
- Tang, Z.; Li, Y.; Xu, L.; Pang, J.; Li, H. Experimental study on wheat feed rate of tangential-axial combine harvester. Trans. Chin. Soc. Agric. Eng. 2012, 28, 26–31. [Google Scholar]
- Wei, L.; Dai, F.; Han, Z.; Li, X.; Gao, A. Experiment on plot wheat breeding combine harvester. Acta Agric. Zhejiangensis 2016, 28, 1082–1088. [Google Scholar]
- Zhai, Y. Electrical control circuit optimization on the self-propelled wheat combine harvester. J. Agric. Mech. Res. 2019, 41, 233–237. [Google Scholar]
- Meng, F.; Jiang, M.; Geng, D.; Lin, L.; Xu, H. The design of longitudinal-axial cylinder for the combine. J. Agric. Mech. Res. 2019, 41, 90–94. [Google Scholar]
- Dai, F.; Han, Z.; Zhao, W.; Zhang, F.; Gao, A.; Wei, L. Design and experiment on threshing and separating unit of plot breeding wheat with double longitudinal axial cylinder. Res. Agric. Mod. 2016, 37, 1015–1020. [Google Scholar]


Publisher’s Note: MDPI stays neutral with regard to jurisdictional claims in published maps and institutional affiliations. |
© 2022 by the authors. Licensee MDPI, Basel, Switzerland. This article is an open access article distributed under the terms and conditions of the Creative Commons Attribution (CC BY) license (https://creativecommons.org/licenses/by/4.0/).