Abstract
The traffic sign detection algorithm based on Faster Region-Based Convolutional Neural Network (R-CNN) has been applied to various intelligent-vehicles driving scenarios. However, the model of the current detection algorithm has certain shortcomings, which include the influence of weather and light, the detection of distance traffic signs, and the detection of similar traffic signs. To solve these problems, this paper proposes an improved traffic sign detection method based on Faster R-CNN. First, we propose a fusion method that fuses the feature pyramid into the Faster R-CNN algorithm. This fusion method can extract object features with precision and decrease the influence of weather and light. Second, a deformable convolution (DCN) which can train the algorithm to identify traffic signs with precision and make similar signs more distinguishable, and in particular make it work better with distorted images, is added to the backbone network. Lastly, we apply ROI align to replace the ROI pooling, which can avoid the distant traffic sign detail loss caused by pooling and increase the detection precision of distant traffic signs. The experimental results on both the TT100k dataset and real intelligent vehicle tests demonstrate that the algorithm is superior to the original Faster R-CNN algorithm and four other state-of-the-art methods in traffic sign detection, specifically in small-target traffic sign detection and low-intensity environments such as sunset time and rainy days. Therefore, the proposed method is helpful to improve the traffic sign detection performance in extreme environments (low-light intensity or rainy weather).
1. Introduction
Traffic sign detection technology uses an on-board camera to perform traffic sign image detection in real time and provides accurate traffic sign information to vehicle drivers [1,2]. It ensures the safety of vehicles on the road by properly detecting traffic signs while guiding running vehicles, thereby reducing the number of traffic accidents [3,4]. Therefore, research on traffic sign detection methods is of great significance. Traffic sign detection techniques have received wide attention. A large number of researchers are dedicated to the research and development related to traffic sign detection driving assistance technology. They apply computer science, traditional image fusion, as well as neural network methods for traffic sign detection, and have made various achievements. However, these methods have some shortcomings, such as poor real-time performance and a low accuracy of traffic sign detection [5,6,7,8,9,10]. In the case of actual road conditions, traffic sign detection is a challenging task. The main challenges to be tackled in this regard are as follows: (1) various types of traffic signs with different shapes, colors, and sizes [5,6]; (2) environmental changes such as weather, light, and background interference [7,8]; and (3) camera vibration. Owing to such complex factors, the current traffic sign detection method does not provide satisfactory accuracy and real-time operation [9], thereby making it unsuitable for the development of intelligent vehicles.
Traffic signs are crucial components of road infrastructure and provide key information to drivers [11]. This information is required by drivers to comply with driving safety regulations and to ensure their safety. The inability to accurately detect traffic signs in real time can cause several problems in unmanned driving. Therefore, the robustness, accuracy, and real-time performance of traffic sign detection methods are crucial, and the related research on traffic sign detection warrants more attention. Faster Region-Based Convolutional Neural Network (R-CNN) has a high detection accuracy, making it suitable in the task of traffic sign detection, which requires a high detection accuracy. To further improve the detection accuracy, this study improved the traffic sign detection network based on the Faster R-CNN algorithm. The improved algorithm was verified on the traffic sign dataset, TT100K [12]; it yielded a good detection effect, with an 8% performance improvement.
In this study, the following improvements were made to the Faster R-CNN: (1) feature pyramid fusion was performed for the Faster R-CNN algorithm; (2) ROI pooling was replaced with ROI align; and (3) deformable convolution (DCN) was added to the backbone network.
2. Related Works
Traffic sign detection algorithms can be mainly divided into three categories: algorithms based on (i) color features; (ii) shape features; and (iii) deep learning.
Methods based on color features mainly segment the color feature regions of the image, and then classify them with the classifier. In 2009, Xie et al. [13] used the method of edge information combined with local color change, which can detect traffic signs under different scales and lighting conditions. In 2012, Yi Yang et al. [14] proposed a two-stage algorithm, which first converts the input image into a probabilistic model, extracts the features, and then uses an integral channel feature to eliminate the error. This significantly improves the real-time performance while maintaining the detection accuracy. Although methods based on color features have made certain progress in real-time operation and accuracy, the detection results are easily affected when the visibility of traffic signs is affected by complex conditions such as lighting and rain. Particularly, with faded and damaged traffic signs, the detection effects of the algorithm may be significantly reduced and result in missed and erroneous detection.
Methods based on shape features mainly extract the shape features of the entire image, and then combine them with the classifier to detect the traffic signs. However, their detection speed is extremely low. The Hough transform is frequently used in the detection of traffic signs. It can extract geometric shapes, such as straight lines, from images. However, this method is operation-intensive, thereby yielding an unsatisfactory performance in real-time. In 2005, Garcia [15] used the Hough transform to detect traffic signs under limited conditions in a certain area. Their method reduces the number of operations. In 2013, Boumediene et al. [16] used a traffic signs coding gradient to obtain selected corners; they detected symmetrical lines with corner coding and successfully transformed triangle detection into line segment detection, which significantly reduced the missed detection rate of the algorithm. Although the methods based on shape features are satisfactory to a certain extent, occluded or damaged traffic signs reduce the accuracy and real-time performance of the detection if the method extracts the shape features of traffic signs.
When AlexNet [17], a CNN, won the championship in the ImageNet image detection competition, the excellent performance of the CNN attracted the attention of several researchers who conducted a considerable amount of research on deep learning detection algorithms. Compared with the conventional method, which extracts features manually, the deep learning method is more representative because it automatically learns the features that can reflect the differences of the data through a large amount of data. Moreover, for vision detection, the features hierarchically extracted by the CNN are similar to those extracted by the human vision mechanism, and both executed from an edge, to a part, and to the whole [18]. There are two types of object detection methods based on deep learning—one is based on the candidate region and focuses on the detection accuracy, whereas the other is based on the regression domain and focuses on the detection speed.
The detection method based on the candidate region is also known as two-stage algorithm because the task of image detection is divided into two stages. In this study, the R-CNN [19] series algorithm was selected as the representative of the two-stage algorithm. First, the R-CNN algorithm proposes that the detection process should be divided into two steps. The first step uses the selective search method to extract a region that may contain the target object, and then the classification network is run on these regions (the best AlexNet are selected in the R-CNN at that time) to obtain the category of objects in each region. However, Fast R-CNN [20] optimizes the model to improve its slow detection speed. In this research, it is proposed that the basic network should be transferred into the R-CNN sub-network after it is run on the images as a whole, sharing most of the operations, and thereby significantly improving the detection speed. As a representative algorithm of the current two-stage detection method, Faster R-CNN [21] replaces the selective search algorithm with the region proposal network (RPN) for the detection task to be completed end-to-end by the neural network. The R-CNN algorithm is required to train three models, including candidate region, classification, and regression, which requires extensive computation. The RPN effectively avoids this problem and improves the detection speed of Faster R-CNN.
The detection method based on regression domain is also called one-stage algorithm because the object detection task involves a single step. The one-stage algorithm obtains the predictive results directly from the images, thereby eliminating the detection process of the intermediate candidate regions. The YOLO algorithm converts the detection task into a complete end-to-end regression problem, and the classification as well as the location of the target object can be simultaneously obtained after processing the images only once [22]. SSD (single-shot object detector) [23] is a typical method based on candidate regions. In SSD, a method of multi-scale feature map extraction is proposed to improve the detection effect of the algorithm for the problems of small-size targets. For instance, the author of YOLO drew lessons from some ideas of SSD and proposed various methods for improving YOLO in YOLOv2 [22]. To improve the low accuracy of small-target detection, YOLOv3 was proposed [24] based on YOLOv2. The proposed multi-scale network structure further improved the detection ability of the network algorithm for small target objects. Moreover, YOLOv3 was improved based on the feature extraction network of Darknet-19, which deepens the original network by drawing lessons from the idea of residual network, ResNet [25]. A novel feature extraction network, Darknet-53 [26], which significantly improves the detection accuracy and can maintain excellent detection speed, was proposed. YOLOv5 is the state-of-the-art technology based on the YOLO series, which was published in 2020 [27]. The experimental results indicate that YOLOv5 outperformed the previous model. YOLOv5 obtained a 4.30% increment of detection accuracy. In this paper, we also conduct the compared experiments by using the YOLO series method and SDD.
In [28], the authors apply guided image filtering to each query image and then remove the fog and haze of the scenarios. Furthermore, the query image is input to CNN for traffic model training. Similarly, traffic sign recognition (TSR) is mainly used to detect the shape and color of traffic signs [29]. The traffic signs classification is also recognized by the shape and color. Some methods improve the detection accuracy by improving some key points of the classical method. For example, ROI pooling is at the core of CNN-based sign detection [30]. However, ROI pooling suffers from the detail loss and decrease in the detection accuracy. To solve this problem, He Kaiwen et al., in 2017, proposed the mask R-CNN [31] algorithm. In this algorithm, He Kaiwen proposed the ROI align method, which adopted the bilinear interpolation method to preserve the floating point number and improve the detection accuracy of the network. After analyzing the limitations of ROI pooling and the solution of ROI align, this study uses ROI align to replace the ROI pooling module in the Faster R-CNN, thereby avoiding the quantization loss in the original ROI pooling module and improving the detection accuracy of traffic signs in the network. Similarly, Zhu et al. made use of YOLOv5 to detect traffic signs., and concluded that it may perform better than SSD by using the traffic sign recognition (TSR) dataset [32].
From the literature revised above, we can summarize that the main problems in the research and application of the traffic signs detection algorithm are as follows [13,14,15,16,17,18,19,20,21,22,23,24,25,26,27,28,29,30,31,32].
- (1)
- Owing to the influence of weather and light, the image quality collected by the on-board industrial camera is non-uniform and the environment of various road sections is changeable. Therefore, the detection algorithm is required to be highly robust.
- (2)
- Different types of traffic signs can have similar characteristics. Additionally, in the case of vehicles on highways, the collected images are blurred and distorted, which makes detection difficult.
- (3)
- Although the detection model can extract effective features for smaller traffic sign targets located at a distance, a loss of some detailed information after the multi-layer feature extraction of the network is experienced, which leads to missed and erroneous detection of the model for small-target objects.
Based on these current problems, this paper may improve the Faster R-CNN model and solve these problems. The contributions of this paper are summarized as follows:
- (1)
- Considering the influence of weather and light, we propose a fusion method that fuses the feature pyramid into the Faster R-CNN algorithm. The advantage is that the method can extract object features with precision and the use of the feature pyramid can decrease the influence of weather and light.
- (2)
- To solve the problems of similar characteristics and distorted images, we add the DCN to the backbone network. The advantage of adding the DCN is that the method can train the algorithm to identify traffic signs with precision and make similar signs more distinguishable, and in particular make it work better with distorted images.
- (3)
- To more precisely detect the traffic signs located at a distance, we apply ROI align to replace the ROI pooling. The advantage of using ROI align is that this method can avoid the distant traffic sign detail loss caused by pooling, which can increase the detection precision of distant traffic signs.
3. Methodology
3.1. Introduction to the Faster R-CNN Model
The detection method based on a candidate region is also called two-stage target detection algorithm, and the detection process is divided into two steps. The R-CNN algorithm is a representative of the two-stage algorithm. Subsequently, several target detection algorithms based on R-CNN, such as Fast R-CNN and Faster R-CNN, were developed.
- (1)
- R-CNN
R-CNN is the initial generation algorithm of the R-CNN series, which first uses the deep learning method in the target detection field. The detection process of R-CNN can be mainly divided into two steps: generating candidate regions and extracting image features of the candidate regions for classification and regression.
The functioning of the R-CNN algorithm is as follows. First, to search the region using the selective search method, this method significantly reduces the process of calculation and determines the target from the image area. The number of candidate regions compared with the traditional sliding window method is significantly reduced. Approximately 2000 detection windows are extracted. Thereafter, all the candidate areas are unified into a fixed size (227 × 227). Thereafter, the feature information of the candidate regions is extracted by the CNN. Finally, a support vector machine (SVM) is used for classification, and a linear regression model is used to fine-tune the bounding box.
Each image is trained for approximately 2000 times in the R-CNN. Such an operation is computation intensive. Moreover, the window to be inspected must be clipped and scaled to achieve a uniform size, which results in a poor detection effect.
- (2)
- Fast R-CNN
Fast R-CNN combines classification and regression to achieve end-to-end training. Generally, its biggest improvement when compared with R-CNN is that it abandons multiple SVM classifiers and bounding box regressors to output coordinates and categories together, which significantly improves the speed of the original RCNN.
Fast R-CNN is optimized based on the R-CNN. The algorithm of the Fast R-CNN is as follows. First, an image is input, and the region of interest is generated using the CNN. Then, ROI pooling is used to adjust the size of the ROI and input it to the fully connected network. Finally, Softmax is used to output the category of the object, and a linear regression layer is used to output the bounding box.
- (3)
- Faster R-CNN
Compared with the selective search method of the R-CNN and Fast R-CNN for generating candidate regions, the Faster R-CNN first uses an RPN to generate candidate regions and then classifies the candidate regions, which is the so-called two-stage process. The RPN is placed behind the CNN layer, and the method realizes the fusion of feature extraction and detection frame generation, thereby significantly improving the comprehensive performance. The Faster R-CNN mainly comprises the following four modules: feature extraction network, region generation module, ROI pooling module, and classification module. The Faster R-CNN follows the practice of the R-CNN series. First, the ROI of the region of interest is generated, the generated region is classified, and finally, the task of target detection is realized.
The algorithm of the Faster R-CNN is as follows. First, images are input and the feature vectors are generated using the CNN. Subsequently, the RPN is applied to the feature map to obtain the candidate regions and fractions and return them. The Faster R-CNN uses a ROI pooling module to standardize all candidate areas to the same size. Finally, the candidate region is passed to the full connection layer, and the bounding box of the object is the output.
3.2. Feature Extraction Network
The large number of parameters of the CNN makes their adjustment difficult. Therefore, some widely used feature extraction networks are generally selected before training. The feature extraction network uses the CNN to extract the features of images. The generated feature images are sent to the RPN module, and then the candidate regions of the target are generated. Thereafter, the target position regression and classification are performed. Therefore, the feature extraction network is the basis of everything, and it is crucial for the performance of the network. VGG16 is the feature extraction network in the original Faster R-CNN algorithm [33], which cannot effectively extract the deep feature information of traffic signs due to its shallow layer number while extracting the features from the input images. To extract the deep features of traffic signs, Resnet50 is used as the feature extraction network in this study.
To improve the feature extraction ability of the network, it is necessary to deepen the network layers. However, deepening the network layers makes it more difficult to optimize the gradient descent algorithm. It leads to failure in improving the accuracy rate and decreases the learning efficiency. The problem wherein the network detection effect deteriorates after deepening is called the “degradation problem”. To solve this problem, He Kaiming proposed the ResNet structure. ResNet50 uses residual structure to extract deeper image features. Let network inputs x and H(x) be the characteristics that can be learned when the network is in the ideal state. Adding the convolutional layer to fit H(x) leads to poor results. He Keming et al. added residual unit F(x) to ResNet to fit H(x) with the hope that ResNet can learn that residual F(x) = H(x) − x. Therefore, the characteristic that we learned in the original ideal state is F(x) + x. When F(x) is 0, the network no longer goes down because it only performs identity mapping. ResNet solves the problem of gradient disappearance when the CNN is very deep by using the residual module. The residual structure is depicted in Figure 1.
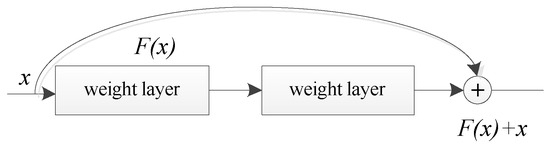
Figure 1.
Residual structure.
3.3. Region Proposal Network
The Faster R-CNN uses an RPN to generate candidate regions instead of the selective search algorithm of the R-CNN. The region generation network improves the accuracy of the candidate box. The workflow of the zone generation network is as follows.
- (1)
- An image is input into the network to obtain the feature map. A sliding window is used to slide on the feature map, and then the candidate regions are predicted in the corresponding position of the sliding window.
- (2)
- Finally, the prediction results are input to the next layer of the full connection layer for classification and regression operation.
The sliding window traverses the feature map, and K candidate regions are predicted at the corresponding positions of the sliding window. Thereafter, the candidate regions are parameterized to obtain K anchor frames. To determine whether the category of the anchor frame is the foreground or the background target, the cross-entropy loss function is used to classify the anchor frame and judge the probability of the foreground and background target of the anchor frame, which has 2000 outputs. Moreover, the position information of the anchor frame includes the coordinates, width, and height of the center point. Through this series of operations, the classification results and coordinate information of the region of interest are obtained. The structure of the RPN is depicted in Figure 2.
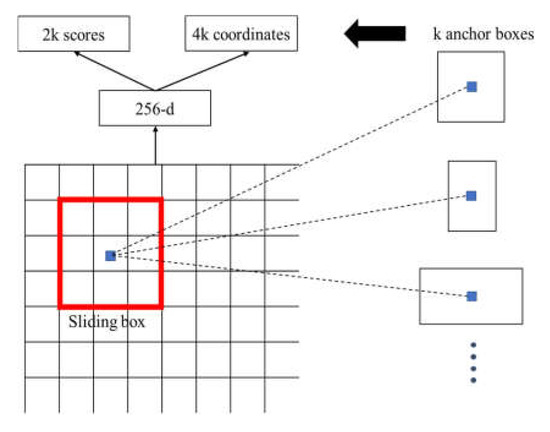
Figure 2.
RPN structure.
3.4. ROI Pooling
The ROI pooling module has two functions: (1) obtaining the feature vector on the candidate area of the feature image corresponding to the original image and (2) unifying the size of the feature vectors of the candidate regions.
The flow of the ROI pooling is as follows. The candidate areas are obtained by an area generation network, and the candidate areas obtained by ROI pooling are mapped to the feature map. The mapping operation refers to SPP-NET [34], and the mapping equation is given by Equation (1). Subsequently, the feature map of the candidate area is divided into small blocks of the same size, and the output dimension is equal to the number of small blocks. Finally, the maximum pooling operation is conducted for each small block, which enables candidate regions with different sizes to be transformed into eigenvectors of the same size.
where x, y is the position of the candidate region on the original graph, x′, y′ is the position of the corresponding candidate region on the feature graph, and S is the product of the step size of all the convolutional layers in the CNN and the pooling layer.
4. Model Optimization
4.1. Feature Pyramid
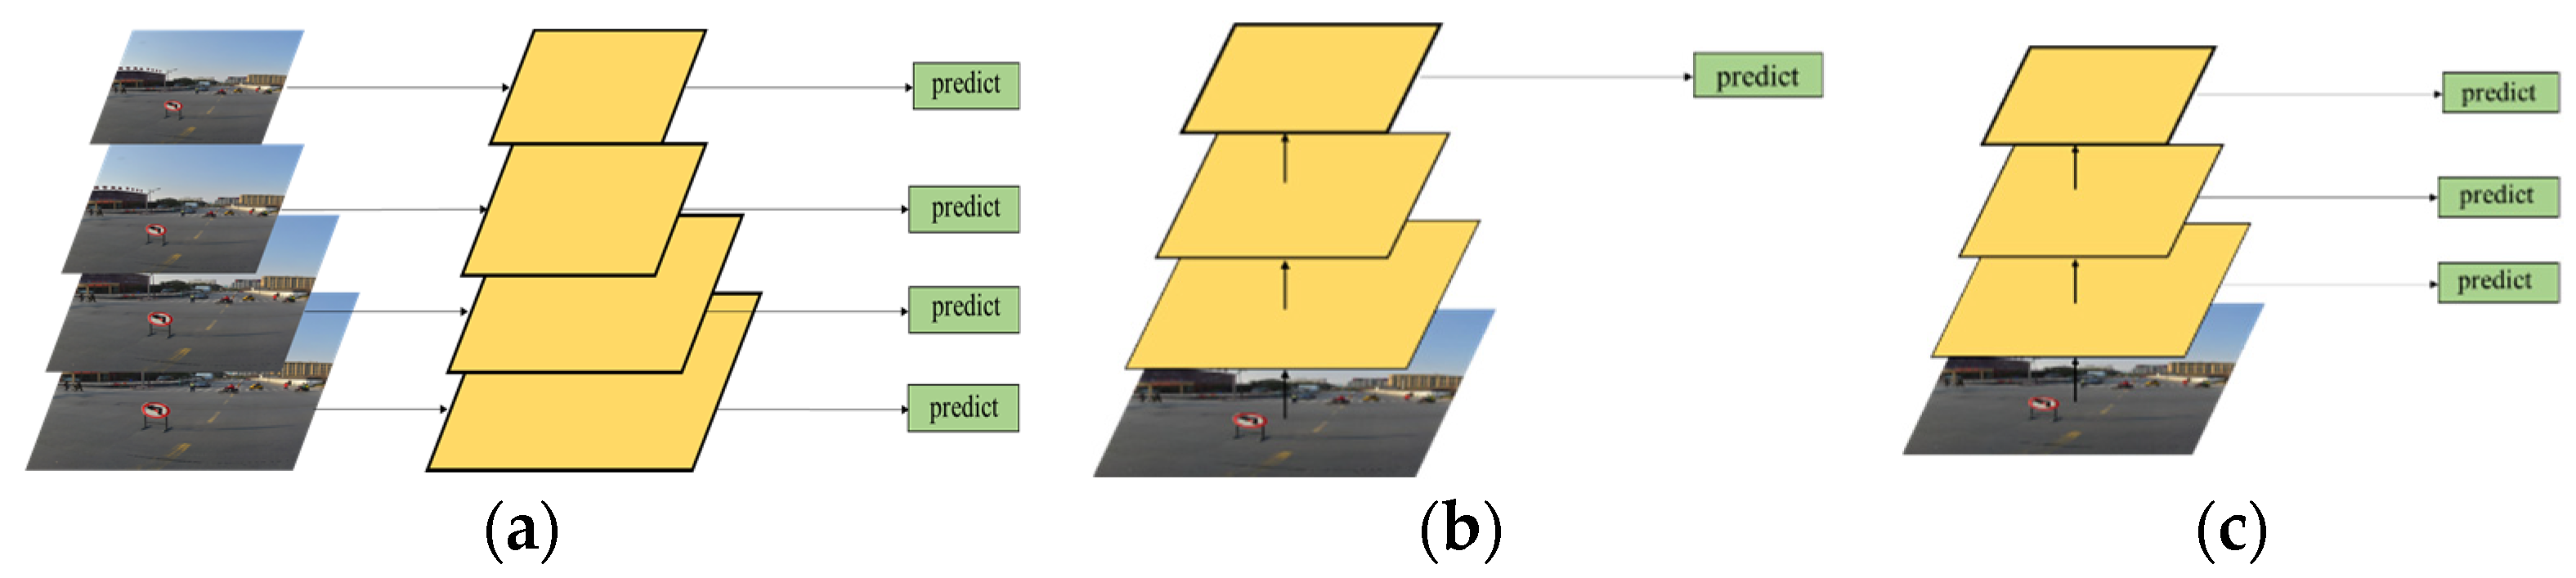
The Faster-RCNN structure adopted in this study can improve the overall detection accuracy of the network. However, the detection effect is not significantly improved for small targets and special tasks, such as traffic signs. Typically, the feature image pyramid [35] is a common method for effectively detecting objects of different sizes. The feature semantic information of a high-level image is rich, whereas the semantic information of the low-level image is lesser, but the position information is accurate; therefore, the multi-scale fusion method can obtain rich semantic information and accurate position information. A pyramid of common feature images is depicted in Figure 3. As shown in Figure 3a, traffic sign images are first transformed into various sizes, the corresponding feature maps are generated for each size of the traffic sign image, and the prediction is completed. Although this operation can make the extracted features more complete, it is time consuming. As shown in Figure 3b, feature maps of different scales are also generated, and only the semantic information of high-level images is predicted. Although this operation accelerates the speed of the network, it ignores some information of the low-level network, resulting in unsatisfactory detection accuracy. As shown in Figure 3c, the network framework that integrates semantic information of feature layers of different scales is extracted. The maximum amount of network information comes from the low-level network; therefore, there are several weak features in this network, which leads to its poor robustness.
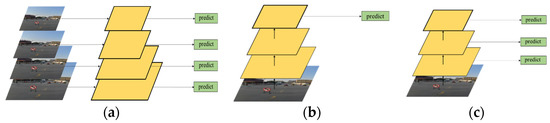
Figure 3.
Common feature image pyramids. (a) different sizes; (b) semantic information; (c) fusion sizes and semantic information.
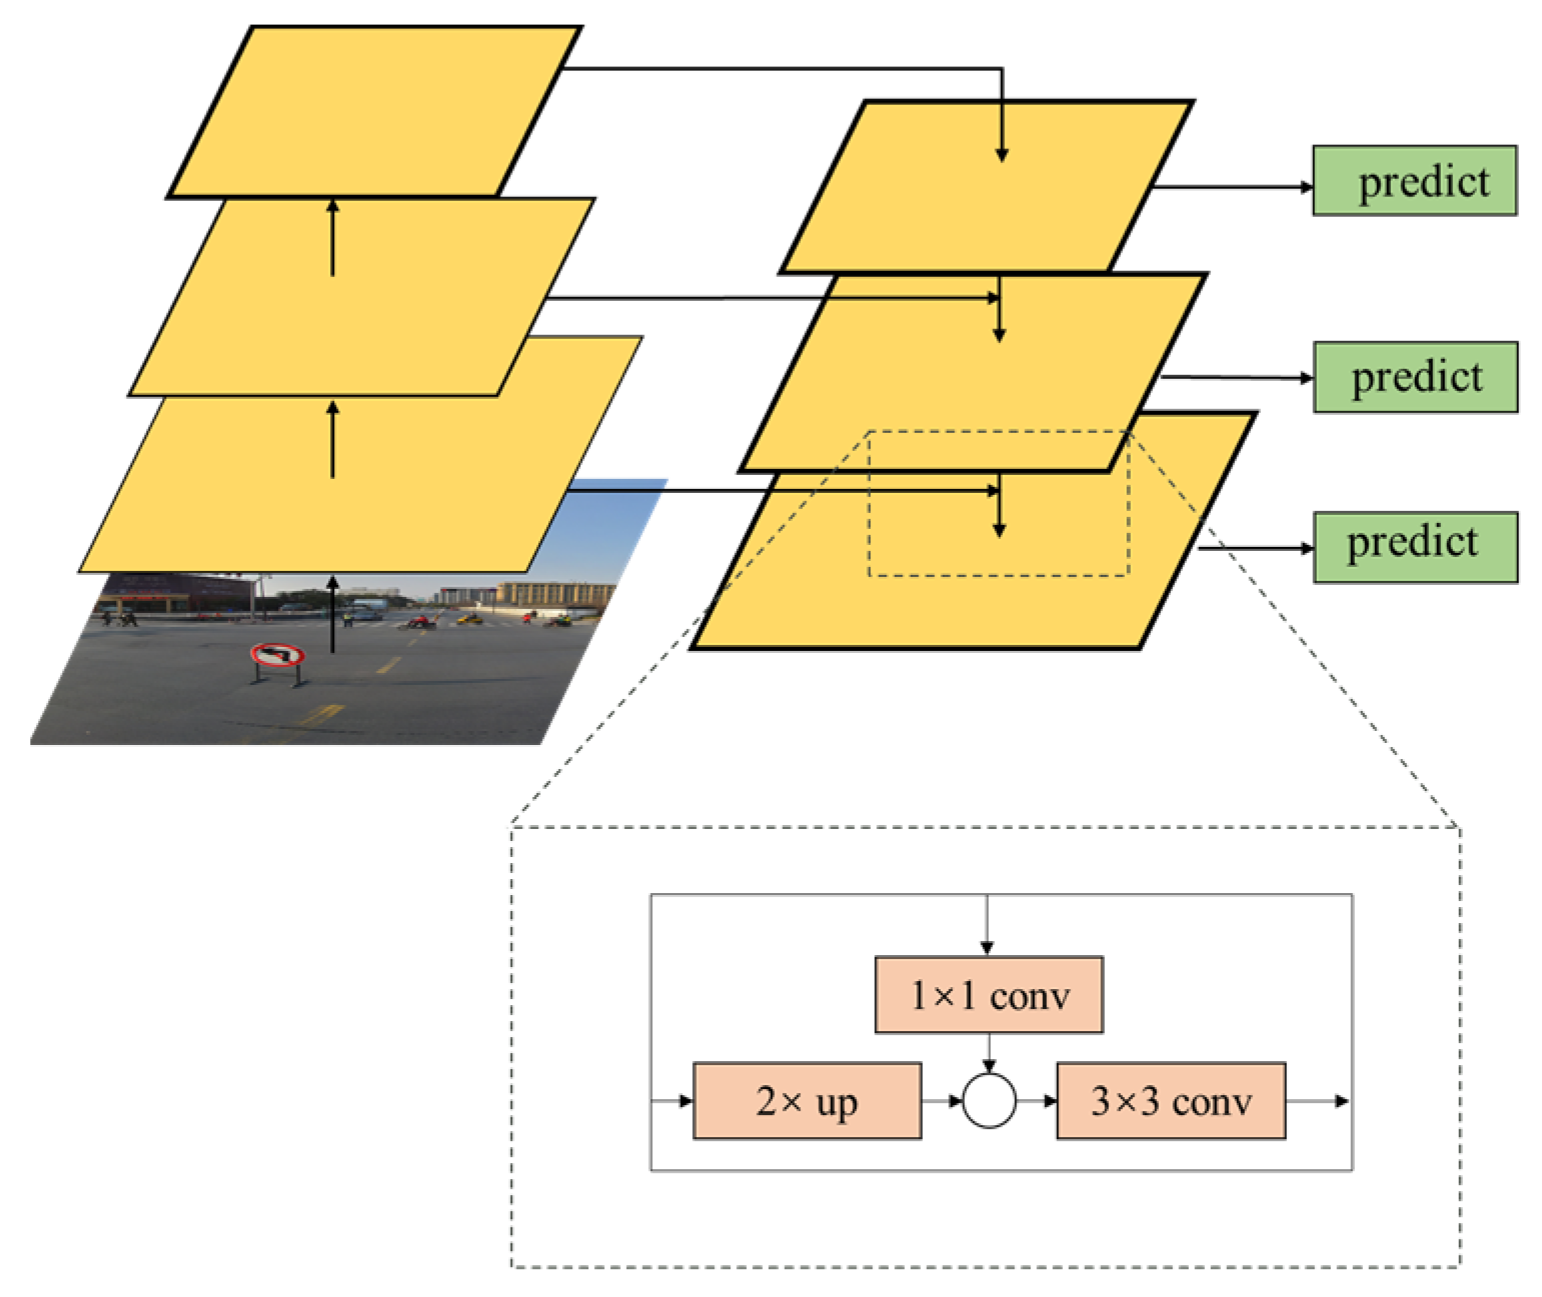
Based on the abovementioned reasons, this study considers a feature pyramid network (FPN) [36], as depicted in Figure 4. Prior to image fusion, feature maps are generated for the both of them. Owing to the lack of feature semantic information at the bottom of the image, it cannot be directly classified; however, the target information is accurate. The characteristics of the high-level semantic information are rich, but the target location is inaccurate; therefore, this study uses a bottom-up and top-down path for transverse information fusion through sampling, and the underlying information on the high-level features requires a 3 × 3 convolution integration, which can fully identify the original characteristic picture of the lowest layer of semantic information, and have abundant characteristic information as well as the characteristics of the high-resolution figure. It has a good detection rate for small targets, and the generated feature map can satisfy the subsequent processing. Additionally, the operation of the FPN adds a cross-layer connection on the underlying network without adding any extra computation to the network. This operation can rapidly construct feature pyramids with strong semantic information at all scales on a single input image and at a single scale without significant time cost.
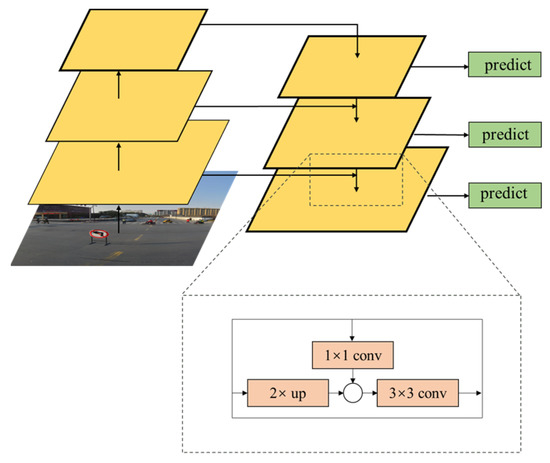
Figure 4.
FPN structure.
4.2. Improved ROI Pooling
In the Faster R-CNN, the region generation network generates candidate boxes of different sizes from the image, and the generated candidate boxes are mapped into feature maps in the ROI pooling layer. Thereafter, the candidate boxes are equally divided to obtain subregions of the same size. Consequently, the calculation of subsequent coordinate regression and classification is simplified. During quantization, there is non-integer multipliers scaling, which causes deviation in the area of feature map mapping, and the deviation reduces the accuracy of the network regression positioning.
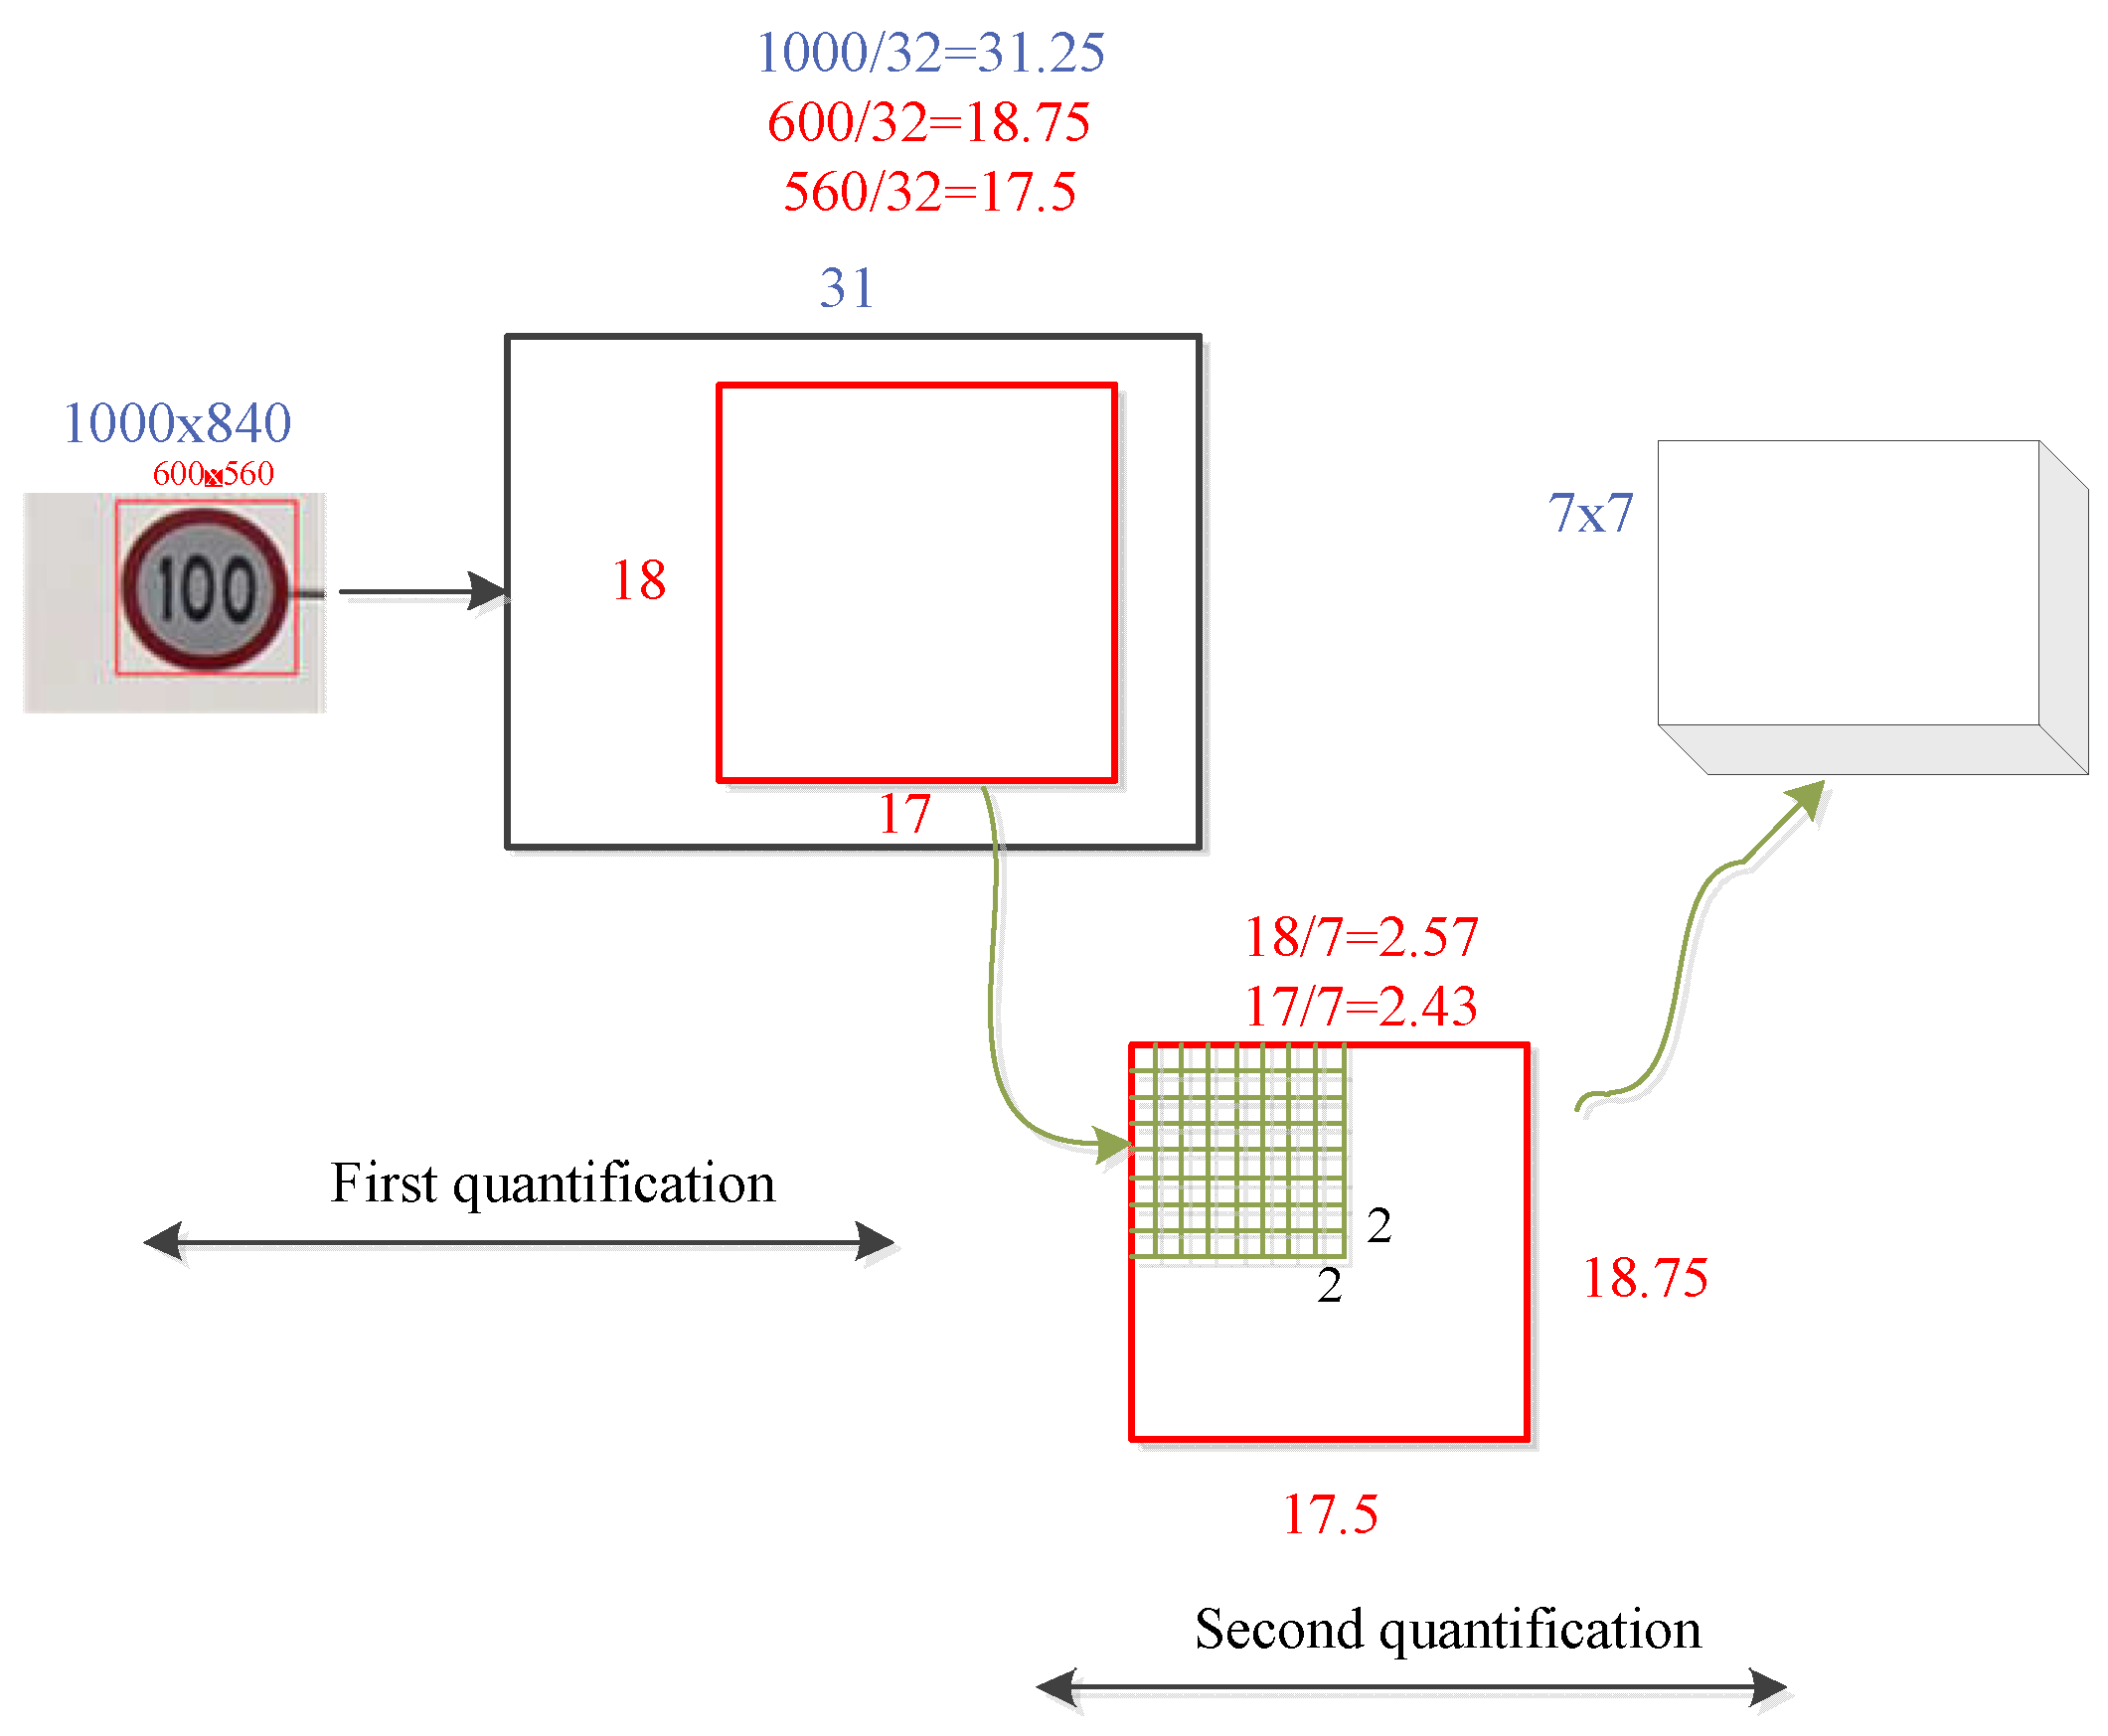
During the mapping of the candidate box to the feature graph, as the coordinate of the candidate box is a floating point number and the required quantity is converted to integer, there is a quantization operation, and the feature graph obtained after the quantization of the candidate box is equally divided into n subregions, which produces the second quantization. Since ROI pooling roughly pools candidate regions of different sizes into the feature map of the same size, there are certain errors in the two quantifications. ROI is depicted in Figure 5. First, an image with a size of 1000 × 840 is input. The target size in the traffic sign image is assumed as 600 × 560. After the feature extraction network, the area suggestion box becomes 1/32 of the original image with a size of 18.75 × 17.5, and the size becomes 18 × 17 after the first quantization. Subsequently, the quantized region is further divided into 7 × 7 units for quantized rounding. The second quantization round region of the ROI pooling module is 2 × 2 (18/7 = 2.57 ≈ 2, 17/7 = 2.43 ≈ 2). The error of 1 pixel when the coordinate on the feature map is integrated is 32 pixels in the original image. This error leads to the poor detection effect of the Faster R-CNN for small target objects; additionally, the error significantly impacts the positioning of traffic signs.

Figure 5.
Schematic diagram of ROI Pooling.
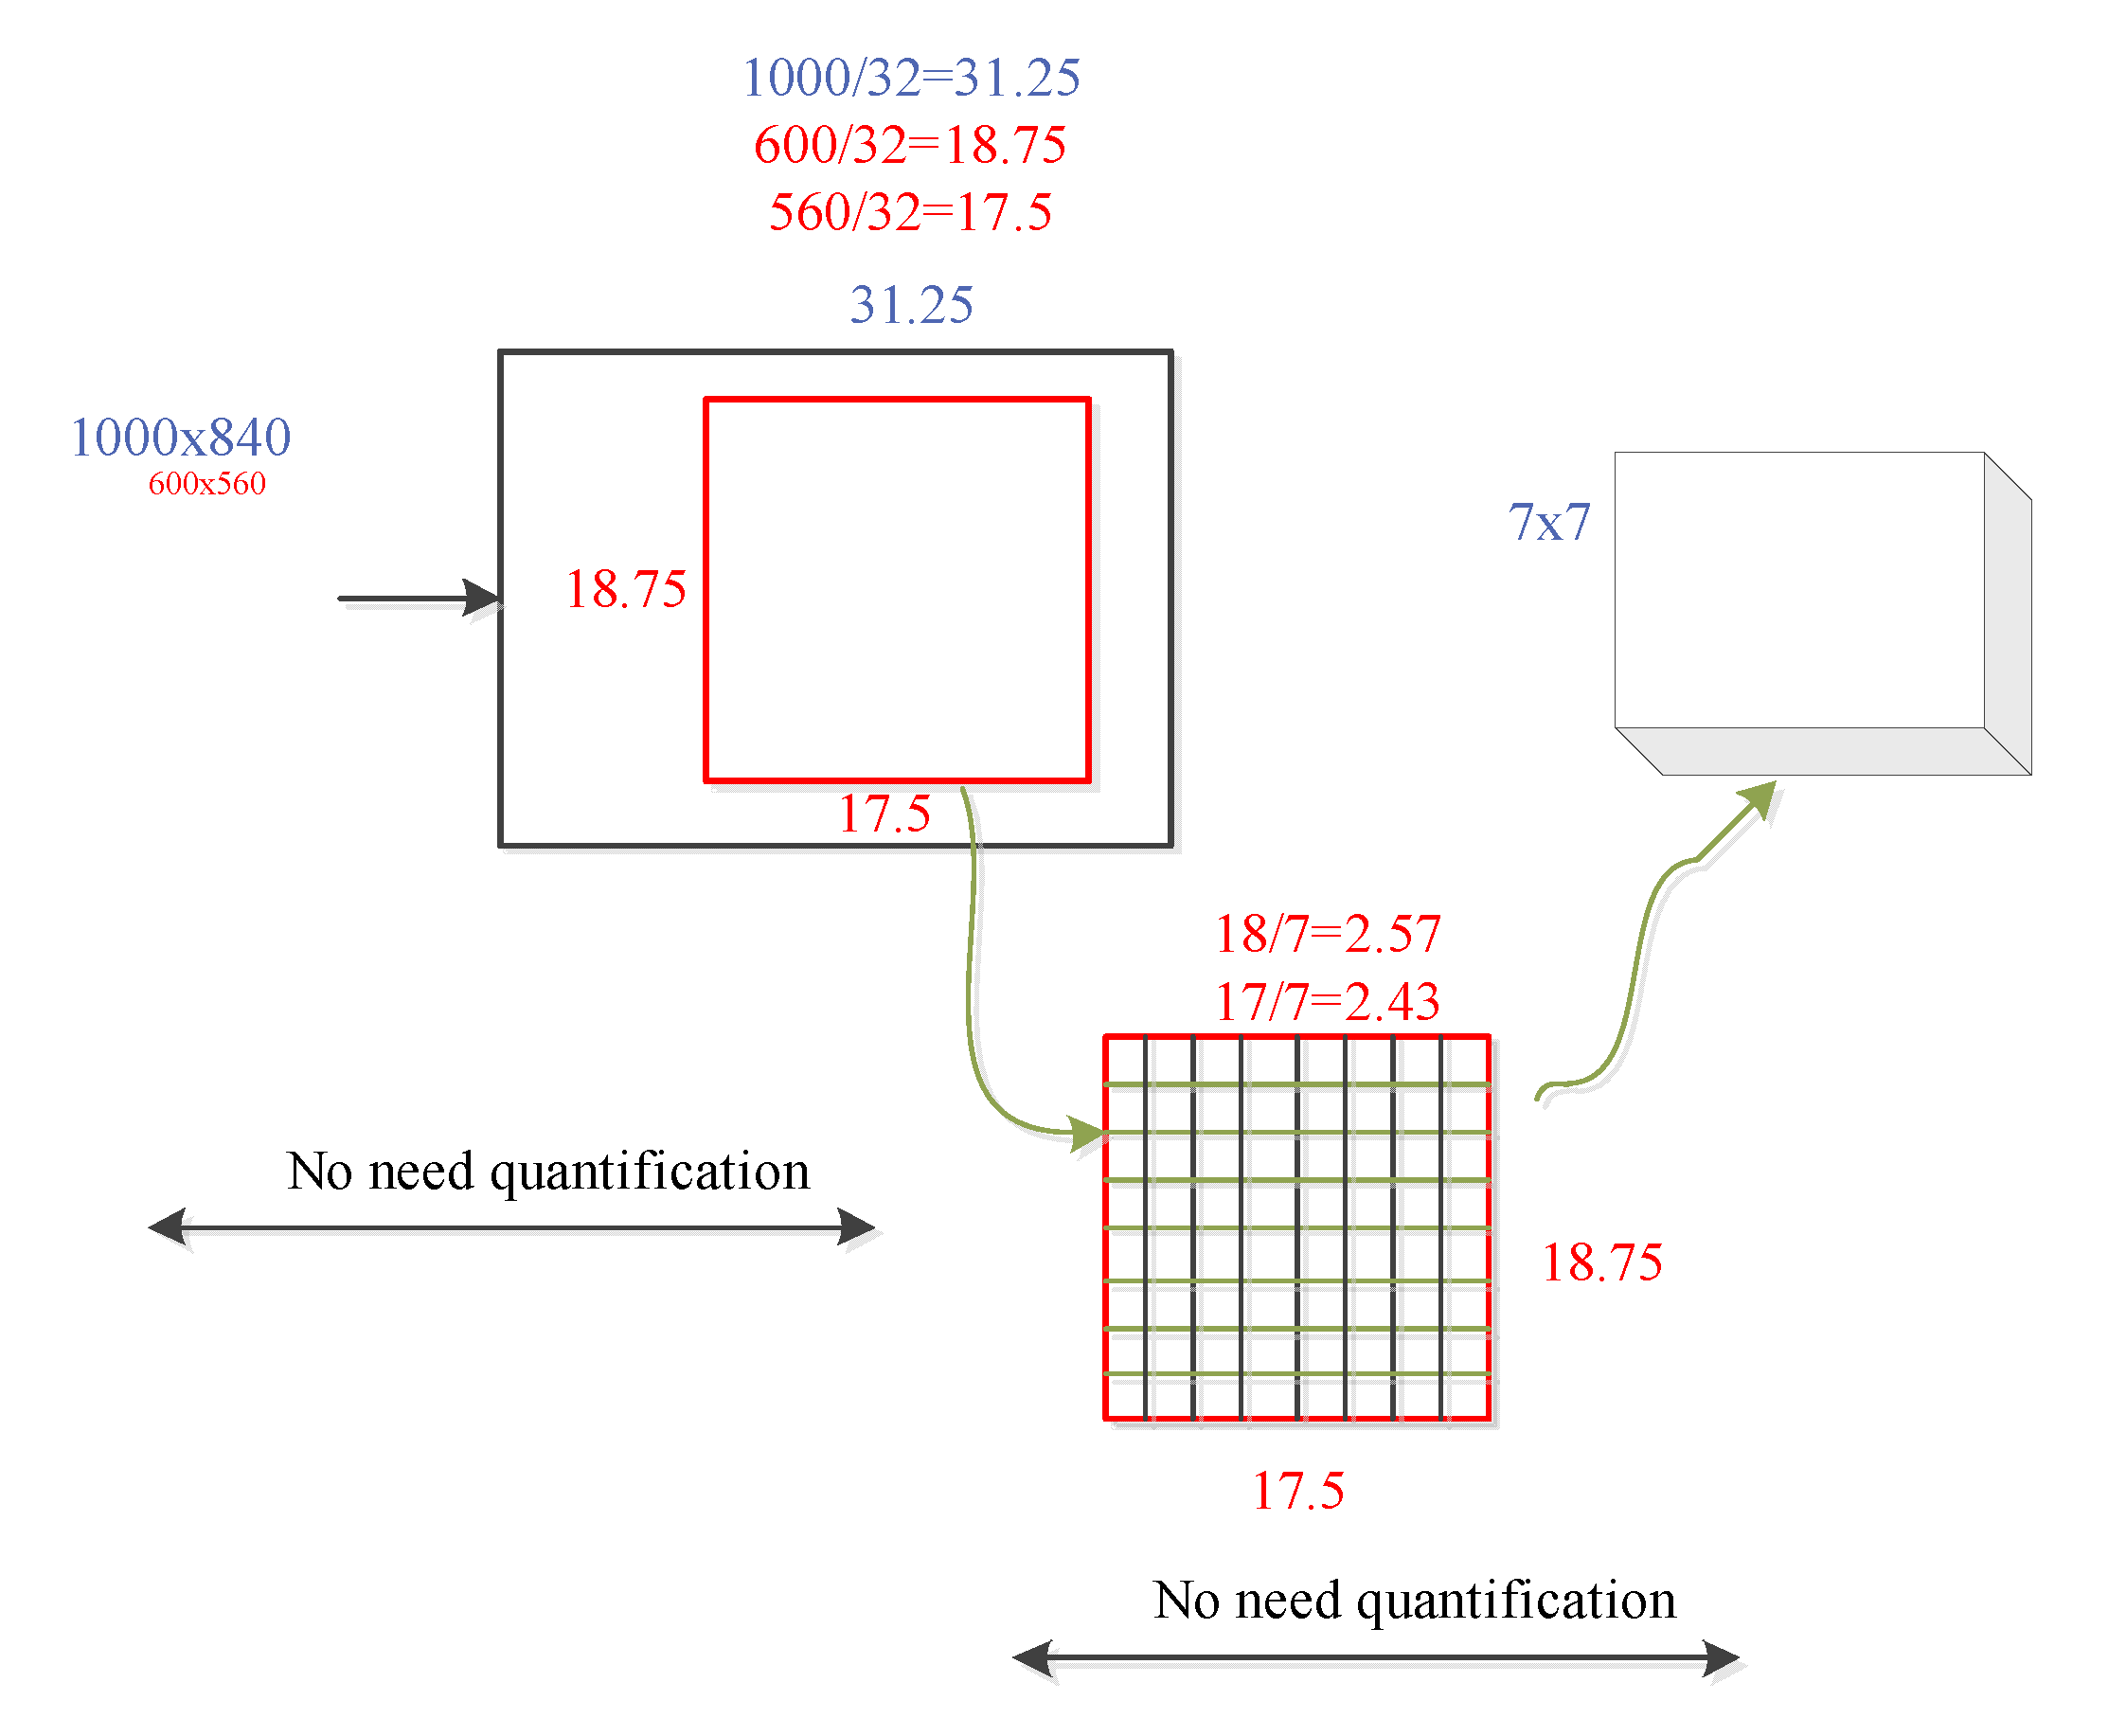
To mitigate the abovementioned problems, and with an aim to eliminate the two quantization errors in the ROI pooling module, He Kaiwen et al., in 2017, proposed the mask R-CNN [31] algorithm. This study uses ROI align to replace the ROI pooling module in the Faster R-CNN, thereby avoiding the quantization loss in the original ROI pooling module and improving the detection accuracy of traffic signs in the network. The specific implementation method of ROI align is illustrated in Figure 6, and the interpolation method is illustrated in Figure 7. The yellow box represents a 5 × 5 feature map, and the green box represents a 2 × 2 candidate area, with several yellow sampling points in each grid. The sub-areas in the green candidate box have four sampling points. The values of the four real pixels closest to the sampling point on the feature map are obtained by bilinear interpolation, and the quantization of the coordinate of the candidate region is omitted. When the number of yellow sampling points is four and the sub-areas are divided into four rectangles, the sampling point is the center point of the four rectangles. The coordinates of the four sampling points are all floating point numbers; therefore, the ROI is subdivided into the quantization of the grid. This operation can avoid the loss of pixels; therefore, the feature region obtained by the Faster R-CNN model is more accurate. Moreover, the detection ability of the small-size target is further improved, and an improved detection performance is achieved.
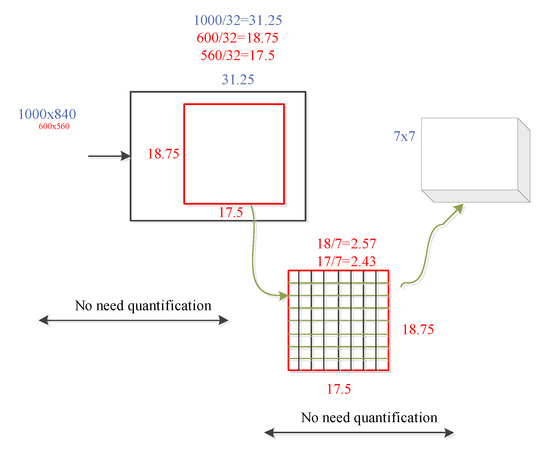
Figure 6.
ROI align process.
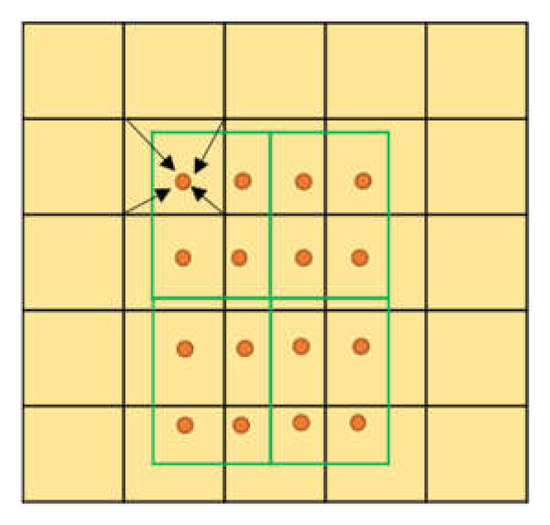
Figure 7.
ROI align interpolation.
4.3. Add Deformable Convolution to the Backbone Network
In this study, in order to further improve the detection accuracy of the network, the original backbone network, VGG16, of the Fast R-CNN was replaced with Resnet50, and subsequently, all the 3 × 3 Conv in Conv2, Conv3, Conv4, and Conv5 in Resnet50 were replaced with DCN [37].
The Resnet50 feature extraction network adopts standard convolution, and the CNN can learn the spatial hierarchical structure of the images. The size of the receptive field of the convolutional kernel affects the learning ability of the CNN. In the Conv of the same layer, the receptive field of each activation unit is the same. However, the shape of the defect is irregular. Therefore, the DCN is used to adapt to the defects of different shapes. Conventional convolutional network sampling structures are generally fixed rectangles, which are limited to images with irregular shapes. The DCN introduces a new module to enhance the adaptive sampling ability of the convolutional network. In the standard convolution, the conventional sampling position of the standard convolution is not sufficiently flexible to check the receptive field of the target shape; therefore, the efficiency of the convolution is naturally not high. The DCN, by adding an offset to each position of the convolution kernel, expands the receptive field of the convolution kernel and enhances the learning ability of the network. In this manner, the convolution kernel can better learn the shape of the target itself.
The specific convolution operation process of the DCN is illustrated in Figure 8. Compared with conventional convolution, the extra part of the DCN is the parameter to be trained (offset field) inside, and the size of offset field is equal to the size of the input feature graph. Conventional rectangular structures are offset by offset fields and become offset offsets to obtain the corresponding deformed pixels. The offset is learned using the additional convolution layer from the previous feature graph; therefore, the input feature limits the deformation.
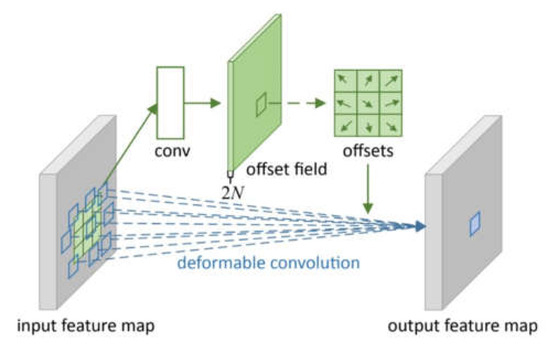
Figure 8.
DCN process.
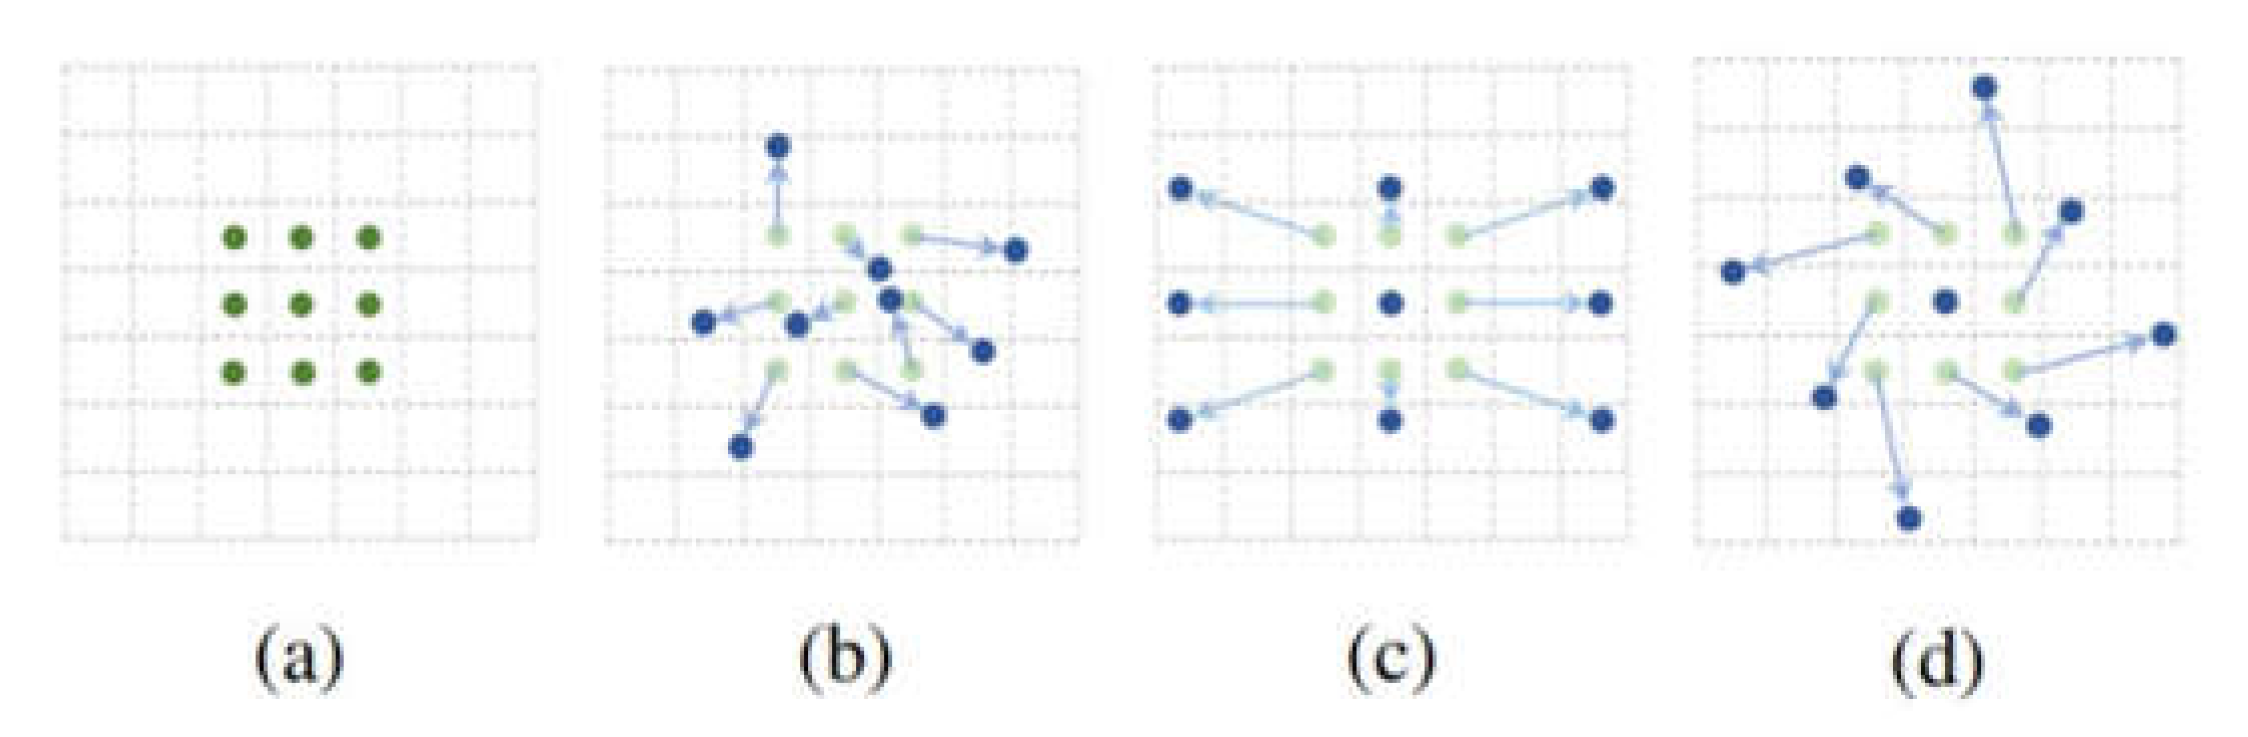
The deformation sampling structure in the DCN illustrated in Figure 9a is the sampling structure of the standard convolution (green dot). Figure 9b shows the sample structure of the DCN (blue dots), where the light blue arrow’s direction represents the added offset. Figure 9c,d represent the special cases of scale broadening and rotation, respectively. As shown in Equation (2), a 3 × 3 convolution kernel is defined with an expansion size of 1. R indicates the size and expansion of the receptive field.
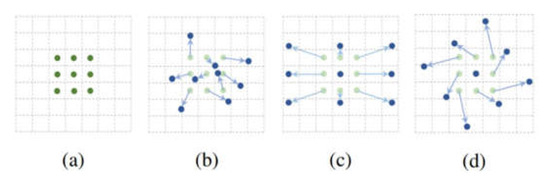
Figure 9.
DCN sampling process. (a) normal process; (b) deformable process; (c) widen process; (d) rotary process.
P0 traverses all positions in R, as shown in Equation (3):
The two-dimensional calculation equation of the DCN is given by Equation (4). The DCN is in the scope of the standard convolution, and the position offset of the sampling point is added. The two-dimensional calculation equation of the DCN is given by Equation (4). The DCN is in the scope of the standard convolution, and the position offset of the sampling point is added as
To eliminate the limitation of the original fixed structure of the convolution kernel, an offset is added to each position of the convolution kernel. After using the sampling points with the offset, the convolution kernel expands the receptive field, and not only improves the learning ability of the network but also its detection performance.
5. Experimental Results
To evaluate the proposed method, we conduct experiments with both a public dataset and a real intelligent vehicle test. TT100K is selected for the dataset experiment. In the real intelligent vehicle test, we collect the data in Zhenjiang, China, including a city expressway and an ordinary urban road. The real intelligent vehicle test covers different routes, weather conditions, and daytimes.
5.1. Experiments with Dataset
5.1.1. Experimental Environment and Details
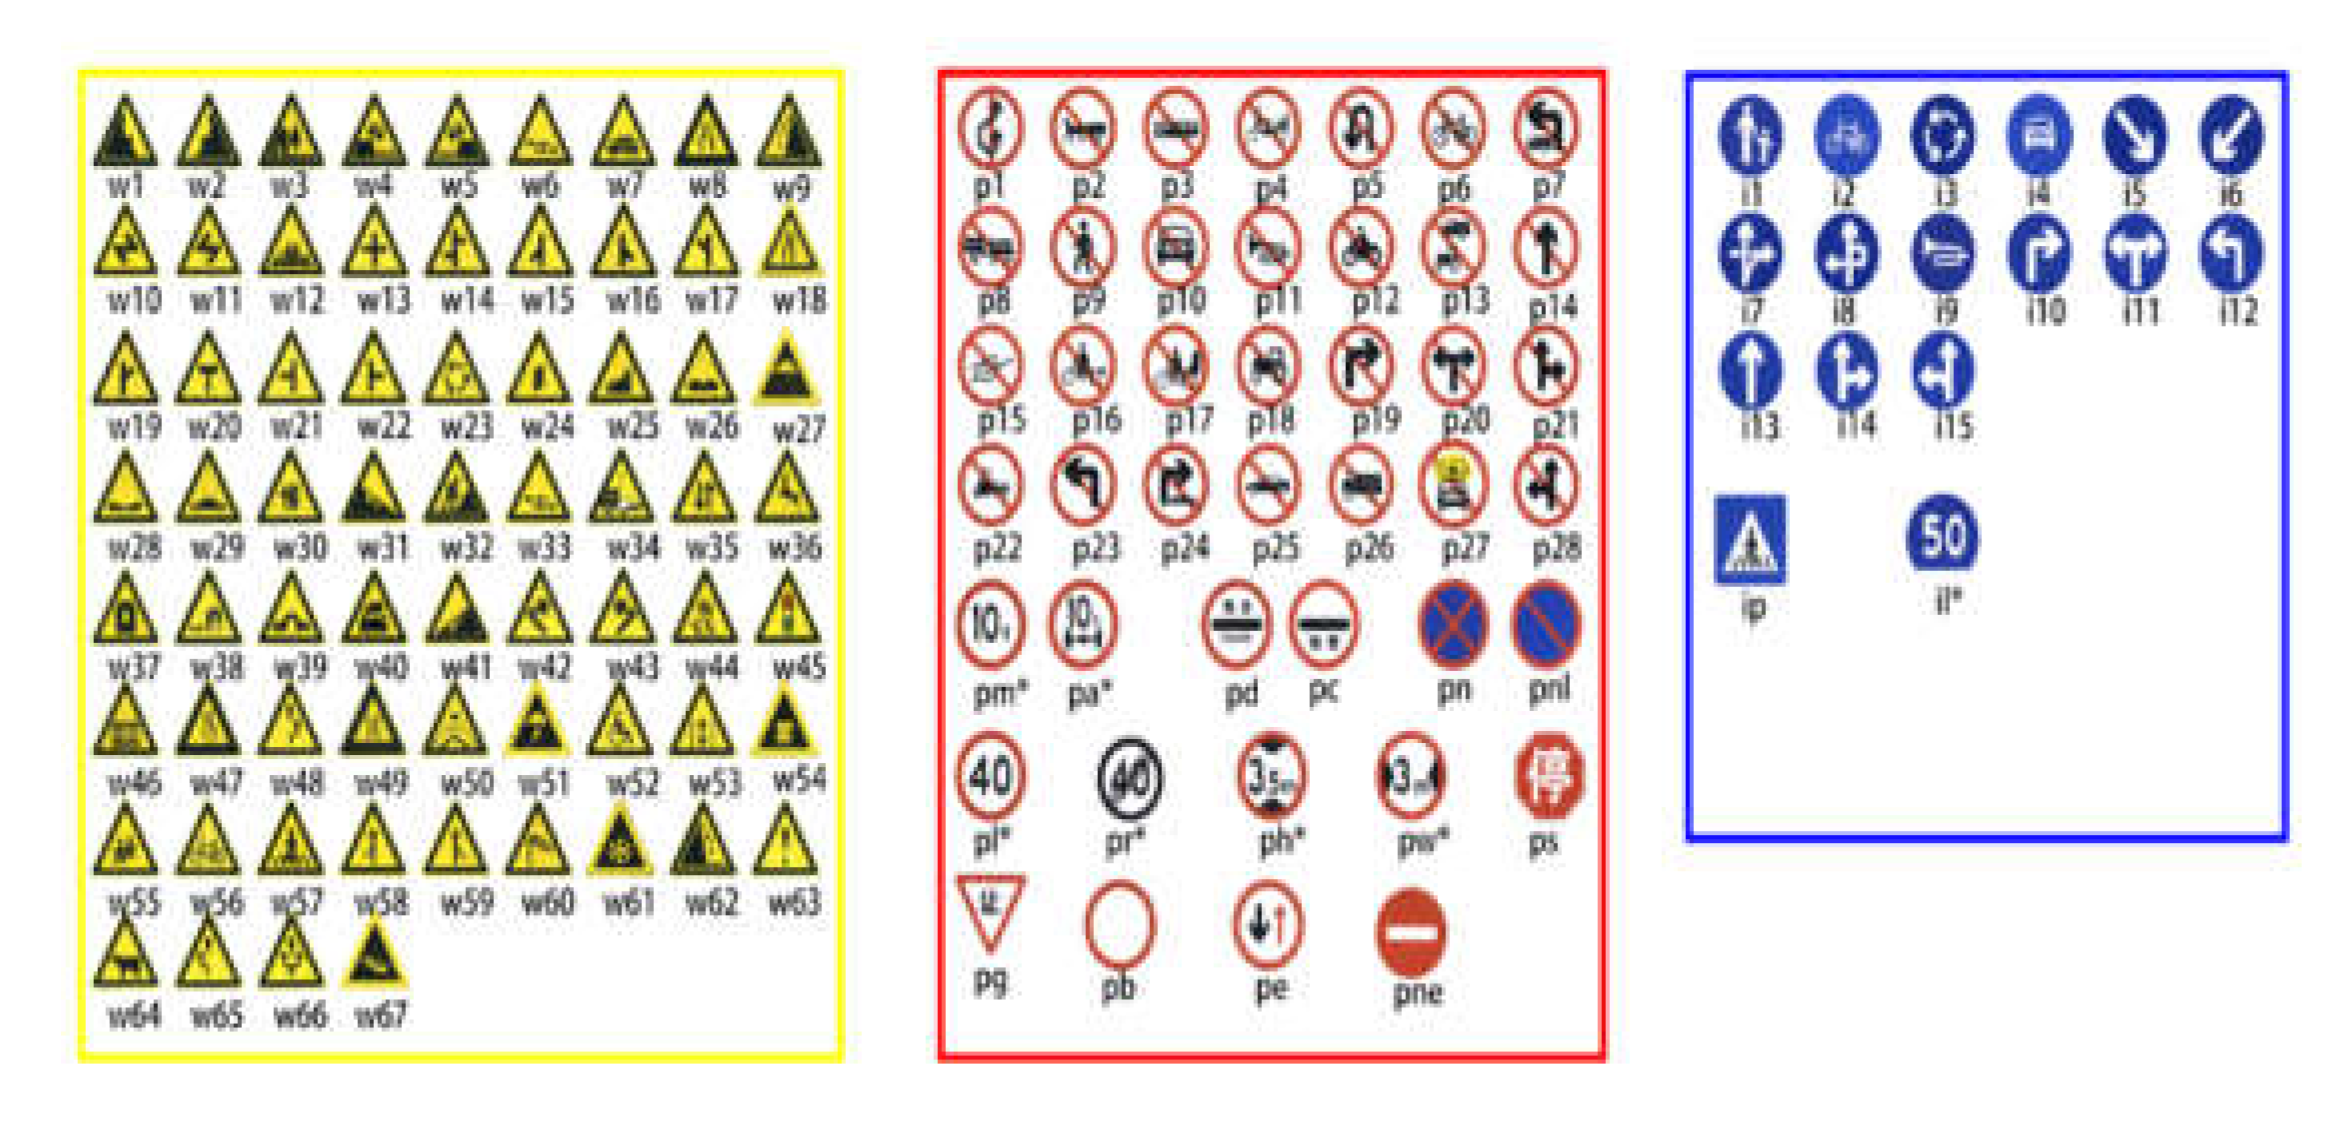
This experiment uses the Chinese traffic signs dataset, TT100K (Figure 10), which contains 100,000 traffic signs. The dataset contains 221 types of traffic signs, 6105 training sets, 3071 test sets, and 2048 × 2048 picture sizes. As the largest and most comprehensive traffic signs dataset in China, TT100K not only covers the vast majority of scenes in China’s actual driving environment but also different lighting and weather conditions. Owing to the imbalance in the number of different categories in the dataset, the category with number of instances lesser than 100 was excluded in the experiment, and 45 traffic signs with a large amount of data were selected for detection. These 45 traffic signs were as follows: WO, W13, W32, W55, W57, W59, P3, P5, P6, P10, P11, P12, P19, P23, P26, P27, PG, PH4, PH4.5, PH5, I2, I4, I5, IL100, IL60, IL80, IO, IP, PL120, PL20, PL30, PL40, PL5, PL50, PL60, PL70, PL80, PL100, PM20, PM30, PM55, PN, PNE, PO, and PR40.
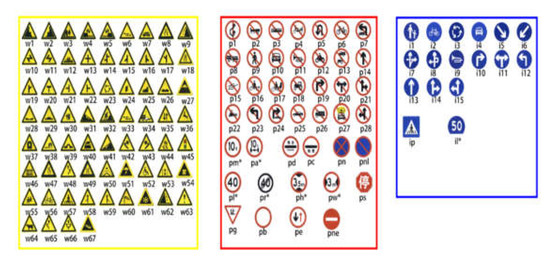
Figure 10.
TT100K category.
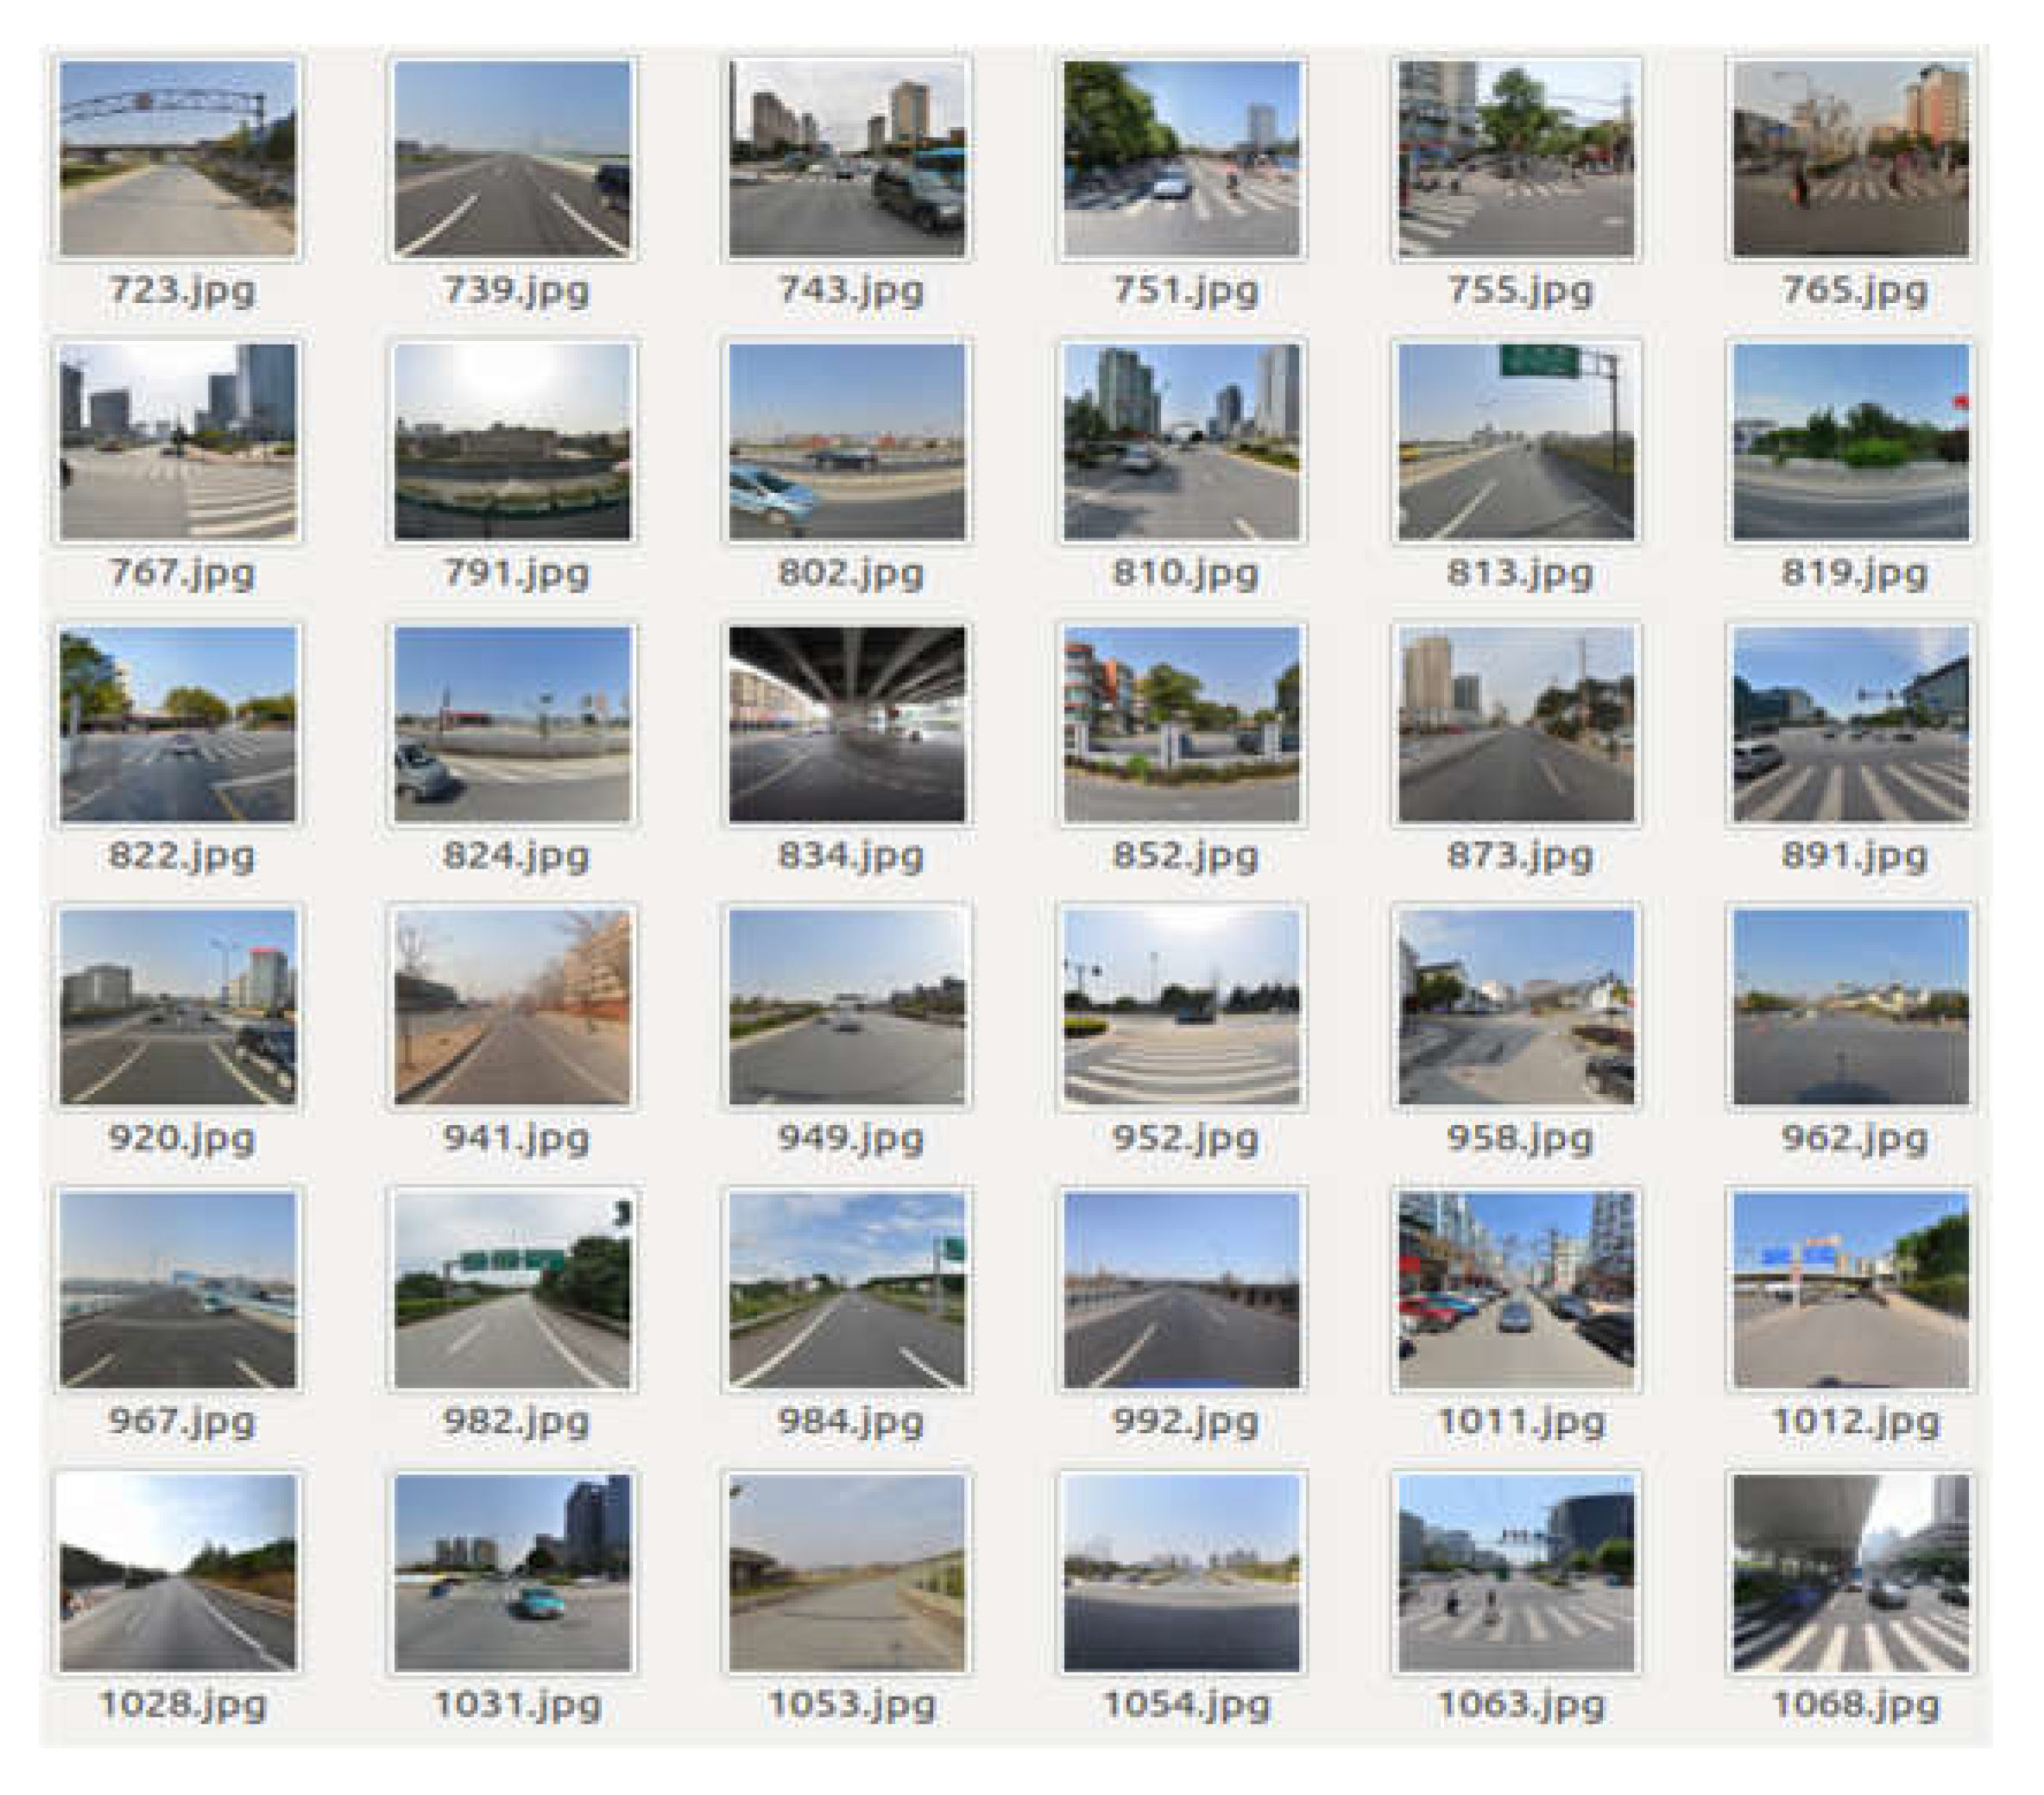
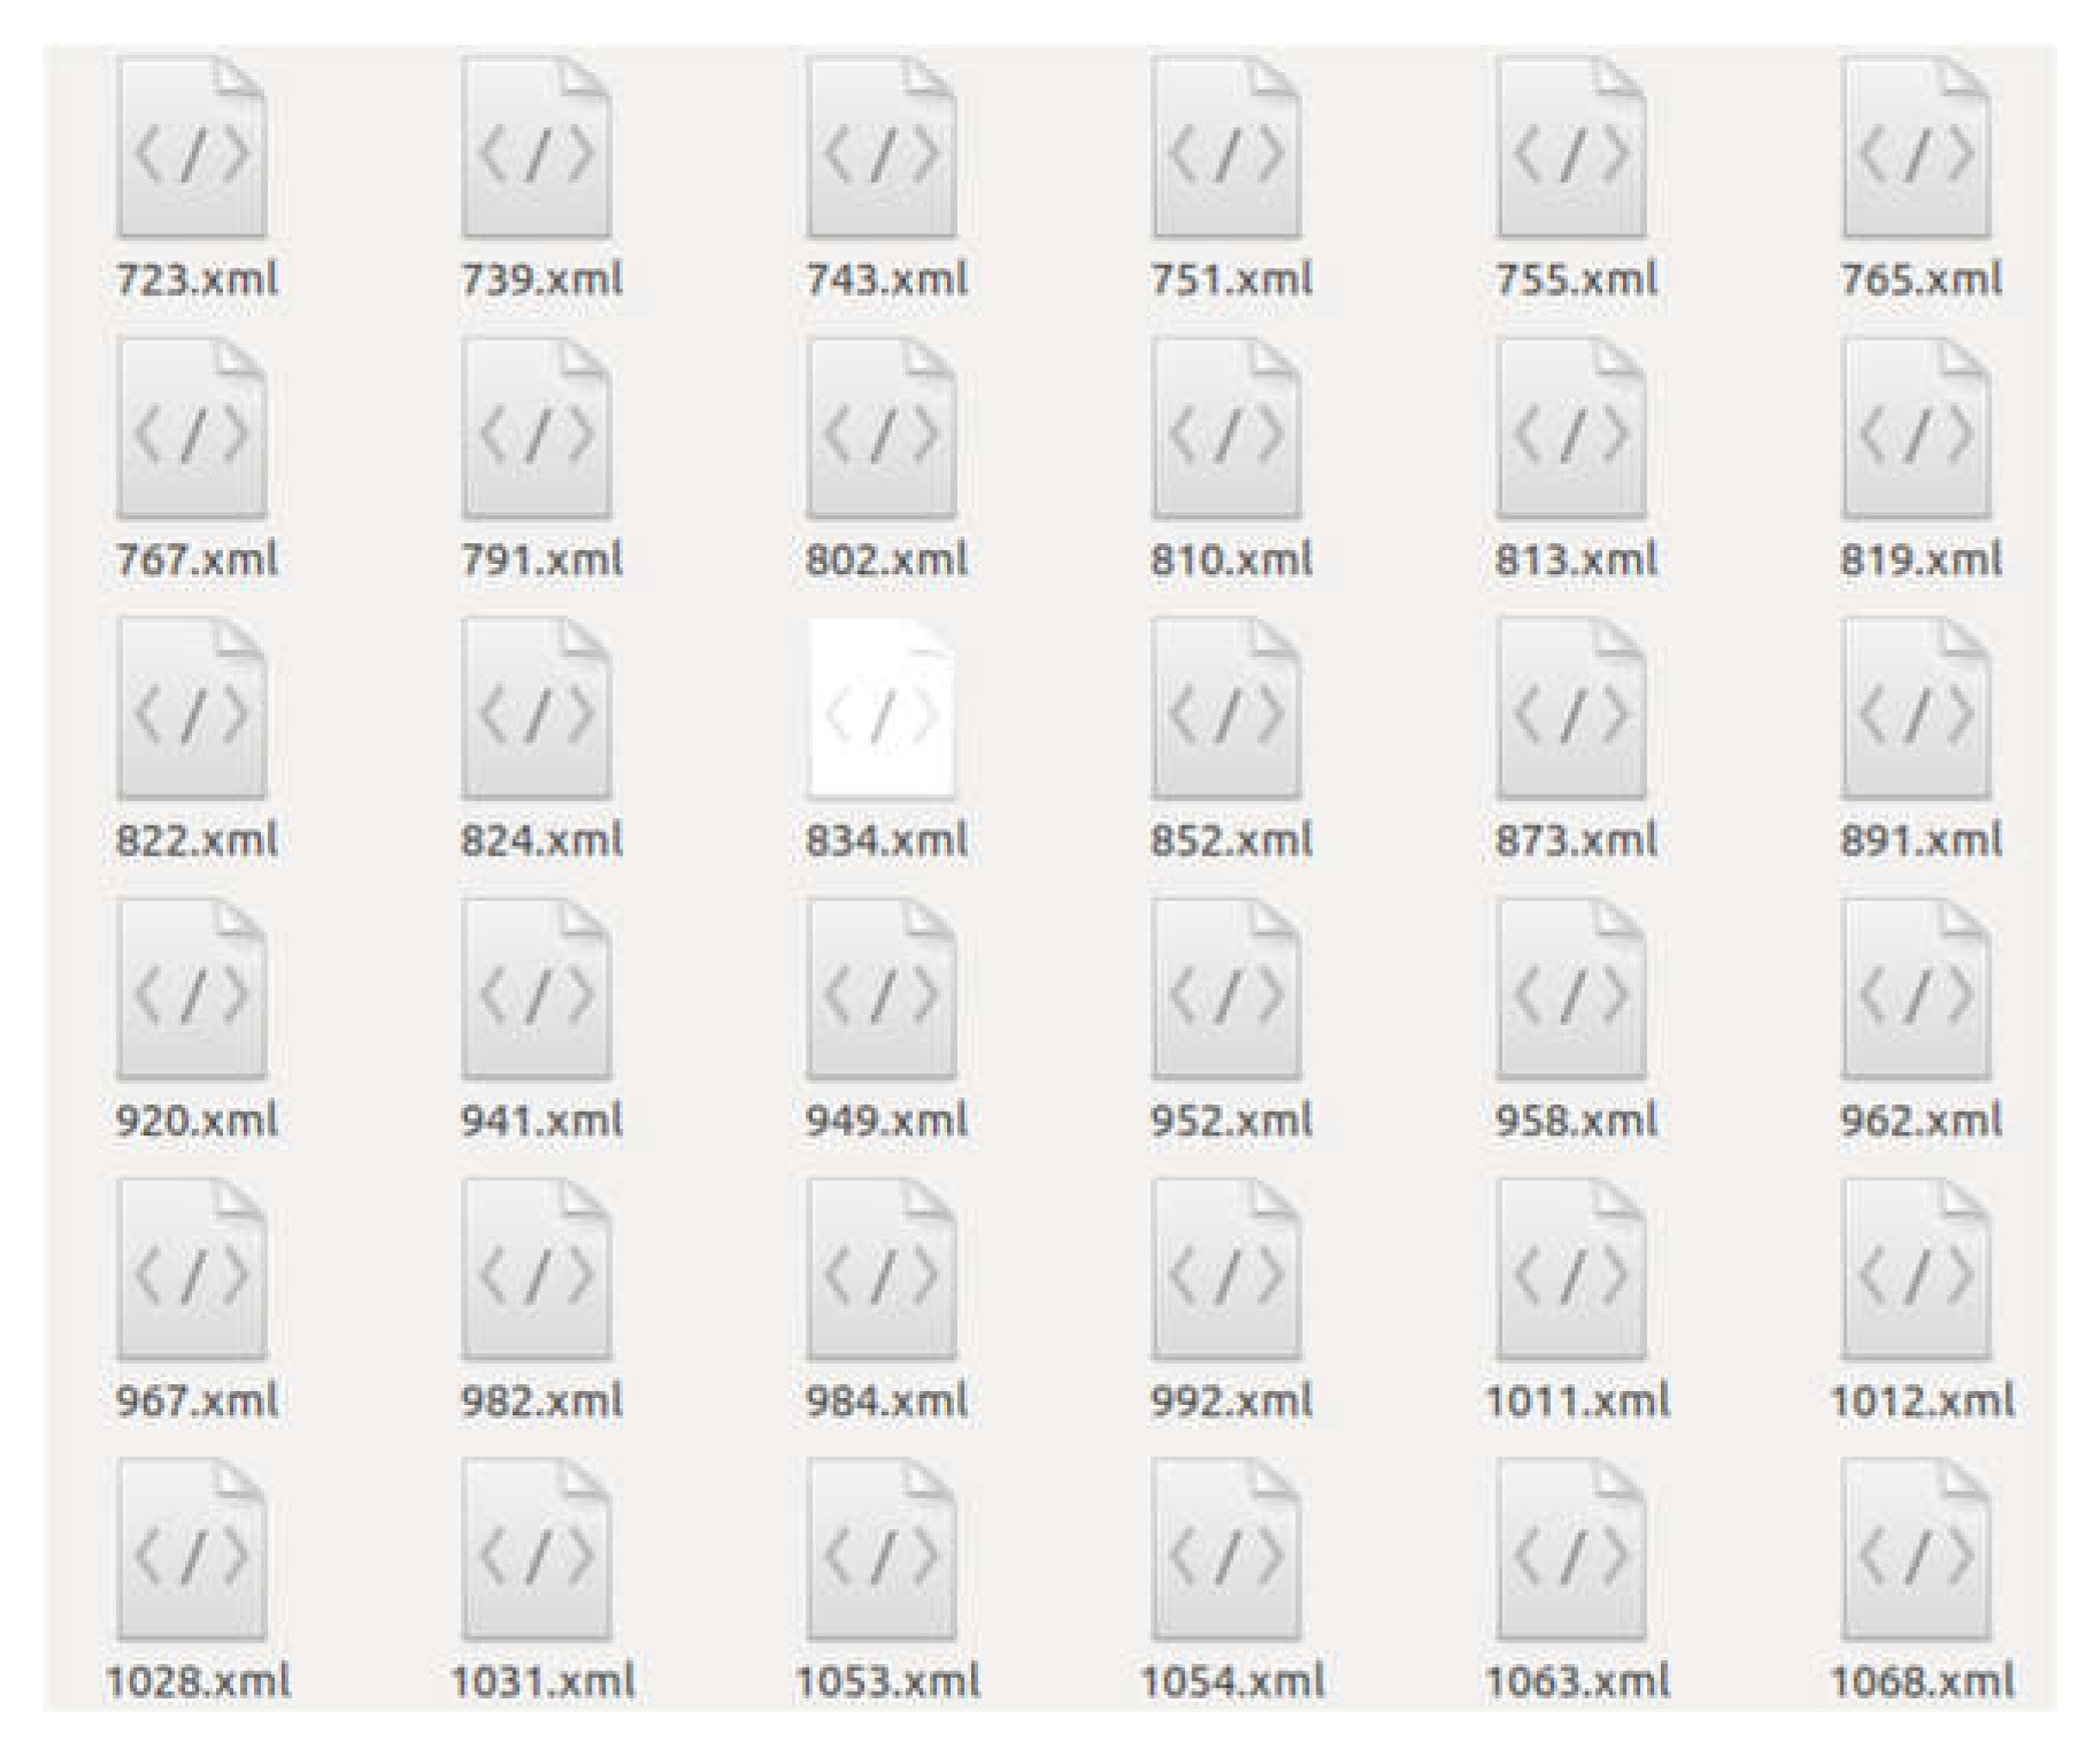
In this study, data expansion was performed for the categories with less data in the 45 types of traffic signs. Two image preprocessing methods, light intensity changing, and random Gaussian noise were adopted. After expansion, the training and the test sets contained 15,684 and 4200 images, respectively. The dataset diagram is presented in Figure 11. The annotated file containing the position coordinates and categories of the detected object was an XML file, as depicted in Figure 12.
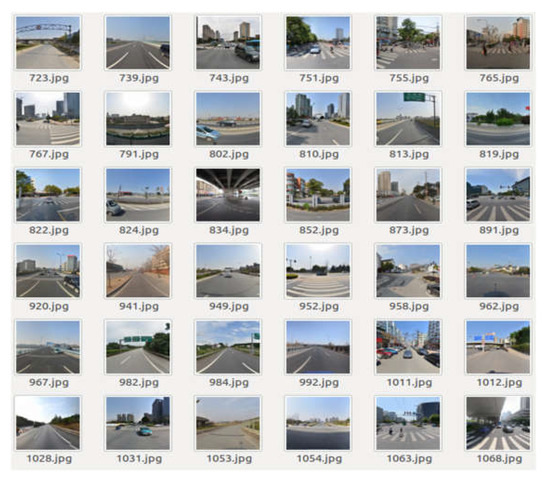
Figure 11.
Sample dataset image.
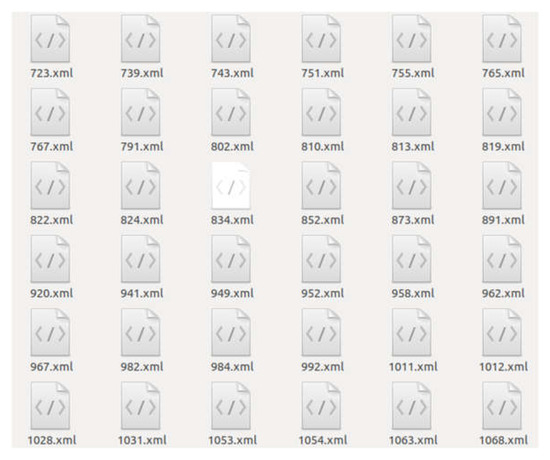
Figure 12.
Annotation file.
All the experiments in this study used the same training platform. The processor of the platform is an Intel six-core 12-thread i7-8700 (Santa Clara, CA, USA), the graphics card comprises two Nvidia GTX2080TI (Santa Clara, CA, USA), the video memory size is 11 GB, the memory size is 64 GB, and the operating system of the training platform is Ubuntu 18.04.
Additionally, to prove the robustness of this method, the traffic signs in the dataset were divided into small (pixel range (0, 32], small), medium (pixel range (32, 96], middle), and large (pixel range (96, 400], large) categories for index evaluation according to the pixel range. The number of small, medium, and large targets in the test set are summarized in Table 1.

Table 1.
Number of targets.
The algorithm in this study adopts two evaluation indices for evaluation: mean average precision (mAP) and frames per second (FPS). In the evaluation index, mAP is the mean of the average precision (AP) of various traffic signs. FPS is an important index of detection speed, which reflects the performance of real-time detection algorithms.
The detection result index of each category is precision, that is, the percentage of correctly detected traffic signs in all detected areas. It is calculated according to Equation (5). Recall, which is the percentage of traffic signs correctly detected in all traffic signs, is calculated according to Equation (6). A curve is drawn according to the accuracy and recall rates of the test results of each category. The area under the curve is the average accuracy, and it is calculated according to Equation (7).
where TP denotes the number of correctly detected traffic signs; FP is the number of traffic signs detected in the background; FN is the number of traffic signs detected as the background; p is the precision on the longitudinal axis; and r is the recall on the horizontal axis.
The experimental deep learning framework in this study is PyTorch, and the algorithm is implemented on the open-source detection tool library, mmdetection. The parameters in the model training process are as follows: global learning rate is set as 0.005, initial learning rate is set as 1.0/3, momentum factor is set as 0.9, and weight attenuation is set as 0.001. Furthermore, the stochastic gradient descent [38] optimization algorithm was adopted. Two images were used for each batch of training, and 20 epochs were trained. Moreover, the system’s super-parameter learning rate adopts a warm-up strategy, that is, a relatively small learning rate is used at the beginning and the learning rate is gradually increased. This method can achieve a high accuracy rate and avoid the non-convergence of model training.
5.1.2. Experimental Analysis
In this section, we first compare the improved Faster R-CNN and Faster R-CNN, where the backbone network is Resnet50. The experimental results are presented in Table 2. The mAP values of the original Faster R-CNN and the improved Faster R-CNN are 78.2% and 86.5%, respectively. The mAP was directly improved by 8.3 percentage points, which is a significant improvement. The detection effect of small targets was significantly improved by approximately 12 points. The proposed improvement scheme significantly improved the detection effect of small targets. The experiment demonstrates that the improvement achieved in this study is an effective approach, which can comprehensively improve the detection ability of the Faster R-CNN for traffic sign targets.
Table 2.
Results of the comparative experiments before and after the improvement of the algorithm.
To further illustrate the effectiveness of the three improvement measures proposed by us, the effectiveness of each component of the improved Faster R-CNN was analyzed through various ablation experiments (Table 3). In the experiments, the FPN, improved ROI align, and DCN modules were gradually added. The experimental results of traffic sign targets with different detection difficulties, detection effects, and test speed of single pictures are explained and analyzed.
Table 3.
Ablation experiment.
From the abovementioned experimental results, it can be established that the detection effect of the three improved methods proposed in this study for various sized targets of traffic signs was considerably improved. The contrast characteristics of the pyramid FPN ablation experiments may be found to detect small targets, and the medium-target effect will certainly contribute to the small size of the mAP increased by approximately 7%, signifying that using more underlying characteristics for small target detection can improve the effect of detection for small targets, with a medium-size mAP of 2.9%, and a large-scale mAP that does not improve much. The reason is that large-size targets contain a lot of feature information and can be detected and classified. The ablation experiment that improved ROI pooling into ROI align showed a small improvement in all indicators, and the detection network’s ability to detect small targets was further strengthened, demonstrating the effectiveness of this method. The ablation experiment of the DCN shows that the mAP was improved by approximately 2.5%, and the detection accuracy of small targets was significantly improved. This is mainly because, as a result of the addition of the DCN, the convolution not only becomes more flexible to check the receptor field of the target shape, but also shows high efficiency, and the learning ability of the Faster R-CNN is enhanced. The detection of small targets was further improved. Moreover, it can be observed from the experiment that the feature pyramid and DCN modules proposed in this study will increase the time of image detection to a certain extent.
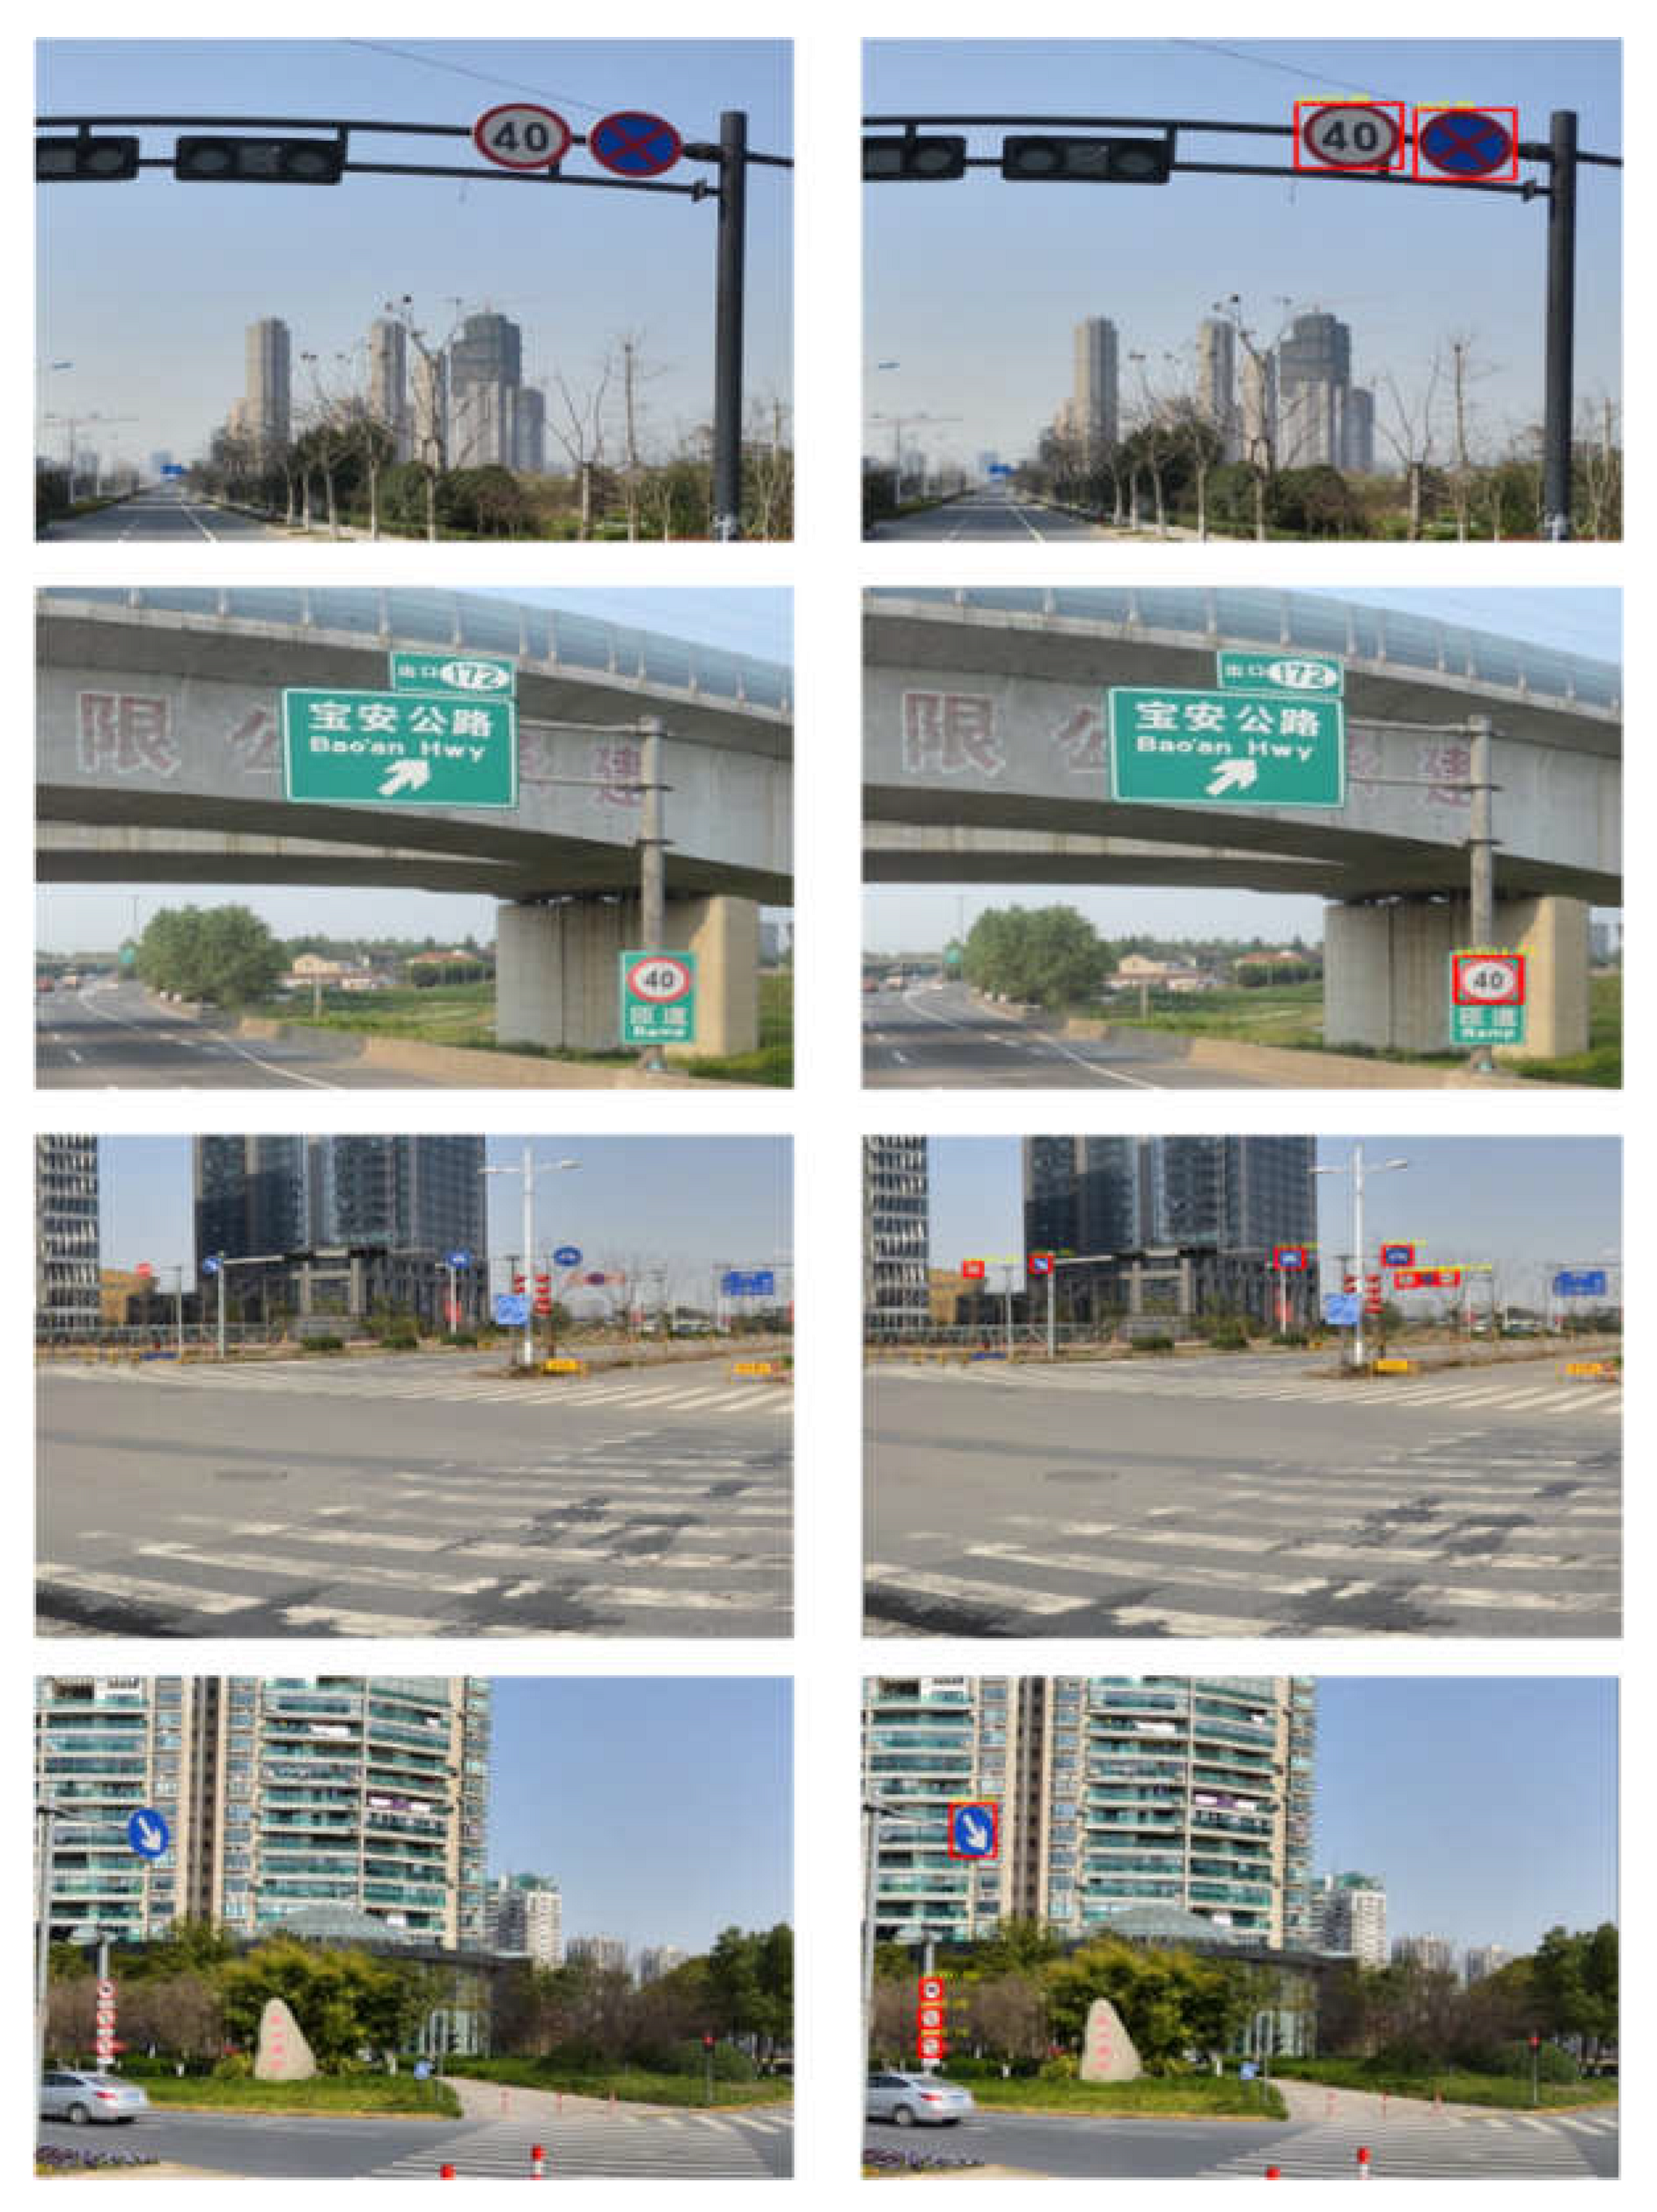
The detection results of a part of the TT100K test set are presented in Figure 13. The red detection box represents the detected traffic sign target, and the yellow number represents the confidence of the detected traffic sign. As observed from the figure, the improved scheme can achieve an accurate detection of traffic sign targets in various scenarios.
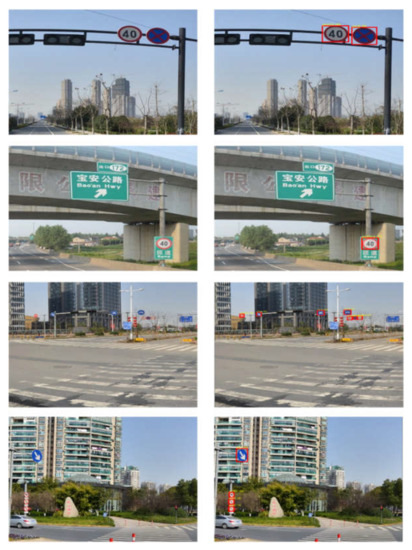
Figure 13.
Images demonstrating the effect of improved Faster R-CNN detection (images on the left are the original images, and those on the right are the detection images).
5.2. Experiments with Intelligent Vehicle
5.2.1. Experimental Details
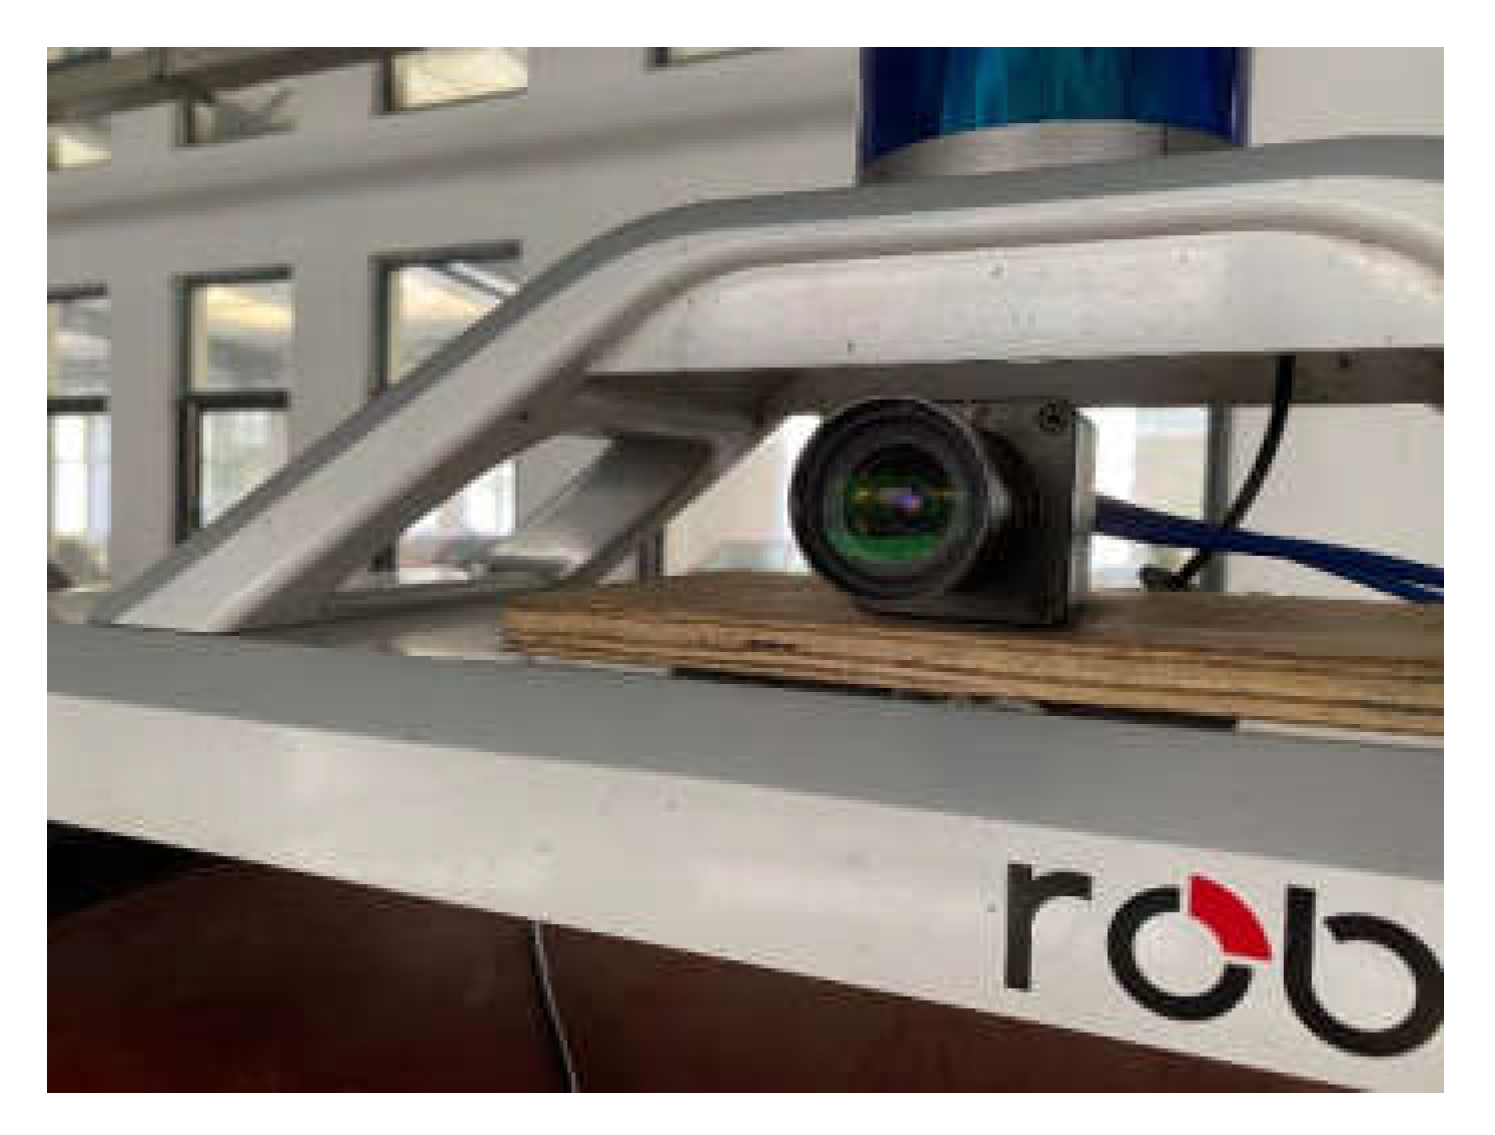
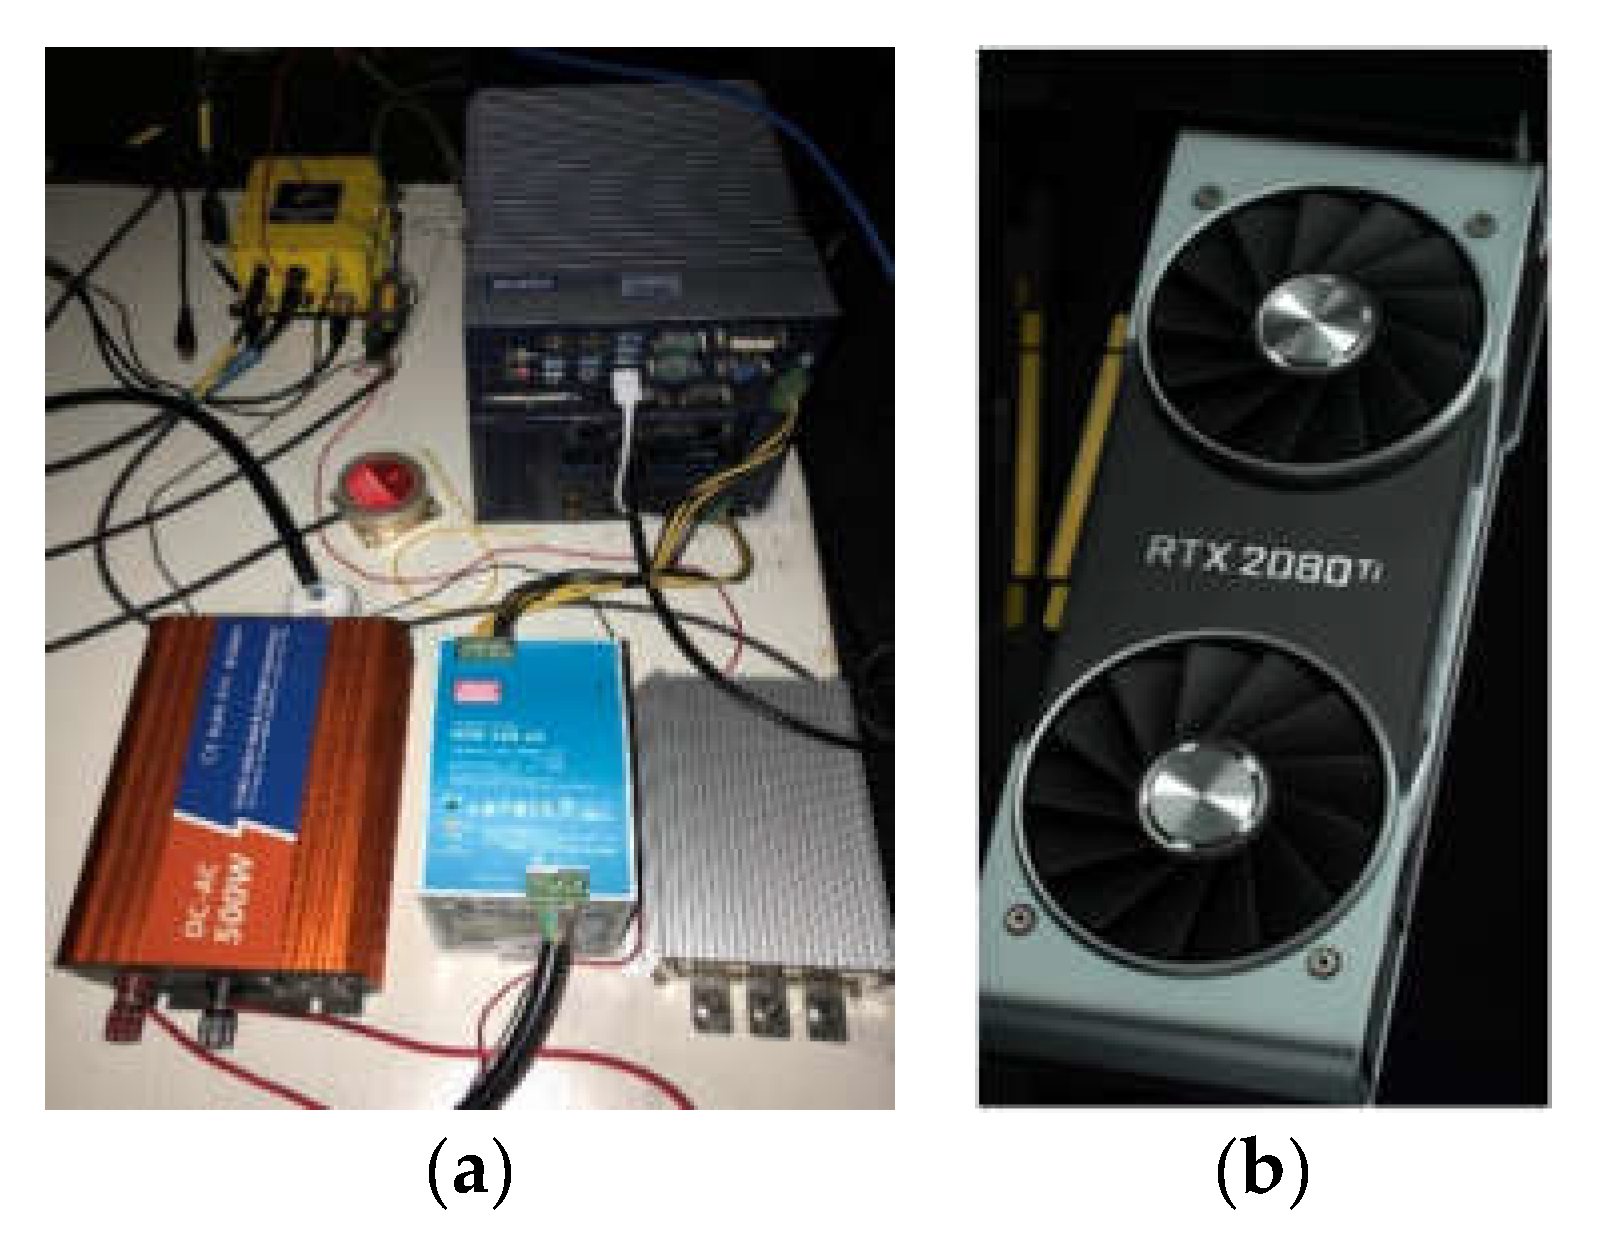
We use an electric intelligent vehicle called Arrizo 5 to evaluate the proposed method (Figure 14). The intelligent vehicle is equipped with a monocular camera, an industrial personal computer (IPC), LRFs, INS, and a GPS receiver. It is worth noting that only the monocular camera and IPC are used in this test. The monocular camera is an industrial-grade gigabit camera with a high frame rate, which is equipped on the top of the vehicle (Figure 15). The camera is used to collect images of traffic signs. The IPC is used for data processing, which is at the core of the proposed method. The operating system of the IPC is Ubuntu18.04. The CPU is an IntelCore I7-7700T dual-card processor. The IPC is equipped on the right side of the intelligent vehicle trunk. In addition, the IPC is also equipped with a GTX2080Ti Graphics Processing Unit (GPU), which can greatly increase the processing speed. The IPC and GPU are shown in Figure 16.
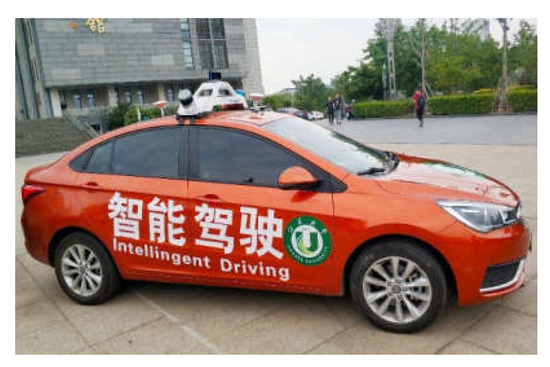
Figure 14.
Test vehicle.

Figure 15.
Industrial camera installed effect diagram.

Figure 16.
IPC and GPU: (a) IPC; (b) GPU.
The test route is selected in Zhenjiang, China. The test route includes a city expressway and an ordinary urban road, and the route covers different times and weather conditions. The total of route length is more than 20 km. The vehicle speed is in strict compliance with local regulations. We do not deliberately maintain the vehicle speed through the experiments. In this experiment, we use four state-of-the-art methods, namely SSD [23], YOLOv2 [22], YOLOv3 [24], and YOLOv5 [32] for comparison. The image display interface is shown in Figure 17. The interface includes “Start”, “Pause”, “Open Video”, and “Load Model”. We may also obtain the detection results and delay the time from the display interface. In this procedure, we detect different kinds of traffic targets in an ordinary urban road and a city expressway. Some of the detection results are shown in Figure 18.
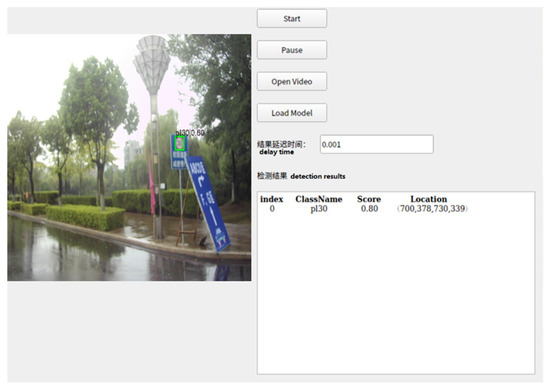
Figure 17.
Image display interface.

Figure 18.
Detection examples. (a) site 1; (b) site 2.
5.2.2. Experimental Analysis
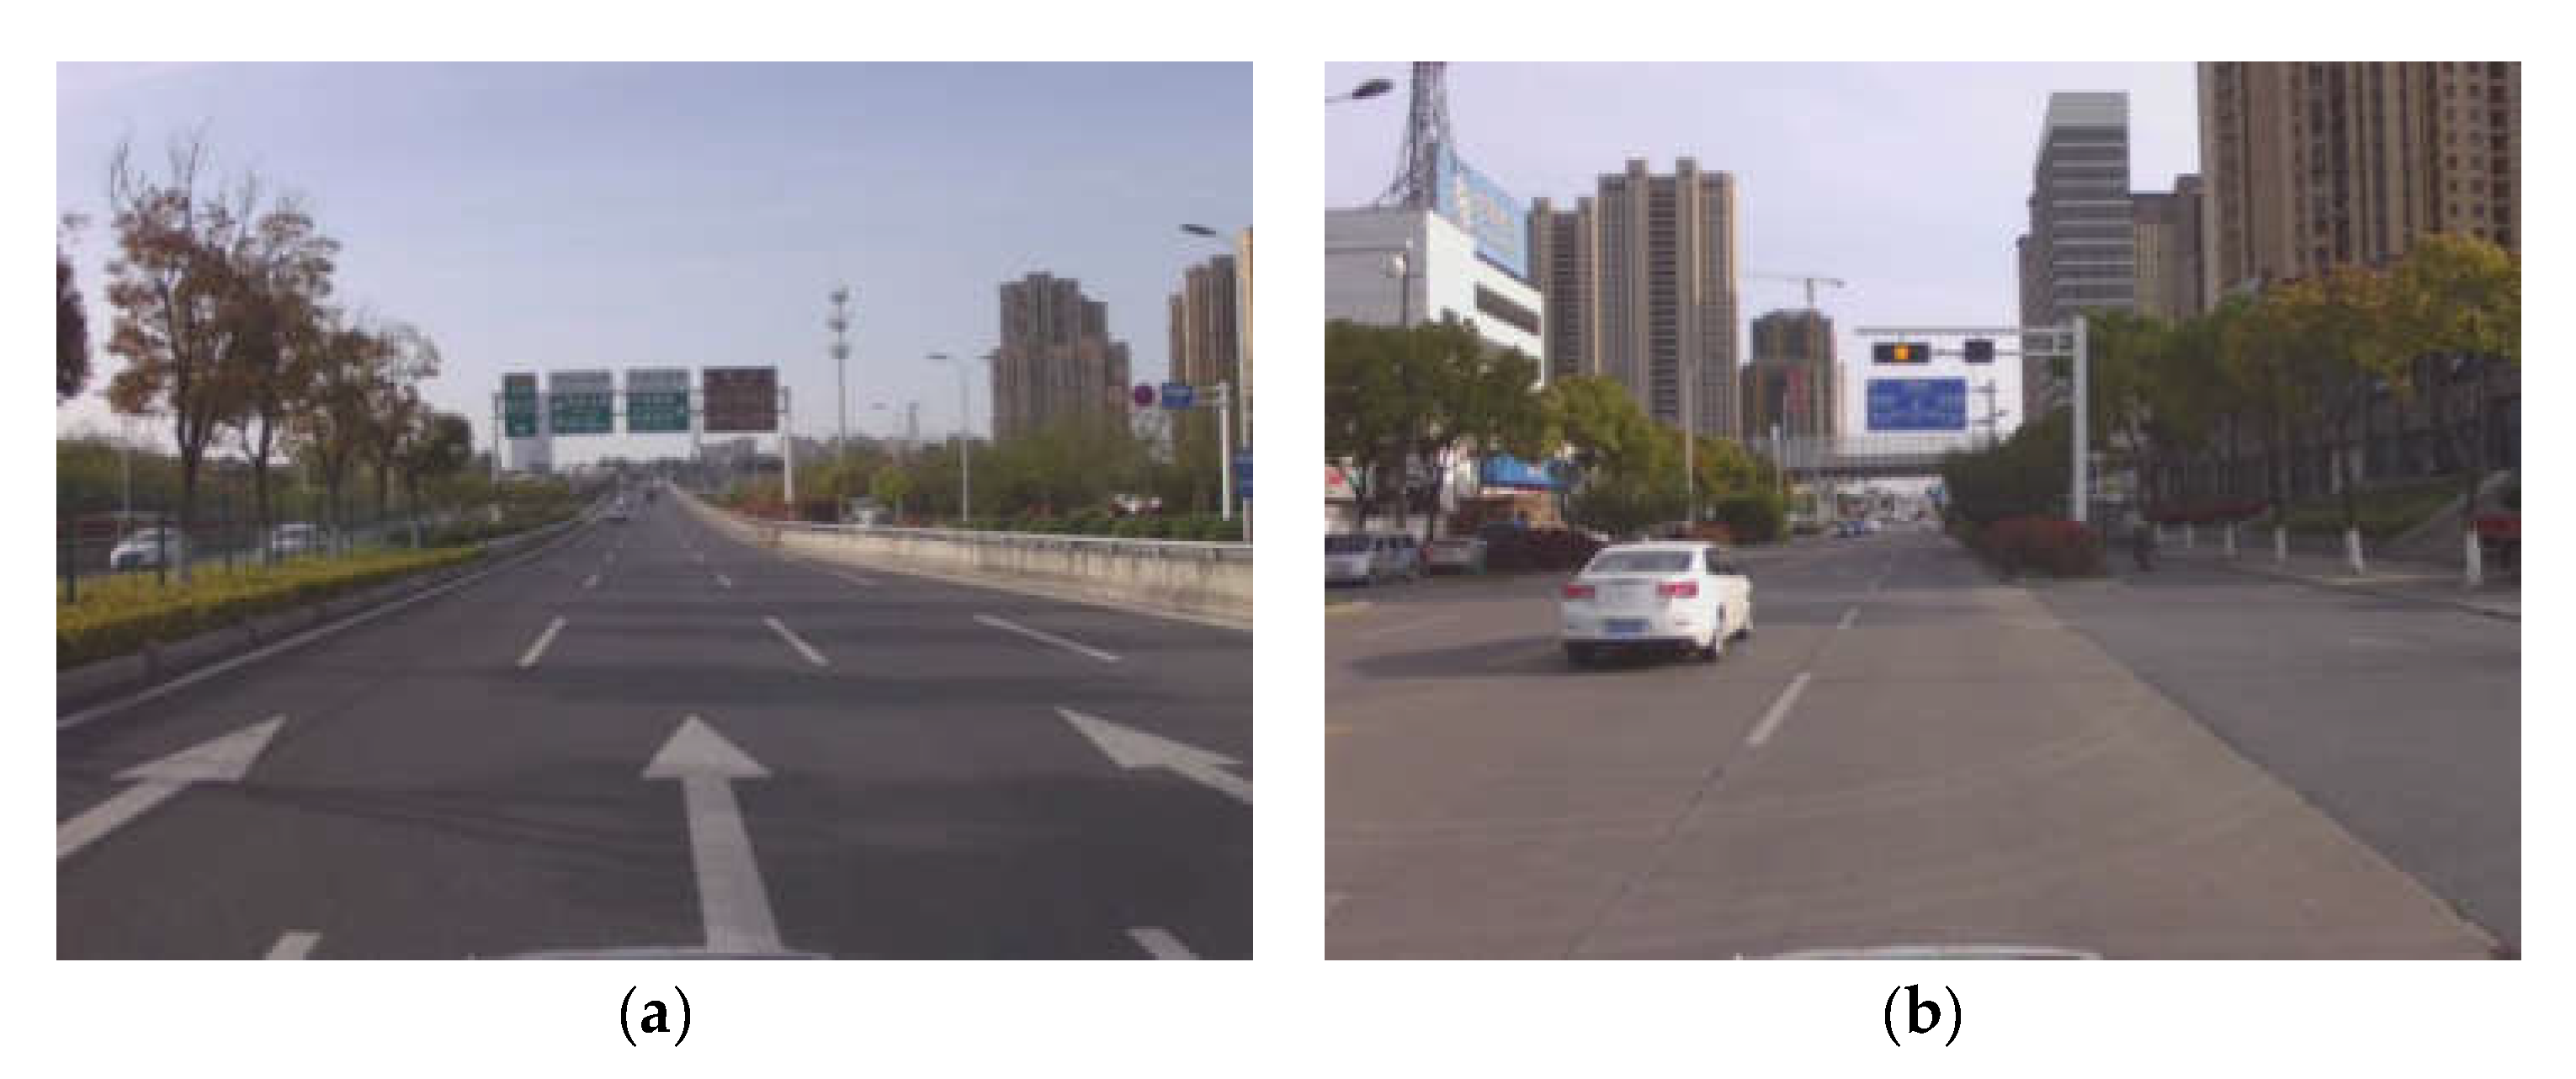
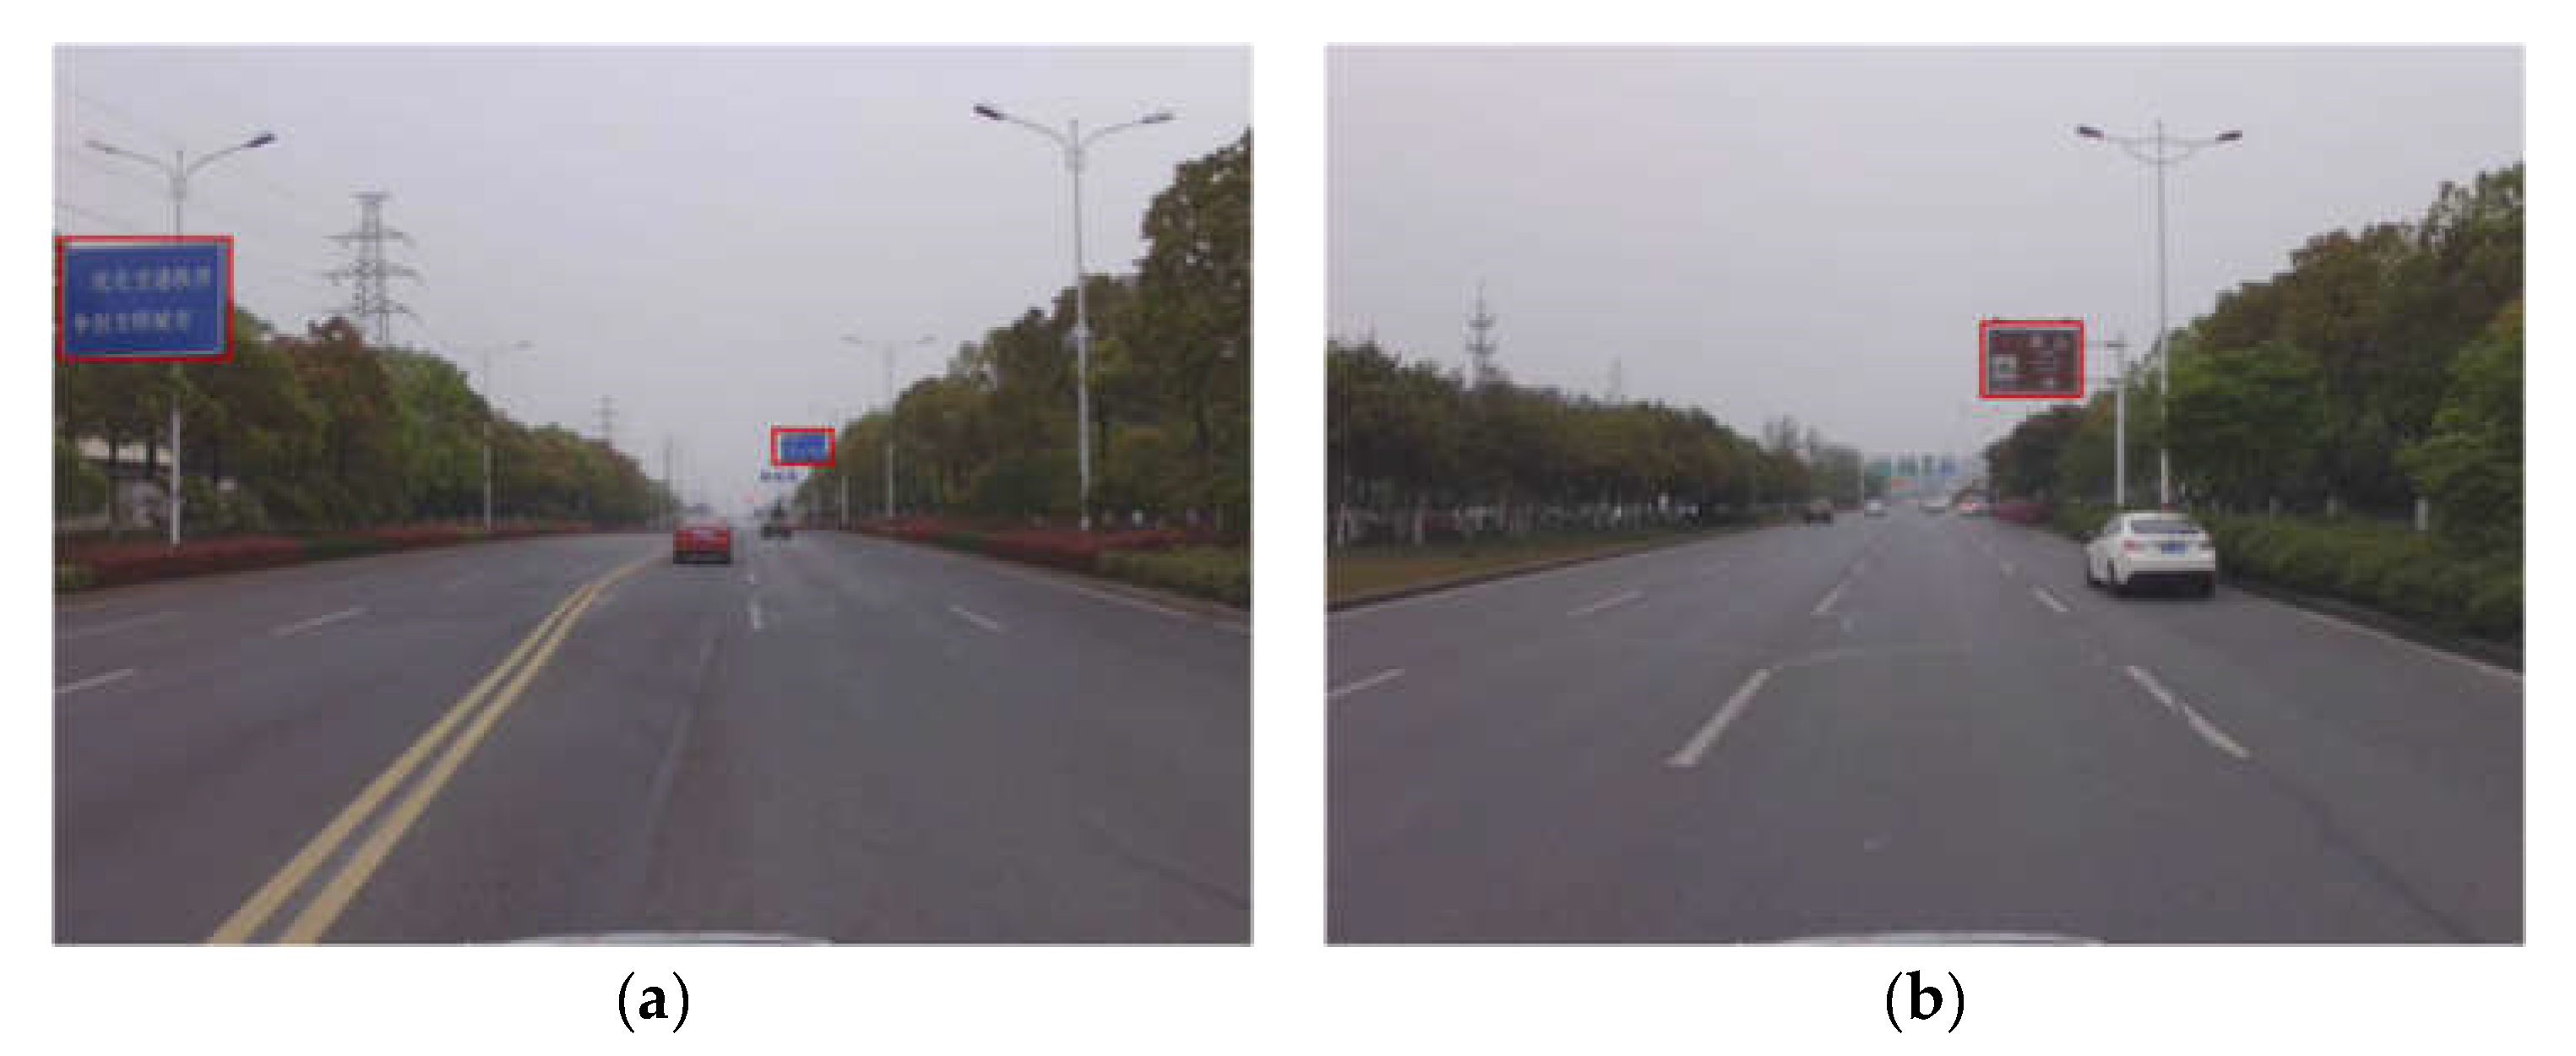
First, we conducted the traffic sign detection at different times. We collected data at 10: 00 a.m. (daytime) and at 19: 00 p.m. (sunset). Figure 19 shows the test site at daytime with different routes. There are approximately more than 500 images, including traffic signs. We use the proposed method and four compared methods to detect these signs. Figure 20 shows some of the results. From the results, we can find that the proposed method can accurately detect the traffic signs. We also divide these signs into three kinds: small sign, medium sign, and large sign. Table 4 shows the comparison results. From the table, we can find that our method has a precision of 93.2%, 90.2%, and 92.8%, in small sign, medium sign, and large sign, respectively. The results have a better performance than SSD, YOLOv2, and YOLOv3. YOLOv5 performs marginally better than our method. This is because YOLOv5 is suitable in the scenarios in which there is plenty of light.

Figure 19.
Test site at daytime: (a) city expressway; (b) ordinary urban road.
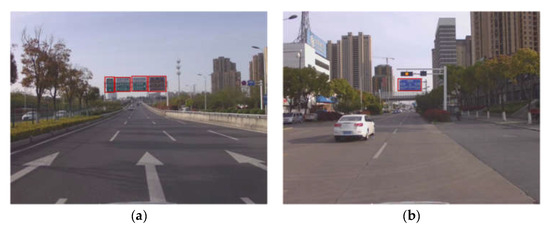
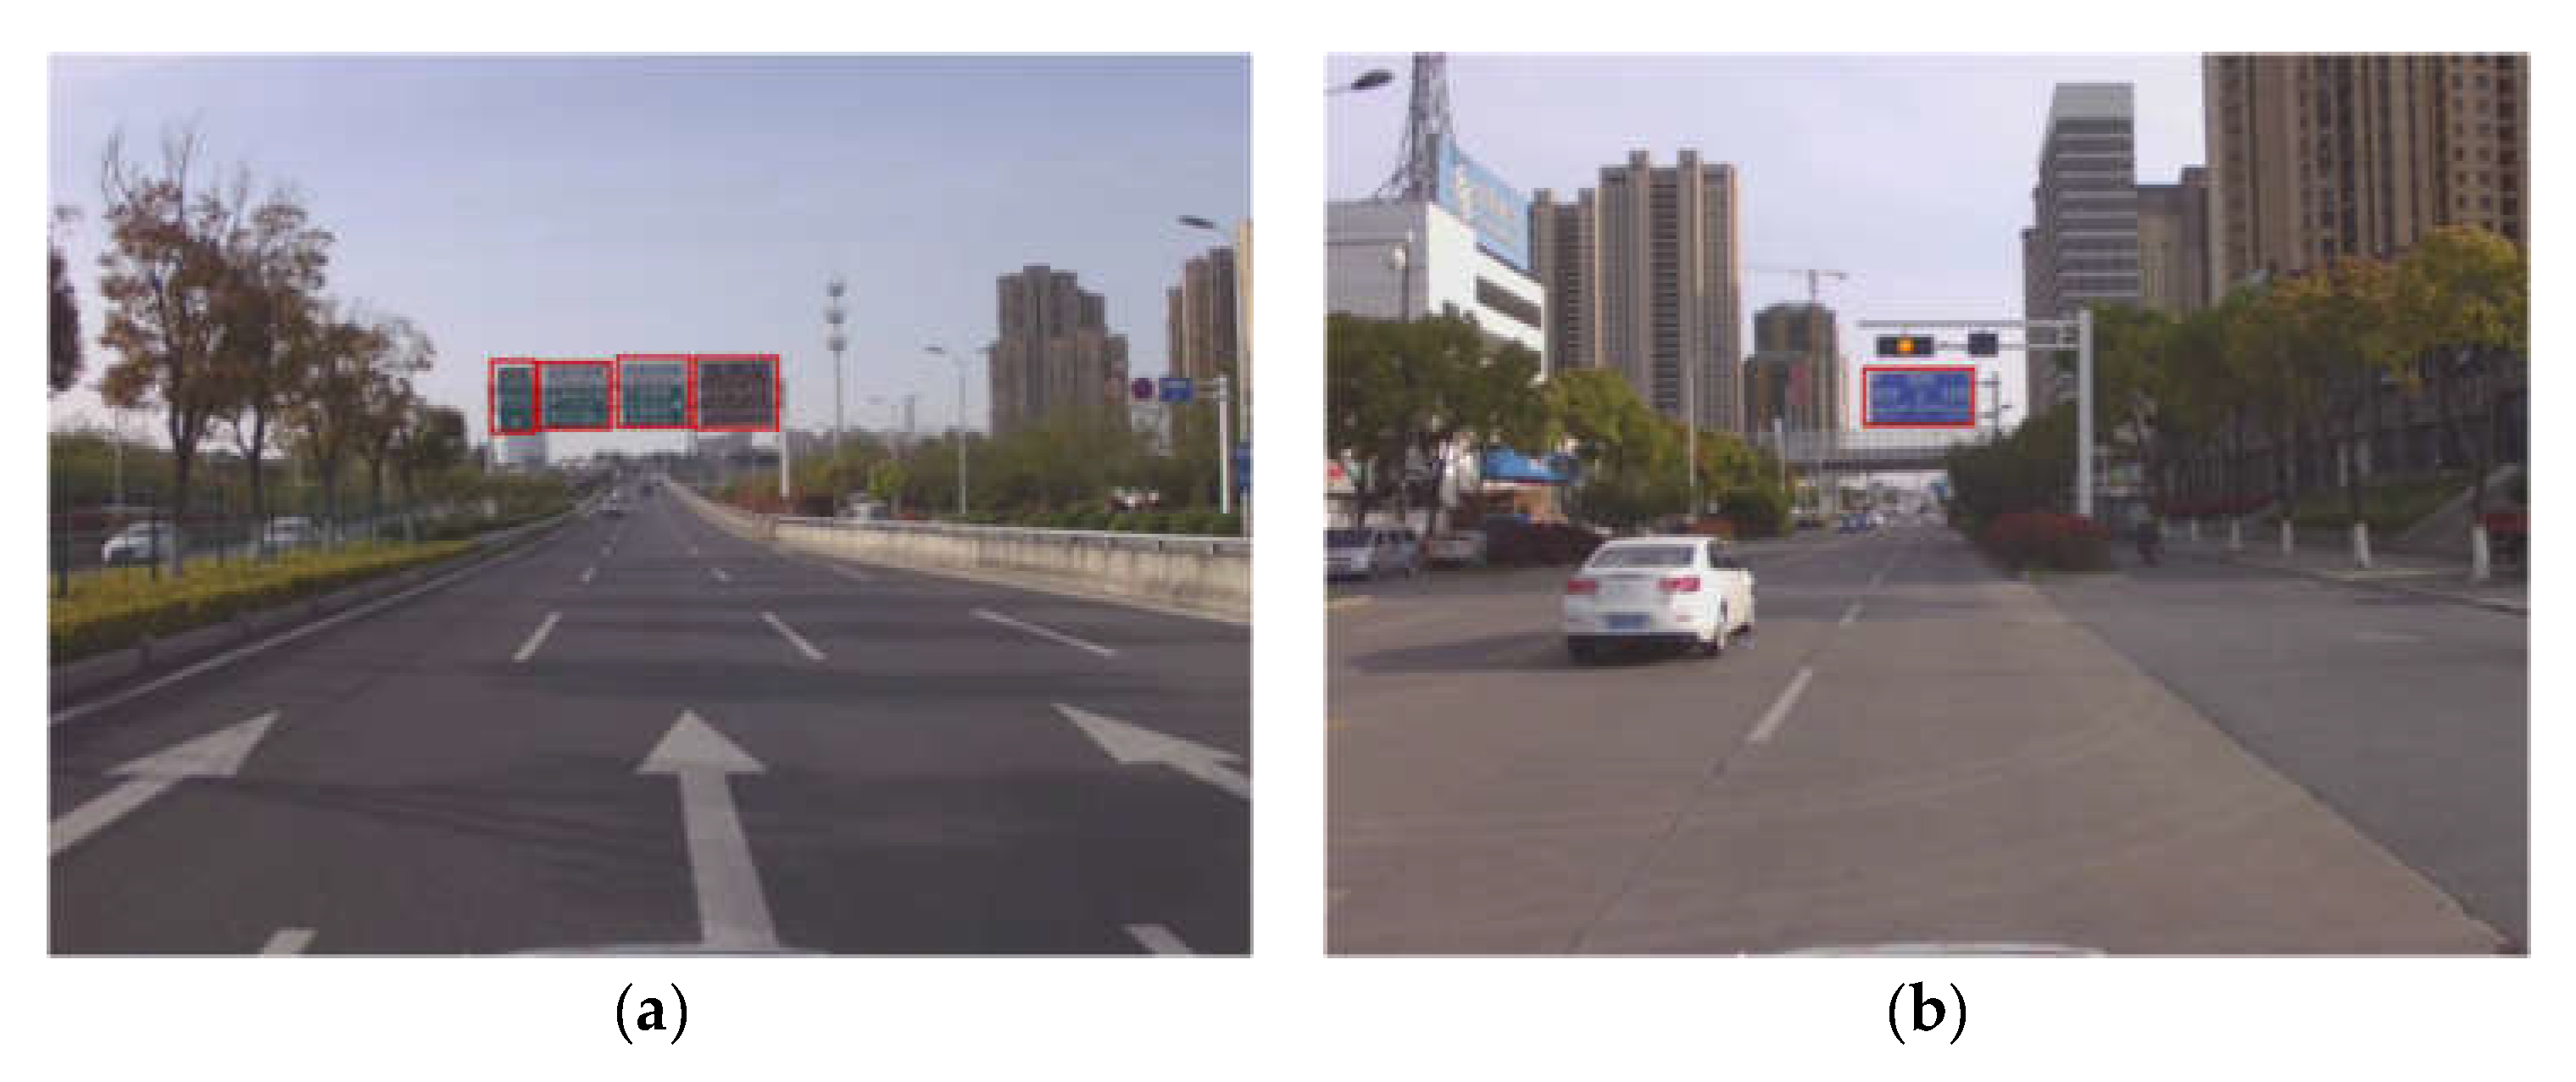
Figure 20.
Traffic sign detection results: (a) city expressway; (b) ordinary urban road.
Table 4.
Results of the comparative experiments at daytime.
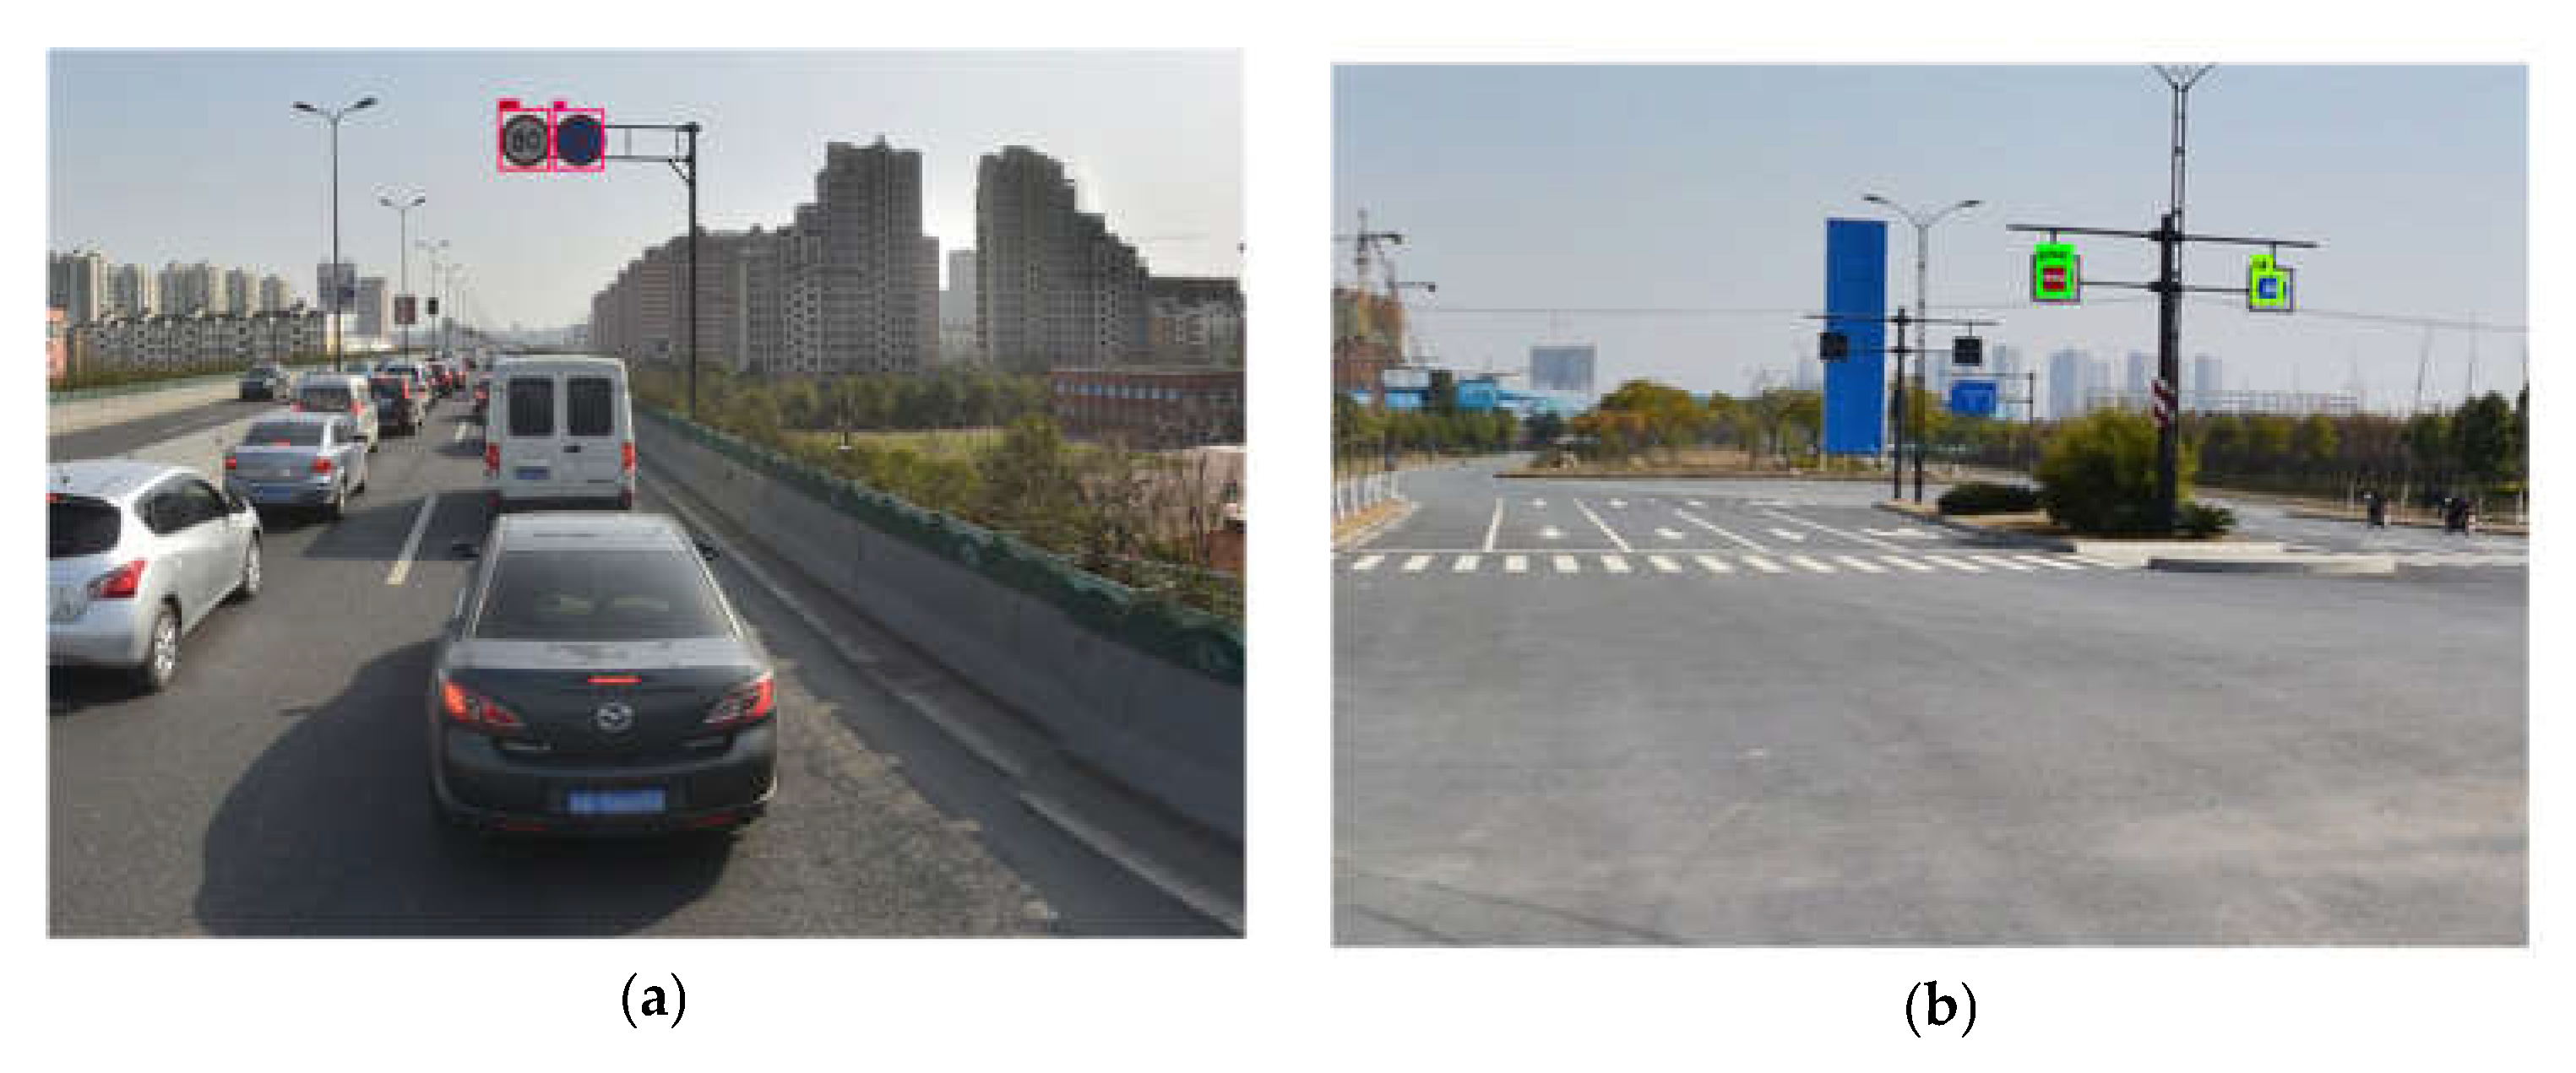
Figure 21 shows the test sites at 19: 00 p. m. (sunset). From the figure, we can find that the sunset light is much lower than the daytime light. From Figure 22, we can find that our method accurately detects the traffic signs. In this test, we also compare our method with the other four state-of-the-art methods. The comparison results are shown in Table 5. From the table, we can find that our method has a precision of 87.4%, 91.8%, and 92.2%, in small sign, medium sign, and large sign, respectively. Compared with the test at daytime, the accuracy decreases marginally. This is because the dim light can affect the traffic sign detection. Compared with the four other methods, these results showcase a better performance. The results show that the proposed method has a great robustness at different times.
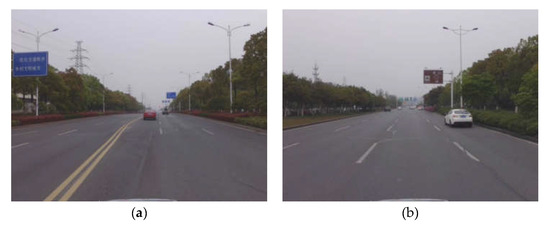
Figure 21.
Test site at sunset: (a) site 1; (b) site 2.

Figure 22.
Detection results at sunset: (a) site 1; (b) site 2.
Table 5.
Results of the comparative experiments at sunset.
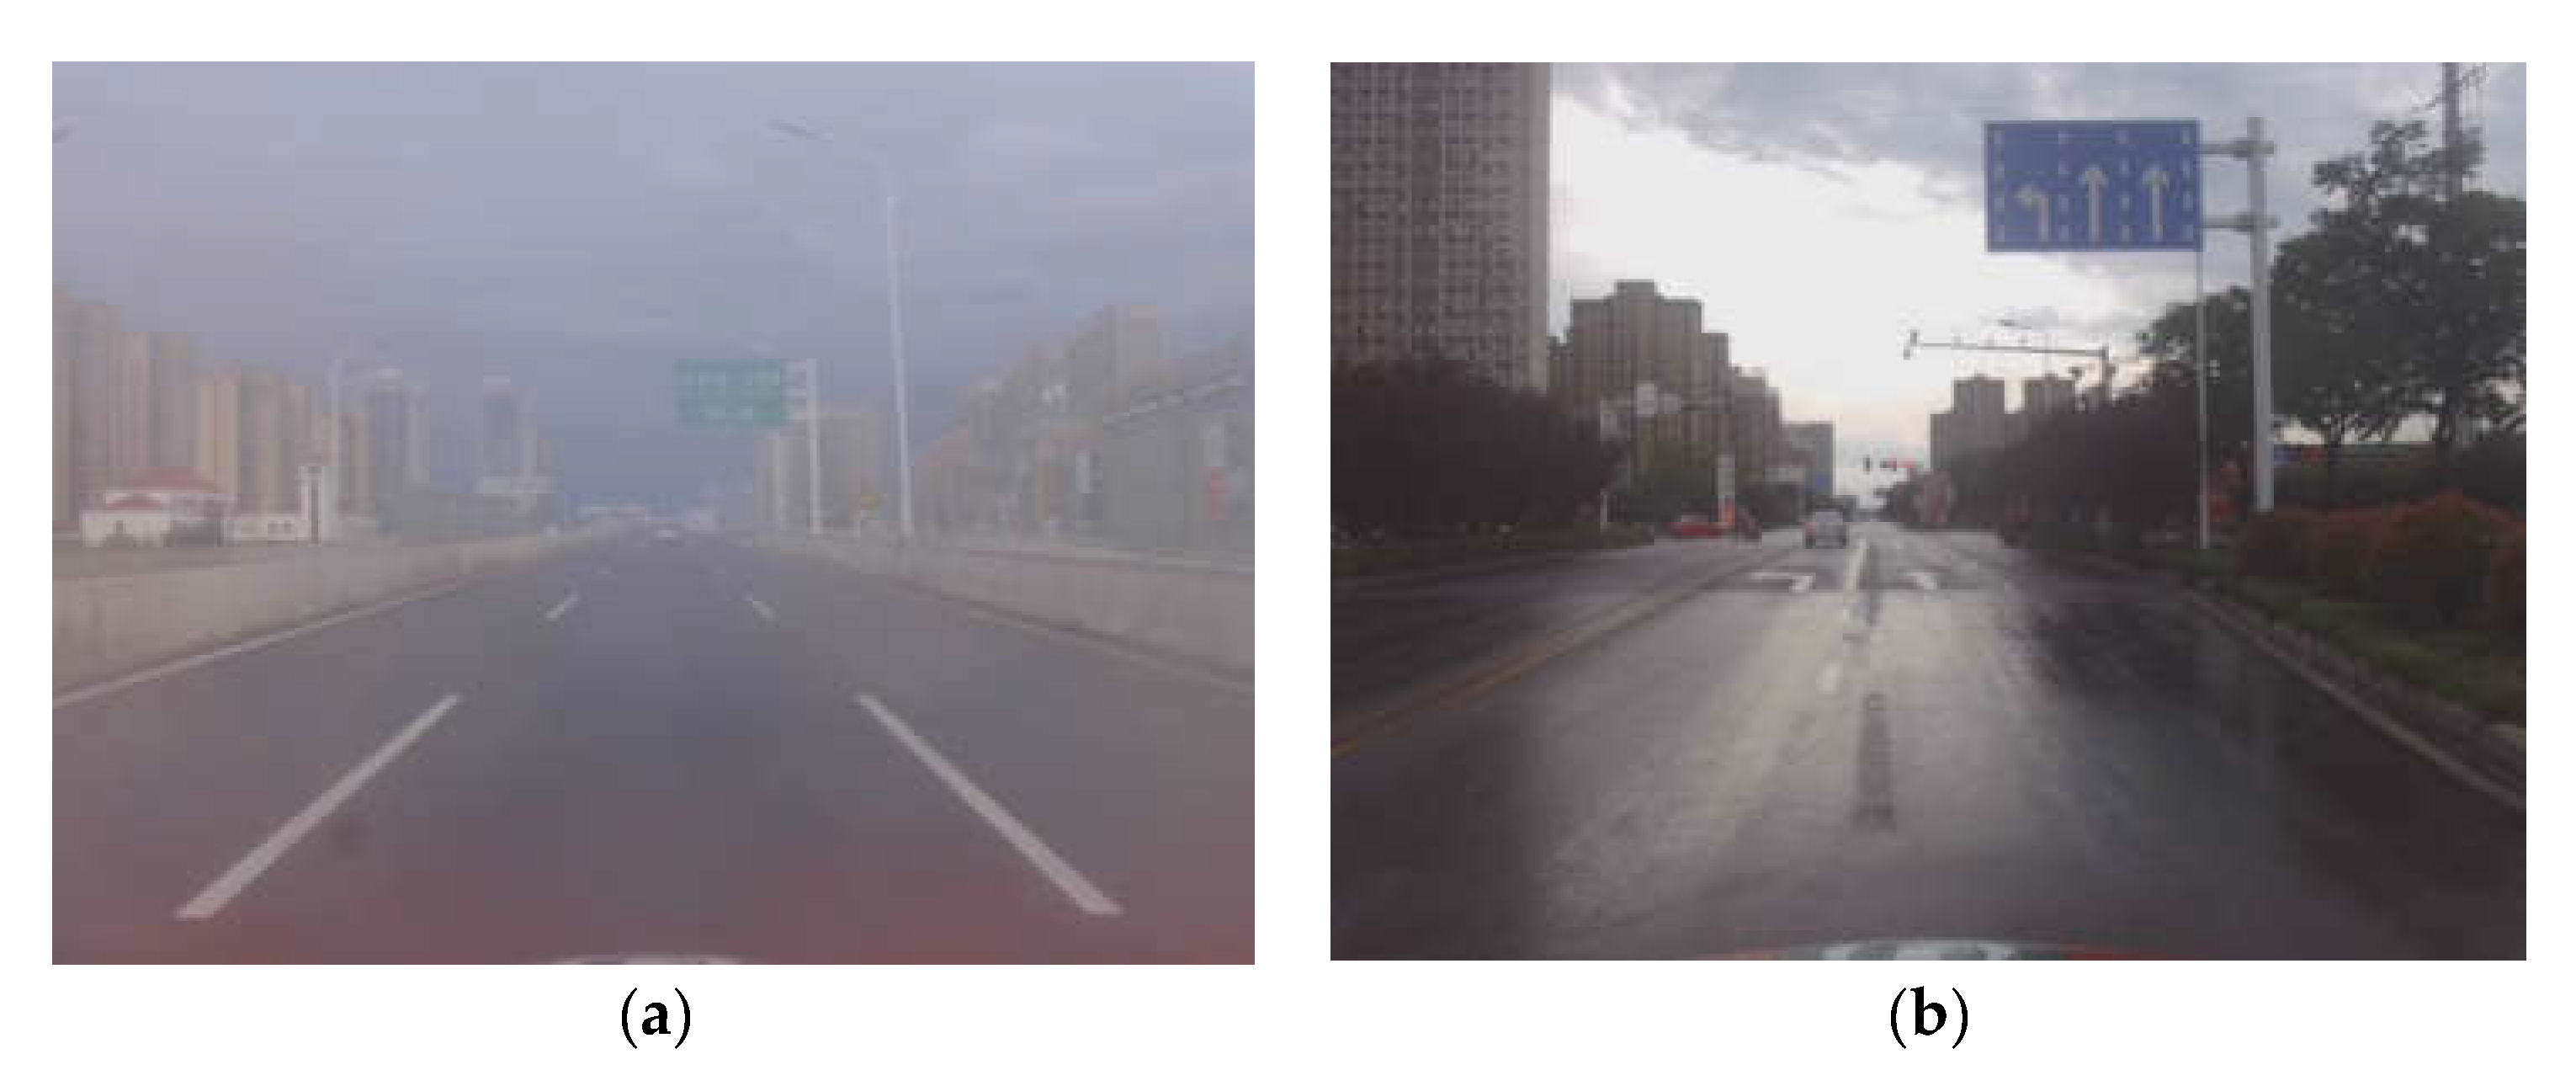
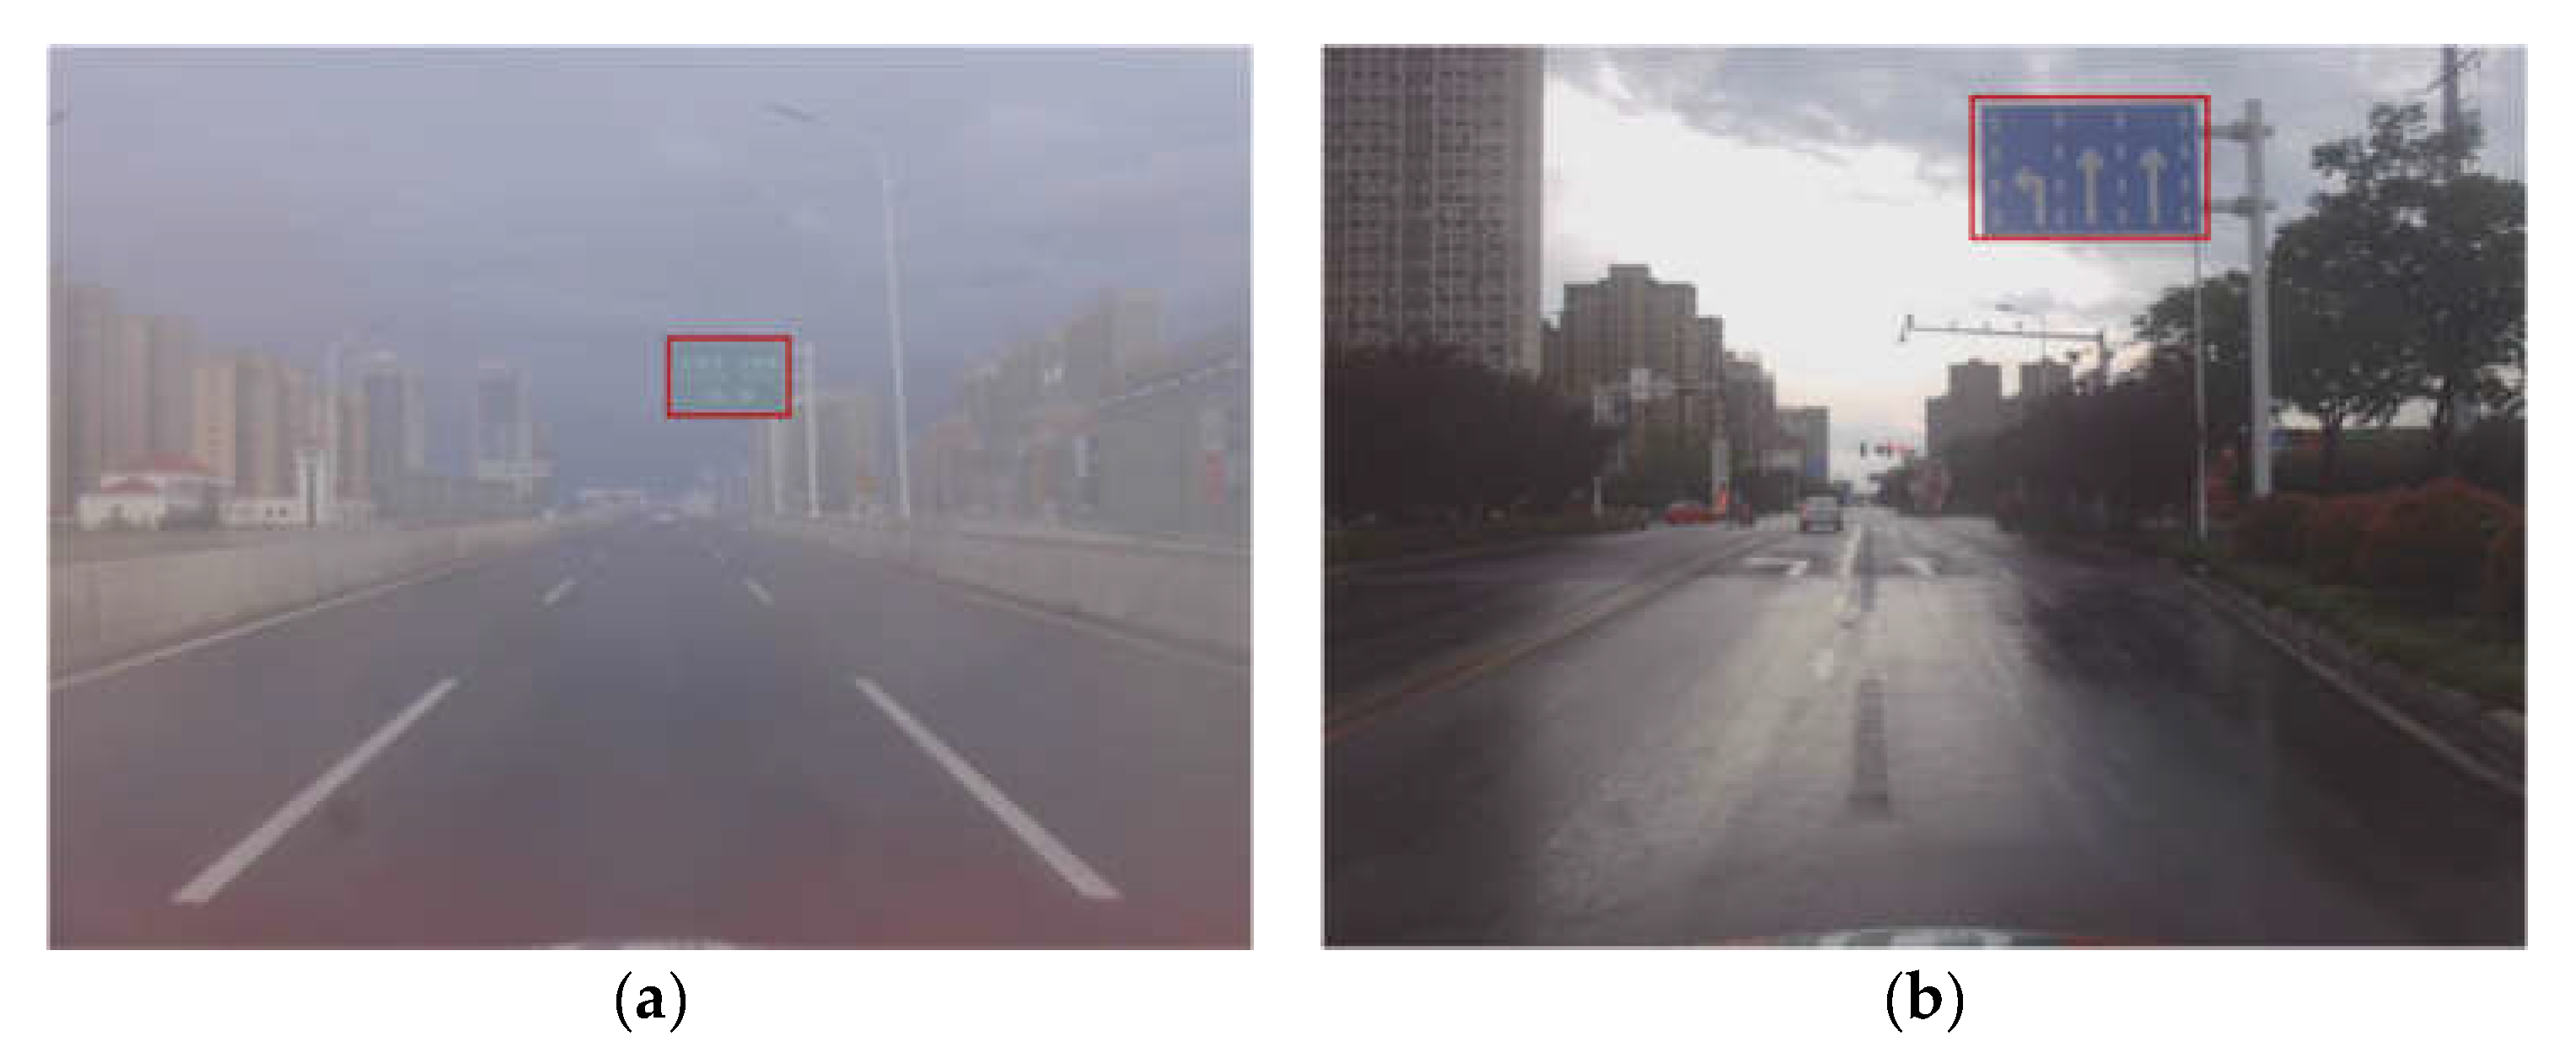
The tests at both daytime and sunset are based on a sunny day. To further evaluate the performance of the proposed method, we also conduct the experiment on a rainy day. Considering the limitations of the camera, the rainy day we selected was no characterized by heavy rain, as this may compromise the ability to see the traffic signs clearly. The test sites are shown in Figure 23. From the figure, we can find that the visibility on a rainy day is much lower than the visibility on a sunny day (both at daytime and sunset). Figure 24 shows that the traffic signs are also accurately detected by the proposed method.
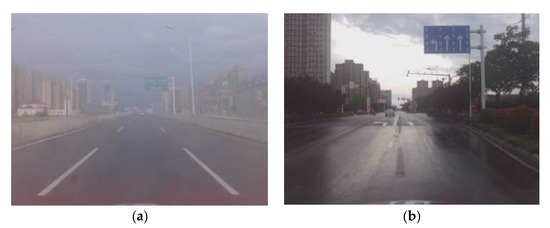
Figure 23.
Test site on rainy day: (a) city expressway; (b) ordinary urban road.
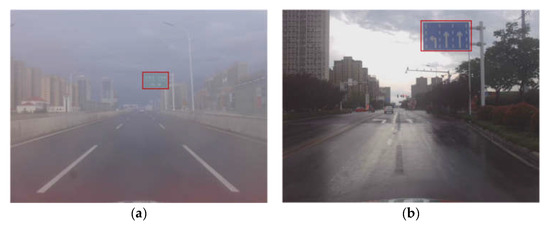
Figure 24.
Detection results on rainy day: (a) city expressway; (b) ordinary urban road.
To further evaluate the proposed method, we also conduct the four state-of-the-art methods, namely SSD, YOLOv2, YOLOv3, and YOLOv5, for comparison. The comparison results are shown in Table 6. From the table, we can find that our method has a precision of 85.3%, 88.4%, and 82.1%, in small sign, medium sign, and large sign, respectively. Although the detection accuracy is marginally lower than the test on a sunny day, the proposed method still performs better than the four other methods. It can be seen that the proposed method displays great robustness on different weather conditions.
Table 6.
Results of the comparative experiments on rainy day.
Last, we can draw the following conclusions:
- (1)
- The proposed method performs mAPs of 92.6%, 90.6%, and 86.9% at sunny daytime, sunny sunset, and on a rainy day, respectively. Although the precisions are proportional to the intensity, all the precisions are over 86%. This demonstrates that the proposed method has a high precision and robustness at different conditions.
- (2)
- Compared with SSD, YOLOv2, and YOLOv5, the proposed method exhibits better performance regardless of times or weather conditions. This proves that our method has a higher precision and is more robust than these three methods.
- (3)
- Although YOLOv5 has a higher precision at sunny daytime (mAP of 94.8% and 92.6%), when the intensity is low (sunset or rainy day), the proposed method displays a better performance than YOLOv5 (mAP of 87.6% and 90.6% at sunset, mAP of 76.6% and 86.9% on a rainy day). This proves that our method can maintain a high precision in extreme environments. This makes our method much more practical than others.
Traffic sign detection is one of the core challenges for intelligent vehicles. It can help intelligent vehicles know the traffic rules of driving routes in real time. With the improvement of the automatic driving level for intelligent vehicles, the traffic sign detection accuracy, especially in low-light intensity and rainy weather, directly determines the control accuracy. The proposed method has a high precision (90.6% at sunset and 86.9% on a rainy day) in extreme environments. Therefore, the proposed method is helpful in order to improve the accuracy of environment sensing and the development of autonomous driving, as well as to improve the traffic sign detection performance in extreme environments.
6. Conclusions
In this study, the detection algorithm model of the Faster R-CNN is first introduced in detail, and then the FPN module is introduced on the basis of the original network of the Faster R-CNN algorithm. Furthermore, the ROI pooling is replaced by ROI align and the DCN is added to the backbone network for improvement. The model is trained on the TT100K dataset and the real intelligent vehicle test, and the final experimental results indicate that the improved Faster R-CNN algorithm exhibits considerable improvement in the detection accuracy compared with the original Faster R-CNN algorithm and four other state-of-the-art methods. This proves that the traffic sign detection method in this study improves the detection accuracy of traffic signs and is more practical than others. However, the detection time of the Faster R-CNN is extremely high in order to meet the requirements of intelligent driving for the detection of speed in this study. Therefore, the improved Faster R-CNN model should be further optimized to meet the requirements of real-time detection.
Author Contributions
Methodology, X.G. and K.W.; Formal analysis, K.W., X.X. and X.G.; Investigation and Resources, Y.L. and H.W. writing—original draft preparation, X.G. writing—review and editing and supervision: L.C. and Y.L. All authors have read and agreed to the published version of the manuscript.
Funding
The work presented in this paper was supported by Natural Science Foundation of Jiangsu Province (BK20190853), National Natural Science Foundation of China (61906076, U20A20333, 52002154). The Key Research and Development Program of Jiangsu Province (BE2020083-2, BE2021011-2).
Conflicts of Interest
The authors declare no conflict of interest.
References
- Poczter, S.L.; Jankovic, L.M. The Google Car: Driving Toward A Better Future. Bus. Case Stud. 2013, 10, 7–14. [Google Scholar] [CrossRef]
- Chen, Z.J.; Wu, C.Z.; Zhang, Y.S.; Huang, Z.; Jiang, J.F.; Lyu, N.C.; Ran, B. Vehicle behavior learning via sparse reconstruction with l2-lp minimization and trajectory similarity. IEEE Trans. Intell. Transp. Syst. 2017, 18, 236–247. [Google Scholar] [CrossRef]
- Cai, Y.; Luan, T.; Gao, H.; Wang, H.; Chen, L.; Li, Y.; Sotelo, M.A.; Li, Z. YOLOv4-5D: An Effective and Efficient Object Detector for Autonomous Driving. IEEE Trans. Instrum. Meas. 2021, 70, 4503613. [Google Scholar] [CrossRef]
- Chen, Z.; Lu, Z.; Chen, Q.; Zhong, H.; Zhang, Y.; Xue, J.; Wu, C. A Spatial–temporal short-term traffic flow prediction model based on dynamical-learning graph convolution mechanism. arXiv 2022, arXiv:2205.04762. [Google Scholar] [CrossRef]
- Wang, H.; Chen, Z.; Cai, Y.; Chen, L.; Li, Y.; Sotelo, M.A.; Li, Z. Voxel-RCNN-Complex: An Effective 3-D Point Cloud Object Detector for Complex Traffic Conditions. IEEE Trans. Instrum. Meas. 2022, 71, 2507112. [Google Scholar] [CrossRef]
- Chen, G.; Chen, K.; Zhang, L.; Zhang, L.; Knoll, A. VCANet: Vanishing-Point-Guided Context-Aware Network for Small Road Object Detection. Automot. Innov. 2021, 4, 400–412. [Google Scholar] [CrossRef]
- Suetake, N.; Uchino, E.; Hirata, K. Generalized Fuzzy Hough Transform for Detecting Arbitrary Shapes in a Vague and Noisy Image. Soft Comput. 2006, 10, 1161–1168. [Google Scholar] [CrossRef]
- Wang, H.; Chen, Y.; Cai, Y.; Chen, L.; Li, Y.; Sotelo, M.A.; Li, Z. SFNet-N: An Improved SFNet Algorithm for Semantic Segmentation of Low-Light Autonomous Driving Road Scenes. IEEE Trans. Intell. Transp. Syst. 2022, 1–13. [Google Scholar] [CrossRef]
- Peng, L.; Wang, H.; Li, J. Uncertainty Evaluation of Object Detection Algorithms for Autonomous Vehicles. Automot. Innov. 2021, 4, 241–252. [Google Scholar] [CrossRef]
- Chen, Z.; Chen, D.; Zhang, Y.; Cheng, X.; Zhang, M.; Wu, C. Deep learning for autonomous ship-oriented small ship detection. Saf. Sci. 2020, 130, 104812. [Google Scholar] [CrossRef]
- Chen, Z.; Cai, H.; Zhang, Y.; Wu, C.; Mu, M.; Li, Z.; Sotelo, M.A. A novel sparse representation model for pedestrian abnormal trajectory understanding. Expert Syst. Appl. 2019, 138, 112753. [Google Scholar] [CrossRef]
- Zhu, Z.; Liang, D.; Zhang, S.; Huang, X.; Li, B.; Hu, S. Traffic-Sign Detection and Classification in the Wild. In Proceedings of the IEEE Conference on Computer Vision and Pattern Recognition (CVPR), Las Vegas, NV, USA, 27–30 June 2016; pp. 2110–2118. [Google Scholar]
- Xie, Y.; Liu, L.F.; Li, C.H.; Qu, Y.Y. Unifying visual saliency with HOG feature learning for traffic sign detection. In Proceedings of the 2009 IEEE Intelligent Vehicles Symposium, Xi’an, China, 3–5 June 2009; pp. 24–29. [Google Scholar]
- Yang, Y.; Wu, F. Real-Time Traffic Sign Detection via Color Probability Model and Integral Channel Features. In Communications in Computer and Information Science, Proceedings of the 6th Chinese Conference on Pattern Recognition, Changsha, China, 17–19 November 2014; Springer: Berlin/Heidelberg, Germany, 2014; pp. 545–554. [Google Scholar] [CrossRef]
- García-Garrido, M.Á.; Sotelo, M.Á.; Martín-Gorostiza, E. Fast road sign detection using Hough transform for assisted driving of road vehicles. In Computer Aided Systems Theory—EUROCAST 2005, Proceedings of the 10th International Conference on Computer Aided Systems Theory, Las Palmas de Gran Canaria, Spain, 7–11 February 2005; Springer: Berlin/Heidelberg, Germany, 2005; pp. 543–548. [Google Scholar]
- Boumediene, M.; Cudel, C.; Basset, M.; Ouamri, A. Triangular traffic signs detection based on RSLD algorithm. Mach. Vis. Appl. 2013, 24, 1721–1732. [Google Scholar] [CrossRef]
- Krizhevsky, A.; Sutskever, I.; Hinton, G.E. Imagenet classification with deep convolutional neural networks. Commun. ACM 2012, 60, 84–90. [Google Scholar] [CrossRef]
- Zhang, S.; Bauckhage, C.; Cremers, A.B. Informed Haar-Like Features Improve Pedestrian Detection. In Proceedings of the IEEE Conference on Computer Vision and Pattern Recognition, Columbus, OH, USA, 24–27 June 2014; pp. 947–954. [Google Scholar]
- Girshick, R.; Donahue, J.; Darrell, T.; Malik, J. Rich Feature Hierarchies for Accurate Object Detection and Semantic Segmentation. In Proceedings of the IEEE Conference on Computer Vision and Pattern Recognition, Columbus, OH, USA, 24–27 June 2014; pp. 580–587. [Google Scholar]
- Girshick, R. Fast R-CNN. In Proceedings of the IEEE International Conference on Computer Vision, Washington, DC, USA, 7–13 December 2015; pp. 1440–1448. [Google Scholar]
- Ren, S.; He, K.; Girshick, R.; Sun, J. Faster R-CNN: Towards Real-Time Object Detection with Region Proposal Networks. IEEE Trans. Pattern Anal. Mach. Intell. 2016, 39, 1137–1149. [Google Scholar] [CrossRef]
- Redmon, J.; Farhadi, A. YOLO9000: Better, Faster, Stronger. In Proceedings of the IEEE Conference on Computer Vision & Pattern Recognition, Honolulu, HI, USA, 21–26 July 2017; pp. 6517–6525. [Google Scholar]
- Liu, W.; Anguelov, D.; Erhan, D.; Szegedy, C.; Reed, S.; Fu, C.Y.; Berg, A.C. SSD: Single Shot MultiBox Detector. In Computer Vision—ECCV 2016, Proceedings of the European Conference on Computer Vision, Amsterdam, The Netherlands, 11–14 October 2016; Springer International Publishing: Berlin/Heidelberg, Germany, 2016; pp. 21–37. [Google Scholar]
- Redmon, J.; Farhadi, A. YOLOv3: An Incremental Improvement. arXiv 2018, arXiv:1804.02767. [Google Scholar]
- He, K.; Zhang, X.; Ren, S.; Sun, J. Deep Residual Learning for Image Recognition. In Proceedings of the IEEE Conference on Computer Vision and Pattern Recognition, Las Vegas, NV, USA, 27–30 June 2016; pp. 770–778. [Google Scholar]
- Mao, Q.C.; Sun, H.M.; Liu, Y.B.; Jia, R.S. Mini-YOLOv3: Real-Time Object Detector for Embedded Applications. IEEE Access 2019, 7, 133529–133538. [Google Scholar] [CrossRef]
- Kuznetsova, A.; Maleva, T.; Soloviev, V. Detecting Apples in Orchards Using YOLOv3 and YOLOv5 in General and Close-Up Images. In Proceedings of the International Symposium on Neural Networks, Cairo, Egypt, 4–6 December 2020; pp. 233–243. [Google Scholar]
- Xing, J.; Yan, W.Q. Traffic Sign Recognition Using Guided Image Filtering. In Geometry and Vision, Proceedings of the First International Symposium, ISGV 2021, Auckland, New Zealand, 28–29 January 2021; Springer: Berlin/Heidelberg, Germany, 2021; Volume 1386, pp. 85–99. [Google Scholar] [CrossRef]
- Xu, S.; Niu, D.; Tao, B.; Li, G. Convolutional Neural Network Based Traffic Sign Recognition System. In Proceedings of the 5th International Conference on Systems and Informatics (ICSAI), Nanjing, China, 10–12 November 2018; pp. 957–961. [Google Scholar] [CrossRef]
- Sun, Y.; Sun, C.; Wang, D.; He, Y.; Lu, H. ROI Pooled Correlation Filters for Visual Tracking. In Proceedings of the 2019 IEEE/CVF Conference on Computer Vision and Pattern Recognition (CVPR), Long Beach, CA, USA, 15–20 June 2019; p. 19262751. [Google Scholar]
- He, K.; Gkioxari, G.; Dollár, P.; Girshick, R. Mask R-CNN. In Proceedings of the IEEE International Conference on Computer Vision, Venice, Italy, 22–29 October 2017; pp. 2980–2988. [Google Scholar]
- Zhu, Y.; Yan, W.Q. Traffic sign recognition based on deep learning. Multimedia Tools Appl. 2022, 81, 17779–17791. [Google Scholar] [CrossRef]
- Simonyan, K.; Zisserman, A. Very Deep Convolutional Networks for Large-Scale Image Recognition. arXiv 2014, arXiv:1409.1556. [Google Scholar]
- Purkait, P.; Zhao, C.; Zach, C. SPP-Net: Deep Absolute Pose Regression with Synthetic Views. arXiv 2017, arXiv:1712.03452. [Google Scholar]
- Adelson, E.H.; Anderson, C.H.; Bergen, J.R.; Burt, P.J.; Ogden, J.M. Pyramid methods in image processing. RCA Eng. 1984, 29, 33–41. [Google Scholar]
- Lin, T.Y.; Dollár, P.; Girshick, R.; He, K.; Hariharan, B.; Belongie, S. Feature Pyramid Networks for Object Detection. In Proceedings of the IEEE Conference on Computer Vision and Pattern Recognition, Honolulu, HI, USA, 21–26 July 2017; pp. 936–944. [Google Scholar]
- Dai, J.; Qi, H.; Xiong, Y.; Li, Y.; Zhang, G.; Hu, H.; Wei, Y. Deformable Convolutional Networks. In Proceedings of the 16th IEEE International Conference on Computer Vision, Venice, Italy, 22–29 October 2017; pp. 764–773. [Google Scholar]
- Stefan, K.; Josien, P.; Marius, S.; Max, A. Adaptive Stochastic Gradient Descent Optimisation for Image Registration. Int. J. Comput. Vis. 2009, 81, 227–239. [Google Scholar]


Publisher’s Note: MDPI stays neutral with regard to jurisdictional claims in published maps and institutional affiliations. |
© 2022 by the authors. Licensee MDPI, Basel, Switzerland. This article is an open access article distributed under the terms and conditions of the Creative Commons Attribution (CC BY) license (https://creativecommons.org/licenses/by/4.0/).