Article

A Petri Net-Based Power Supply Recovery Strategy for the Electric Power System of Floating Nuclear Power Plant

1
State Key Laboratory of Advanced Electromagnetic Engineering and Technology, Huazhong University of Science and Technology, 1037 Luoyu Road, Wuhan 430074, China
2
Department of Electrical Engineering and Electronics, The University of Liverpool, Liverpool L69 3BX, UK
*
Author to whom correspondence should be addressed.
Appl. Sci. 2022, 12(18), 9026; https://doi.org/10.3390/app12189026
Submission received: 7 August 2022 / Revised: 2 September 2022 / Accepted: 7 September 2022 / Published: 8 September 2022
(This article belongs to the Section Energy Science and Technology)

Abstract

:
Floating nuclear power plants contain sensitive loads of nuclear reactors. After equipment faults, fast and efficient power supply recovery should be realized. To realize the unified analysis of system topology and power flow distribution, a power supply recovery strategy based on Petri nets is proposed. Considering that systems of different voltage levels cannot be connected instantaneously, a two-stage power supply recovery mode is adopted. Emergency power supply is put in first, and then the whole network is reconstructed. In the network reconstruction process, load transfer is realized through switching the transformation to redistribute the load of each switchboard and adjust the power output of each power source. Corresponding to the Petri net model, the above process is similar to the dynamic transmission process of a token in each library by firing the transition. Therefore, the topological model of system is constructed based on the Petri net, and a power flow analysis is proposed through its dynamic updating mechanism. The objective function of the network reconstruction is established by integrating load recovery amount, switch operation cost and generator operation efficiency, and the optimal switching state combination scheme that satisfies the system constraints is obtained by the multi-population genetic algorithm (MPGA). Simulation results show that the proposed method can provide complete power supply recovery.

1. Introduction

Floating nuclear power plants combine marine engineering, nuclear engineering and electrical engineering [1,2]. Their power systems include a medium-voltage power generation system, low-voltage internal power system and high-voltage external power system [3]. Compared with ordinary shipboard power systems, the floating nuclear power plant needs to supply power continuously to the reactor loads, whose power supply interruption will affect the safe operation of the whole plant [4,5]. Under emergency conditions, the system should input emergency power, change the power supply path and unload non-critical loads to ensure the power supply reliability of critical loads. To ensure the safe and efficient operation of the system after faults, it is necessary to propose an effective power supply recovery strategy.
Power supply recovery refers to changing the status of switches in the power system after a failure to find a new power supply path to provide available power for the power-losing loads [6]. For the shipboard power system, maximum load recovery [7] and minimum switching operation [8] are mainly considered. On this basis, for the distribution network, the minimum power losses [9,10] and the highest reliability [11,12] should also be considered. In floating nuclear power plants, different loads have different impacts on the system safety, and the sensitive loads of nuclear reactors should be given a higher priority when the power supply is restored. When the power supply is transferred between different voltage levels in the system, pre-magnetization is required [13]. The process is complex and takes a certain amount of time. Therefore, the operation cost of different switches should be distinguished when changing the topological structure. In addition, the actual capacity of the generator in the system is designed to be close to the load demand. The generator should operate at the rated power state as far as possible to ensure the operation efficiency.
In the floating nuclear power plant, generators and loads are directly connected to the power distribution board. The power supply lines are short, so the power loss and voltage sag caused by line impedance can be neglected. However, all components in the system should have unified topological structure analysis and power flow analysis. Topological analysis for the shipboard power system is an important basis for power flow analysis. At present, the commonly used topology analysis methods for the shipboard power system include the adjacency matrix method [14,15] and the tree search method [16]. The adjacency matrix is based on the node/branch model. The connection relationship between any two nodes in the network is determined by analyzing the adjacency matrix of the network. The tree search method is used to search the adjacent nodes of a node for topology analysis. The different search methods are into depth-first or breadth-first. The above two topology analysis methods have simple data organization ability and strong adaptability. However, topology analysis and power flow analysis are required to interact efficiently when the power supply of the system is restored, and whether the topology meets the safe operation requirements should be verified by line power flow and generator output constraints.
For the power flow analysis, traditional methods such as the Newton–Raphson method and PQ decomposition cannot be applied effectively in the plant system [17]. This is because each part of the floating nuclear power plant adopts the radial network, and the number of branches and nodes is large. Thus, the condition number of the network Jacobian matrix is large, and the calculation process is difficult to converge. In addition, the R/X value of the line is relatively high, which does not meet the conditions of PQ decomposition, and fast decomposition is not applicable. To solve the above problems, the forward–backward method [18], DistFlow [19], bus impedance [20] and other methods are proposed for the power analysis of shipboard power systems that can quickly calculate power flow. However, for the floating nuclear power plant, when there is an out-of-power generator, other generators are needed to realize power transfer. To ensure the operation efficiency of the generators, the power output among the generators should be distributed based on the rated capacity. Therefore, power output and distribution must be calculated by optimal power flow management. This increases the complexity of power flow analysis, which cannot be achieved by existing methods.
The methods of solving network topology reconstruction after power system failure mainly include multi-agent systems [21,22], the heuristic method [23] and intelligent optimization algorithm [24,25]. Among these, intelligent optimization has a high search efficiency and can solve the algorithm nonconvergence problem in a high-dimensional system. It is widely used in power system network reconstruction. Intelligent optimization methods mainly include genetic [26] and particle swarm optimization [27] algorithms. The above method is simple in operation and requires few parameters to be adjusted, so the optimal solution can be quickly searched for. However, the search algorithm based on a single evolutionary population cannot achieve cooperative optimization among the search populations, and the results are often only locally optimal solutions [28].
This paper presents a Petri net-based power supply recovery method for the electric power system of a floating nuclear power plant. Based on the structural characteristics, a two-stage power supply recovery strategy is adopted. Emergency power sources are put into the system immediately after fault to prevent power loss to important loads. In the next stage, the whole network reconstruction is realized, and the loss-of-power region is switched to be powered by the main generator. In the process of network reconstruction, the goal is to maximize the total power supply recovery after considering the load weight, to minimize the total switching operating cost after considering the difference between the switches and to maximize the generator operation efficiency. To realize the efficient interaction between the system topology analysis and power flow analysis, the Petri net is used to model the topological structure. The power flow analysis is constructed by simulating the dynamic transferring of the token with the firing of transition in the Petri net model, which is suitable for the compact power system of the floating nuclear power plant. MPGA is used to search for the optimal solution, for which global search and local search are both considered for finding the optimal solution. MATLAB simulation results show that the proposed method can provide complete power supply recovery.

2. Power Supply Recovery Model

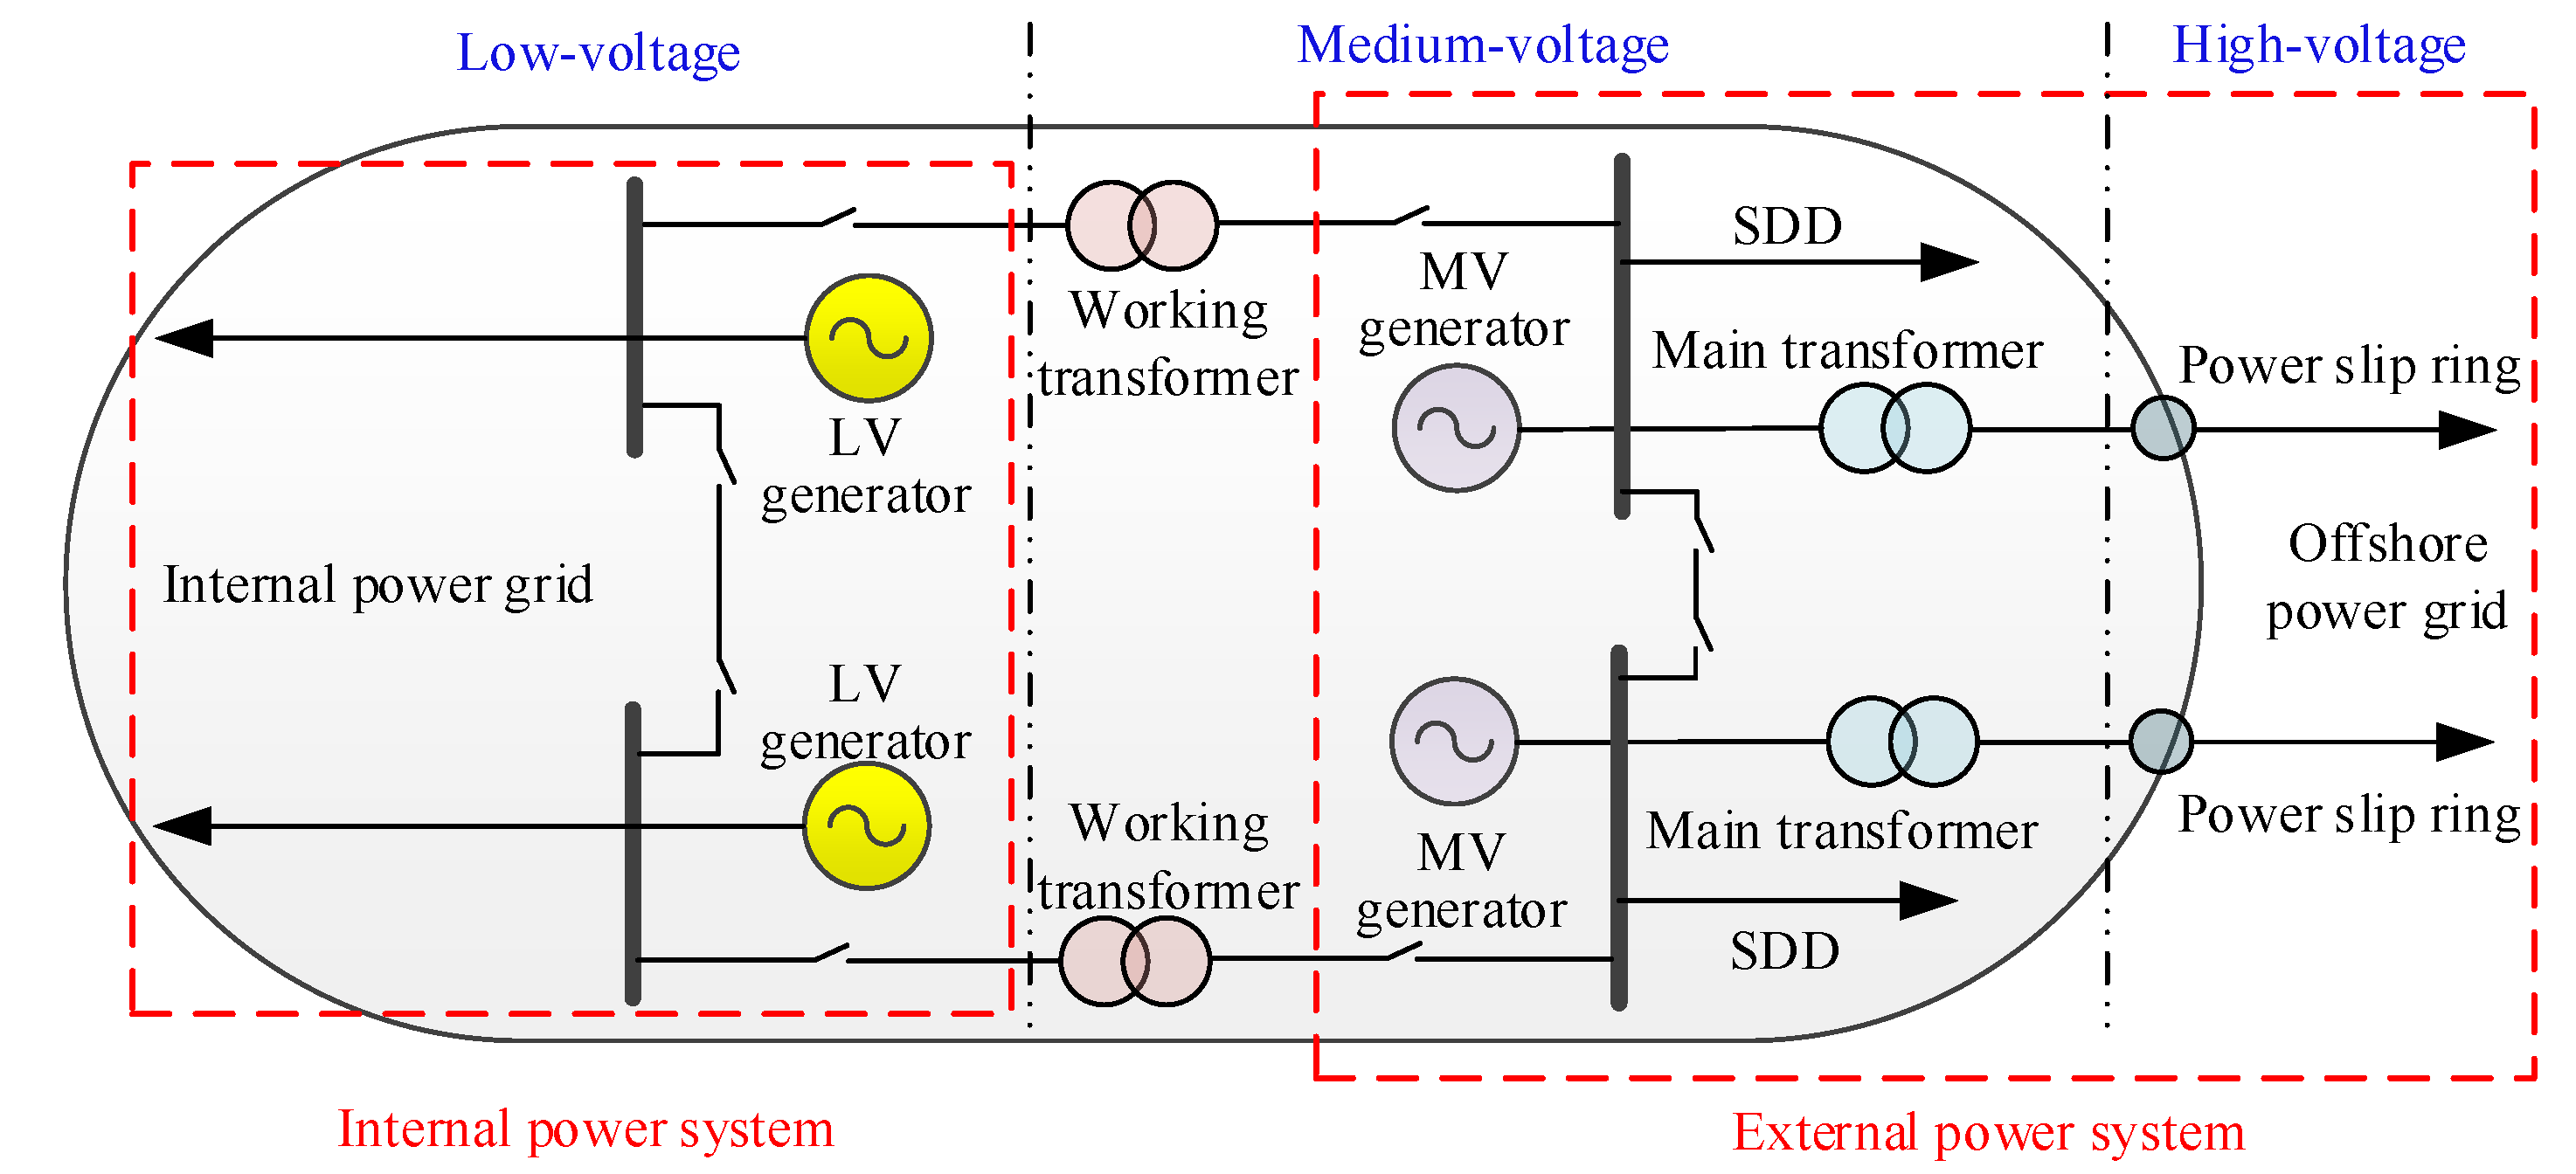
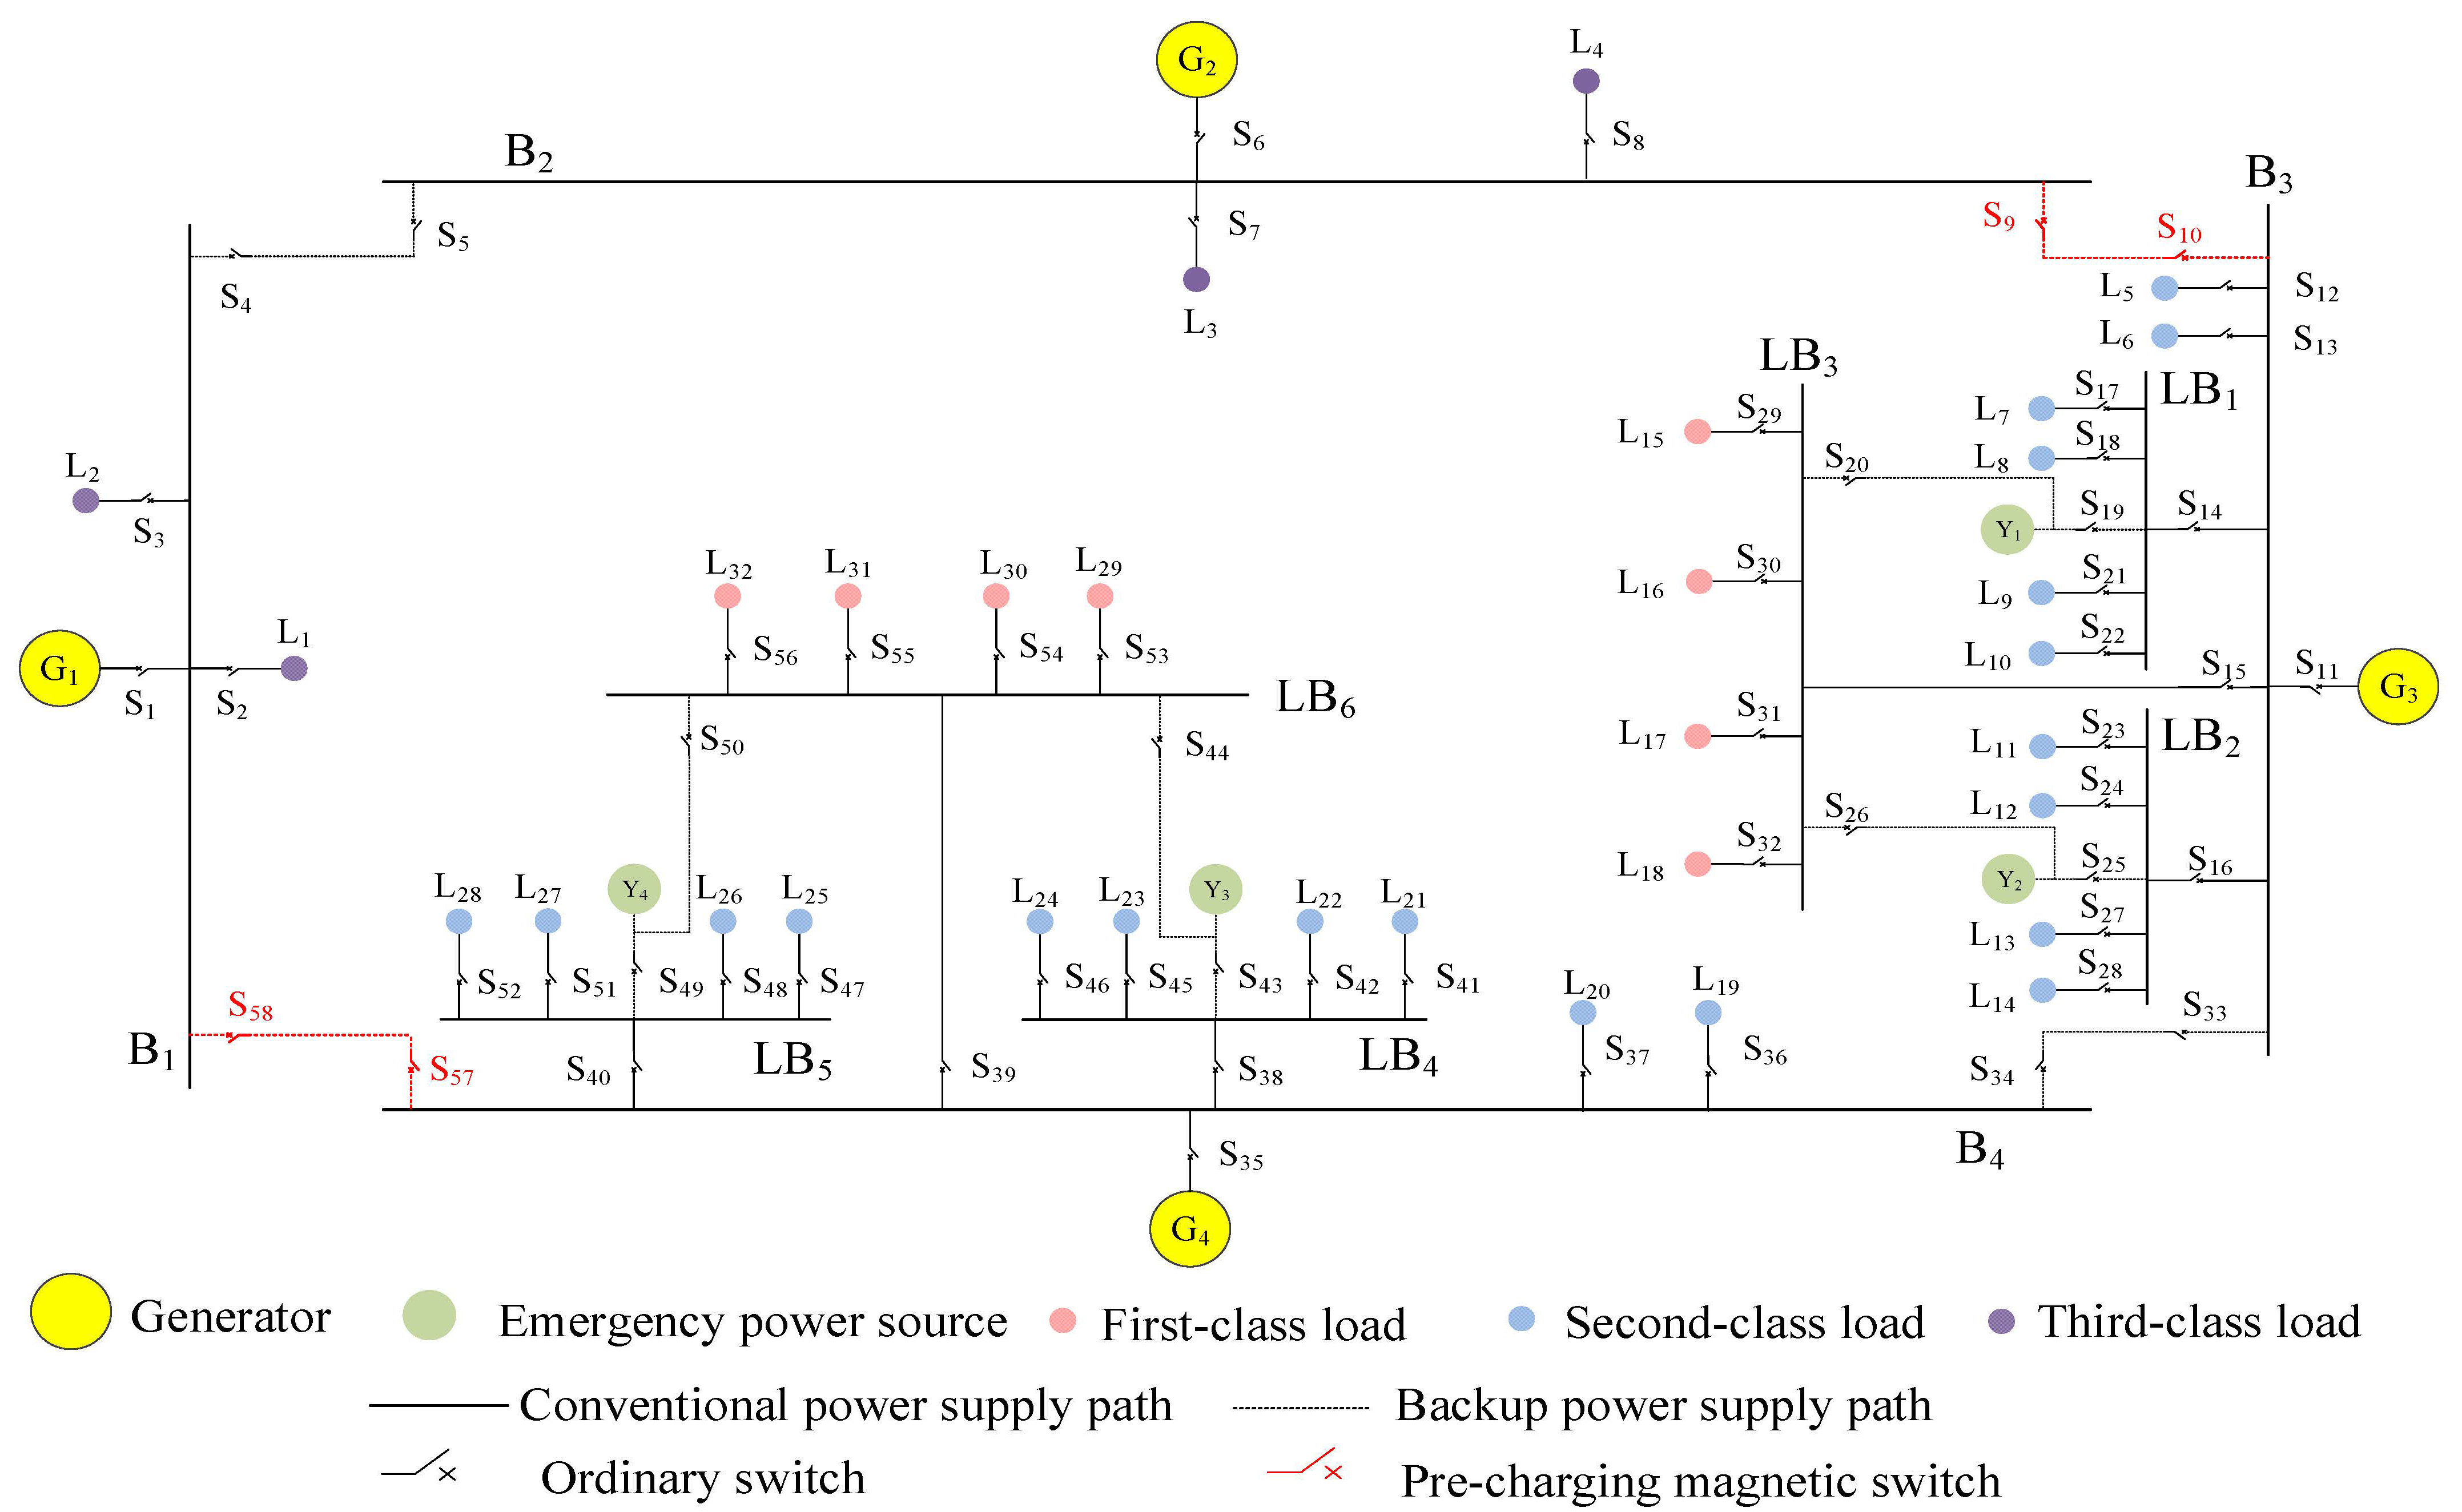
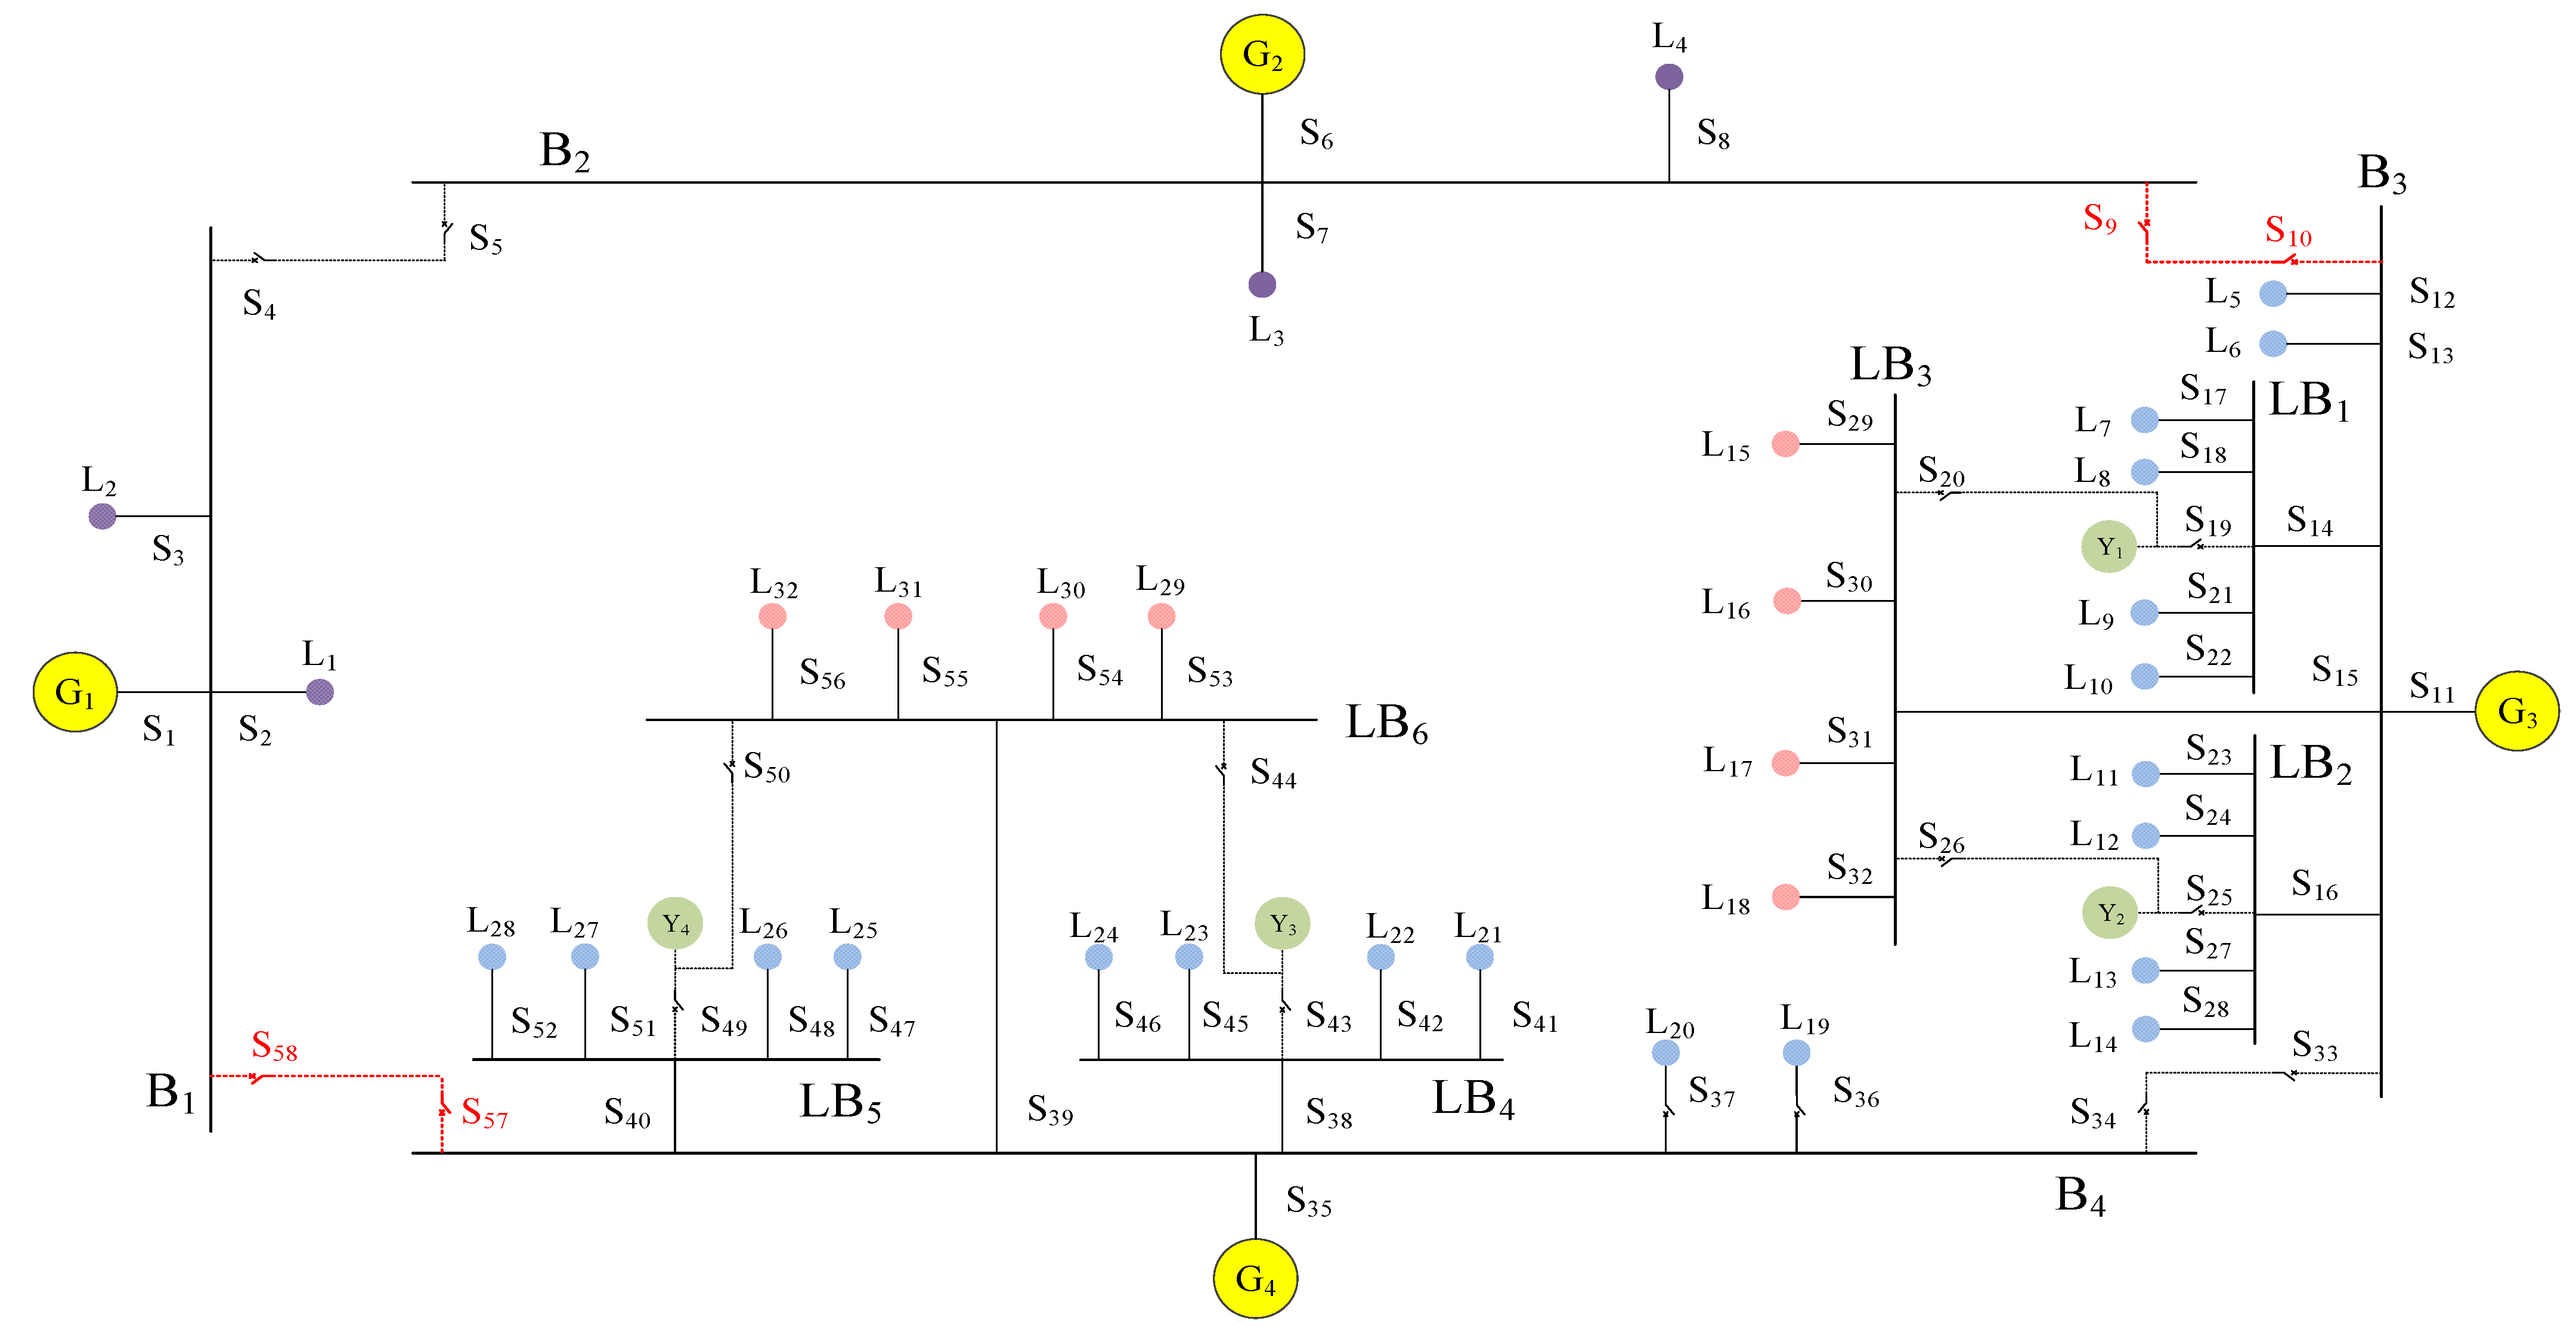
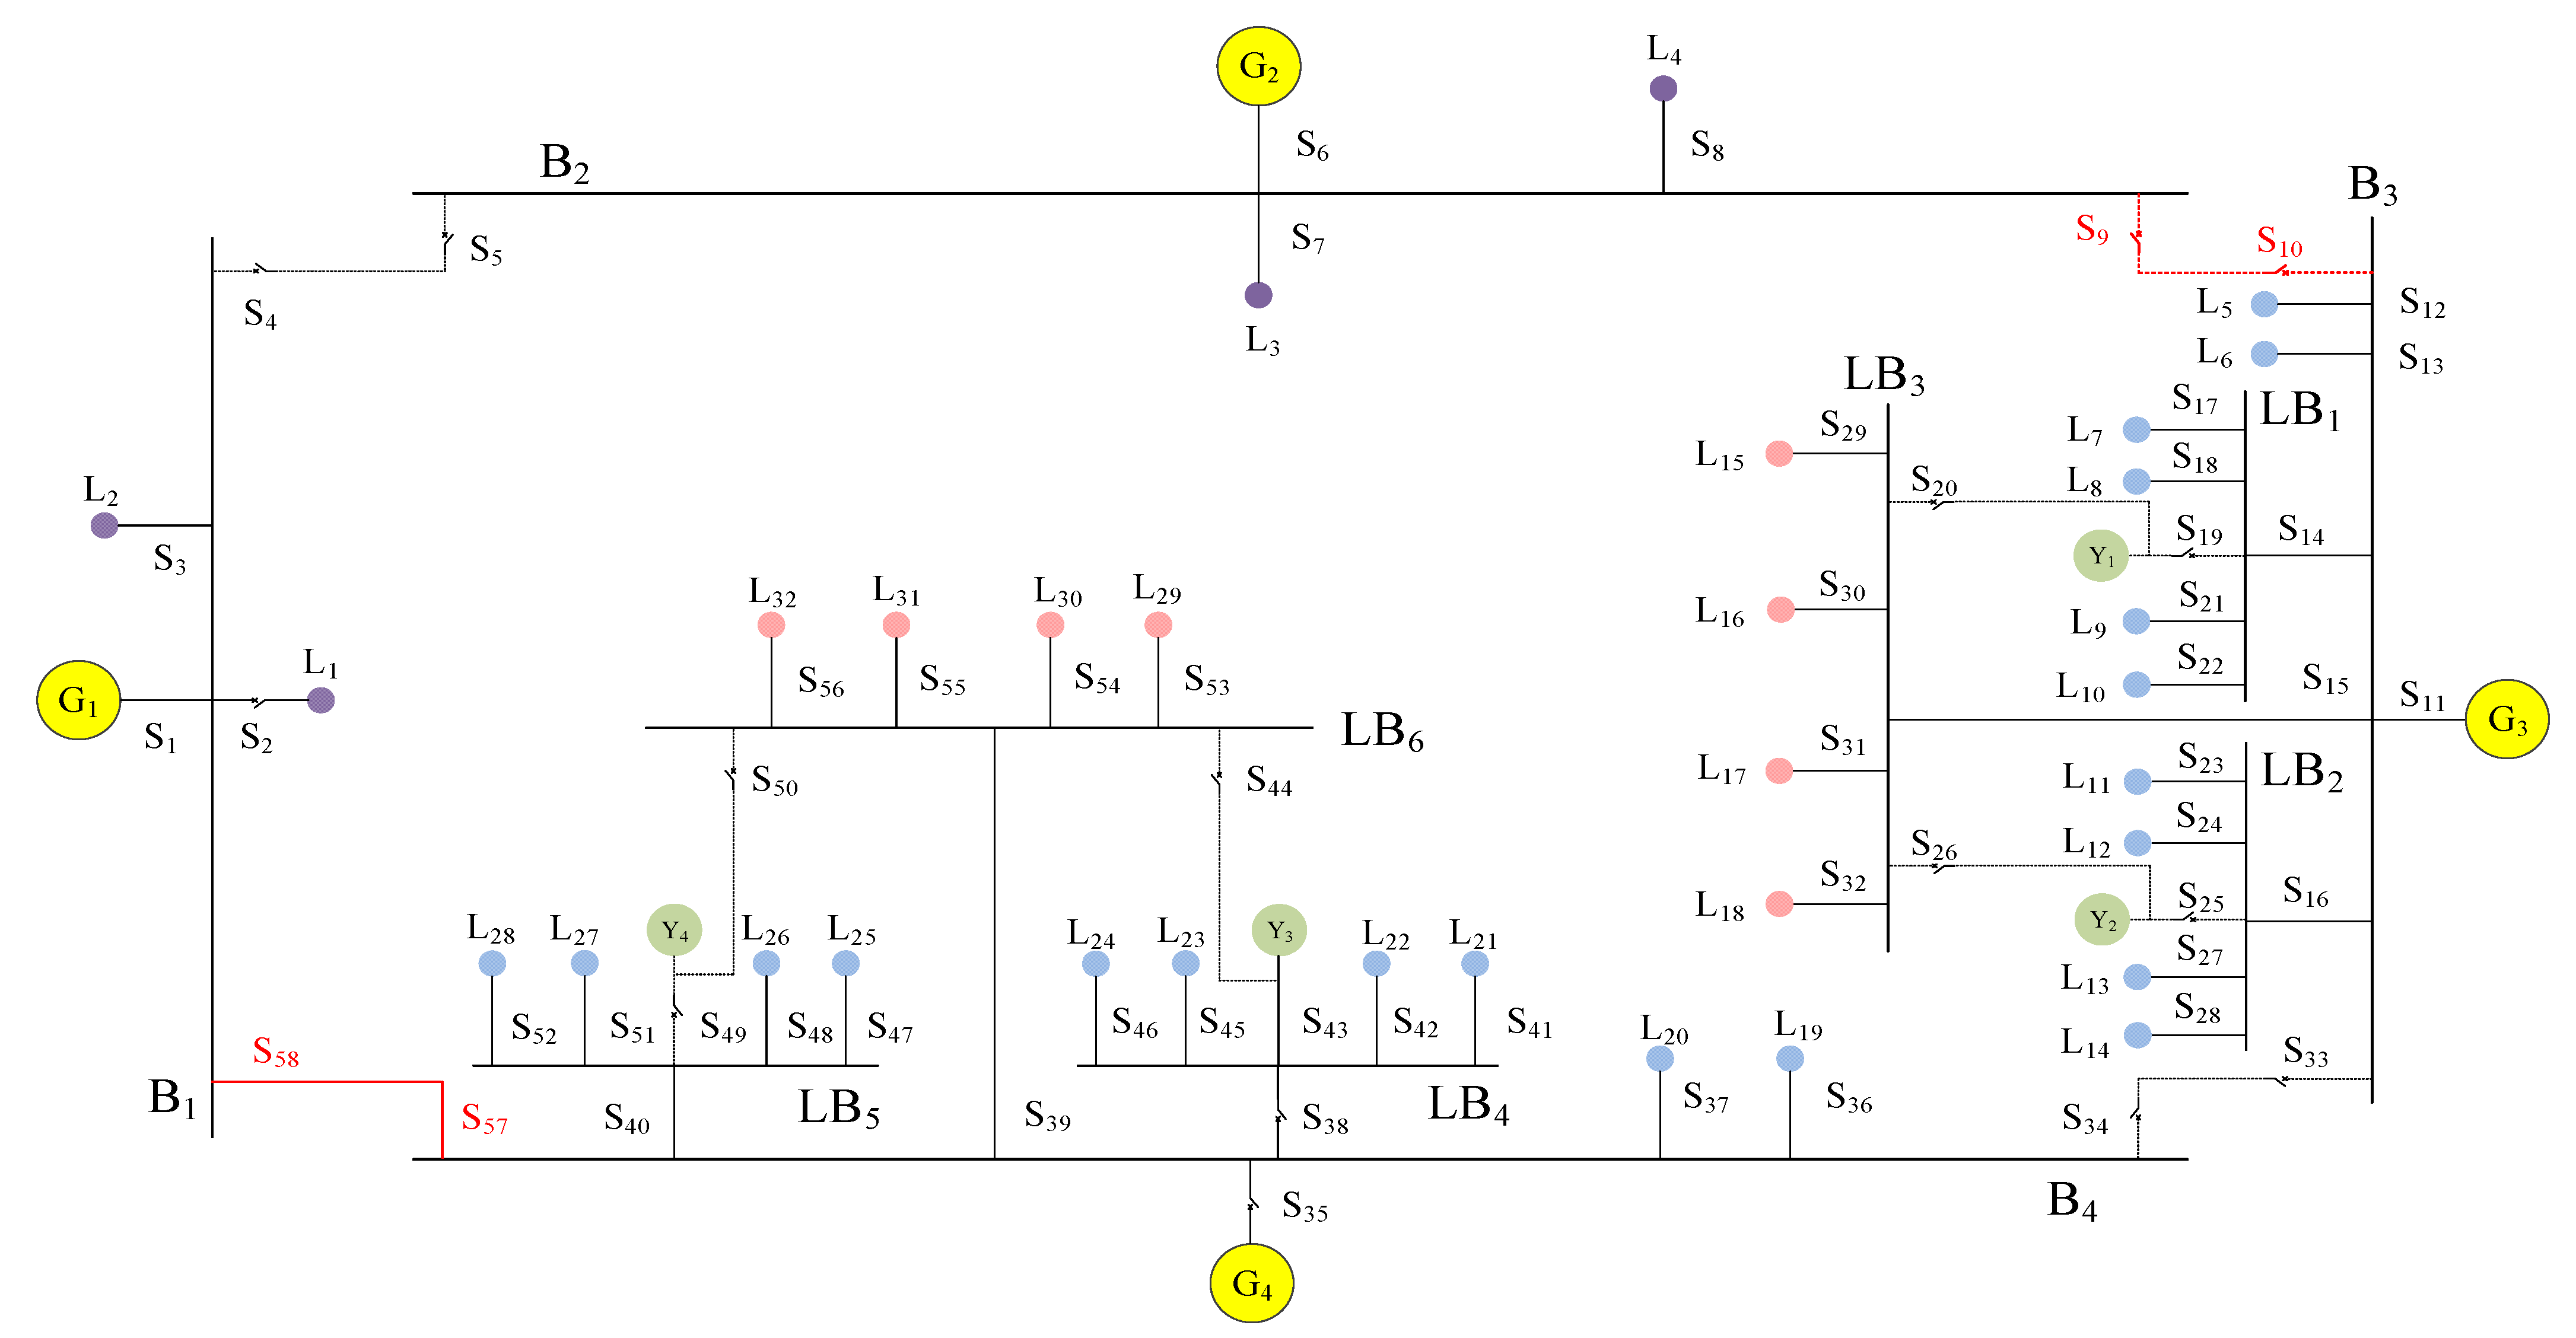
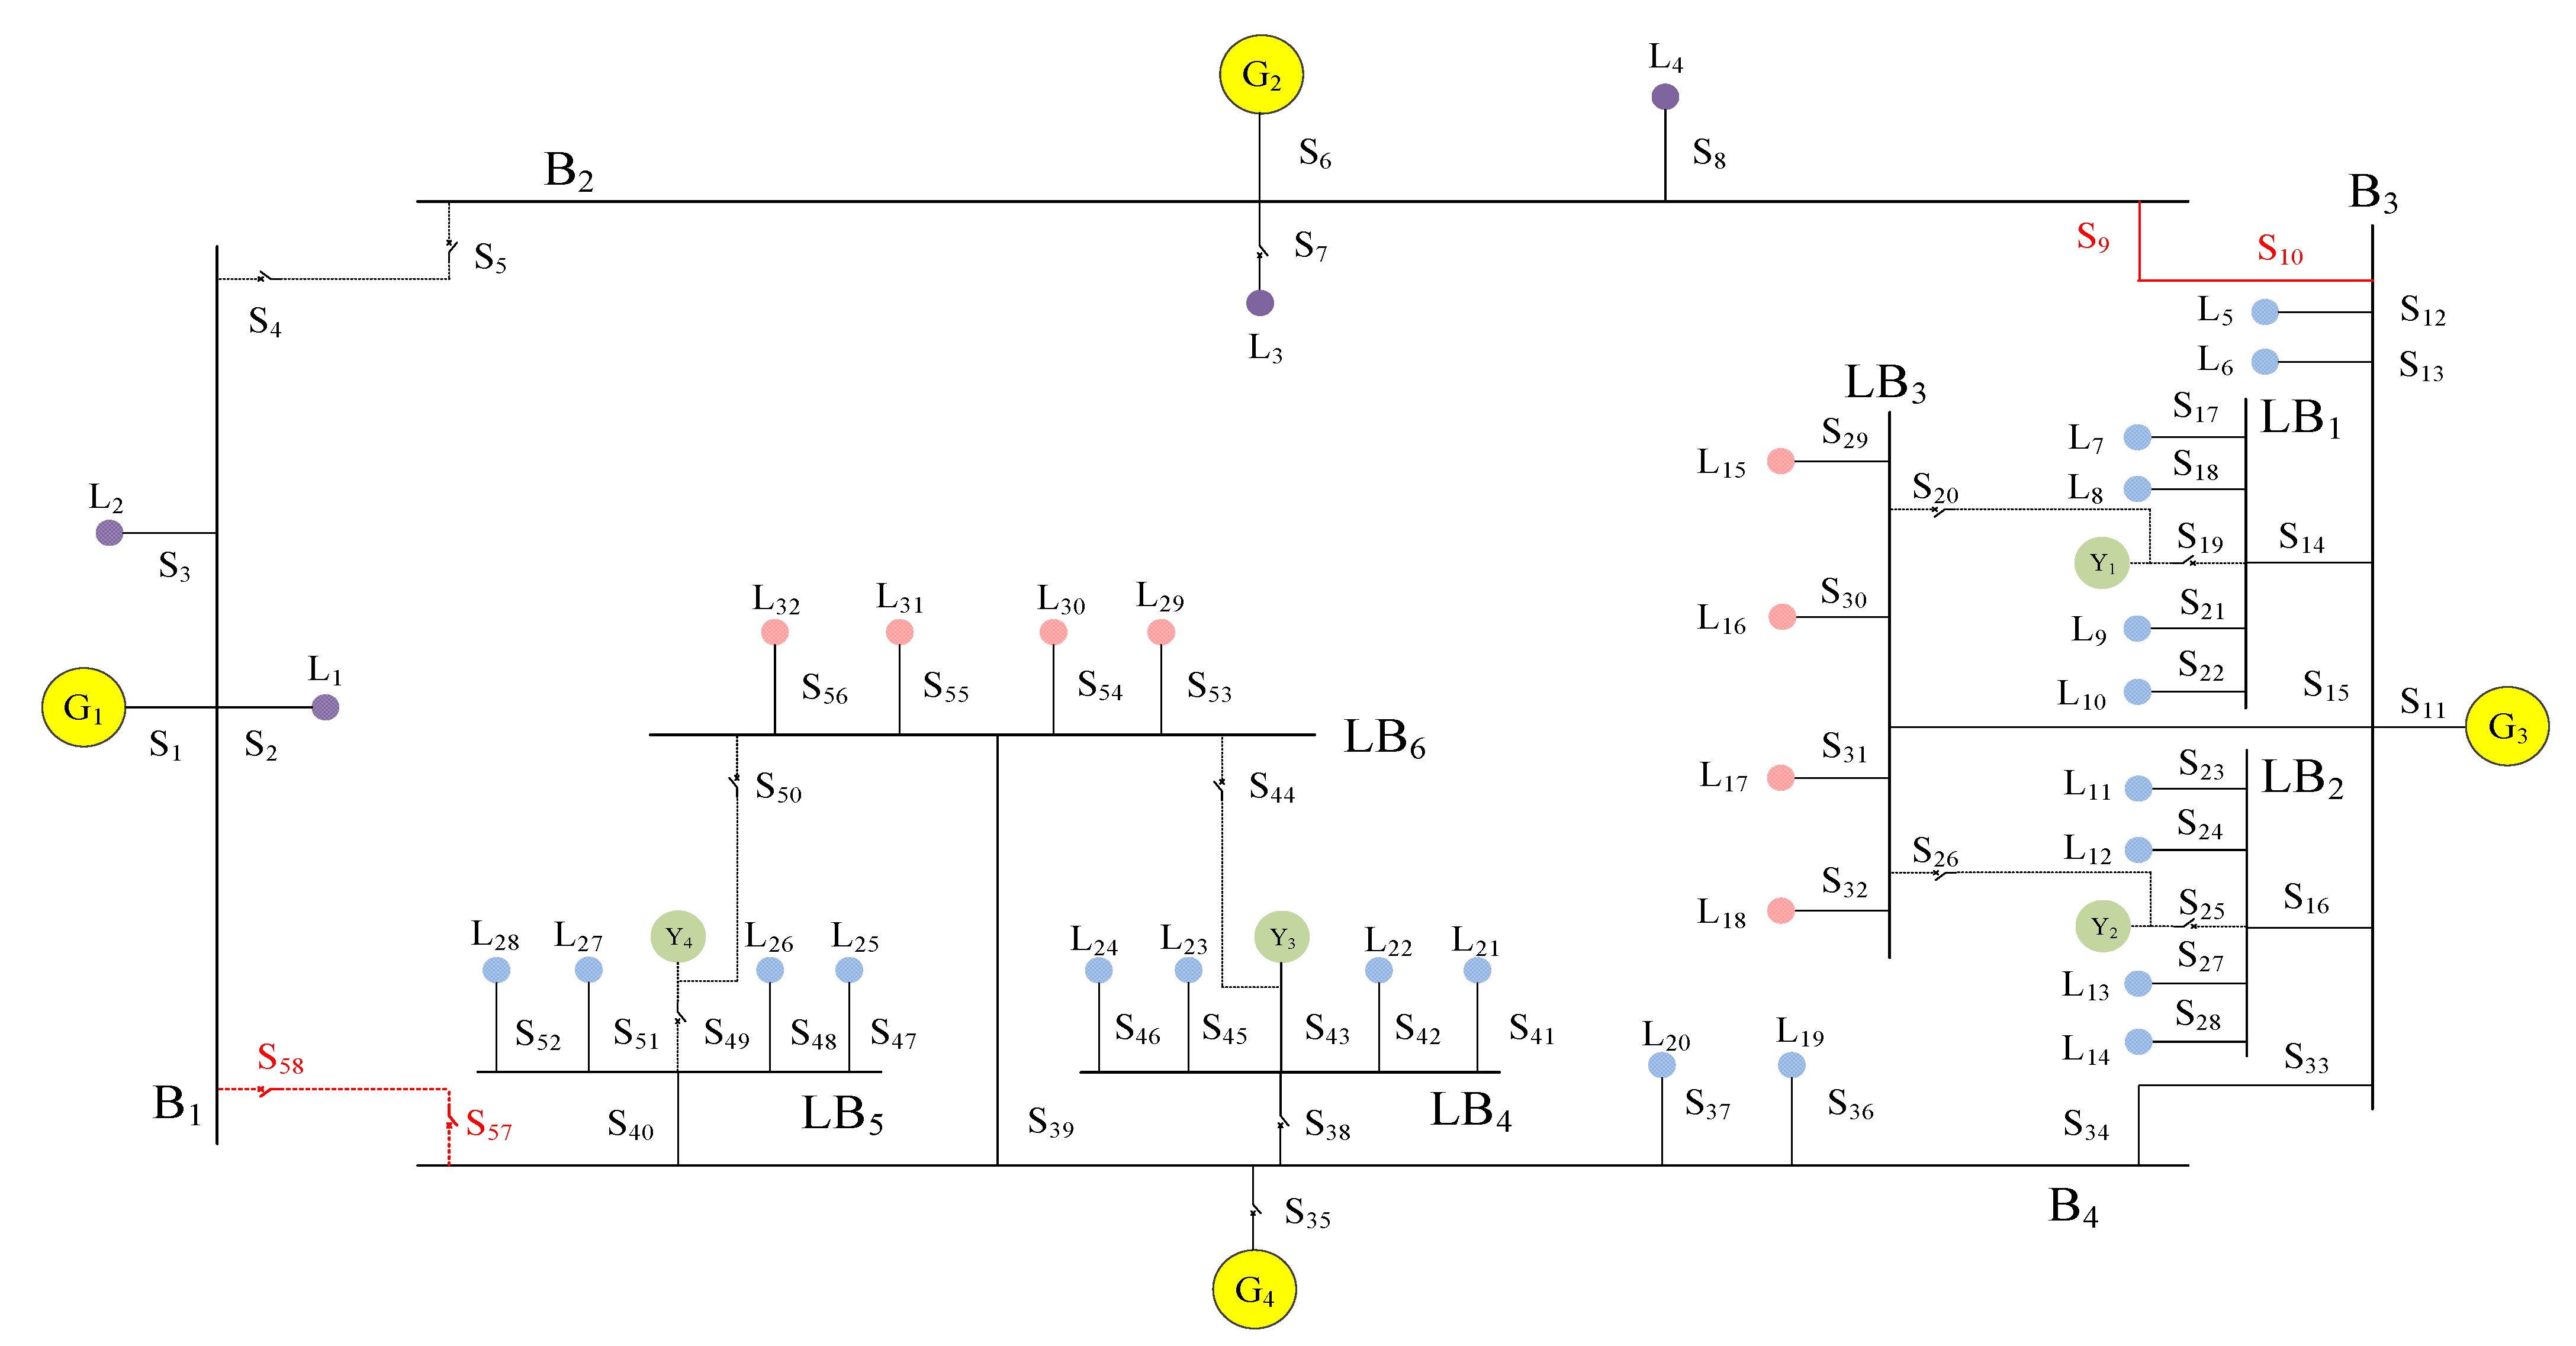
2.1. Topological Analysis

Figure 1 shows the schematic diagram of the typical structure of a floating nuclear power plant, including two relatively independent regional power systems. Under normal operating conditions, the internal power system and the external power system operate independently, and each generator supplies power to its connected system without parallel operation. Among these, the medium-voltage (MV) generator has a large capacity. It supplies power to the seawater desalination device (SDD) during the low power period of the offshore power grid to ensure the balance of generator output. The loads in the plant are intensive, and emergency backup power sources are configured to ensure the power supply safety of the nuclear reactor loads. In the cases of large-scale power cuts to the internal power system, the MV generator can be switched to supply power for the internal loads through the working transformer, but the control mode of the pre-magnetization operation should be adopted to suppress the inrush current during the no-load closing process.
Figure 2 shows the connection status between the power sources, switches and loads in the power system of a floating nuclear power plant. The power sources include four generators, G1~G4, and four emergency power sources, Y1~Y4, among which G1 and G2 are the MV generators and G3 and G4 are the low-voltage (LV) generators. Under emergent states, Y1~Y4 can supply power to the loads on the nuclear emergency switchboard or the common switchboard, but they can only be used as short-term power support sources. The system consists of four main switchboards, B1~B4, and six load-related switchboards, LB1~LB6, among which LB3 and LB6 are nuclear emergency switchboards that connected to nuclear reactor loads. The system consists of 32 loads L1~L32, including 8 nuclear reactor loads as the first-class loads, 20 loads in the internal system as the second-class loads, 4 external system equivalent loads and SDD loads as the third-class load. There are 58 switches, S1~S58, in the system. The solid lines are the conventional power supply paths that are put into operation under the normal state. For the dashed lines, they are the backup power supply paths, which are only put into operation under emergent states. When the medium- and low-voltage systems are interconnected, the pre-magnetization operation is required to suppress the inrush current. Therefore, the operation of the red switches in Figure 2 is more complicated and takes a certain amount of time.

2.2. Two-Stage Power Supply Recovery Mode

When the floating nuclear power plant is attacked by the outside world, various faults may occur at the same time. However, when there is no external power transmission task, the main generator may quit operation. At this time, if the low-voltage system generator loses power, the medium-voltage system cannot transmit electric energy. In addition, even if the main generator runs normally, the transmission of electric energy between systems of different voltage levels requires the no-load closing of the transformer, and the pre-magnetization costs a certain amount of time.
To prevent power loss to important loads, a two-stage power supply recovery mode is adopted. In the first period, if there is a power cut of the switchboard, emergency power sources should be put in to ensure reliable and continuous power to important loads, and the system is formed as isolated power supply islands. Since the emergency power sources are storage batteries, they cannot be used for long-term power supply.
To ensure the reliability of the power supply, in the second stage, a new power supply path should be determined through the whole network reconstruction, and as many loads should be switched to the main generator power supply mode. To achieve this, topology analysis and power flow analysis are combined, and an optimization algorithm is used to determine the optimal system switching state to realize network reconstruction. This process is analyzed in the following section.

2.3. Power Supply Recovery Model Based on the Whole Network Reconstruction

Network reconstruction for the power system of a floating nuclear power plant should guarantee that the loss-of-power loads can be recovered to the maximum extent under the condition of minimal topological structure change. When reconstructing the whole network, it is necessary to comprehensively consider the load recovery amount, switching operation cost and generator operation efficiency and to satisfy the system topology structure constraint, line power flow constraint and generator output constraint.

2.3.1. Objective Function

(1) Maximum load recovery amount. For the network reconstruction of a floating nuclear power plant, the load is divided into three classes according to the load priority. The objective function established to maximize the recovery amount of the load after fault is:
max f 1 = a 1 i = 1 k 1 x 1 i P g 1 i + a 2 j = 1 k 2 x 2 j P g 2 j + a 3 q = 1 k 3 x 3 q P g 3 q
where Pg1, Pg2 and Pg3 respectively represent the power of the first-, second- and third-class loads and x1, x2 and x3 represent the operating states, for which the value of 1 indicates that the load is put into operation, and the value of 0 indicates that the load is out of operation. k1, k2 and k3 are the total amount of loads for all classes, and a1, a2 and a3 are the weights of loads for different classes. The values of different classes of loads in the process of network reconstruction can be fully reflected by assigning larger weights to important loads.
(2) Minimum switching operation cost. Switching operation cost is an important index for measuring the efficiency of network reconfiguration. For the internal system of the floating nuclear power plant, when the main generator supplies power, inrush current suppression should be realized by pre-magnetization. The switching operation process is complex, and the operation cost is high. The other switches are common switches with low operation costs. Different weight coefficients are given for different switching operation costs. The objective function is:
min f 2 = k P X P + k M X M
where XP and XM respectively represent the numbers of pre-magnetization-related switches and common switches, for which the state should be changed in the process of network reconstruction. kP and kM are the corresponding weight coefficients.
(3) Highest generator operating efficiency. The generator has the lowest energy consumption at rated power and is most beneficial for operation safety. Therefore, the mode with higher operation efficiency should be preferred during network reconstruction. The objective function is:
max f 3 = min i τ P g i P g i N
where τ is the generator set that is put into operation, and Pgi and PgiN respectively represent the actual and rated output power of the generator i. The corresponding efficiency of the generator with the lowest operating efficiency among the four generators is selected as the objective function. When its calculated result is large, it indicates that the operating efficiency of each generator is high.
Considering the above three objectives comprehensively, the normalization process is carried out to solve the problems of different dimensions. On this basis, according to the importance of each indicator, the weighted summation method is adopted for establishing the maximization objective function as:
max F = w 1 μ 1 + w 2 μ 2 + w 3 μ 3 μ 1 = f 1 a 1 i = 1 k 1 P g 1 i     +   a 2 j = 1 k 2 P g 2 j     +   a 3 q = 1 k 3 P g 3 q μ 2 = 1 f 2 k P X PS + k M X MS μ 3 = f 3
where XPS and XMS represent the total number of pre-magnetization related switches and common switches, respectively. w1, w2 and w3 are the weights of each objective function, which can be determined by the analytic hierarchy process [29]. In the hierarchical analysis, it is considered that the load recovery value is the most important, the switching operation cost is the second and the generator operation efficiency is the last.

2.3.2. Constraints

(1) System topology constraint. After network reconstruction, each sub-network should maintain the radial structure, and no ring network is formed in the system.
(2) Line power flow constraint. All lines in the system should not be overloaded, and the load power should not exceed the fixed value of overload protection, which should meet the following formula:
P L i P opi
where PLi stands for the actual power of line i and Popi stands for the overload protection value of line i, which is set at 1.1 times the rated power.
(3) Generator output power constraint. The output power of each generator should not exceed the rated power, and the following formula should be satisfied:
P gi P giN

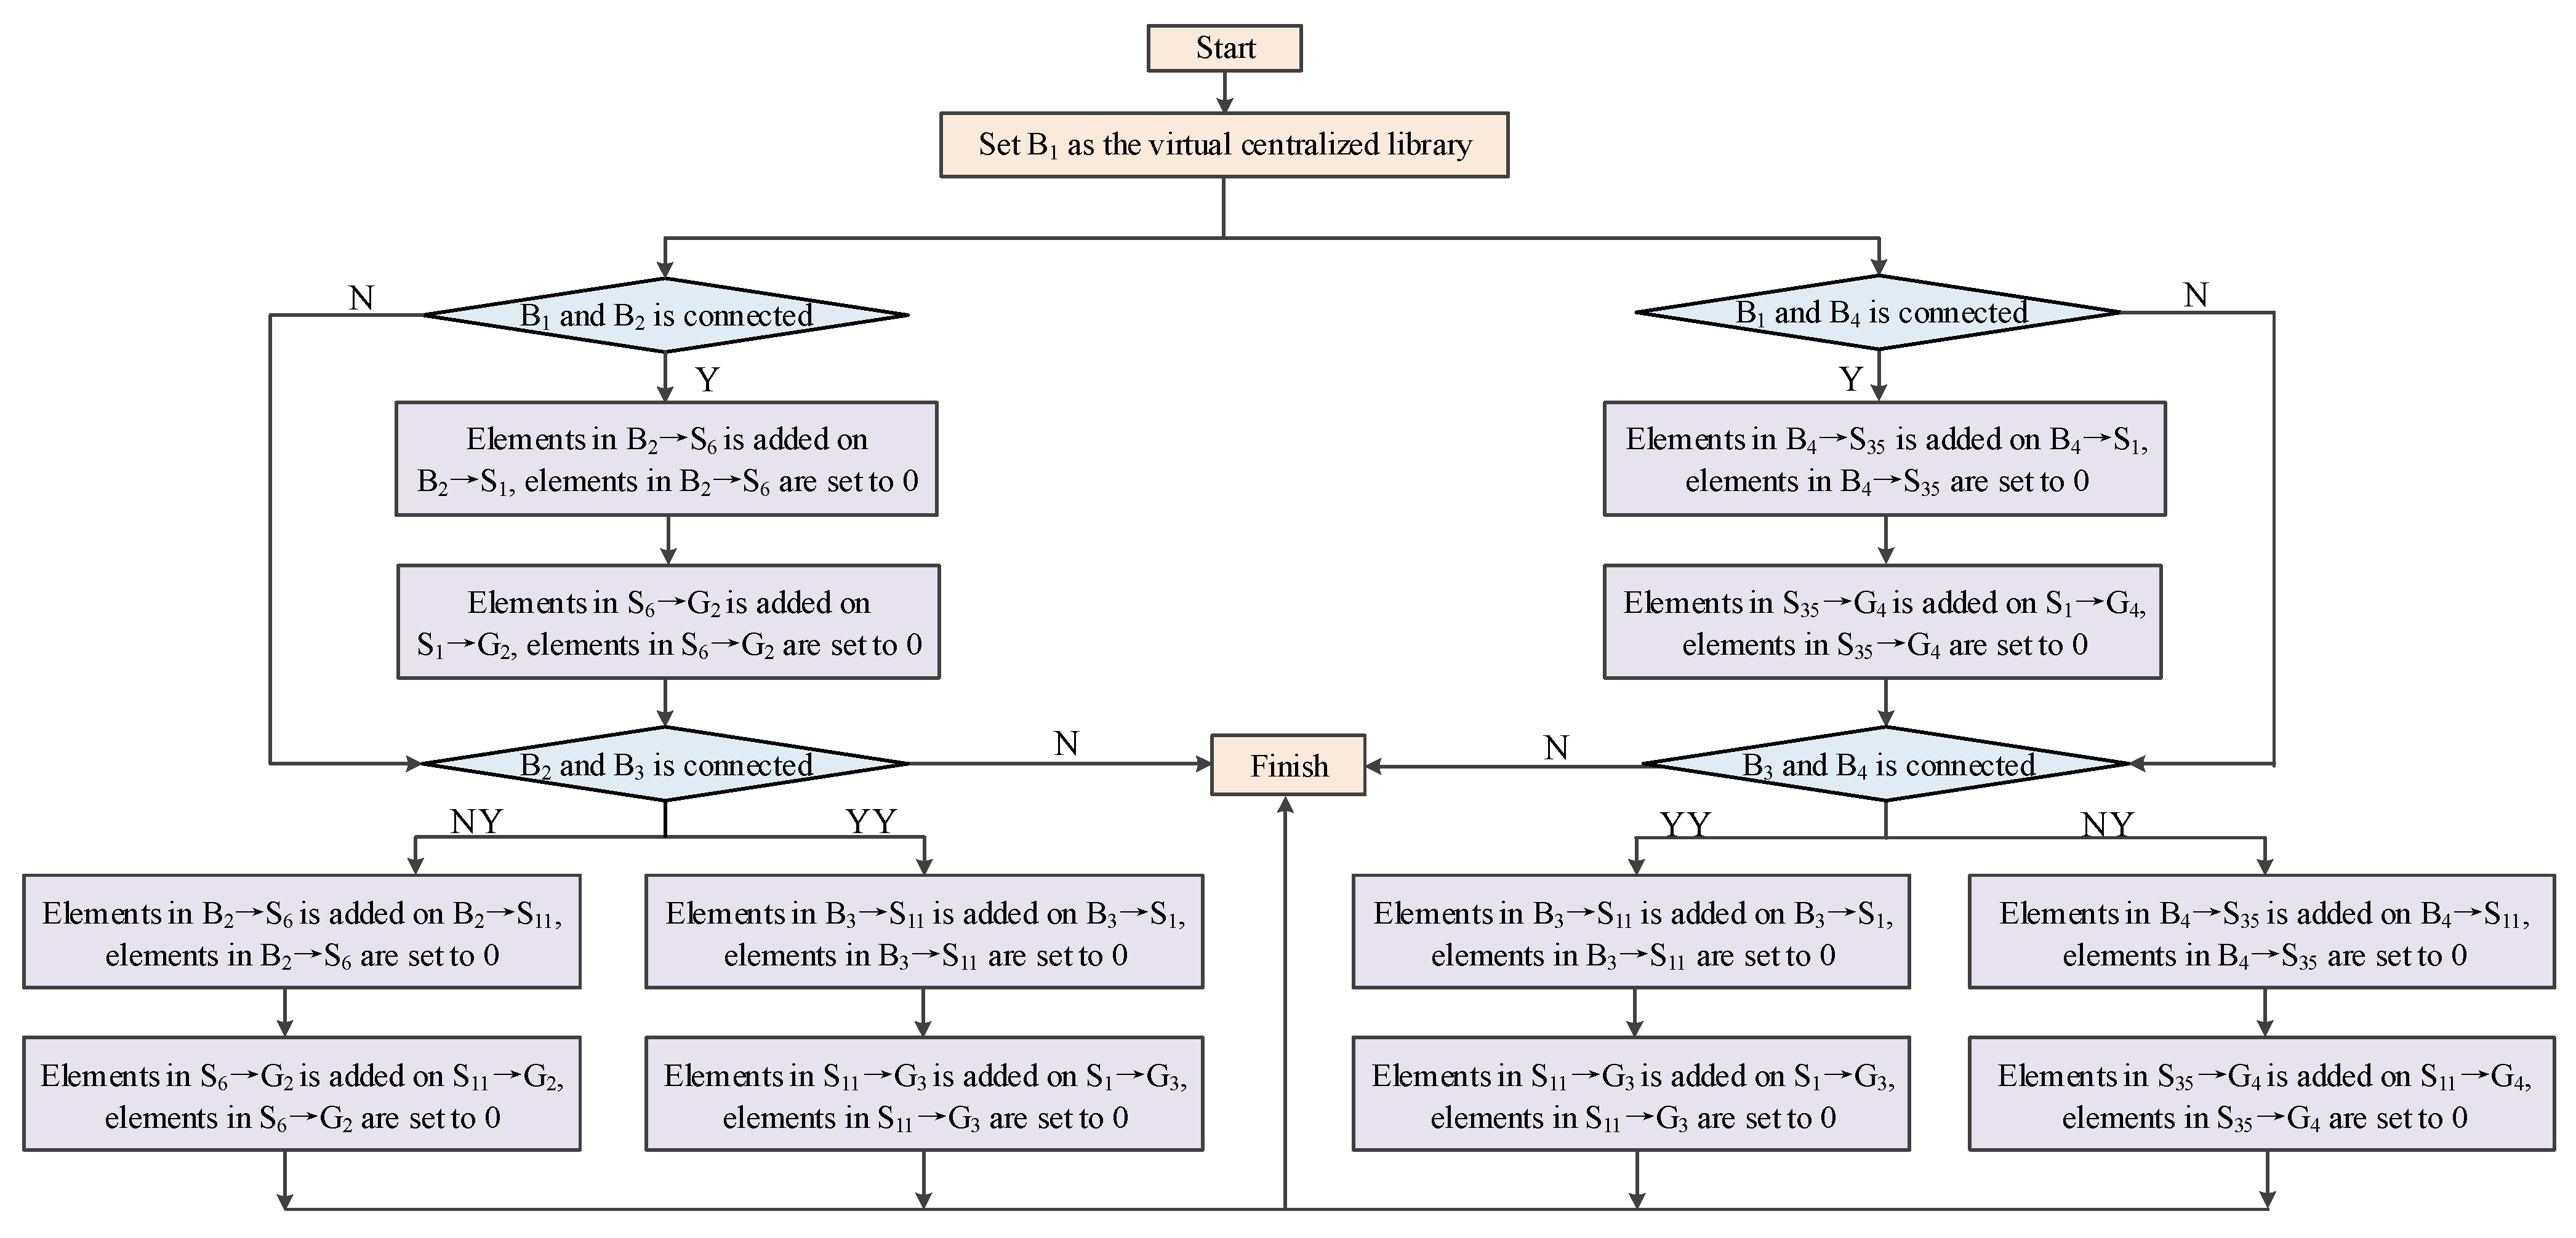
3. Topological Modeling and Power Flow Analysis Based on Petri Net

A Petri net model describes the logical relationship between events based on network theory and deduces the dynamic activities in the system by algebraic matrix [30,31]. The power system network reconstruction of a floating nuclear power plant realizes load transfer through switching transformation to redistribute the load of each switchboard and adjust the power output of each power source in the system. Corresponding to the Petri net model, the above process is similar to the dynamic transmission process of a token in each library by firing the transition. The generators and loads in the floating nuclear power plant are directly connected to the switchboards, and the power supply lines are short. The power loss and voltage sag caused by the line impedance are not considered. A Petri net can be used as an effective model for topology modeling and power analysis for the power system.

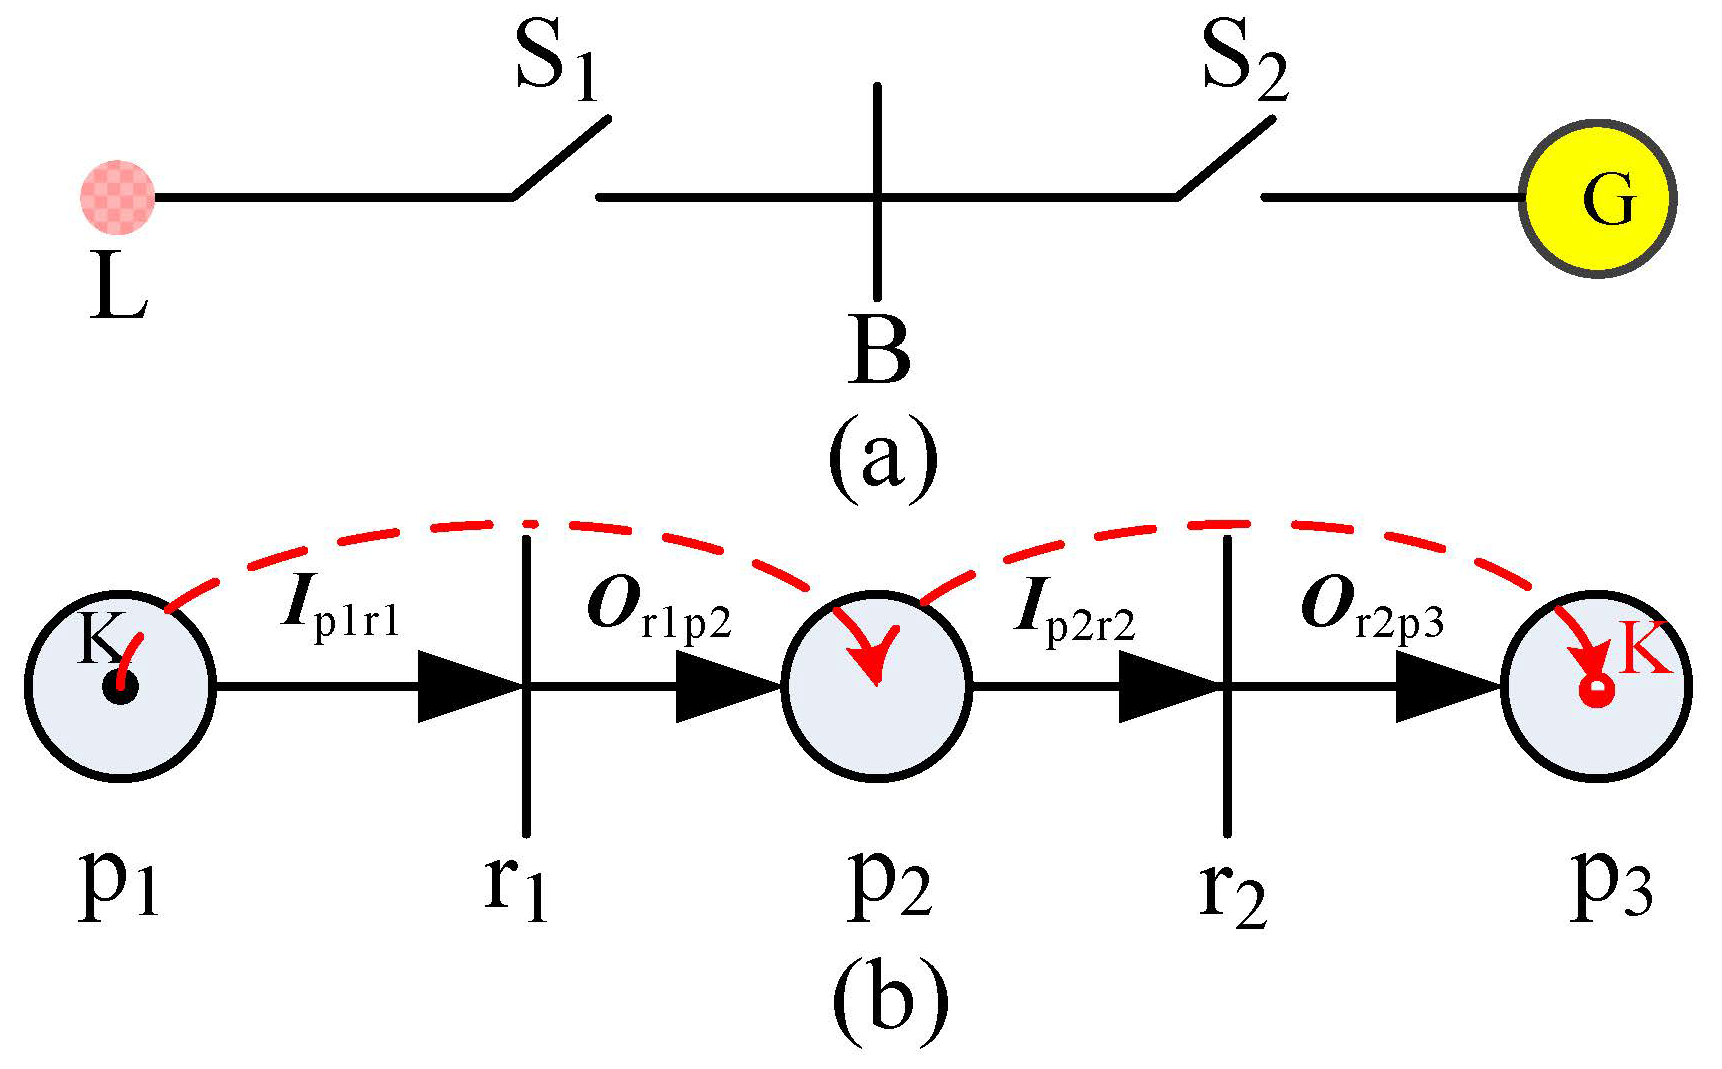
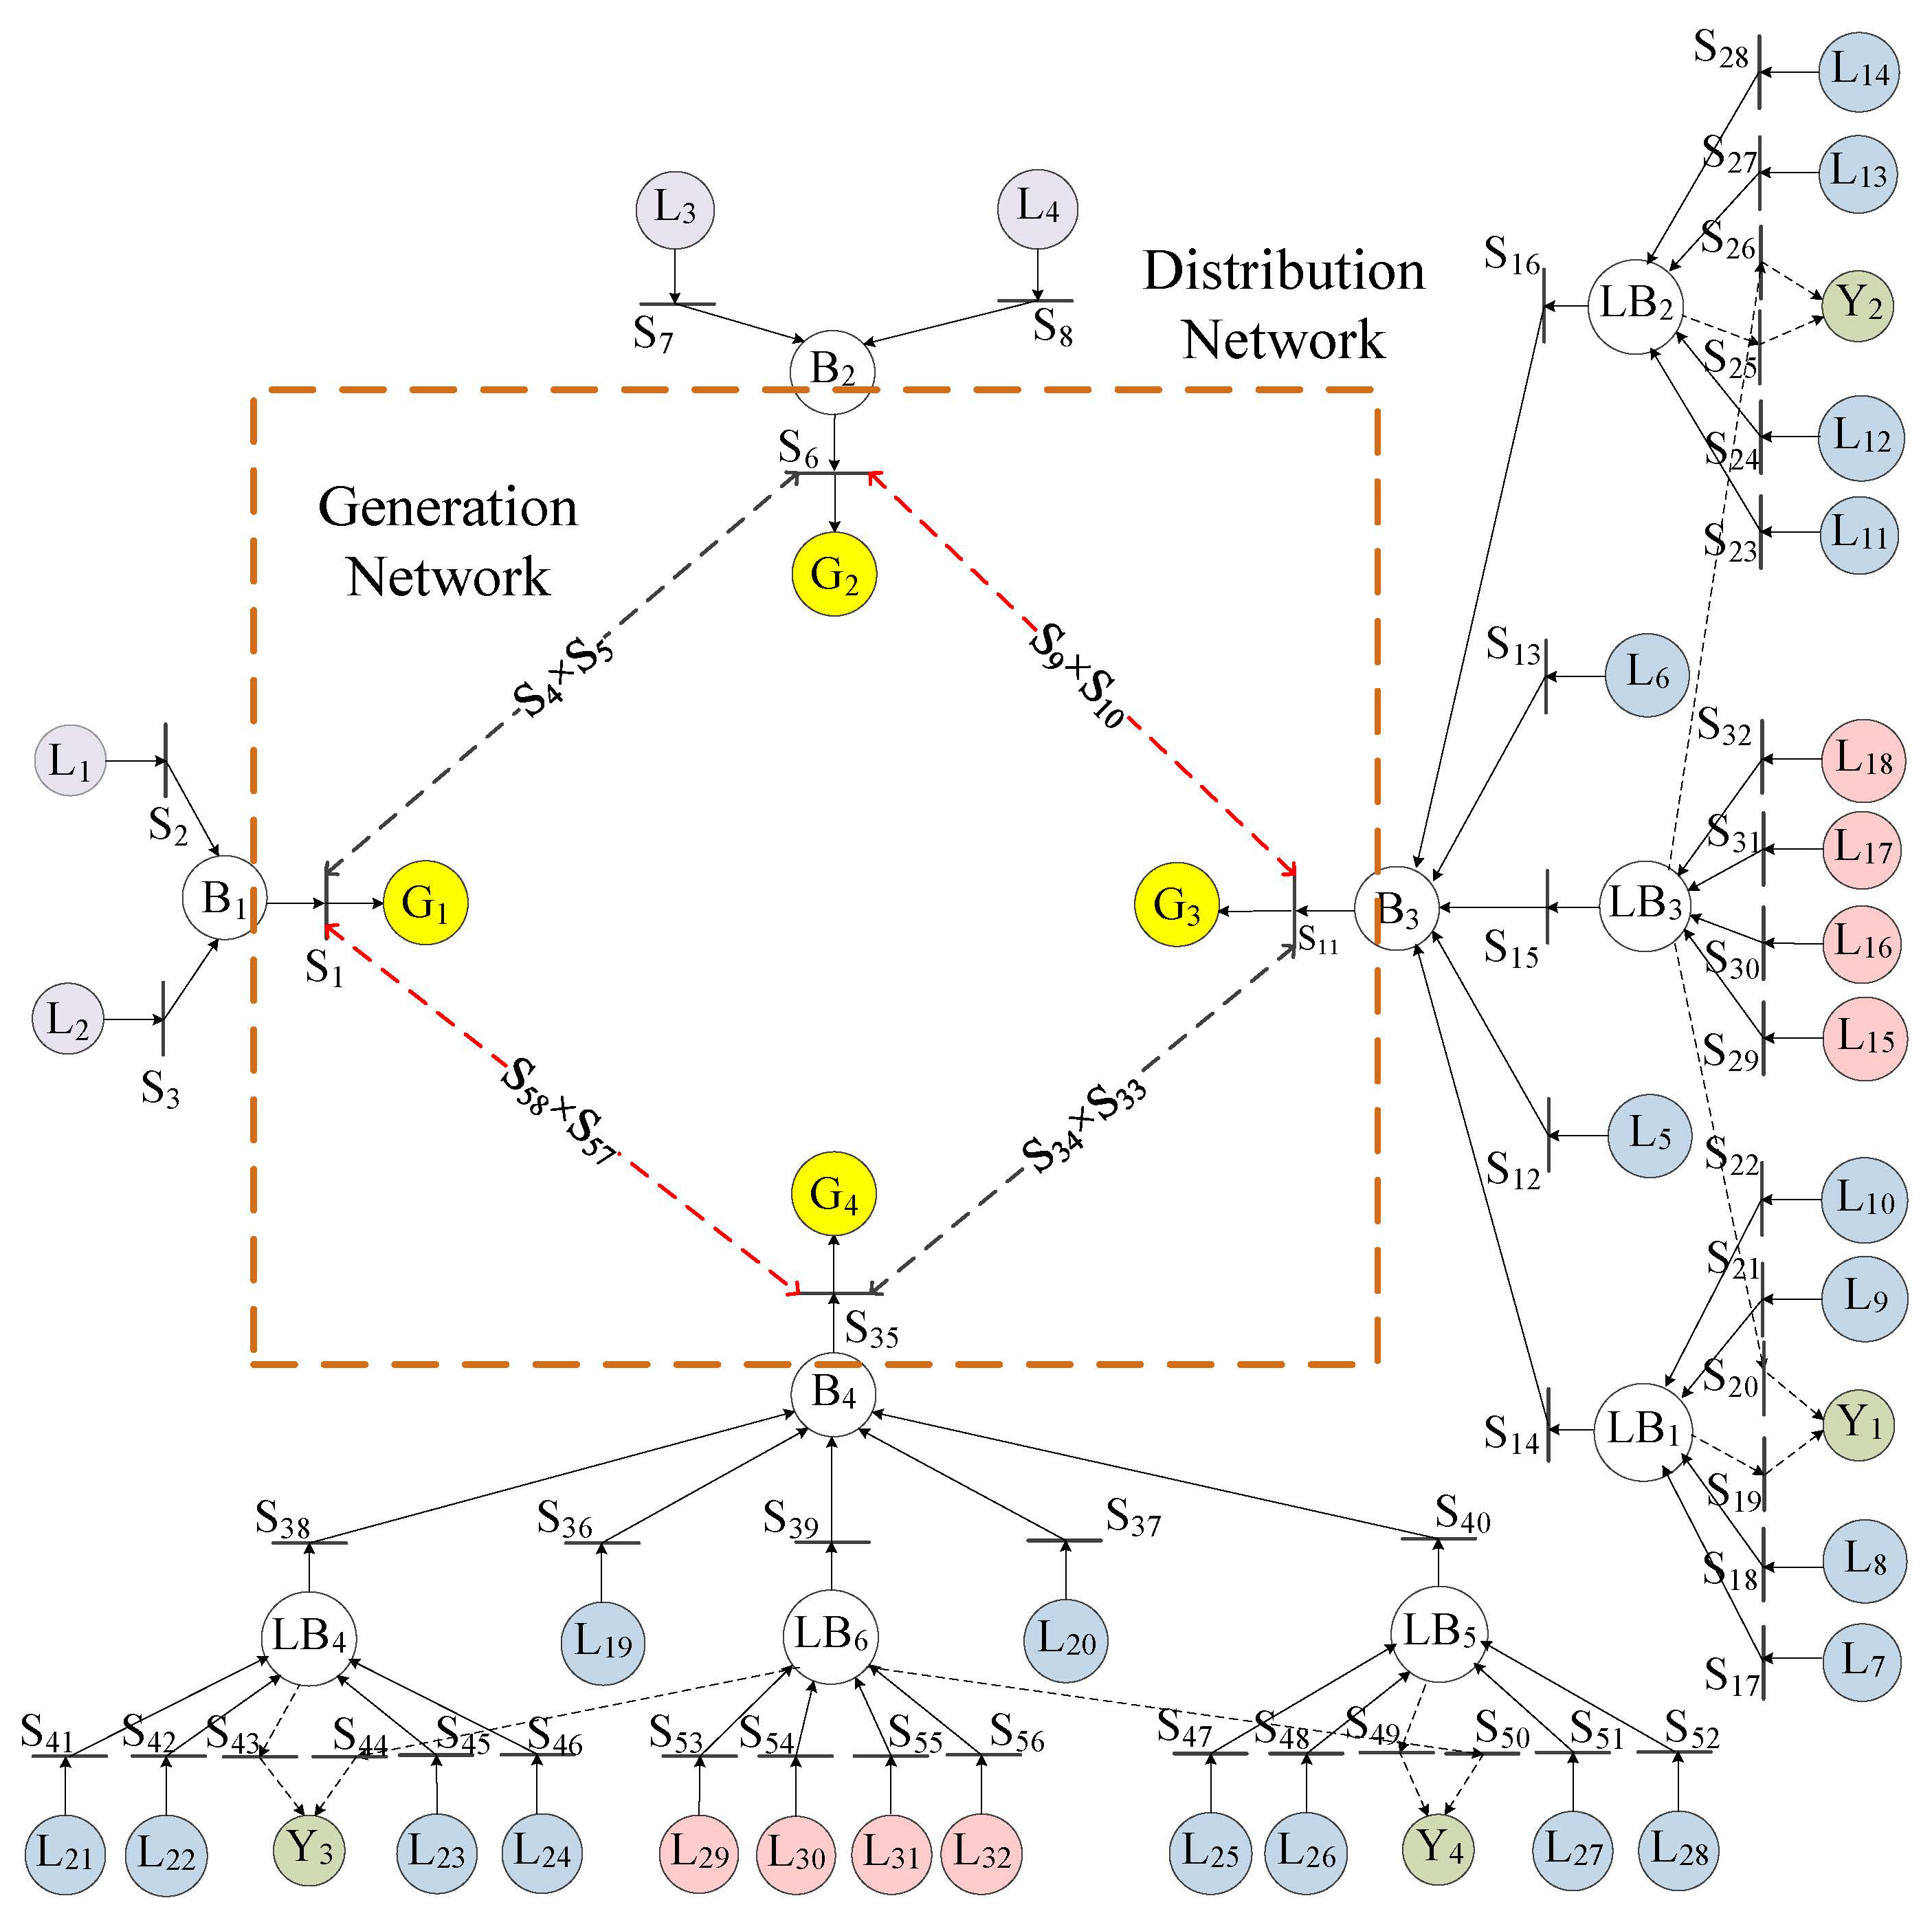
3.1. Graphical Modeling of Petri Net for the Power System of Floating Nuclear Power Plant

A Petri net model is composed of library, transition, token, input correlation matrix and output correlation matrix. The library represents the node set of the system, which is represented by the circle. An m-dimensional node system is represented by the corresponding library P = P 1 ,   P 2 ,   ,   P m . The loads, power distribution boards and power sources in the system correspond to the library. The token is located in the library and is used to describe the state of the library; it is represented as K P = k P 1 ,   k P 2 ,   ,   k P m . The token number is determined by the load power of each component. After transition firing, the token in the library is transferred, which is represented by a vertical line. A set of 1 × n-dimensional transition nodes is expressed as R = R 1 ,   R 2 ,   ,   R n . In the system, except for the contact switch between the main switchboard, other switches correspond to the transitions. Input correlation matrix I:PR reflects the library to transitions. If there is an input arc from library Pi to transition Rj, Iij = 1. Otherwise, Iij = 0. Output correlation matrix O:RP reflects the transition to the library. If there is an output arc from transition Ri to library Pj, Oij = 1. Otherwise, Oij = 0. The input and output association matrices are determined by the connection between libraries and transitions in a Petri net under the system topology status.
For a simple power network as shown in Figure 3a, its equivalent Petri net model is shown in Figure 3b. Load L corresponds to library p1, and its load is represented by the token K. When the diagonal elements in the input and output matrices Ip1r1 and Or1p2 are all 1, it means that the corresponding switch S1 is under the closed state. After r1 is fired with the corresponding change in switch S1, the token in p1 is dynamically transmitted to library p2 corresponding to switchboard B. At the same time, the power load of the switchboard can be calculated. Similarly, when the diagonal elements in the input and output matrices Ip2r2 and Or2p3 are all 1, the corresponding switch S2 is under the closed state. After r2 is fired with the corresponding change of switch S2, the token in p2 is transmitted migrated to library p3 corresponding to generator G, and the load carried by the generator can be calculated. According to this process, power flow analysis for the power system can be realized.
Based on the topological structure of the power system in the floating nuclear power plant shown in Figure 1, the equivalent model of the topological connection relation for each electrical component in the Petri net is established, as shown in Figure 4. The model is divided into two parts: the distribution network and the generation network. The distribution network includes the part extending down from the main switchboard to the terminal loads of the system, that is, the part outside the dashed box in Figure 4. The generation network extends from the main switchboard up to the generator, within the dashed box in Figure 4.

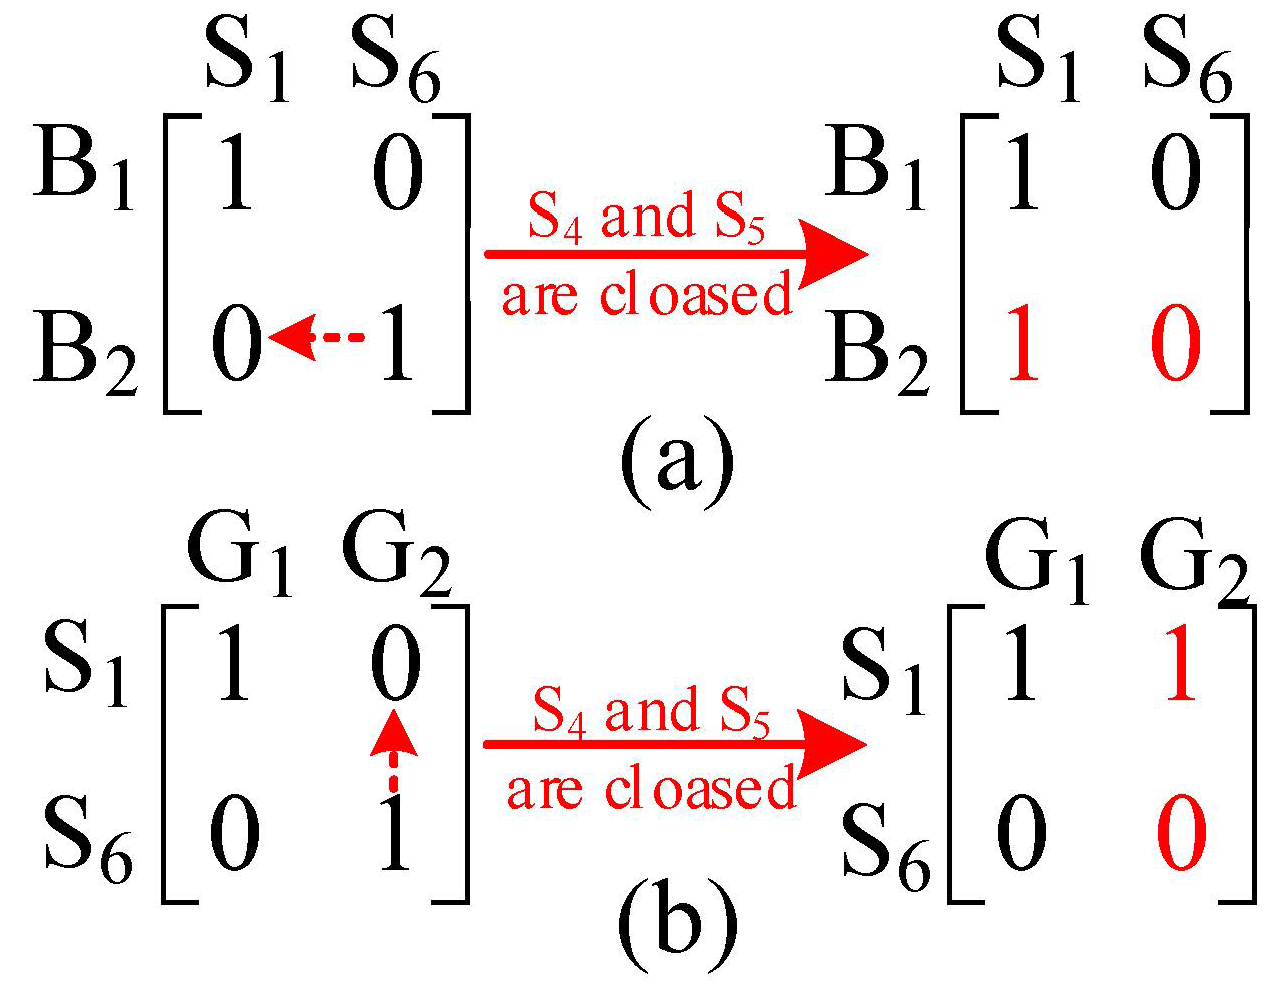
3.2. Power Flow Analysis and Calculation Method Based on Petri Net

3.2.1. Power Calculation Method for Switchboards

In the distribution network of the Petri net, the token value in each library is determined by the load power. For the library corresponding to the load element, the load power is the token value. For the library corresponding to the switchboard and the power source, the initial token value is 0. Thus, the initial token vector of the distribution network can be determined represented by K pNet 1 0 . The values of each non-diagonal element in INet1 and ONet1 for the distribution network are all 0. Set each diagonal element in INet1 as 1 and determine the values of each diagonal element in ONet1 according to the initial switch state in the system. For a switch whose initial state is open, the element corresponding to the output arc in ONet1 is 0; for a switch whose initial state is closed, the corresponding output arc is 1.
The dynamic mechanism of the Petri net is used to deduce the load of each switchboard, and its iterative formula is:
K pNet 1 i + 1 = K pNet 1 0 + K pNet 1 i × I Net 1 × O Net 1
The above formula is iterated successively from i = 0, and it stops when K pNet 1 i + 1 = K pNet 1 i . The power system in the floating nuclear power plant contains two levels of switchboards. After two rounds of iteration, the token number in each switchboard is the final power amount.

3.2.2. Power Calculation Method for Generators

For the internal power system, when there is a generator out of operation, first of all, in the process of distribution network reconfiguration, the system shifts to emergency power supply mode. However, the power supply time is limited for emergency power sources, the tie line between the medium- and low-voltage systems should be closed and the power source should be turned to the main generator. In this case, the topology of the whole network needs to be reconstructed and the output of each generator in the generation network needs to be reallocated. In the generation network, the initial token vector is K pNet 2 0 , which is taken as the load of each switchboard. According to the connection mode of the tie lines between the main switchboards, the token is concentrated in one or more switchboards. Then, it is distributed according to the rated capacity of each generator.
First, the depth order search method is used to adjust the weight states of the correlation matrix of the generator network. For example, when the main switchboard B1 is used as the virtual centralized library, that is, if S4 and S5 are closed, B1 and B2 run in parallel. For the input correlation matrix INet2, the column elements associated with B1 are superimposed on the original ones with the column elements associated with B2, and the column elements associated with B2 are set to zero. That is, the elements corresponding to B2 → S6 in the input correlation matrix are placed on B2 → S1, as shown in Figure 5a. Then, look for the other directly connected main switchboards and adjust the elements of the input correlation matrix in the same way to concentrate the load on the corresponding changes of the virtual centralized library.
For output correlation matrix ONet2, the row associated with S1 is superimposed with the row elements associated with S6 on the original basis, and the row elements associated with S6 are set to zero. That is, the elements corresponding to S6 → G2 in the output correlation matrix are placed on S1 → G2, as shown in Figure 5b. If there are other directly connected main switchboards, adjust the elements in the output correlation matrix in the same way. The complete process of this search method is shown in Figure 6. On this basis, the updated input and output correlation matrices INet2 and ONet2 of the generation network can be obtained after adjustment based on the connection state of the tie lines. Here, only B1 is taken as an example. If other main switchboards are used as virtual centralized libraries, the power analysis process can be analogous to the above method.
Based on the above adjustment, considering that the output load power of the generator in the power system is evenly divided according to the rated capacity, the weight of each non-zero element in the output correlation matrix is determined according to the operating state and rated capacity of each generator. The formula for calculating the weight is:
τ j k = s j k × G k G
where τ j k is the weight of the elements corresponding to the switchboard j to the generator k in ONet2 after adjusting the output matrix. sjk is the connection state between j and k in ONet2, and its value is 0 or 1. Gk is the rated power of generator k, and G is the sum of the rated power of the generator connected to the switchboard j, for which the element in ONet2 is 1. After considering the generator capacity allocation, the output correlation matrix is:
O Net 2 = τ j k × O Net 2
In Equation (9), the weight of the output correlation matrix is used to adjust the value of the corresponding element in ONet2, which can realize the power equalizing among generators according to their rated capacity and improve the operation efficiency of generators.
The dynamic mechanism of Petri net is used to deduce the output power of each generator, and its iterative formula is:
K pNet 2 i + 1 = K pNet 2 0 + K pNet 2 i × I Net 2 × O Net 2
The above formula is iterated successively from i = 0 and stops when K pNet 2 i + 1 = K pNet 2 i . Since the main switchboard of the floating nuclear power plant is directly connected to the generator, the generator output can be determined after an iteration. After that, find the disconnected position of the tie lines, and the power of the adjacent tie line is equal to the difference between the output power of the connected main switchboard and the generator. According to a certain order, the power distribution of the system can be determined by calculating the power of each tie line. Based on the power distribution of the system, it can be judged whether there are unreasonable operation conditions such as line overload or generator overload under a certain switching state, allowing for selecting a reasonable power supply path.

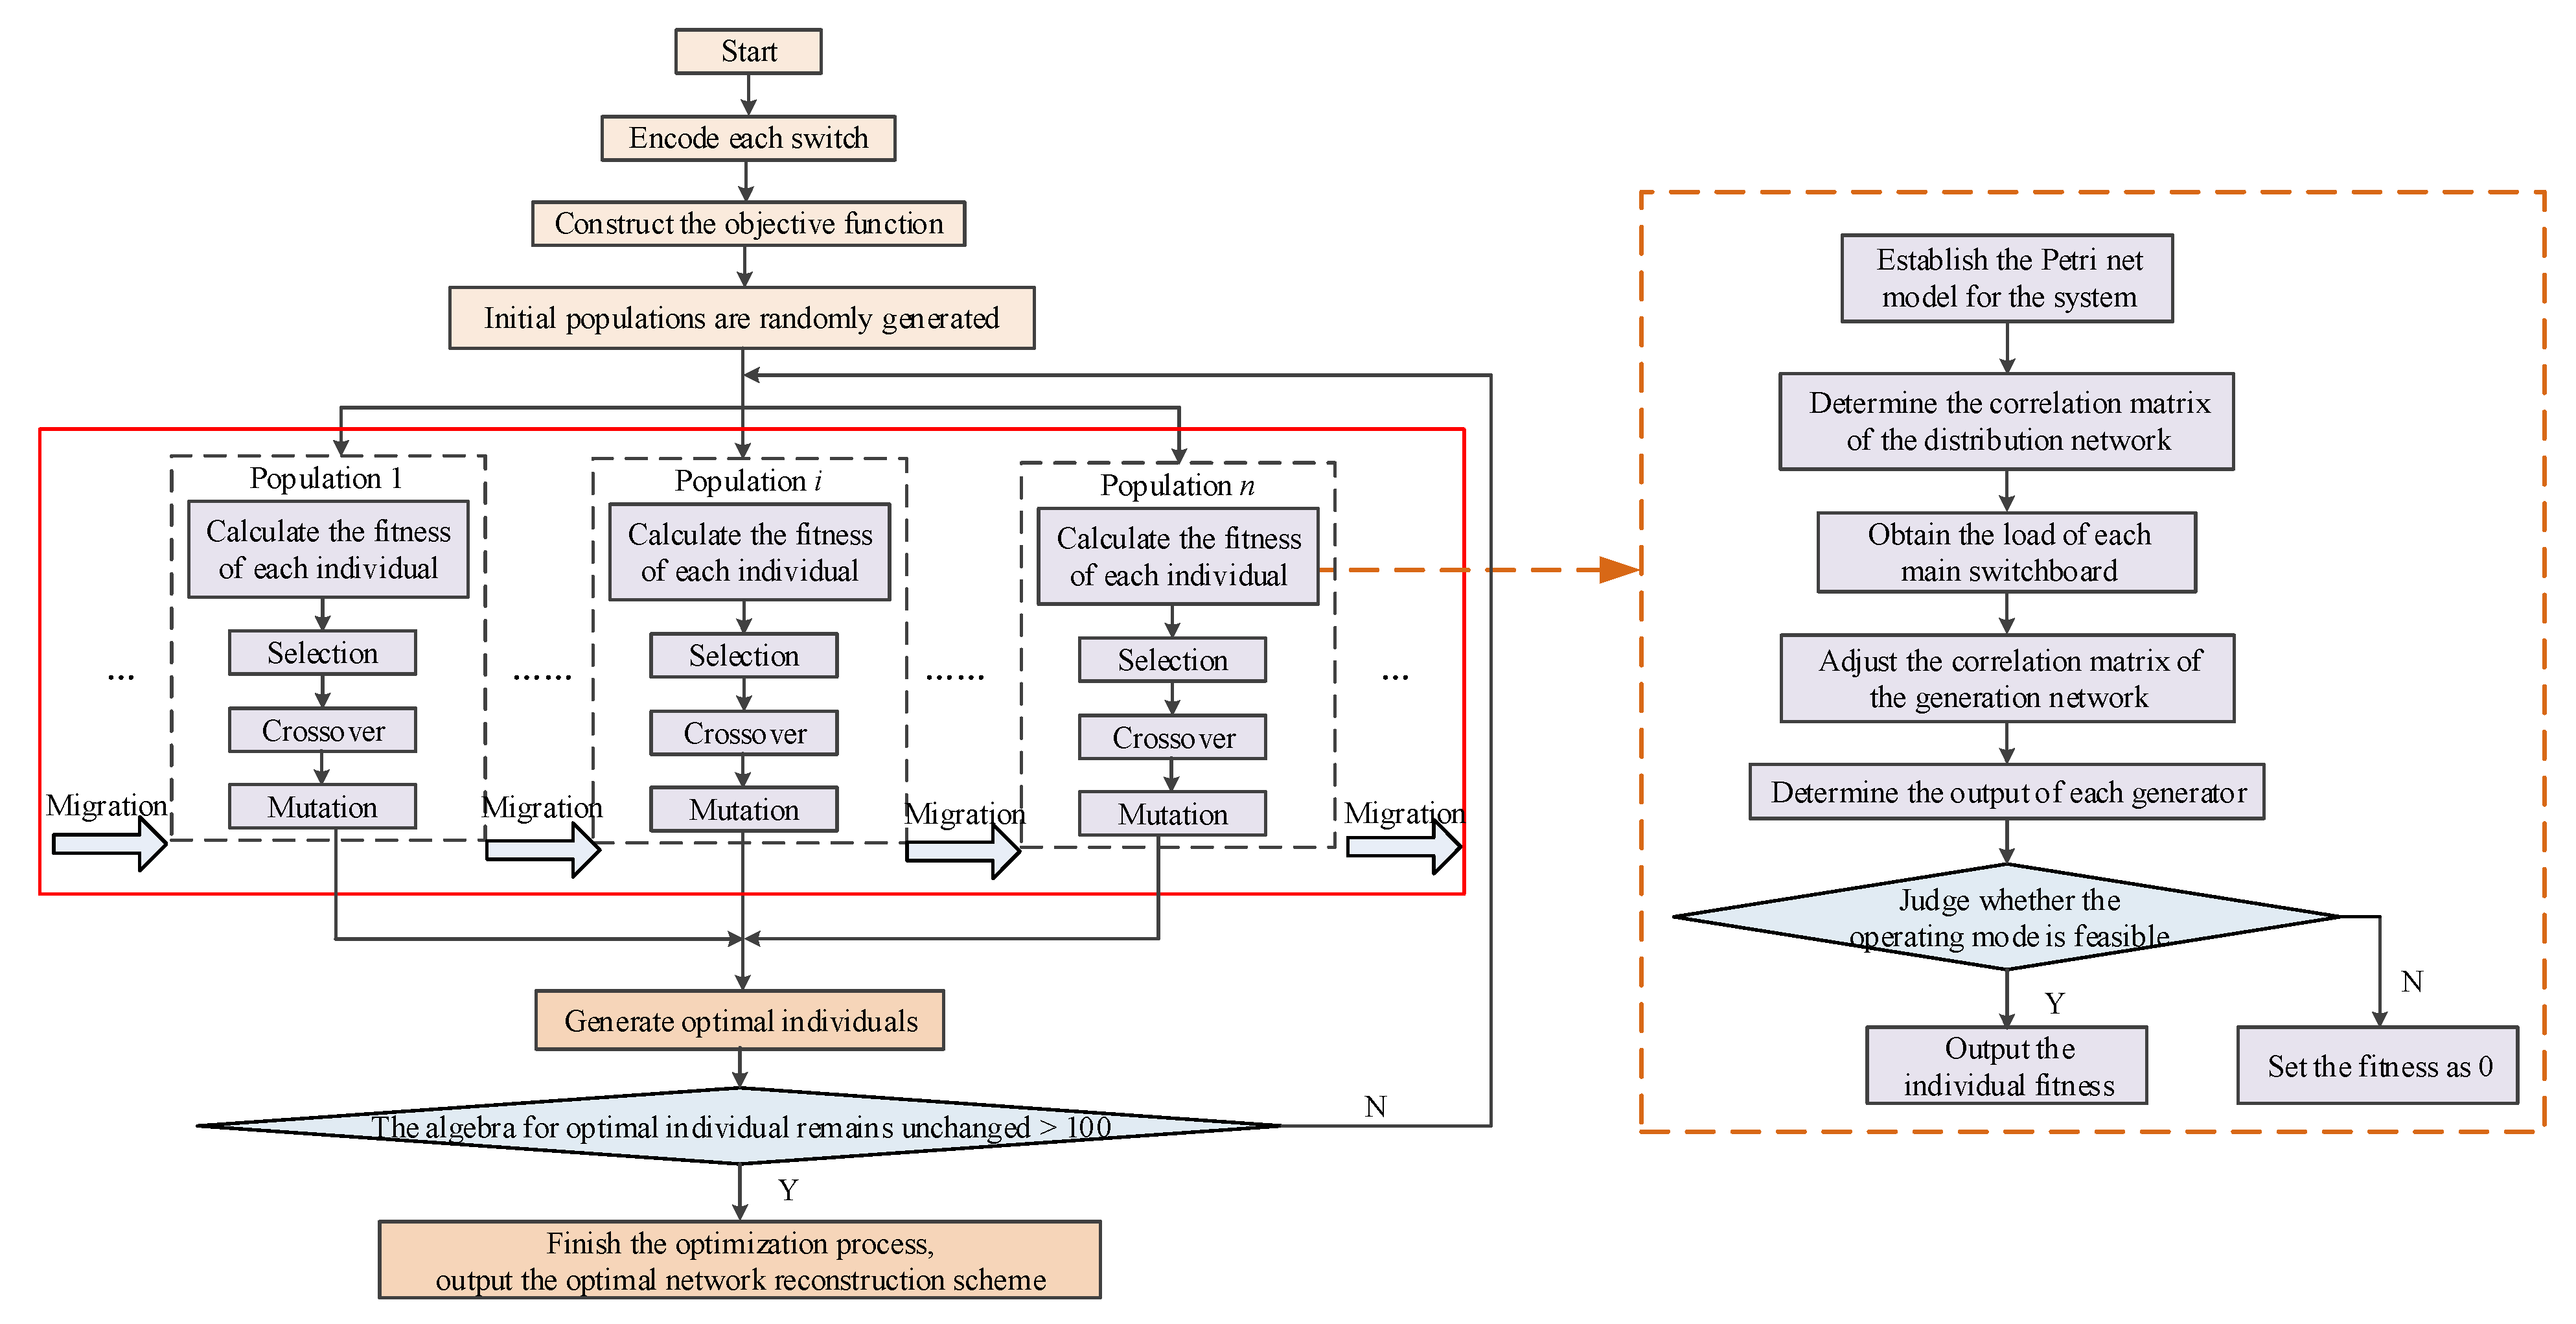
4. Network Reconstruction Process Based on MPGA

During network reconstruction, multiple combinations of switches need to be provided and optimized. For a floating nuclear power plant, the optimal solution is expected to be obtained in a short time. However, an algorithm based on a single evolutionary population cannot achieve cooperative optimization among the search population, and the result may only be locally optimal.
MPGA [32] is used in this paper. For different populations, the same objective function is set. Based on single-population genetic evolution, the crossover rate and the mutation rate are different for different populations, but the values are fixed. Thus, the optimal solution from different solution spaces can be searched. The population migration operator is used for regular information exchange between different populations to realize the collaborative optimization. Based on MPGA, the operation steps of the power system network reconstruction are as follows:
(1) Generate the initial population. According to the operation states of the system before and after the fault, the switches that are involved in the reconstruction are determined, then the initial switch state is determined and multiple populations are generated based on the random strategy. The 0–1 encoding method is used to describe the switch state, and 0–1 state is randomly generated for the switches that can participate in the network reconstruction.
(2) Population renewal. Multiple populations conduct the evolutionary search by selection, crossover and mutation at the same time, and different populations are endowed with different control parameters to achieve different search purposes. All kinds of groups are connected through migration operators, which periodically introduce the optimal individuals in the evolution process between and among groups. The specific way is to replace the worst individual in the target population with the best individual in the source population to realize the cooperative optimization among populations. In each generation of evolution, the optimal individuals are saved into the elite population by an artificial selection operator, and the elite population does not participate in the genetic evolution process.
(3) Verify. The Petri net power analysis model is used to calculate the power flow distribution of each individual under the corresponding system operation mode. Then, the objective function of each individual is calculated with Equations (1)–(4), and the calculated value is defined as the individual fitness. If Petri net analysis results show that the population under the corresponding switch state exists such that the generator output exceeds the rated power, the tie line overloads or the system does not meet the constraint conditions, such as ring mode, it means that the topology structure is feasible, and the corresponding objective function is set as 0. As a result, it is eliminated in the process of model optimization solution, and once again, the individual species are updated.
Iteration stops when the algebra number where the optimal fitness stays unchanged exceeds the maximum number of iterations. The switch state corresponding to the optimal individual is the optimal network reconstruction scheme.
The specific process is shown in Figure 7.

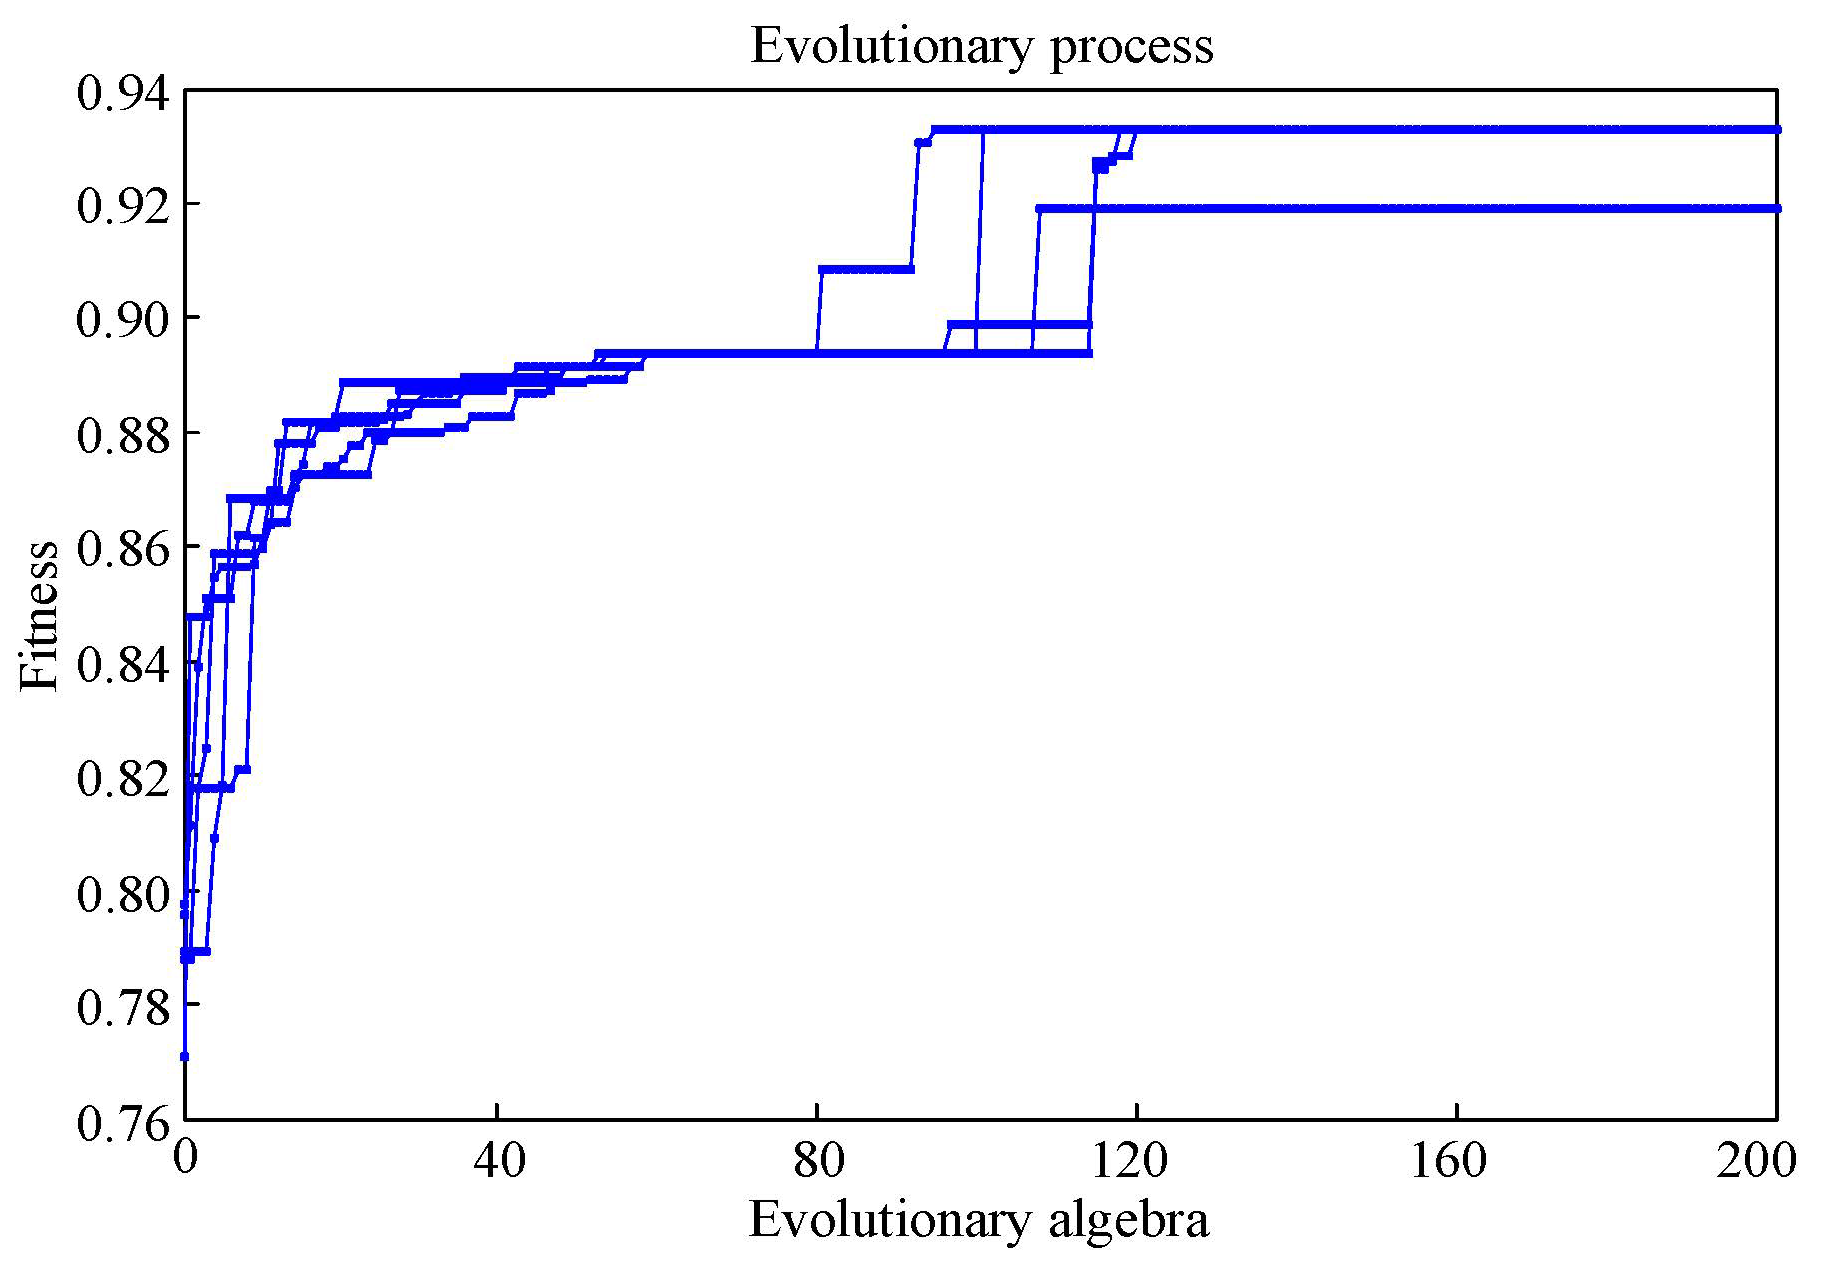
5. Simulation Results

For the floating nuclear power plant, the normal operation state is: G1, G2, G3 and G4 directly supply power to the load through their respective main switchboard, the tie lines are all out of operation and the emergency power sources are in the hot standby state. That is, all the solid line parts in Figure 2 are put into operation, the dotted line parts are out of operation and all loads are put into operation with the rated power. The per-unit power value of each load and generator in the system is given in Table 1 along with the load class. The per-unit power value of each tie line is 1 p.u.
When network reconstruction is needed to recover the power supply of the whole network, for MPGA, the population number is set as 10, the number of individuals in each population is set as 20 and the optimal population remaining algebra is set as 100. The above parameters are set considering the balance between calculation time and reliable convergence to the optimal solution. The generation gap value represents the proportion of individuals with low fitness being screened out in the genetic iteration process. When the generation gap value is high, the algorithm has more iterations and is even difficult to converge. However, a low generation gap value will lead to premature convergence. Multiple simulation results show that when the value is set as 0.9, the algorithm can ensure both rapidity and reliability. For the genetic algorithm, if the crossover probability between populations is too large, the mutation probability will be too small, the individuals in the population will be too concentrated and it will be easy to fall into local convergence. However, if the crossover probability is too small and the mutation probability is too large, it will be difficult to find the optimal individual in the evolution process. In this paper, the crossover probability range is set as 0.7~0.9, and the mutation probability range is set as 0.01~0.03. The crossover probability and mutation probability of each population randomly occur within the above range. To accelerate the convergence speed of the algorithm, referring to the updating direction principle of optimal particle guidance in a particle swarm algorithm, after individual crossover and mutation in the population, the crossover link between each population and the optimal population is added, and the optimal crossover probability ranges from 0.01 to 0.1.
When calculating individual fitness, in Equation (1), a1 = 6, a2 = 3, a3 = 2; in Equation (2), kp = 30 and km = 1; in Equation (4), w1 = 0.85, w2 = 0.1 and w3 = 0.05. Based on the network topology of the floating nuclear power plant shown in Figure 1, MATLAB software is used to conduct the simulation of the proposed method. The PC used for the following simulation case results adopts Intel I7-8700 with a 3.2 GHz processor and 8.00 GB memory.

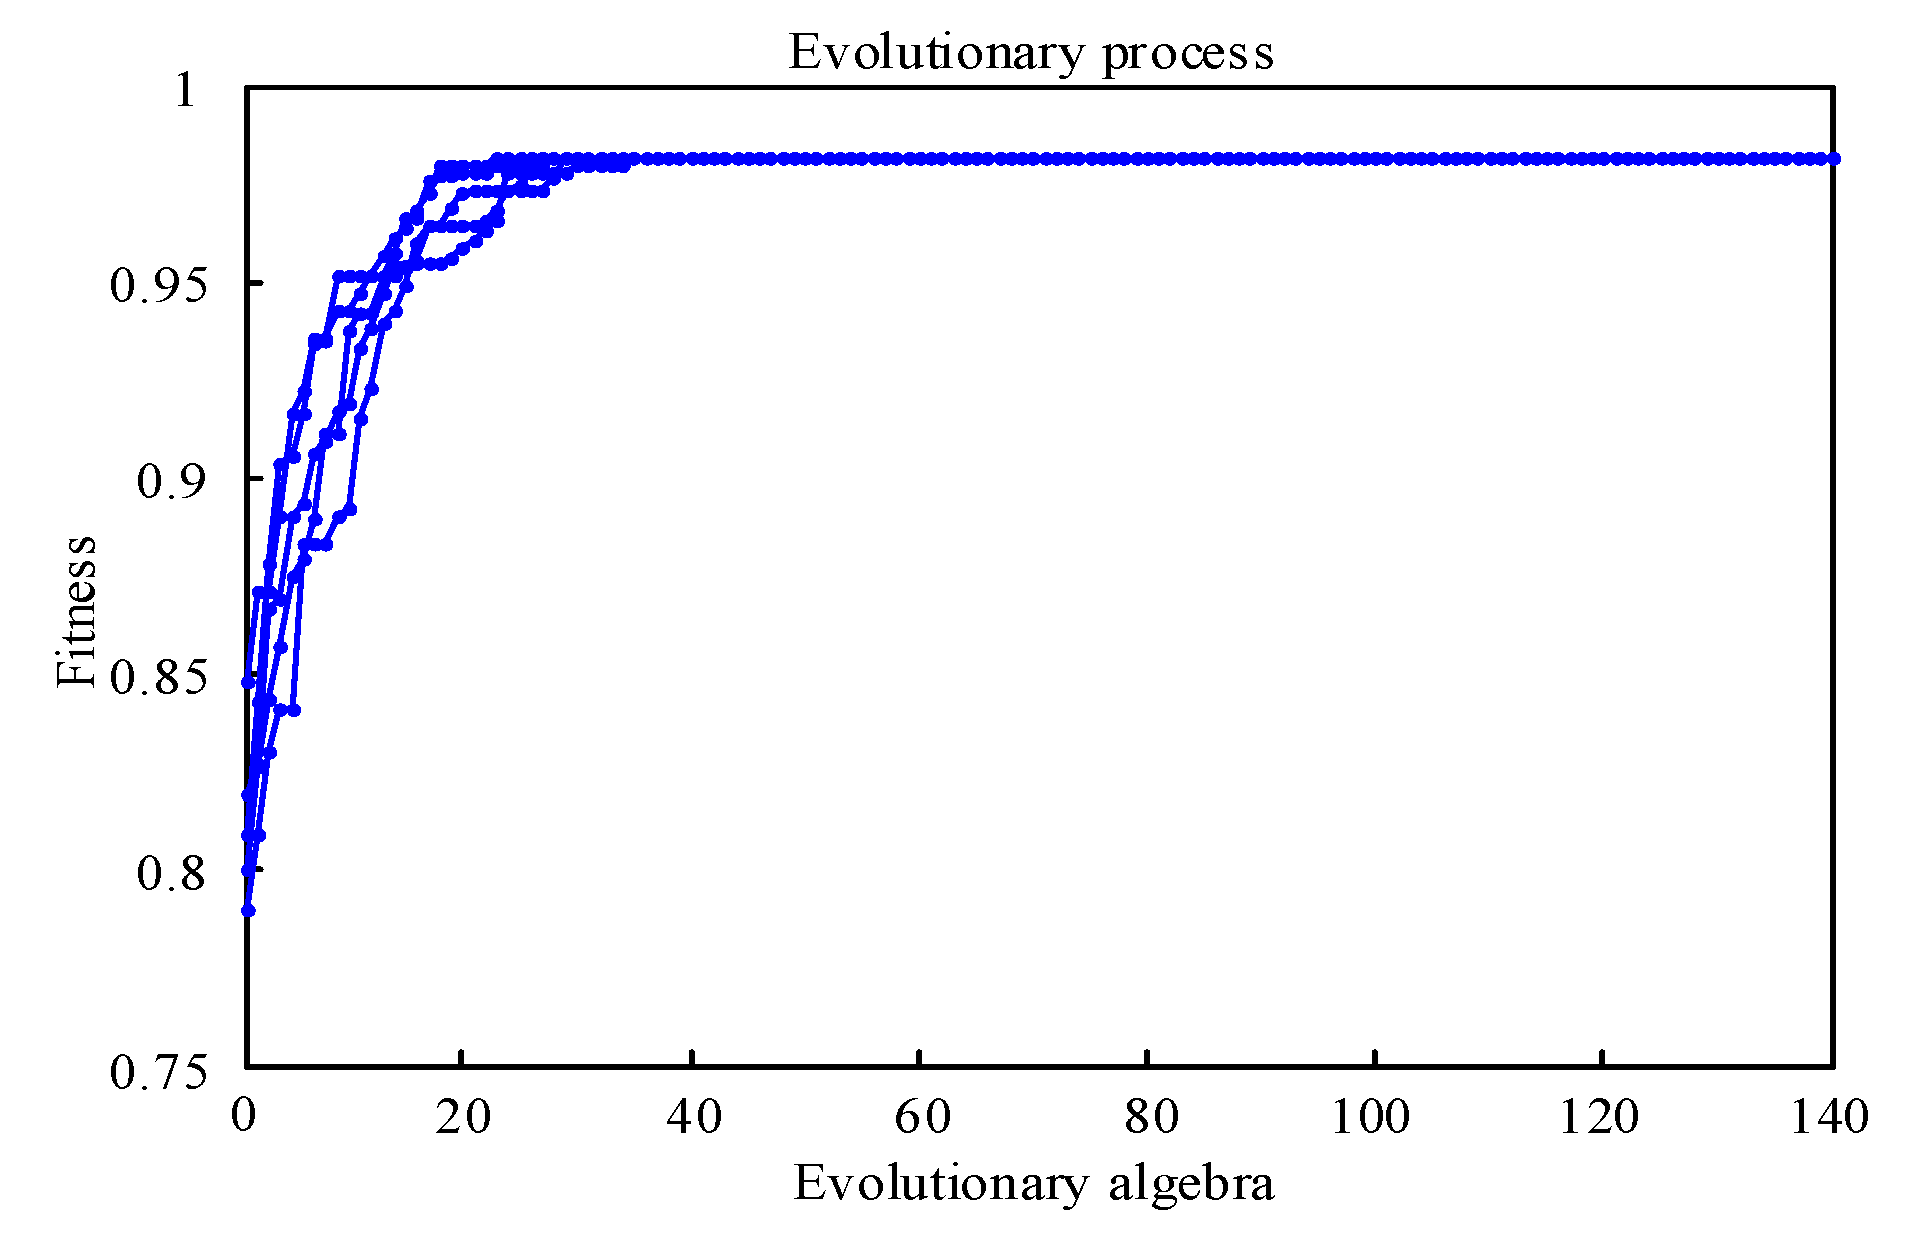
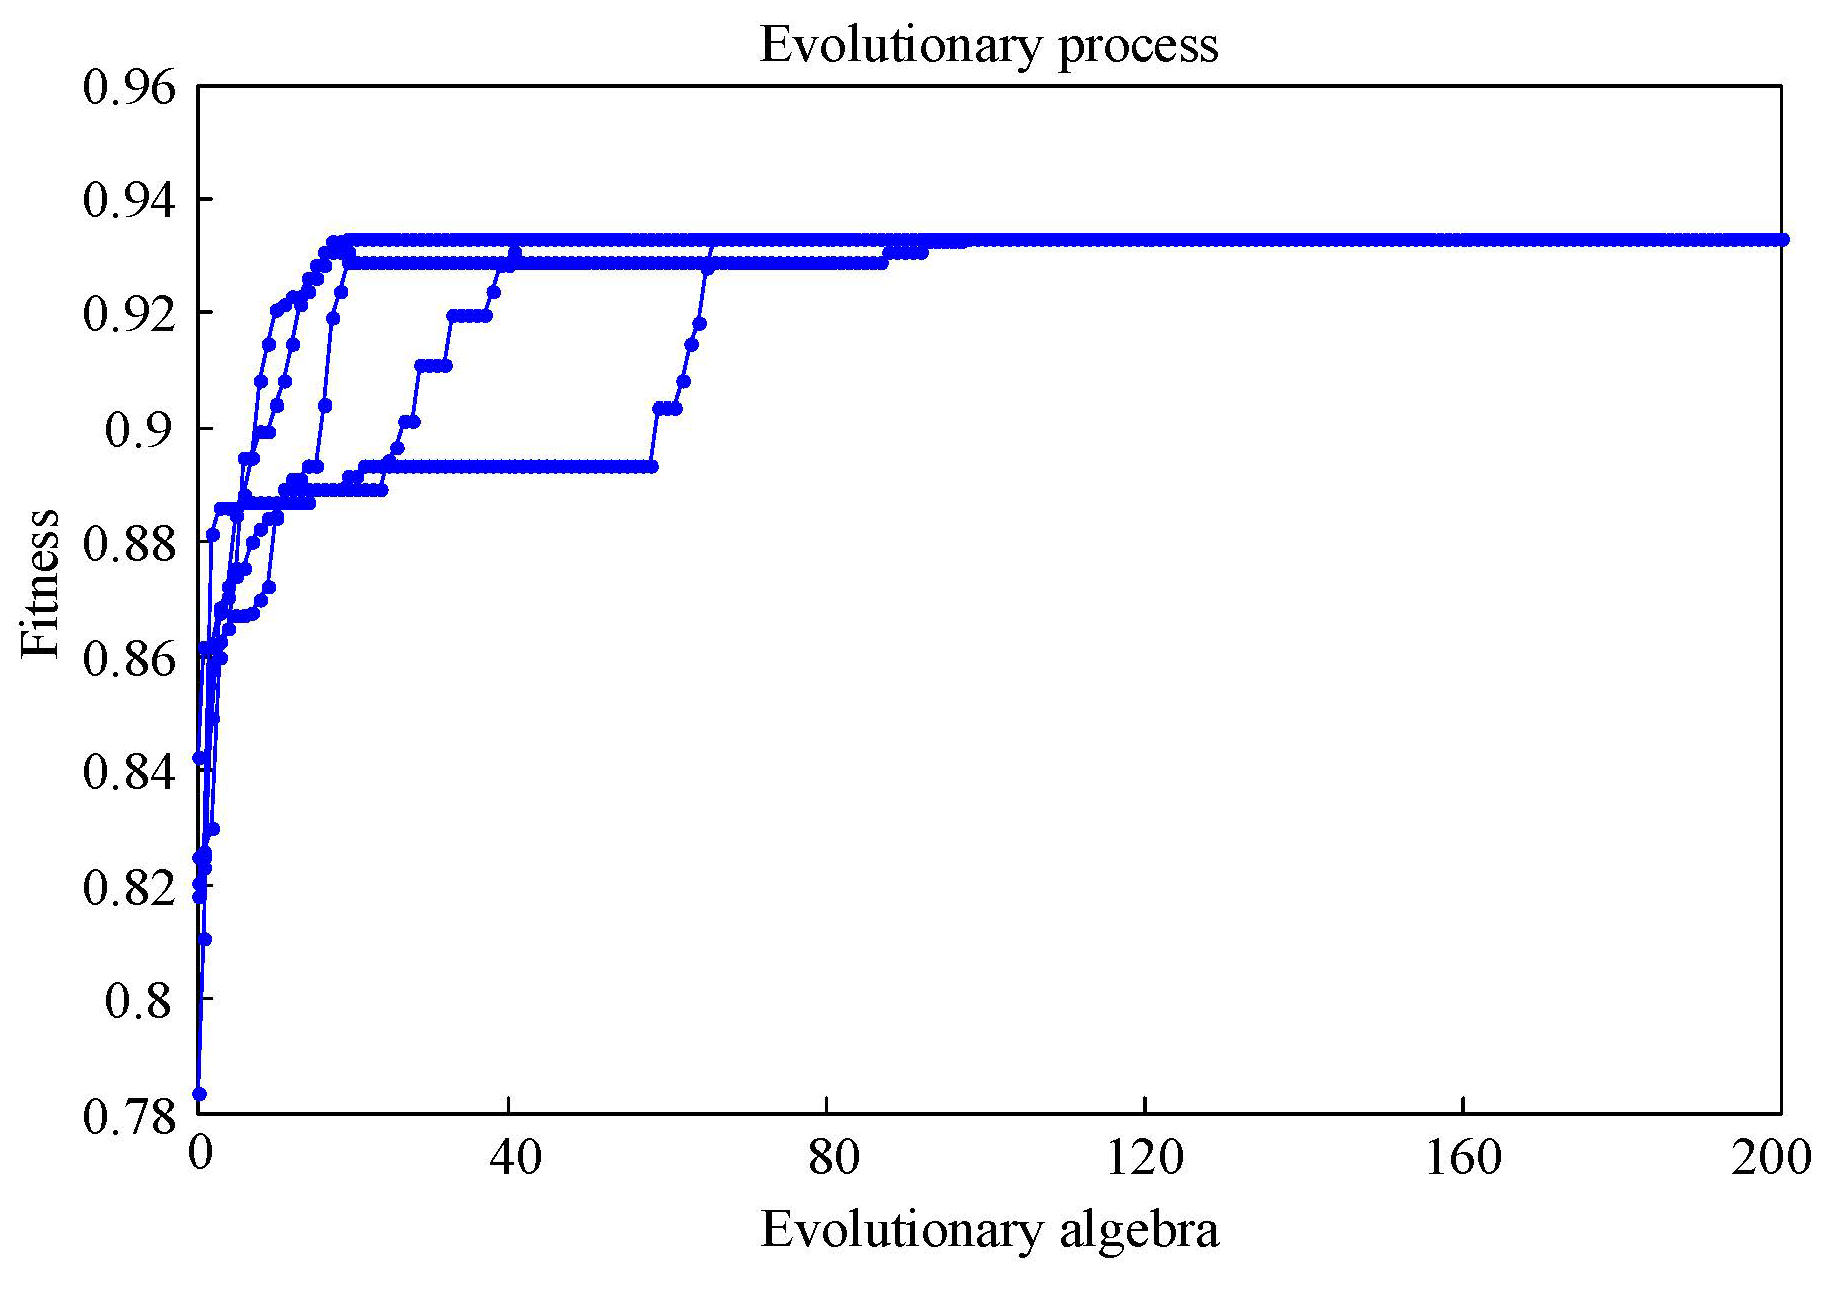
5.1. Case Analysis Results

The switches S1~S58 in the system are coded by 0–1, where 0 means switch off and 1 means switch on. In the initial operating state, except for the emergency power supply, other components are put into operation, and the tie lines are disconnected. The initial switch coding state is: 11100 11100 11111 11100 11110 01111 11001 11111 11001 11100 11111 100. The initial system topology is shown in Figure 8.
(1) Fault scenario 1. The line between L19 and B4, and the line between L20 and B4 are faulty. As a result, S36 and S37 are disconnected.
Based on fault scenario 1, S36 and S37 are enabled and do not participate in network reconstruction. System coding and network reconstruction are carried out for the remaining switches. When the MPGA is run five consecutive times, its convergence evolution process is shown in Figure 9.
The optimal convergence result is the same for multiple times, and the optimal fitness is 0.98197. The average time of the network reconstruction process is 1.03 s. The corresponding optimal switch coding state is: 11100 11100 11111 11100 11110 01111 11001 00111 11001 11100 11111 100. Decoding the results, the optimal network reconstruction scheme is obtained as: switch S36 and S37 are off, and other network topologies remain unchanged. This is consistent with the above analysis conclusion in this paper. When the line between the load and the distribution board is faulty, the load power supply cannot be restored through network reconstruction. The revised system topology is shown in Figure 10.
(2) Fault scenario 2. Generator G4 in the distribution network quits operation due to failure, and the line between LB4 and B4 is broken down. Thus, S35 and S38 are disconnected.
After fault, recover the regional power supply first. Y3 is used to supply power to the loads carried by LB4, and Y4 is used to supply power to loads carried by LB5 and LB6. Moreover, Y3 can supply power to L19 and L20 through LB6. At this time, switches S43, S44, S49 and S50 are closed. To avoid forming a ring network, switch S40 is disconnected.
Since the emergency power sources cannot be used for long-term power supply, it is necessary to recover the power supply through whole network reconstruction and transfer the system to the power supply mode by the main generator. Based on the analysis of the current operating status of the system, generator G4 exits operation due to failure and cannot participate in the network reconstruction. The line between LB4 and B4 is faulty, so the loads connected to LB4 cannot be powered by the main generator through network reconstruction and can only be powered by Y3. Other loads are directly or indirectly connected to B4 and can be switched to the main generator power supply mode through network reconstruction.
According to fault scenario 2, compared with the initial operating status, switches S35 and S38 are disconnected due to faults and do not participate in network reconstruction. LB4 connects Y3, and they form a local power grid. Thus, S41~S46 do not participate in the whole network reconstruction, and S40 is disconnected before the network reconstruction. Before whole network reconstruction, the switch coding state is: 11100 11100 11111 11100 11110 01111 11000 11010 11111 11111 11111 100. MPGA is run five consecutive times. The convergence evolution process is shown in Figure 11.
The results of optimal convergence are the same after running multiple times, and it can stably converge to the optimal network reconstruction scheme; the optimal fitness is 0.93295. The corresponding optimal switch coding state is: 10100 11100 11111 11100 11110 01111 11000 11011 11101 11100 11111 111. Decoding the results, the optimal network reconstruction scheme is obtained as: turn on switches S40, S57 and S58 and turn off switches S2, S44, S49 and S50. Under this scheme, the tie line between B1 and B4 is put into operation, and the transmitted power is 0.85 p.u. After S2 is disconnected, load L1 exits, which is a third-class load for the seawater purification. Apart from providing freshwater, it is mainly used for regulating system power and does not influence the system’s operation safety. The connected loads of LB5 are transferred to G1, and other loads are normally supplied. The outputs of each generator are 7.85 p.u., 8 p.u., 1 p.u. and 0. The lowest operating efficiency of the generator is 98.13%. The average time of the network reconstruction process is 3.12 s. The revised system topology is shown in Figure 12.
(3) Fault scenario 3. Generator G4 in the distribution network quits operation due to failure, and the line between LB4 and B4 is broken. Thus, switches S35 and S38 are disconnected. Moreover, the working transformer between B1 and B4 is faulty. Thus, S57 and S58 are disconnected and cannot be put into operation.
Fault scenario 3 is similar to fault scenario 2 in that the regional power recovery measures are the same. The difference is that during the network reconstruction, the tie line between B1 and B4 cannot be used for power transmission, and another power supply path is required. The switches participating in the whole network reconstruction are systematically coded, and MPGA is run five consecutive times. The convergence evolution process is shown in Figure 13.
The results of optimal convergence are the same after running multiple times, and it can stably converge to the optimal network reconstruction scheme; the optimal fitness is 0.91789. The corresponding optimal switch coding state is: 11100 10111 11111 11100 11110 01111 11110 11011 11101 11100 11111 100. Decoding the results, the optimal network reconstruction scheme is obtained as: turn on switches S9, S10, S33, S34, S40 and turn off switches S7, S44, S49, S50. Under this scheme, the tie lines of B2, B3 and B4 are put into operation, which is equivalent to transferring power from G2 to B4. The power transmitted on the two tie lines is 0.85 p.u. After switch S7 is disconnected, load L3 exits, which is a third-class load for the seawater purification. LB5 is transferred to G2, and other loads are normally supplied. The outputs of each generator are 8 p.u., 7.85 p.u., 1 p.u. and 0. The lowest operating efficiency of the generator is 98.13%. The average time of the network reconstruction process is 2.91 s. The revised system topology is shown in Figure 14.

5.2. Comparison with Existing Methods

To verify that the MPGA method can quickly and reliably search for the optimal solution of network reconstruction, it is compared with the commonly used optimization algorithms. The traditional single-population genetic algorithm (SGA) and the double sub-swarms particle swarm optimization algorithm (DSPSO) [33] are selected as the comparison algorithms.
Take fault scenario 2 as an example. When SGA is adopted, 200 individuals are set, the iteration number is 200, the crossover probability is 0.7 and the mutation probability is 0.014. The algorithm is also run continuously five times. The convergence results are shown in Figure 15.
For fault scenario 2, when SGA is used, the optimal fitness values corresponding to the convergence results of five runs are 0.91765, 0.93295, 0.9217, 0.93064 and 0.90096. The convergence results are not all the same, only one-time convergences to the optimal solution, with an average time of 4.92 s.
This is because the SGA only relies on the genetic evolution of a single population in the genetic process; it cannot provide the optimal recovery strategy. The corresponding switch-coding state with the fitness of 0.9217 is: 10101 11110 11111 11100 11110 01111 11000 10011 11101 11100 11111 111. Decode the network reconstruction result. The corresponding network reconstruction scheme is: turn on switches S5, S9, S40, S57, S58 and turn off switches S2, S37, S44, S49, S50. Comparing with the optimal reconstruction scheme obtained by MPGA, the differences lie in that load L20 exits, which increases the off-power load. Close switch S5 and S9 but not S4 and S10, so the tie lines are not effectively connected. This is equivalent to invalid switch closing, which increases the number of switch operation costs. The outputs of each generator are 7.75 p.u., 8 p.u., 1 p.u. and 0, and the lowest operating efficiency of the generator is 96.87%. The operating efficiency is reduced.
When DSPSO is adopted, the size of the main group is set as 200, and the size of the auxiliary group is set as 100. The dimensions of both the main group and the auxiliary group are set as 20, the number of iterations is 200, the acceleration factor is 2 and the initial inertia weight is 0.9. The algorithm is also run continuously five times. The convergence results are shown in Figure 16.
When DSPSO is used, the optimal fitness values corresponding to convergence results of five runs is 0.93295, 0.9191, 0.93295, 0.93295 and 0.93295. In most cases, it could converge to the optimal solution, only once failing to do so. The average searching time is 4.13 s. The optimal solution is searched through the joint search of the main group and the auxiliary group. Although it is helpful for finding the optimal solution, the search time is long due to the large sizes of the main group and the auxiliary group.
By comparing with different algorithms, the maximum fitness based on MPGA, SGA and DSPSO algorithm is 0.93295. This solution was verified by multiple simulation results, and it can be viewed as the optimal fitness. Moreover, the corresponding system topology is considered the optimal solution. Under the condition of five consecutive simulations, MPGA achieves the optimal solution all five times, and the reliability is 100%. SGA achieves the optimal solution only once, and the reliability is 20%. DSPSO achieves the optimal solution four times, and the reliability is 80%. In the searching process, the average times for MPGA, SGA, DSPSO are 3.12 s, 4.92 s and 4.13 s, respectively. Compared with the time used by the method in [34], it can be seen that the method in this paper can be used for fault recovery. The simulation time is related not only to the principle of the algorithm but also to the computational ability of the computer. In practical application, if a computer with better computational performance is used, the computational time used in each iteration process can be shortened, and the computational speed can be greatly improved. Under the three fault scenarios, all the three methods have been run continuously five times. The optimal solution, reliability and average computational time of the three methods are shown in Table 2.
Through comprehensive comparison, it can be concluded that although all the three methods can find the optimal solution under certain conditions, the MPGA method has the advantages of computational speed and reliability, which can provide an effective fault recovery scheme for the power systems in floating nuclear power plants.

6. Conclusions

In this paper, a power recovery strategy based on a Petri net is proposed for a power system in a floating nuclear power plant, and the following conclusions are drawn:
(1)
A two-stage power recovery model is adopted to ensure a reliable and continuous power supply for sensitive loads of nuclear reactors. During the network reconstruction, load class difference, switching operation cost difference and generator operation efficiency are considered, which can provide a complete system reconstruction scheme.
(2)
The Petri net model is not affected by line parameters and system topology and is suitable for the power system of a floating nuclear power plant, whose power supply and distribution systems are compactly connected. The power flow analysis can judge the load supply condition, conduct the balanced distribution of generator output and check the system capacity constraint, which realizes efficient interaction between system topology analysis and power analysis.
(3)
For MPGA, multiple populations with different control parameters co-evolve together. Both global and local searches are conducted. The migration algorithm can realize cooperative optimization among various groups and reduce the number of iterations in the search process. Compared with other algorithms, the proposed algorithm has the advantages of computational speed and reliability, which can provide complete power supply recovery.

Author Contributions

Conceptualization, Y.W. and X.Y. (Xianggen Yin); methodology, X.Y. (Xin Yin); software, J.Q.; validation, Y.W., X.Y. (Xin Yin) and L.T.; formal analysis, X.Y. (Xianggen Yin); investigation, L.T.; resources, Y.W.; data curation, Y.W.; writing—original draft preparation, Y.W.; writing—review and editing, X.Y. (Xin Yin); visualization, X.Y. (Xianggen Yin); supervision, L.T.; project administration, J.Q.; funding acquisition, X.Y. (Xianggen Yin). All authors have read and agreed to the published version of the manuscript.

Funding

This research was funded by the National Natural Science Foundation of China, grant number 51877089.

Institutional Review Board Statement

Not applicable.

Informed Consent Statement

Not applicable.

Data Availability Statement

Not applicable.

Conflicts of Interest

The authors declare no conflict of interest.

References

  1. Buongiorno, J.; Jurewicz, J.; Golay, M.; Todreas, N. The offshore floating nuclear plant concept. Nucl. Technol. 2016, 194, 1–14. [Google Scholar] [CrossRef]
  2. Paik, J.K.; Paik, J.H. Impact crashworthiness of a floating offshore nuclear power plant hull structure in a terrorist attack with an aircraft strike. Ships Offshore Struct. 2021, 15, 176–189. [Google Scholar] [CrossRef]
  3. Lee, K.H.; Kim, M.G.; Lee, J.I.; Lee, P.S. Recent Advances in Ocean Nuclear Power Plants. Energies 2015, 8, 11470–11492. [Google Scholar] [CrossRef]
  4. Wang, Y.K.; Yin, X.; Xu, W.; Yin, X.G.; Wen, M.H.; Jiang, L. Fault line selection in cooperation with multi-mode grounding control for the floating nuclear power plant grid. Prot. Control. Mod. Power Syst. 2020, 5, 1–10. [Google Scholar] [CrossRef]
  5. Wang, Y.K.; Yin, X.G.; Qiao, J.; Tan, L.M.; Xu, W.; Li, W. Generator stator windings ground fault diagnosis for generator–grid directly connected system of floating nuclear power plant. Energy Rep. 2021, 7, 460–469. [Google Scholar] [CrossRef]
  6. Teimourzadeh, S.; Zare, K. Application of binary group search optimization to distribution network reconfiguration. Int. J. Electr. Power Energy Syst. 2014, 62, 461–468. [Google Scholar] [CrossRef]
  7. Zhu, W.L.; Shi, J.; Zhi, P.F.; Fan, L.; Lim, G.J. Distributed Reconfiguration of a Hybrid Shipboard Power System. IEEE Trans. Power Syst. 2021, 36, 4–16. [Google Scholar] [CrossRef]
  8. Bose, S.; Pal, S.; Natarajan, B.; Scoglio, C.M.; Das, S.; Schulz, N.N. Analysis of Optimal Reconfiguration of Shipboard Power Systems. IEEE Trans. Power Syst. 2012, 27, 189–197. [Google Scholar] [CrossRef]
  9. Aman, M.M.; Jasmon, G.B.; Bakar, A.H.A.; Mokhlis, H. Optimum network reconfiguration based on maximization of system loadability using continuation power flow theorem. Int. J. Electr. Power Energy Syst. 2014, 54, 123–133. [Google Scholar] [CrossRef]
  10. Amanulla, B.; Chakrabarti, S.; Singh, S.N. Reconfiguration of power distribution systems considering reliability and power loss. IEEE Trans. Power Deliv. 2012, 27, 918–926. [Google Scholar] [CrossRef]
  11. Pegado, R.; Naupari, Z.; Molina, Y.; Castillo, C. Radial distribution network reconfiguration for power losses reduction based on improved selective BPSO. Electr. Power Syst. Res. 2019, 169, 206–213. [Google Scholar] [CrossRef]
  12. Kavousi-Fard, A.; Niknam, T. Multi-objective stochastic Distribution Feeder Reconfiguration from the reliability point of view. Energy 2014, 64, 342–354. [Google Scholar] [CrossRef]
  13. Wang, Y.K.; Yin, X.G.; Qiao, J.; Tan, L.M.; Xu, W. Inrush current suppression technology for floating nuclear power plants based on connecting Pre-T in series. Int. J. Electr. Power Energy Syst. 2022, 135, 107508. [Google Scholar] [CrossRef]
  14. Shariatzadeh, F.; Kumar, N.; Srivastava, A.K. Optimal Control Algorithms for Reconfiguration of Shipboard Microgrid Distribution System Using Intelligent Techniques. IEEE Trans. Ind. Appl. 2017, 53, 474–482. [Google Scholar] [CrossRef]
  15. Wang, C.; Liu, Y.C.; Zhao, Y.T. Application of dynamic neighborhood small population particle swarm optimization for reconfiguration of shipboard power system. Eng. Appl. Artif. Intell. 2013, 26, 1255–1262. [Google Scholar] [CrossRef]
  16. Zhou, R.H. Research of the Topology Analysis and Power Flow Calculation for Shipboard Power System. Master’s Thesis, Huazhong University of Science and Technology, Wuhan, China, 2009; pp. 35–40. [Google Scholar]
  17. Baldwin, T.L.; Lewis, S.A. Distribution, load flow methods for shipboard tower systems. IEEE Trans. Ind. Appl. 2004, 40, 1183–1190. [Google Scholar] [CrossRef]
  18. Shirmohammadi, D.; Hong, H.W.; Semlyen, A.; Luo, G.X. A compensation-based power flow method for weakly meshed distribution and transmission networks. IEEE Trans. Power Syst. 1988, 3, 753–762. [Google Scholar] [CrossRef]
  19. Baran, M.E.; Wu, F.F. Optimal sizing of capacitors placed on a radial distribution system. IEEE Trans. Power Deliv. 1989, 4, 735–743. [Google Scholar] [CrossRef]
  20. Chen, T.H.; Chen, M.S.; Hwang, K.J.; Kotas, P.; Chebli, E.A. Distribution system power flow analysis—A rigid approach. IEEE Trans. Power Deliv. 1991, 6, 1146–1152. [Google Scholar] [CrossRef]
  21. Feng, X.Y.; Butler-Purry, K.L.; Zourntos, T. Multi-Agent System-Based Real-Time Load Management for All-Electric Ship Power Systems in DC Zone Level. IEEE Trans. Power Syst. 2012, 27, 1719–1728. [Google Scholar] [CrossRef]
  22. Su, C.L.; Lan, C.K.; Chou, T.C.; Chen, C.J. Performance Evaluation of Multiagent Systems for Navy Shipboard Power System Restoration. IEEE Trans. Ind. Appl. 2015, 51, 2769–2779. [Google Scholar] [CrossRef]
  23. Das, S.; Bose, S.; Pal, S.; Schulz, N.N.; Scoglio, C.M.; Natarajan, B. Dynamic Reconfiguration of Shipboard Power Systems Using Reinforcement Learning. IEEE Trans. Power Syst. 2013, 28, 669–676. [Google Scholar] [CrossRef]
  24. Mitra, P.; Venayagamoorthy, G.K. Implementation of an Intelligent Reconfiguration Algorithm for an Electric Ship’s Power System. IEEE Trans. Ind. Appl. 2011, 47, 2292–2300. [Google Scholar] [CrossRef]
  25. Gu, X.P.; Liu, W.X.; Wang, J.Y.; Jia, J.H. An Optimization Approach Based on Multiple Time-Step Coordination for Decision Making of Unit Restoration. Trans. China Electr. Soc. 2016, 31, 114–124. [Google Scholar]
  26. Xie, Y.; Song, K.; Wu, Q.; Zhou, Q. Orthogonal genetic algorithm based power system restoration path optimization. Int. Trans. Electr. Energy Syst. 2018, 28, e2630. [Google Scholar] [CrossRef]
  27. Choopani, K.; Hedayati, M.; Effatnejad, R. Self-healing optimization in active distribution network to improve reliability, and reduction losses, switching cost and load shedding. Int. Trans. Electr. Energy Syst. 2020, 30, e12348. [Google Scholar] [CrossRef]
  28. He, F.; Cai, X.G. Network reconfiguration of shipboard power system based on improved genetic arithmetic. Trans. China Electr. 2006, 21, 25–30. [Google Scholar]
  29. Groselj, P.; Stirn, L.Z. Evaluation of several approaches for deriving weights in fuzzy group analytic hierarchy process. J. Decis. Syst. 2018, 27, 217–226. [Google Scholar] [CrossRef]
  30. Kim, I.; Xu, S. Bus voltage control and optimization strategies for power flow analyses using Petri net approach. Int. J. Electr. Power Energy Syst. 2019, 112, 353–361. [Google Scholar] [CrossRef]
  31. Xu, B.; Yin, X.; Yin, X.G.; Wang, Y.K.; Pang, S. Fault Diagnosis of Power Systems Based on Temporal Constrained Fuzzy Petri Nets. IEEE Access 2019, 7, 101895–101904. [Google Scholar] [CrossRef]
  32. Chen, Y.; Cui, C.Y.; Wu, Y. Nondestructive detection model of soluble solids content of an apple using visible/near-infrared spectroscopy combined with CARS and MPGA. Appl. Opt. 2021, 60, 8400–8407. [Google Scholar] [CrossRef] [PubMed]
  33. Chu, Y.H.; Huang, Q.L. Reconfiguration of shipboard power system based on double sub-swarms particle swarm optimization. Electron. Des. Eng. 2017, 25, 37–41. [Google Scholar]
  34. Li, J.J.; Xu, B.W.; Gan, S.H.; Zhang, H.G.; Wu, Y.X. Discrete Particle Swarm Optimization Algorithm Based on Greed Table for Network Reconfiguration of the Shipboard Power System. Trans. China Electrotech. Soc. 2011, 26, 146–151. [Google Scholar]
Figure 1. Schematic diagram of the typical structure of a floating nuclear power plant.
Applsci 12 09026 g001
Figure 2. Topological wiring diagram of the power system network for the floating nuclear power plant.
Applsci 12 09026 g002
Figure 3. Petri net model for power analysis. (a) Simple power network. (b) Equivalent Petri net model.
Applsci 12 09026 g003
Figure 4. Petri net model for the floating nuclear power plant system.
Applsci 12 09026 g004
Figure 5. Correlation matrix adjustment process. (a) Input correlation matrix adjustment process. (b) Output correlation matrix adjustment process.
Applsci 12 09026 g005
Figure 6. Correlation matrix adjustment process based on the tie line condition.
Applsci 12 09026 g006
Figure 7. Network reconstruction process.
Applsci 12 09026 g007
Figure 8. The initial system topology.
Applsci 12 09026 g008
Figure 9. Convergence procedure of the MPGA under fault scenario 1.
Applsci 12 09026 g009
Figure 10. The revised system topology under fault scenario 1.
Applsci 12 09026 g010
Figure 11. Convergence procedure of the MPGA under fault scenario 2.
Applsci 12 09026 g011
Figure 12. The revised system topology under fault scenario 2.
Applsci 12 09026 g012
Figure 13. Convergence procedure of the MPGA under fault scenario 3.
Applsci 12 09026 g013
Figure 14. The revised system topology under fault scenario 3.
Applsci 12 09026 g014
Figure 15. Convergence procedure of the SGA under fault scenario 2.
Applsci 12 09026 g015
Figure 16. Convergence procedure of the DSPSO under fault scenario 2.
Applsci 12 09026 g016
Table 1. Power parameters of the loads and generators (p.u.).
No.Per-Unit Power/Load ClassNo.Per-Unit Power/Load ClassNo.Per-Unit Power/Load ClassNo.Per-Unit Power/Load Class
L11.0/3L110.0375/2L210.0375/2L310.15/1
L27.0/3L120.0375/2L220.0375/2L320.1/1
L31.0/3L130.0375/2L230.0375/2G18.0
L47.0/3L140.0375/2L240.0375/2G28.0
L50.1/2L150.1/1L250.0375/2G31.0
L60.1/2L160.15/1L260.0375/2G41.0
L70.0375/2L170.15/1L270.0375/2Y10.65
L80.0375/2L180.1/1L280.0375/2Y20.65
L90.0375/2L190.1/2L290.1/1Y30.65
L100.0375/2L200.1/2L300.15/1Y40.65
Table 2. Comparison results of the three methods.
Fault ScenarioMPGASGADSPSO
1Optimal solution0.981970.981970.98197
Reliability100%80%100%
Average time1.03 s2.05 s1.96 s
2Optimal solution0.932950.932950.93295
Reliability100%20%80%
Average time3.12 s4.92 s4.13 s
3Optimal solution0.917890.917890.91789
Reliability100%20%60%
Average time2.91 s4.59 s3.94 s
Publisher’s Note: MDPI stays neutral with regard to jurisdictional claims in published maps and institutional affiliations.

