Abstract
A 1/20 scale model of a Y-shaped irregular bridge was designed, and shaking-table tests were performed to simulate its failure mechanism and performance characteristics when subjected to a multidirectional strong earthquake. The results showed that the irregular bridge structure could accelerate in the horizontal direction when subjected to vertical excitation. For both unidirectional and multidirectional excitation, the acceleration response of the pier top was more significant in the transverse direction than in the longitudinal direction. For the variable-section and branching curved beams (i.e., ramp), the response to three-dimensional excitation was equivalent to the direct superposition of the responses to bidirectional excitation and single vertical excitation. With multidirectional excitation, the girder and ramp were more prone to structural collision. However, the likelihood of structural collision was not increased with multidirectional excitation than with bidirectional excitation. The displacement of the pier and beam was very large at the junction of the variable-section main beam and branching curved beam, so bearing failure and falling beams easily occurred. Multidirectional excitation generally increased the vertical acceleration response of the two piers and pier top at the irregular bridge branch, demonstrating the need to consider shock absorption and isolation in designing these locations.
1. Introduction
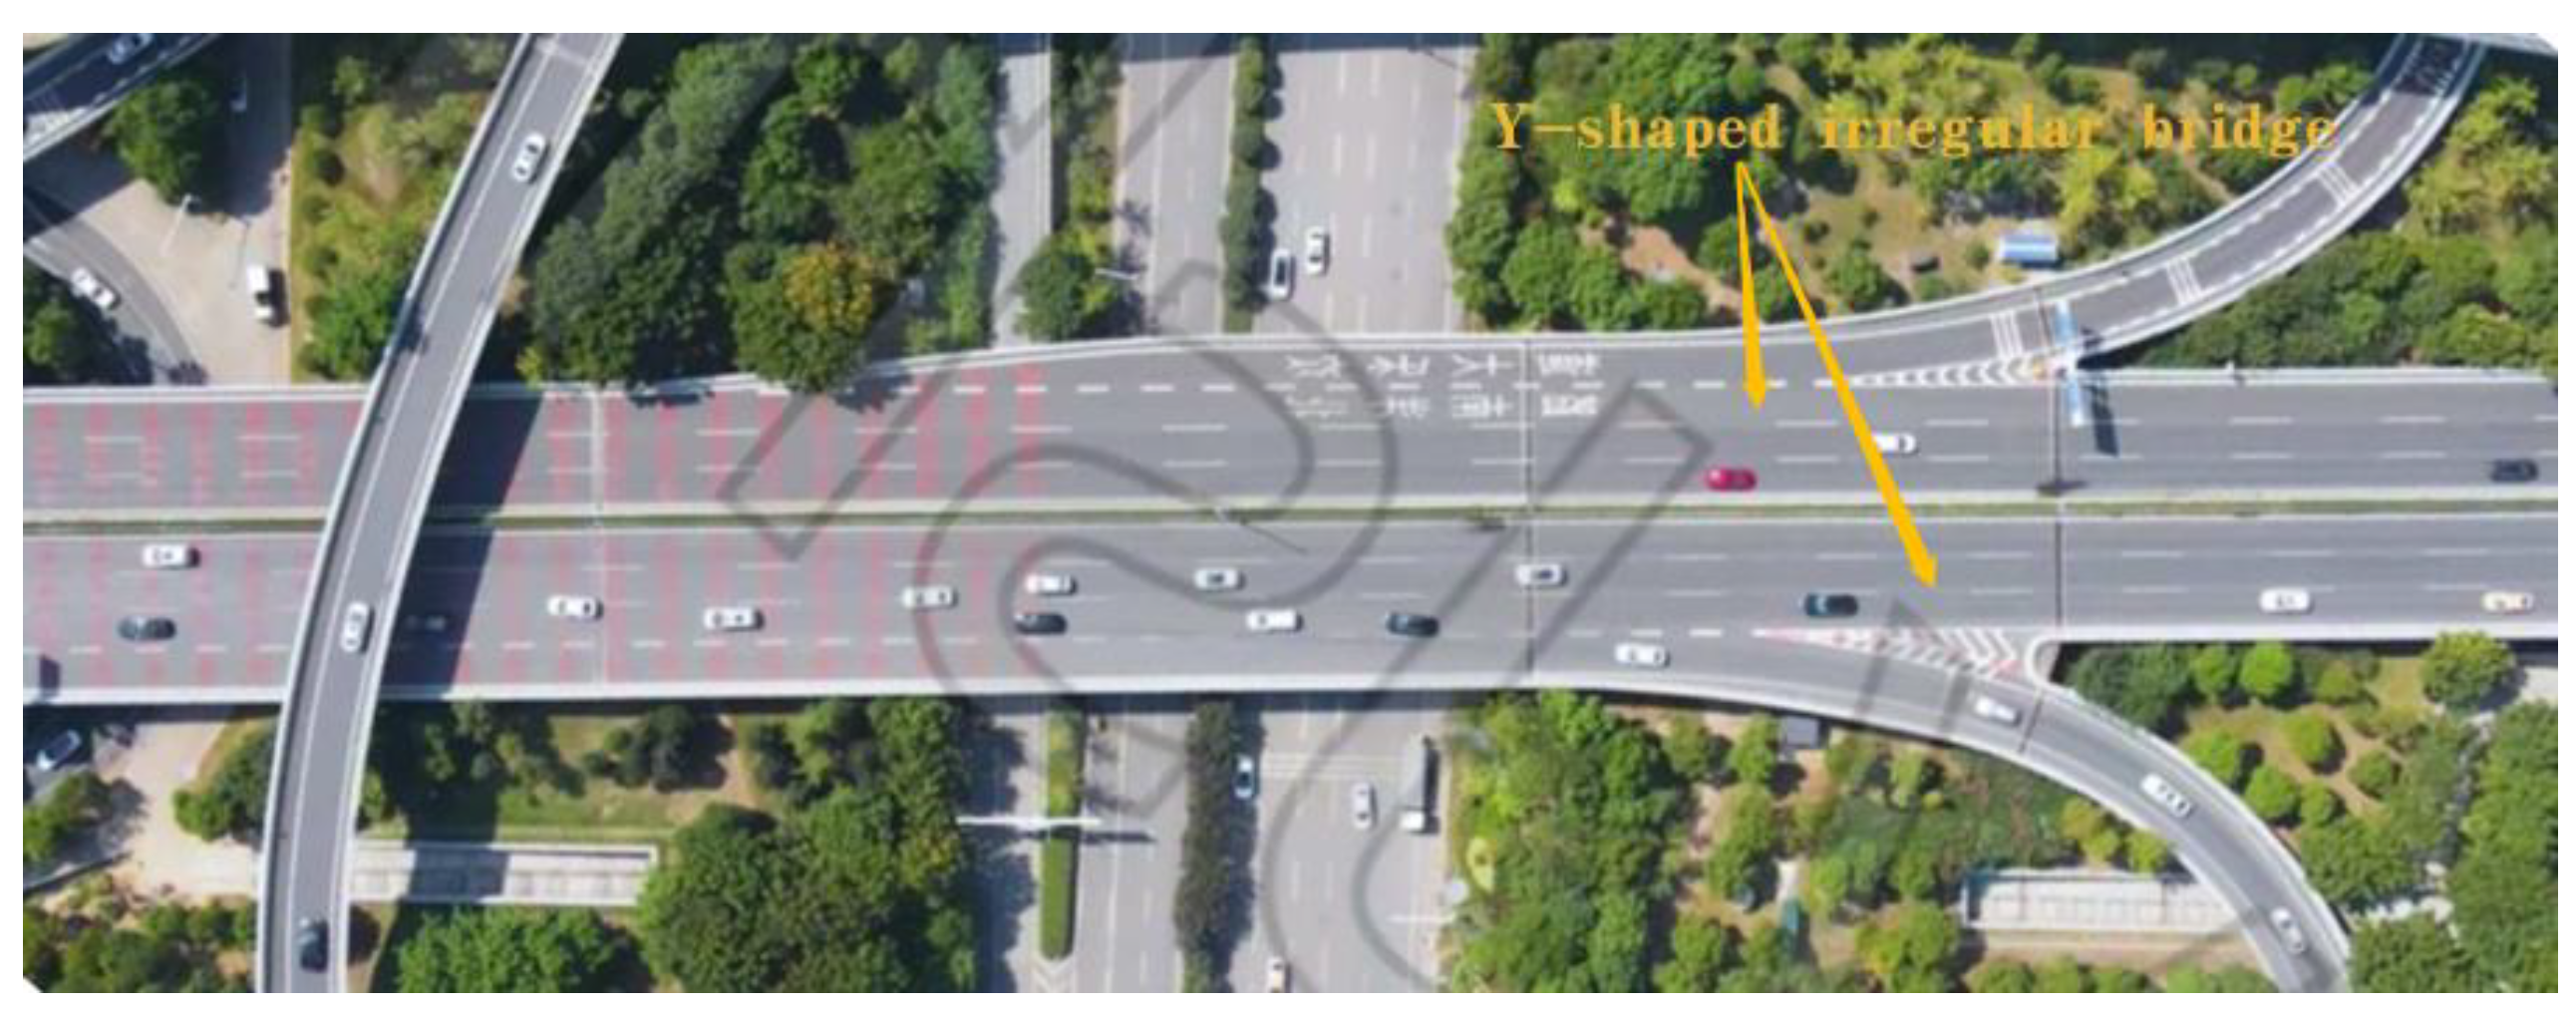
Y-shaped irregular bridges are widely used in three-dimensional traffic hubs, separated ramps, and upper and lower approaches to divert traffic and adapt to the terrain and road alignment. As shown in Figure 1, Y-shaped bridges have prominent curves, and they are generally located along major road traffic sections. Their importance is self-evident, but events in the past 50 years have shown that irregular and curved bridges are especially vulnerable to earthquakes [1,2,3,4,5,6]. The most destructive case was the San Fernando earthquake in 1971, which caused severe damage to a multi-span beam bridge between two large interchange projects. In response, researchers have focused on evaluating the seismic performance of bridges through various methods. In 1979, Williams and Godden [7] published their experimental results for a shaking-table model of a curved bridge that collapsed during the San Fernando earthquake and the corresponding theoretical results from finite element analysis. Wilson and Button [8] proposed that the stress direction of the structural response is excited by multidirectional seismic inputs, but later studies have proven that this is only applicable to unidirectional input for single-degree-of-freedom structures.

Figure 1.
Example of the Y-shaped irregular bridge.
Experimental research is needed to test and verify numerical results derived from theoretical analysis. Shaking-table tests are a common approach to studying bridge structures. Zhong et al. [9] performed shaking-table tests on a 1/20 scale model of a three-span continuous girder bridge with longitudinal viscous dampers to investigate the seismic response and damping effect at different seismic intensities. Zhan et al. [10] carried out a shaking-table test to study the nonlinear seismic response characteristics of a continuous-beam bridge with laminated rubber bearing (LRB) isolators. Jiang et al. [11] conducted shaking-table tests on a 1/12 scale continuous girder bridge for a high-speed railway. Feng et al. [12] designed a 1/62.5 scale model of a three-span curved bridge and performed a multi-angle shaking-table test to analyze the linear response history. Han et al. [13] used a structural model of a continuous girder bridge with LRB isolators to perform shaking-table tests with multidirectional seismic waves as the input. Li et al., studied the responses of scaled models of a three-segment bridge [14] and a single segment with abutments [15]. Both of their studies showed that spatial variation in the ground motion significantly increased the relative displacement between adjacent bridge structures. Ni et al. [16] concluded that the maximum seismic response of a curved bridge is closely related to the input angle. They developed a series of finite element models to determine the most unfavorable angles for the seismic input. Li et al. [17] studied the effects of spatial variations in ground motions on curved bridges by carrying out shaking-table tests on a 1/10 scale curved bridge. Jung et al. [18] carried out a bidirectional shaking-table test of reinforced concrete (RC) columns retrofitted and repaired with shape memory alloy spirals.
The above studies mostly focused on straight bridges, and only a few considered irregular bridges, especially Y-shaped bridges. In addition, shaking-table tests generally simulate the unidirectional seismic excitation of a regular bridge, which normally comes under less stress than an irregular bridge. The direction of seismic excitation also has a significant effect on the seismic response of a structure [19], but has rarely been considered. In this study, a 1/20 scale model of a Y-shaped irregular bridge, with a prototype designed by an engineer, was constructed, and shaking-table tests were carried out to evaluate the dynamic response of the structure when excited by strong and multidirectional seismic waves. The results of this study are expected to provide an experimental basis for the seismic design and research of Y-shaped irregular bridges.
2. Bridge Model Design
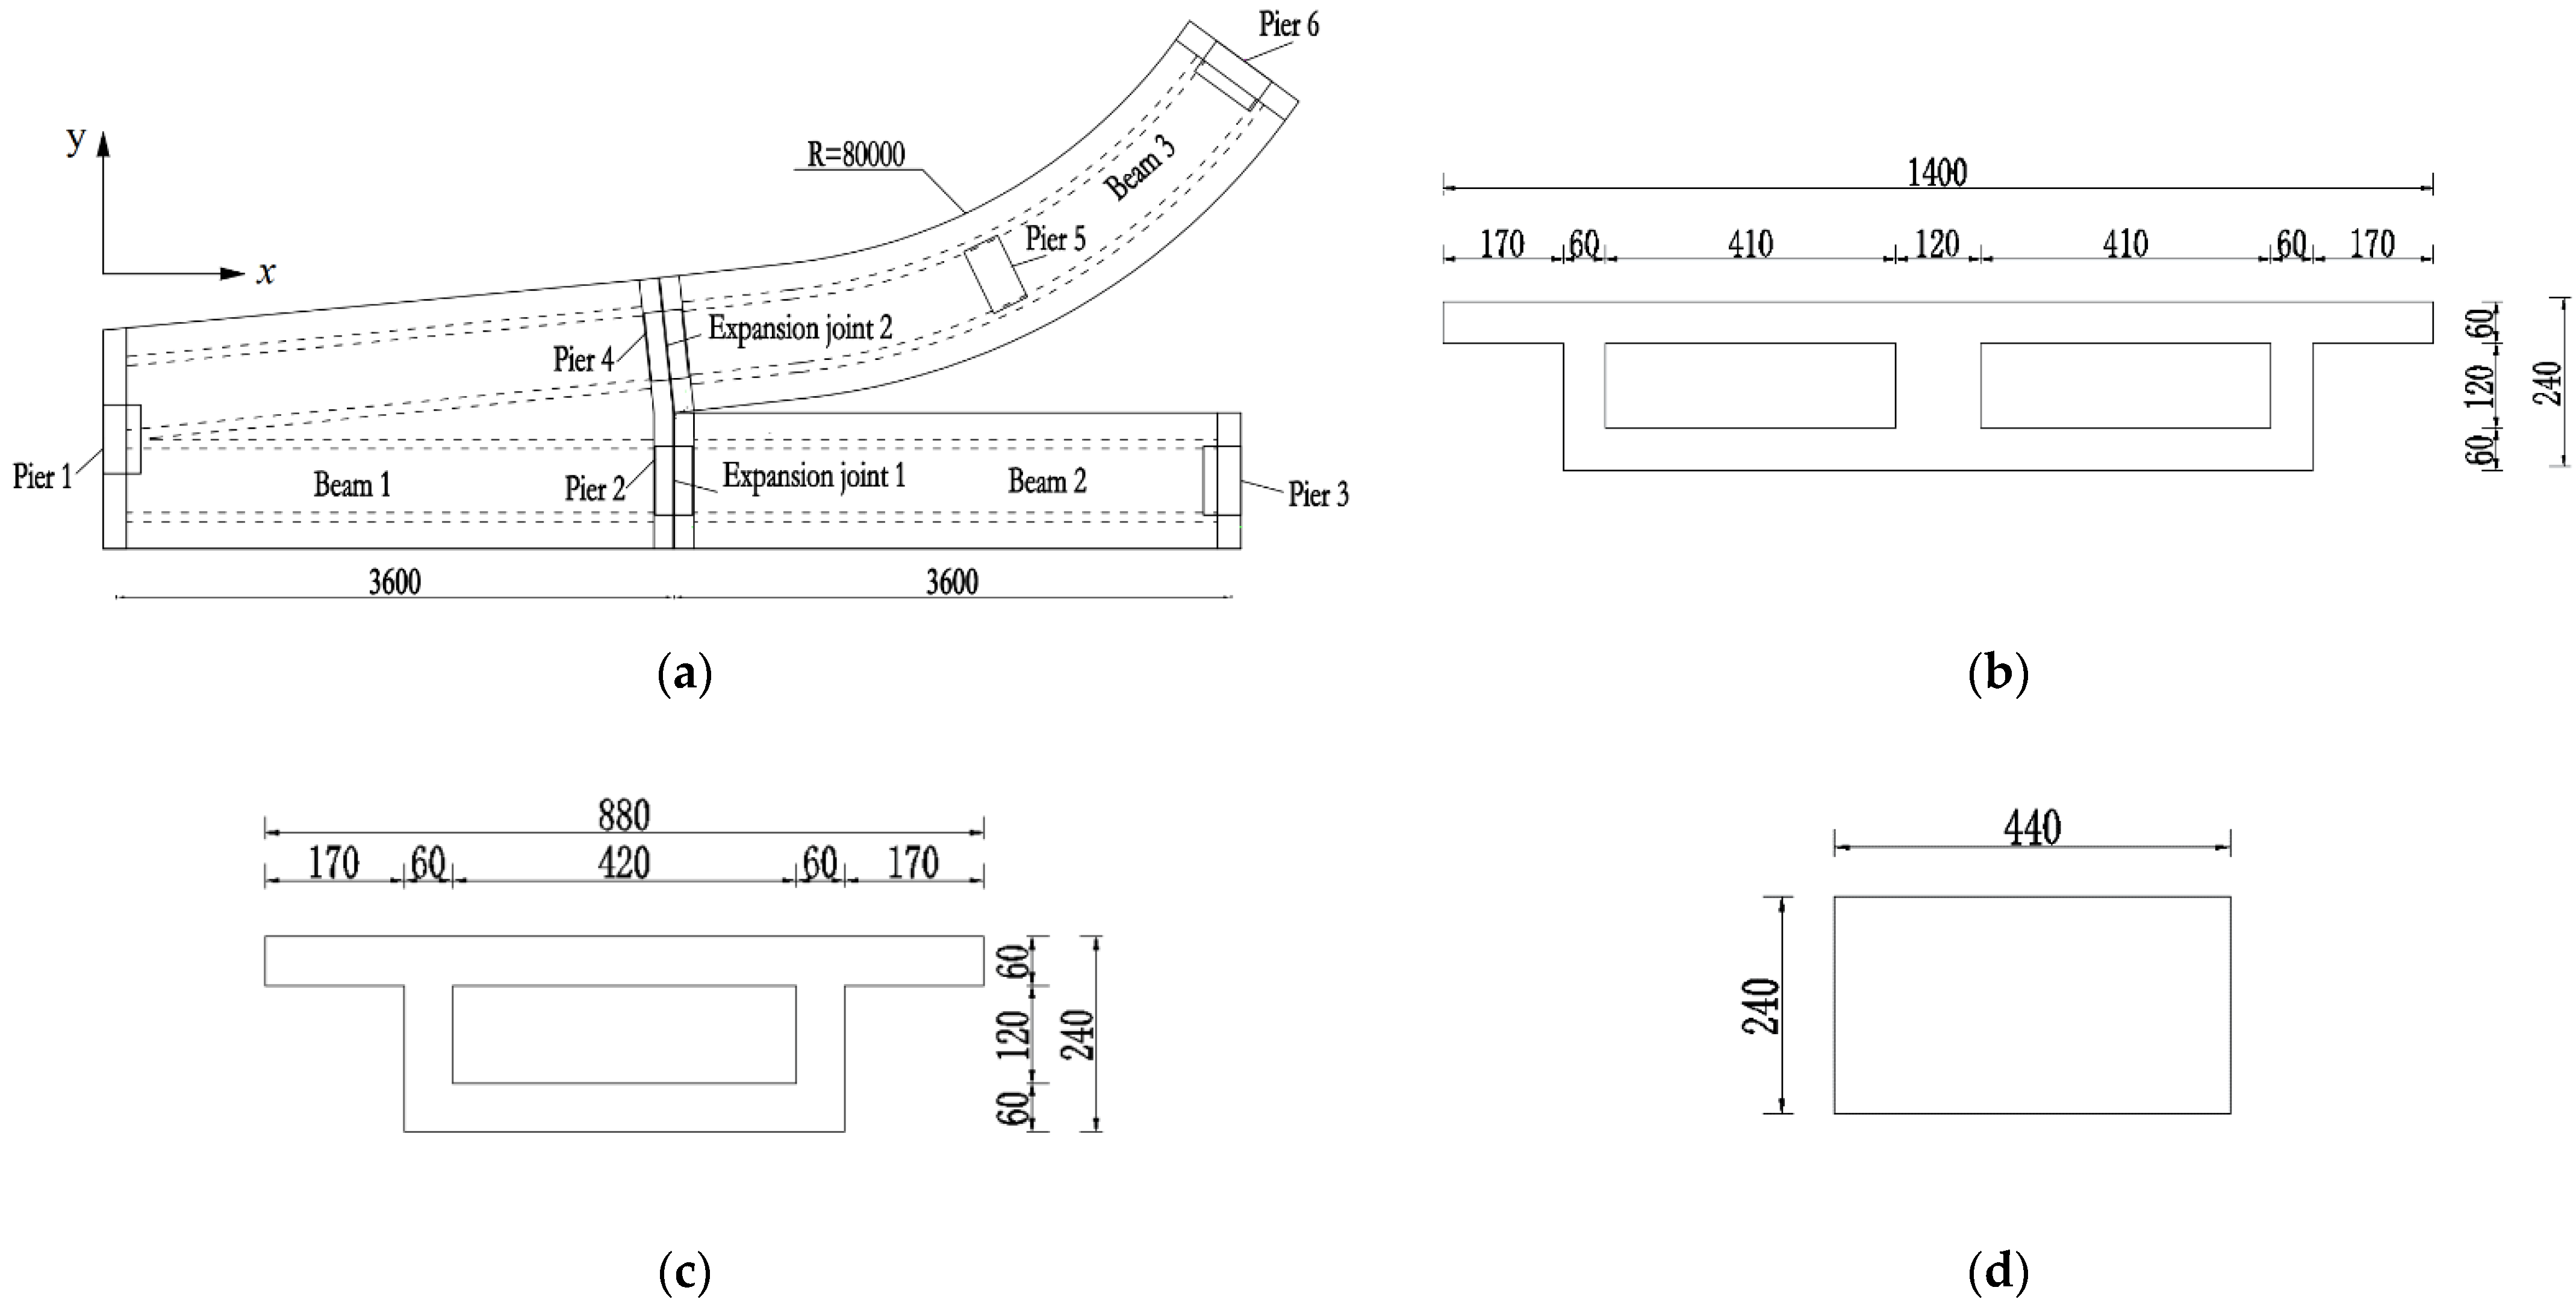
A typical Y-shaped bridge was selected with a horizontal curve and continuous girders for the model. Figure 2a shows the span arrangement of the bridge, which was 36 m + 36 m (+36 m). Two spans were linear, and one span was curved with a radius of 800 m. There were two expansion joints between spans. The bridge comprised a variable cross-section box girder (beam 1), straight branched girder (beam 2), and curved ramp girder (beam 3), as shown in Figure 2b,c. The piers comprised solid rectangular RC sections with a height of 30 m. LRBs, typically characterized by nonlinear hysteretic behavior [20,21], were set on each cap beam to connect the superstructure with the substructure. The deck, cap beams, and piers were constructed from Chinese Grade C50 concrete.
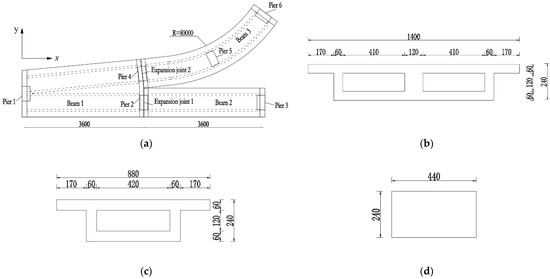
Figure 2.
Bridge and sections (cm). (a) Span arrangement of the bridge; (b) Section of beam 1; (c) Section of beam 2 and beam 3; (d) Section of piers.
2.1. Similitude Requirements
The scaling factor is key to the design of an experimental model. The modulus of elasticity (E), acceleration (a), and length (l) are commonly chosen as the three fundamental physical quantities considering the simplicity and convenience of their control. Based on dimensional analysis, combined with the equation of motion, the similarity requirement for the kinetic model can be written as [22,23]:
An absolute similitude ratio for the dimensions is generally very difficult to achieve for a dynamic model based on the similarity law. Therefore, most scaled models for shaking-table tests add artificial mass and amplify the peak ground acceleration to achieve the required response acceleration (Sa) while neglecting the gravity Sg. Table 1 presents the derived coefficients.

Table 1.
Similarity coefficients.
2.2. Design of the Scaled Model
The model was constructed from MC25, which is a particulate concrete developed by the research group [24]. This particulate concrete has a small modulus of elasticity with an appropriate concrete strength, which makes it suitable for shaking-table tests of small-scale structures [17,18]. MC25 has a modulus of elasticity of 2.2 × 10⁴ N/mm2, which is suitable for simulating C50, which is the normal concrete used to represent actual bridge structures. A light and soft foam were used as the inner mold inside the box girder, and a hollow section for the box girder was achieved after the concrete was poured. In addition, 2480 kg of artificial masses were uniformly distributed along the deck of the scaled model to meet the similitude requirements for the dynamic characteristics. As shown in Figure 3, the piers of the Y-shaped irregular bridge model were fixed to the shaking table, and the artificial mass had not yet been placed on the bridge model.
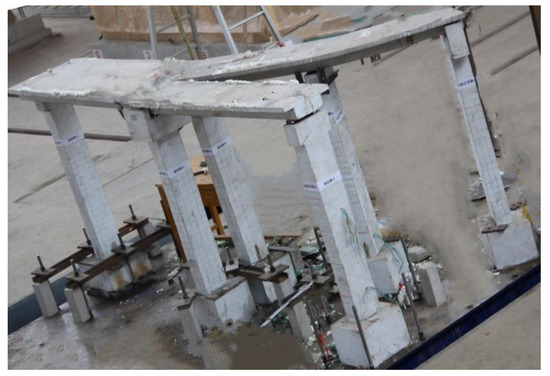
Figure 3.
Bridge model on the shaking table.
2.3. Experimental Program
The shaking table had dimensions of 4.1 m × 4.1 m and could support a mass of 20 t. The maximum acceleration in the X-direction was ±1.5 g, and the maximum acceleration in the Y- and Z-directions was ±1.0 g. The loading frequency range was 0.1–50 Hz. The model bridge was positioned on the shaking table so that the longitudinal direction of the straight beams was the X-direction, the direction perpendicular to the X-direction was the Y-direction, and the direction perpendicular to the XY plane was the Z-direction. The acceleration, strain, and displacement responses were measured at key sections of the bridge model: the mid-span, two quarter-spans (L/4 and 3L/4), top and middle of the piers, etc. Accelerometers and displacement transducers were set up at these key locations, and strain gauges were set at the bottom of the piers. These sensors were supplied by China Donghua Testing Company. Table 2 presents the details of accelerometers and displacement transducers used.
Table 2.
Sensor specifications.
2.4. Test Cases
Since Chinese specifications require two natural seismic waves and one artificial seismic wave to be used for testing, the El Centro and Imperial Valley waves are natural, while the Lanzhou wave is artificial. The Imperial Valley is a seismic wave of site I, while the El Centro and Lanzhou are seismic waves of site II. However, it should be understood that the dynamic responses of structures and/or geotechnical systems are closely related to time–frequency characteristics of the input ground motions, which should be considered in the analysis [25]. In addition, the structure of the scaled bridge, the adequacy and the uniformity of the additional mass, and the cumulative damage of the structure after multiple seismic inputs should be considered, which affect the frequency of the test model.
The possible frequencies of the test model and the prototype are not equal, and there is a certain proportional relationship between them. Therefore, the response of the structure is also a coupling of several factors. Currently, this test considers some reasons for the research under current conditions. It is believed that this test will provide experimental support for further exploration and study on selecting the records of ground motions.
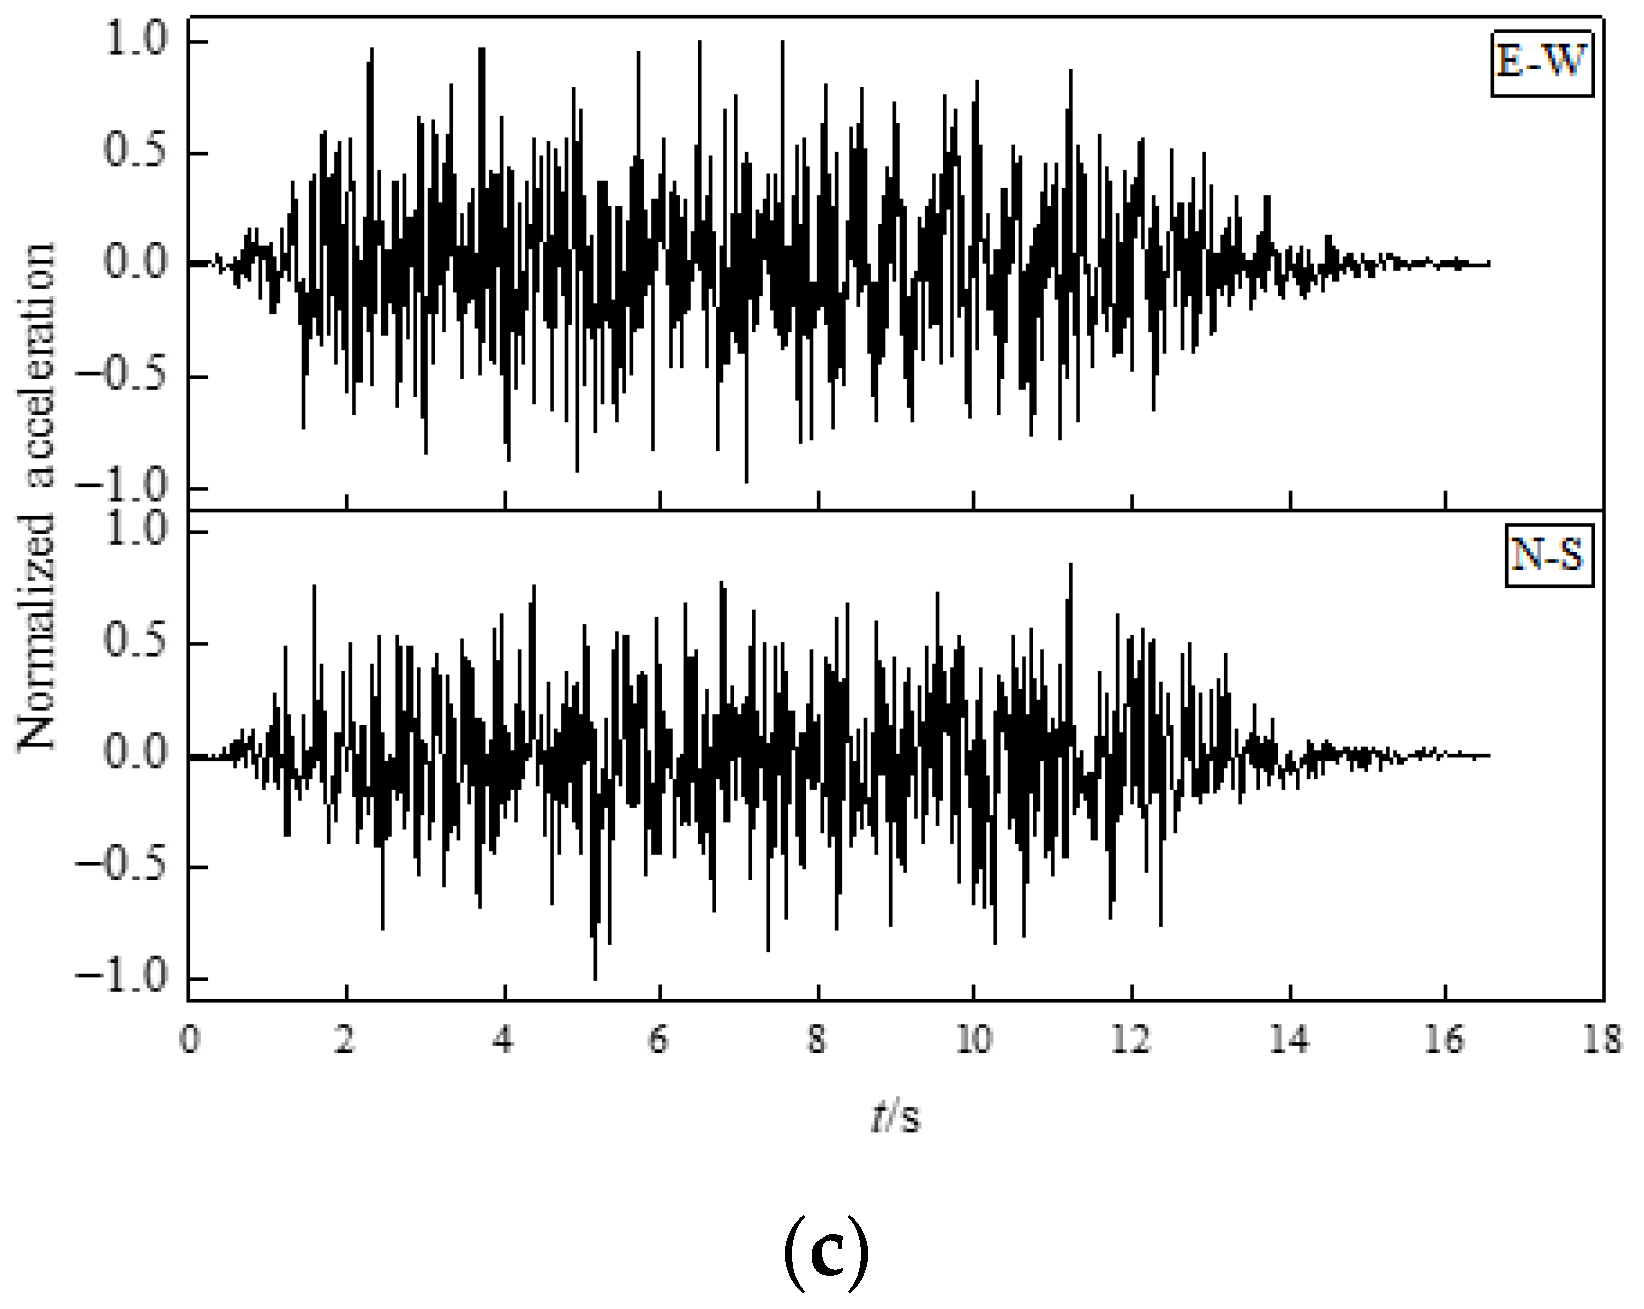
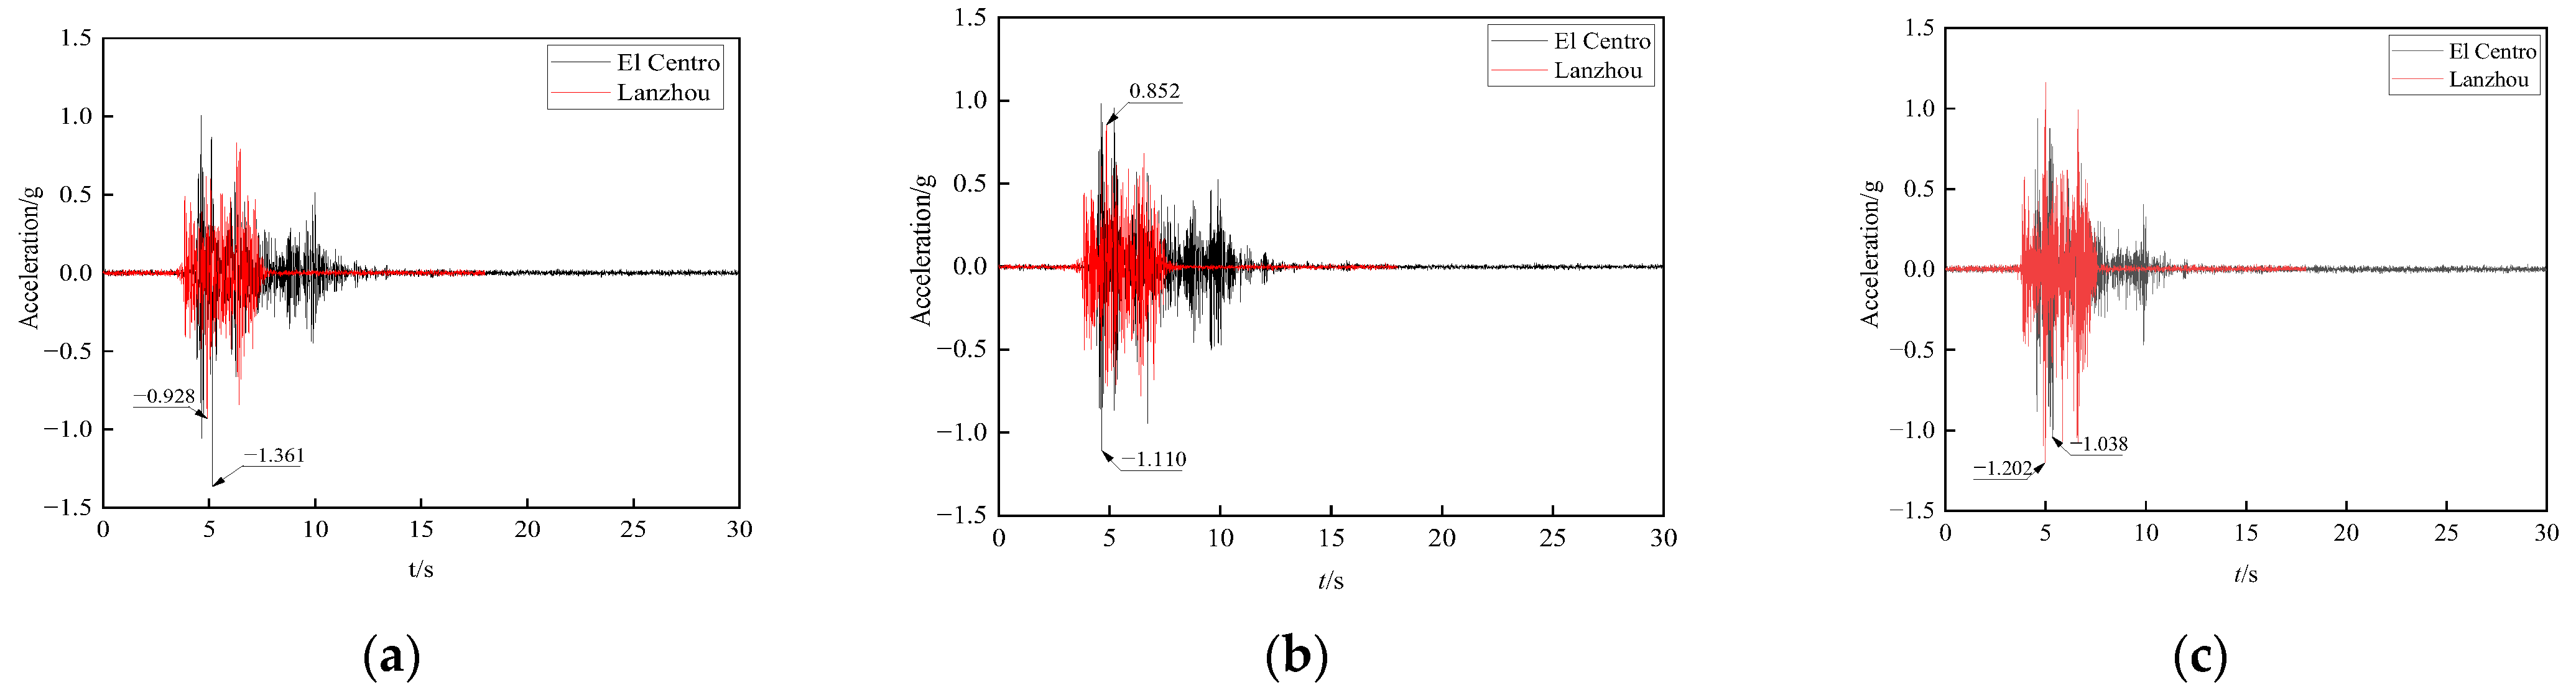
El Centro, Imperial Valley, and Lanzhou earthquakes were used as ground motion inputs [1,22]. The records of earthquakes were normalized so that the maximum acceleration peak value of the original seismic wave was uniformly treated as 1, and the other values were simultaneously changed. Subsequently, when different acceleration inputs were required, the input acceleration of waves required for the experiment could be obtained by multiplying a coefficient, which was convenient. The seismic waves used for the shaking-table tests are shown in Figure 4. Three types of input were adopted: unidirectional (Z), bidirectional (X + Y), and tridirectional (X + Y + Z). Seismic waves in the north and south directions were used to excite the structure in the X– and Z-directions, and waves in the east and west directions were used to excite the structure in the Y-direction. The ratio of the peak X-, Y-, and Z-directional seismic waves was set to 1:0.85:0.65 for the multidirectional input [1,22,23]. The seismic response of the structure was studied for a magnitude 9 earthquake (0.4 g), according to JTG/T B02-01 [26].
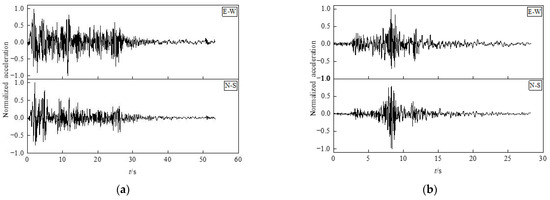
Figure 4.
Seismic waves used for the shaking-table tests. (a) El Centro; (b) Imperial Valley; (c) Lanzhou.
Based on the calculated similarity ratio, the input for the shaking table should be 2.5 times the original value. Thus, the peak value for the seismic input was set to 1.00 g. Table 3 lists the input excitations.
Table 3.
Test cases.
3. Analysis of Acceleration Response Results
3.1. Acceleration Response at the Top of the Piers
Table 4 presents the acceleration response of each pier top to Z-direction excitation from the El Centro and Lanzhou seismic waves. The Z-direction excitation generated accelerations in both the X- and Y-directions. The peak values were different with the El Centro and Lanzhou waves. The weak values for the X-direction and Y-direction acceleration responses were because the center of gravity of the bridge structure was not consistent with the center of gravity of the stiffness. Piers 3 and 6 had somewhat stronger responses than the other piers; the most significant acceleration response belonged to pier 6, which had a Y-direction response that reached 0.532 g. This could be attributed to the arrangement and support of pier 6, which was a side pier of the curved beam 3, so the excitation direction formed an angle with it. The final response was equivalent to the coupling of multidirectional excitation. A moveable support was set at the top of pier 6, which increased the transfer of seismic action while restraining the Y-direction displacement of beam 3 during vibration. The same held true for pier 3, but this was a side pier of the straight beam 2, so it had a more regular arrangement and, thus, a smaller response than pier 6.
Table 4.
Peak acceleration at the top of the piers (g).
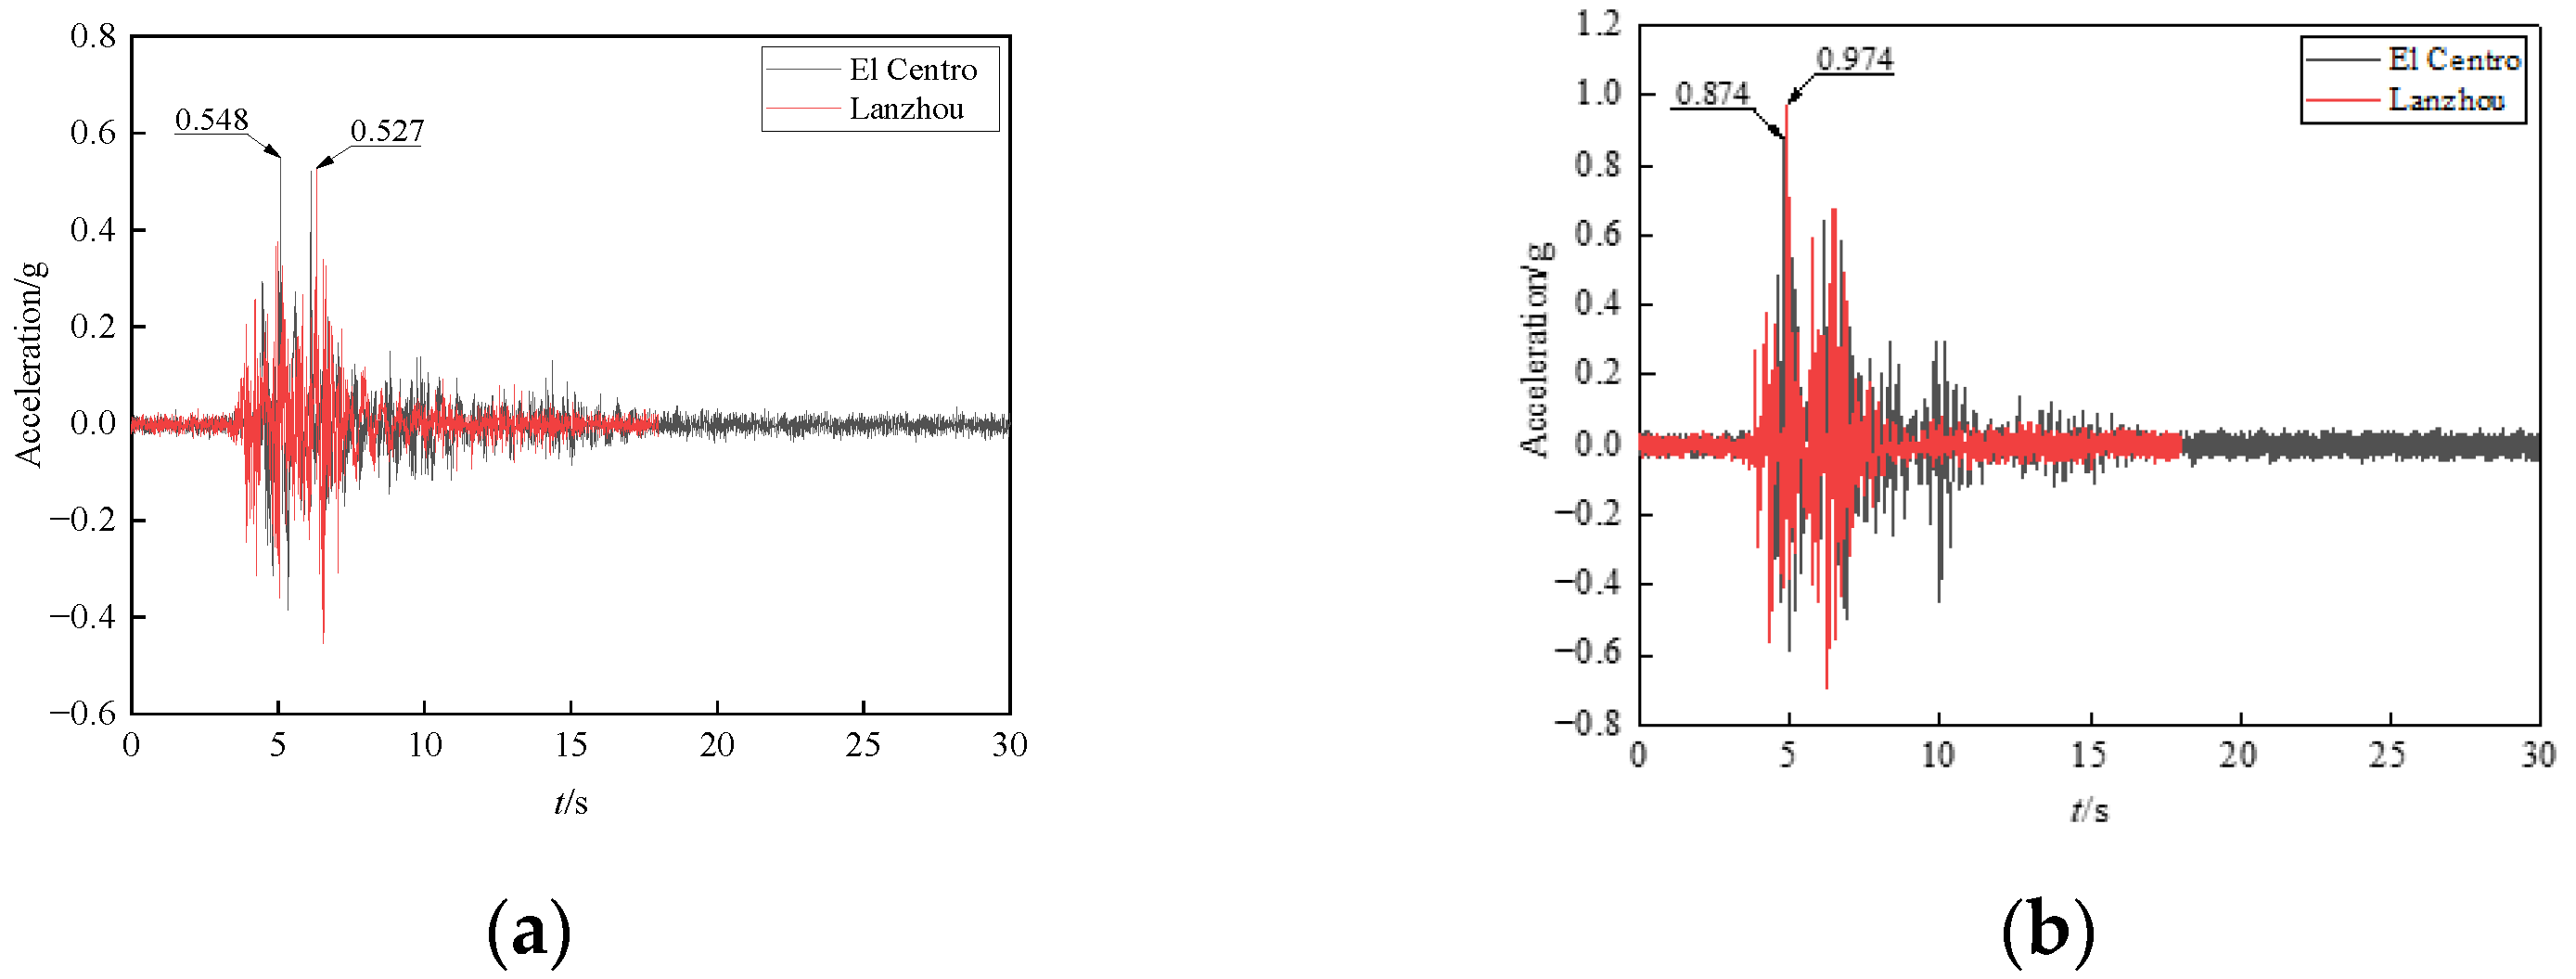
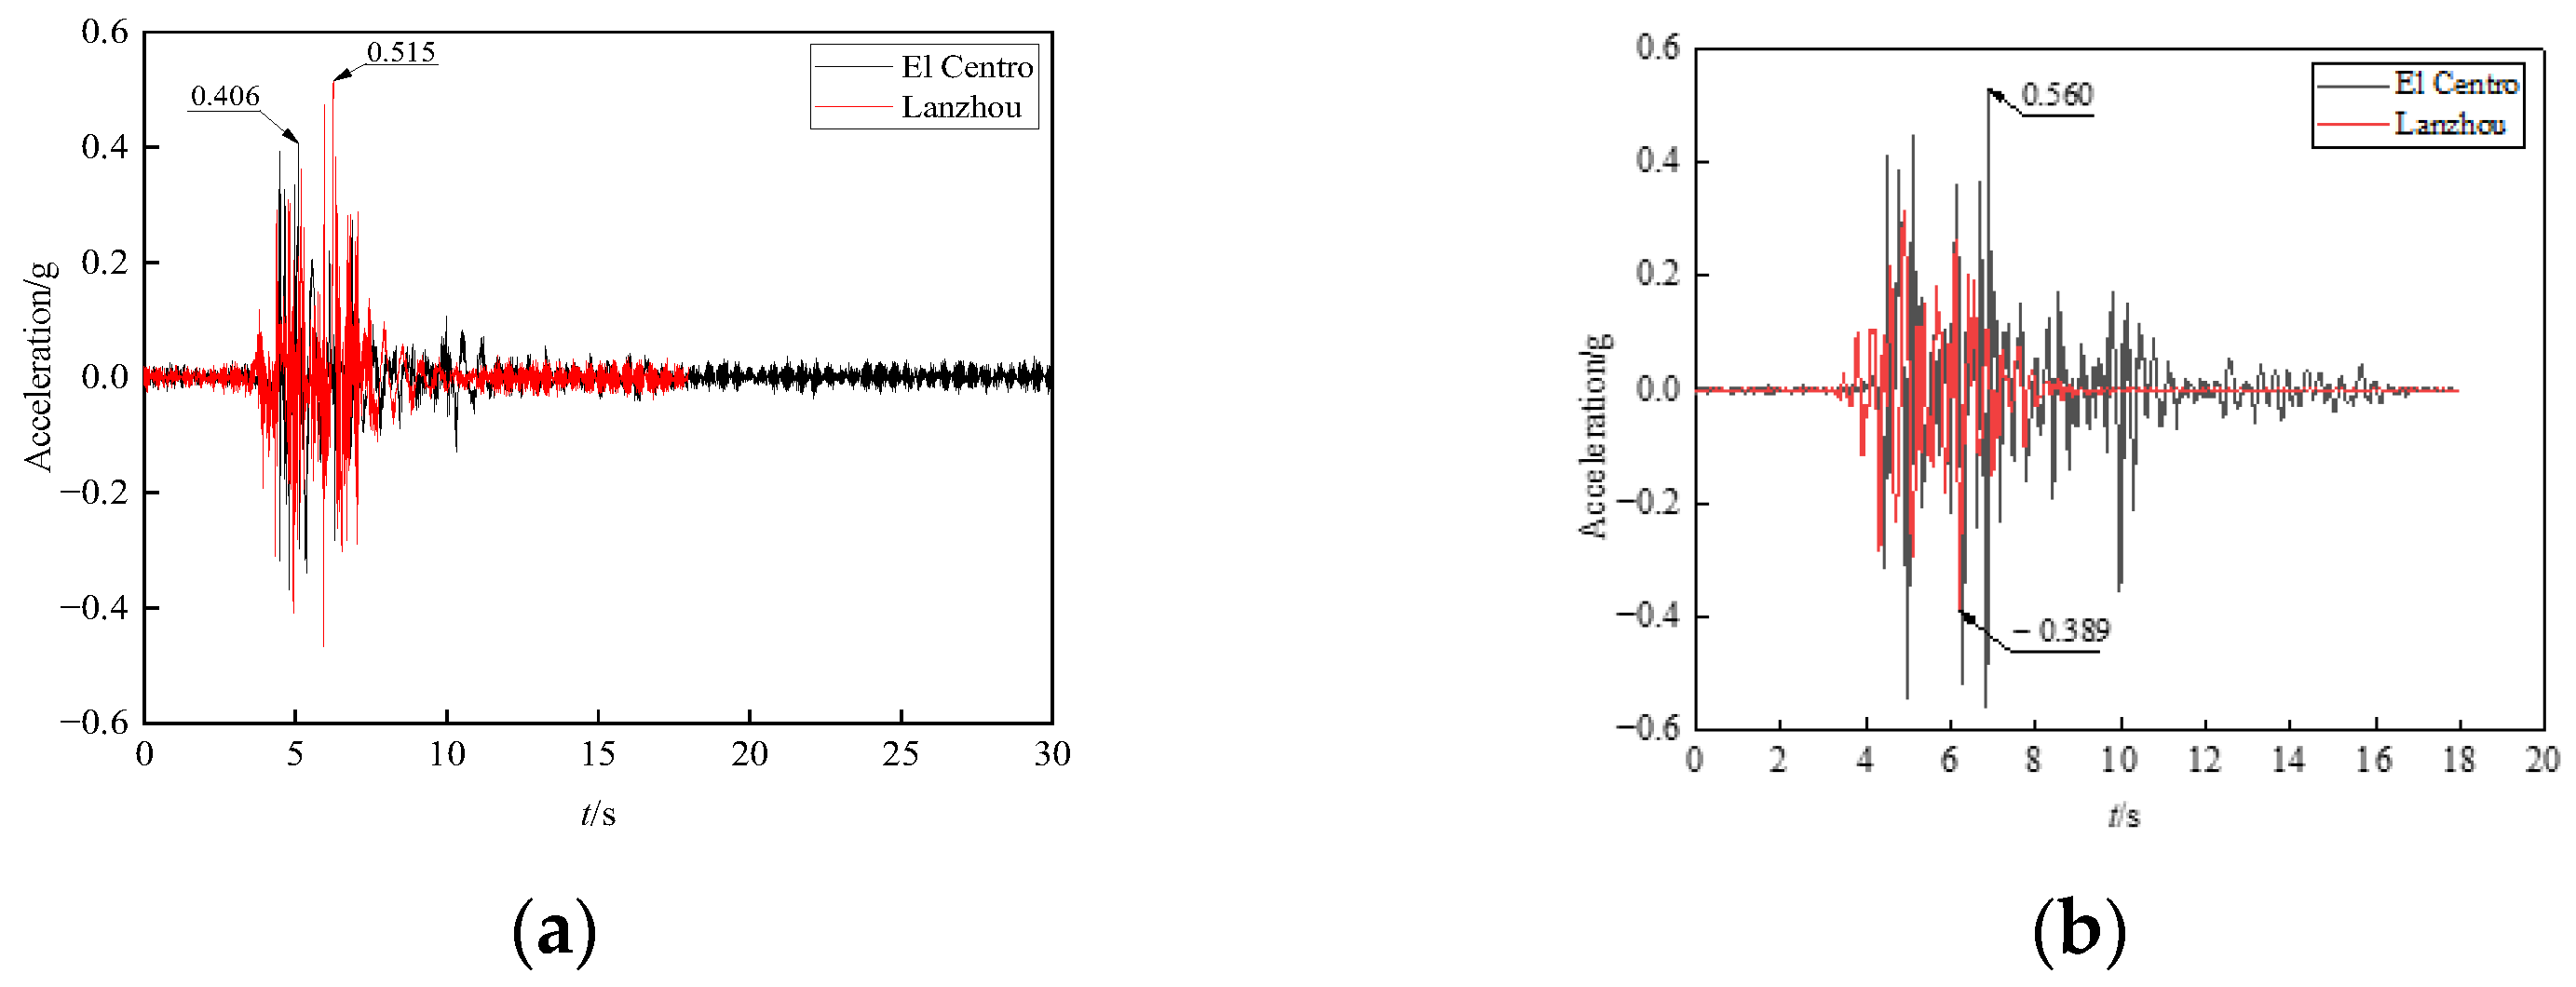
Figure 5 shows the acceleration response at the top of pier 1 subjected to tridirectional (X + Y + Z) El Centro and Lanzhou waves. Figure 6 shows the acceleration response at the top of pier 2. The El Centro and Lanzhou waves caused different structural responses. One reason may be the difference in the spectral distributions of the excitation waves. The peak accelerations of the excitation waves were the same, but the responses at the tops of the piers were obviously different. If the influence of the shaking-table equipment on the variability of the acceleration input was assumed negligible, then the multidirectional excitation resulted in a coupled structural response. Although the peak acceleration of the excitation waves was greater in the X-direction than in the Y-direction, the response at the top of the pier was greater in the Y-direction than in the X-direction. Particularly for pier 2, the peak responses to the El Centro and Lanzhou waves were 15 times and 8 times higher, respectively, in the Y-direction than in the X-direction. The difference between the Y- and X-direction responses at the top of pier 2 was particularly significant compared to that of pier 1. Pier 1 was to the left of the straight main beam 1 with a variable section, while pier 2 was between the main beam 1 and branching beam 2, so it was shared by the two straight beams. The complexity of the overall structure made the response of pier 2 worthy of attention, and the degree of influence of the multidirectional excitation on the Y-direction response could not be ignored.

Figure 5.
Acceleration response at the top of Pier 1. (a) X-direction; (b) Y-direction.

Figure 6.
Acceleration response at the top of Pier 2. (a) X-direction; (b) Y-direction.
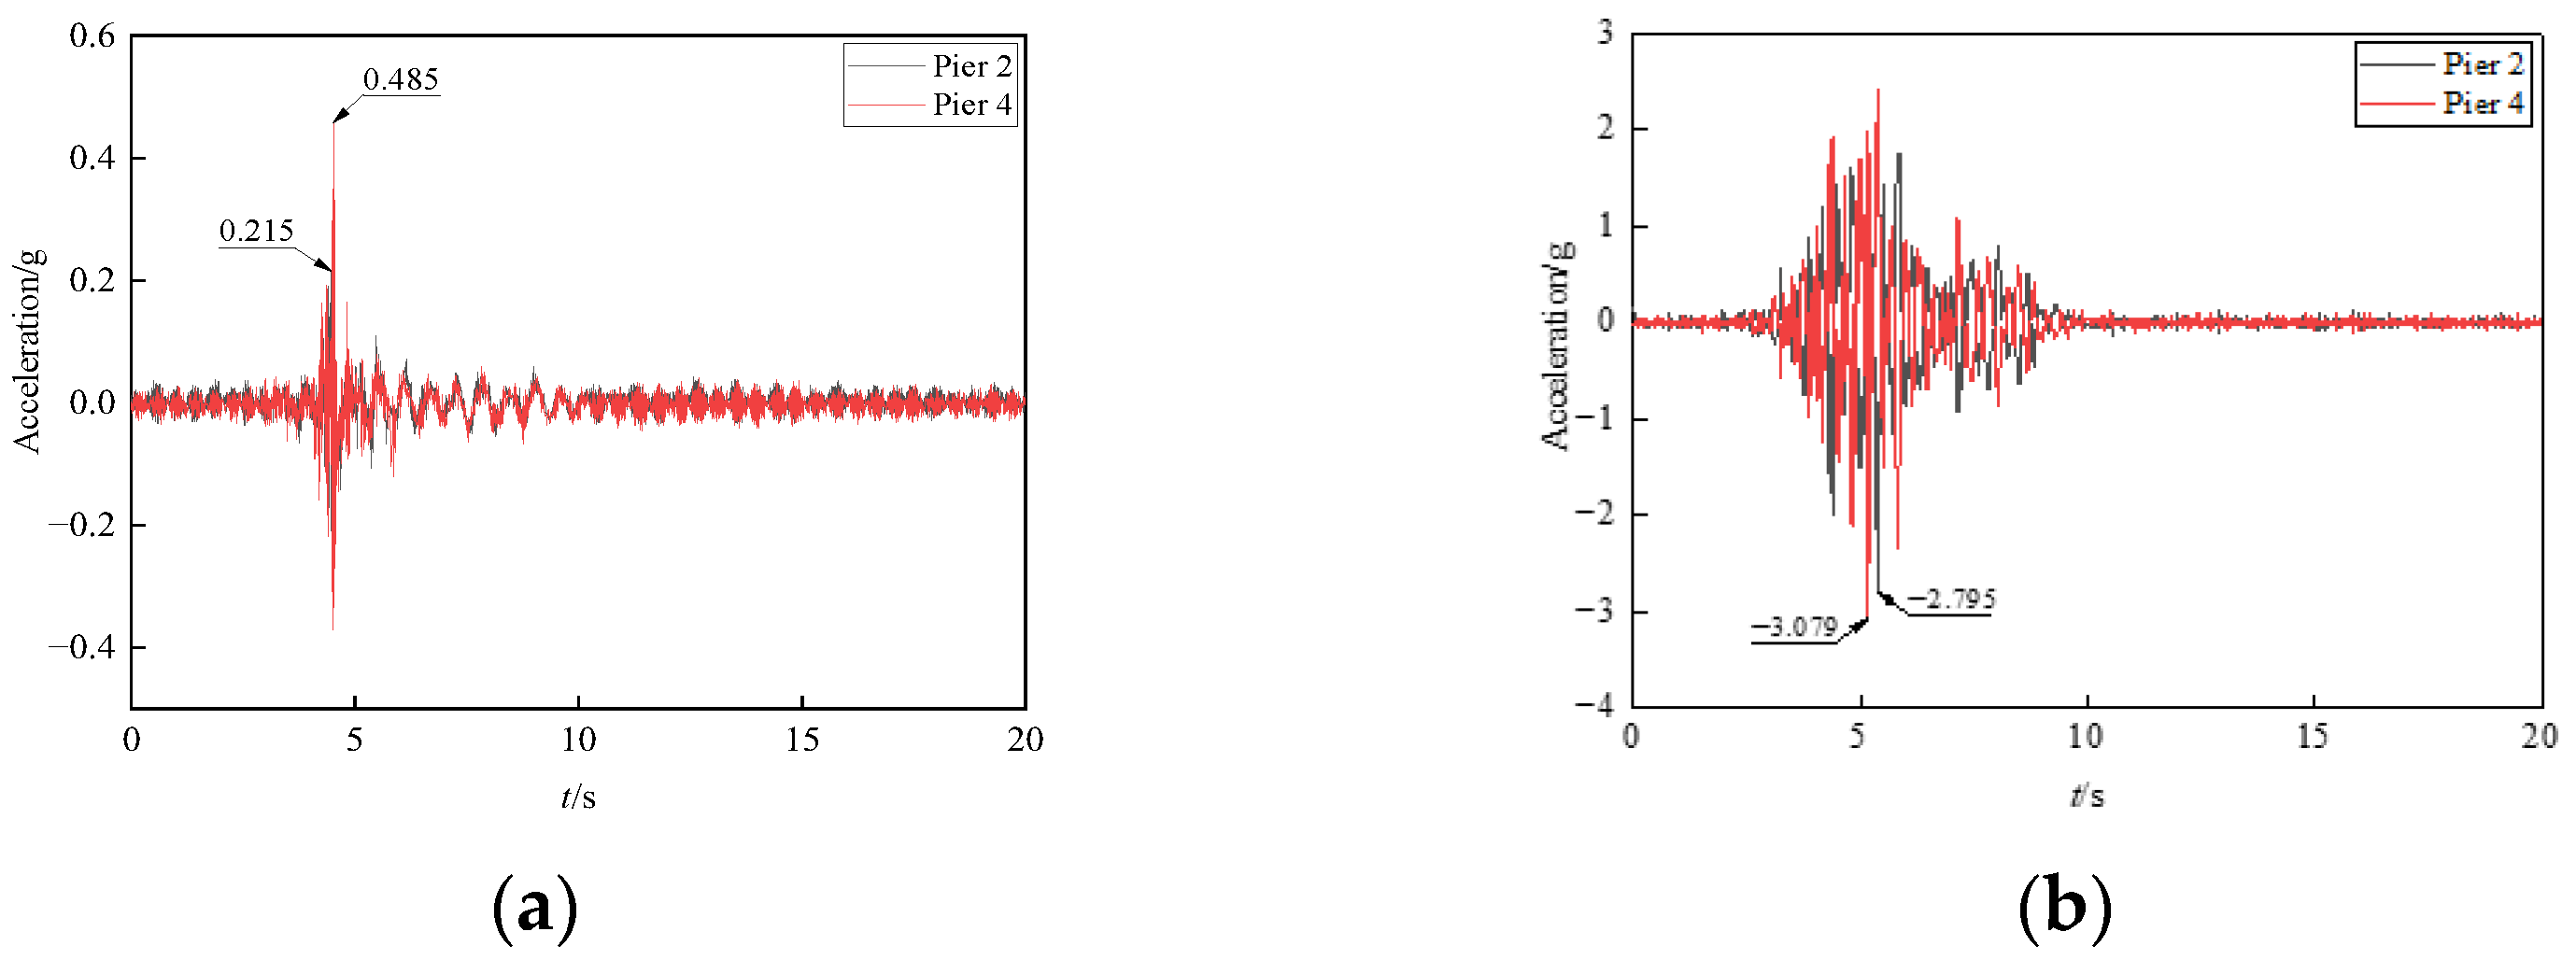
Figure 7 shows the X- and Y-direction acceleration responses at the tops of piers 2 and 4 to the bidirectional (X + Y) Imperial Valley seismic waves. Although the X- and Y-direction input waves were the same, the X- and Y-direction acceleration responses at the tops of piers 2 and 4 clearly had very different waveforms. Overall, the peak acceleration of the input wave was greater in the X-direction than in the Y-direction, but the response was much greater in the Y-direction than in the X-direction. The peak Y-direction acceleration was 13 times greater than the peak X-direction acceleration at the top of pier 2, and 7 times greater at the top of pier 4. The peak acceleration response was greater at the top of pier 4 than at the top of pier 2 because pier 4 supported the straight beam 2 and irregular beam 3. Thus, it was subjected to greater forces than pier 2, which only supported straight beams.

Figure 7.
Acceleration response at the top of the piers. (a) X-direction (b) Y-direction.
Table 5 presents the X- and Y-direction acceleration responses at the tops of the piers subjected to bidirectional (X + Y) and tridirectional (X + Y + Z) El Centro and Imperial Valley waves. The responses, at the tops of piers 1-3, were greater with the multidirectional El Centro wave than with the bidirectional wave. In contrast, the responses of the pier tops were less with the multidirectional Imperial Valley wave than with the bidirectional wave. This indicated that the multidirectional excitation did not necessarily increase the structural response of the structure. Under multidirectional excitation, the responses at the tops of piers 4–6 exceeded those of the other three piers, which supported straight beams. The response was the greatest at the top of pier 6.
Table 5.
Peak acceleration response of the pier top under multidirectional excitation (g).
The above analysis showed that the response of the pier tops to multidirectional excitation was always greater in the Y-direction than in the X-direction. Thus, additional attention should be given to the structural performance of piers in the cross-bridge direction (i.e., tangential to the main beam) in designing irregular bridges.
3.2. Acceleration Response of Beams
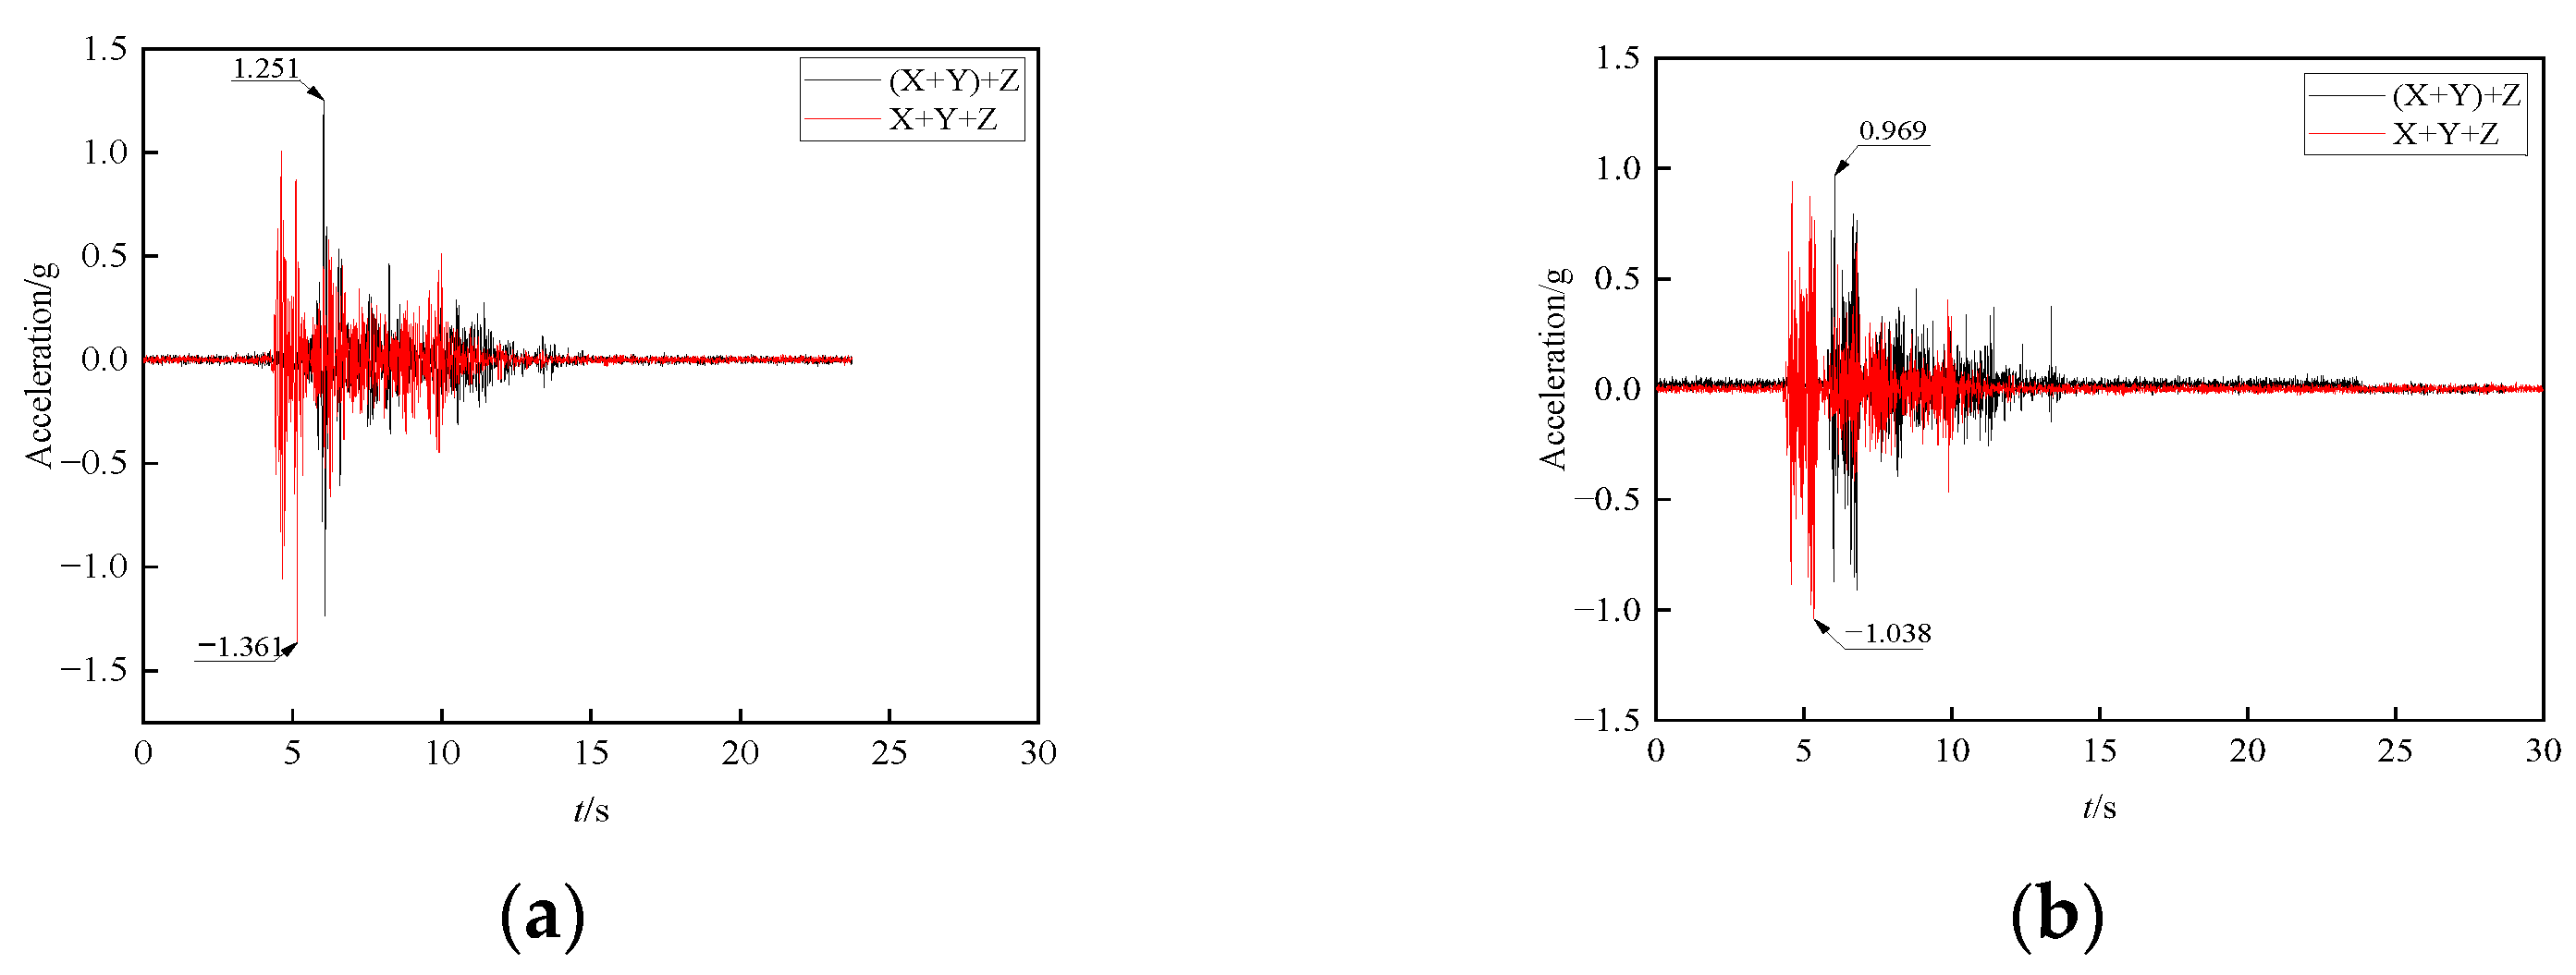
Figure 8 shows that the response waveforms for unidirectional and bidirectional excitations could be directly superimposed with the response waveform for multidirectional excitation. The waveforms were close at L/4 of the mid-span for beam 3 and slightly differed at the mid-span for beam 1, and the differences increased over time. However, the waveforms generally maintained their original shapes with a large acceleration value. The peak variations in the acceleration responses of beam 1 and beam 3 were 8.1% and 6.6%, respectively. For practical application, this error meant that only bidirectional excitation could be considered and vertical excitation could be ignored for the seismic design of the main beam of such Y-shaped bridges.
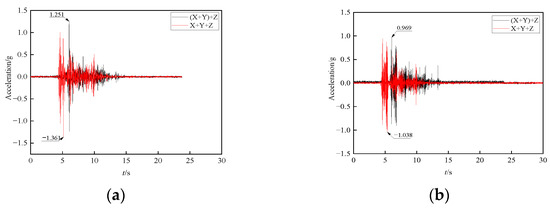
Figure 8.
Vertical acceleration response at the mid-span. (a) Beam 1; (b) Beam 3.
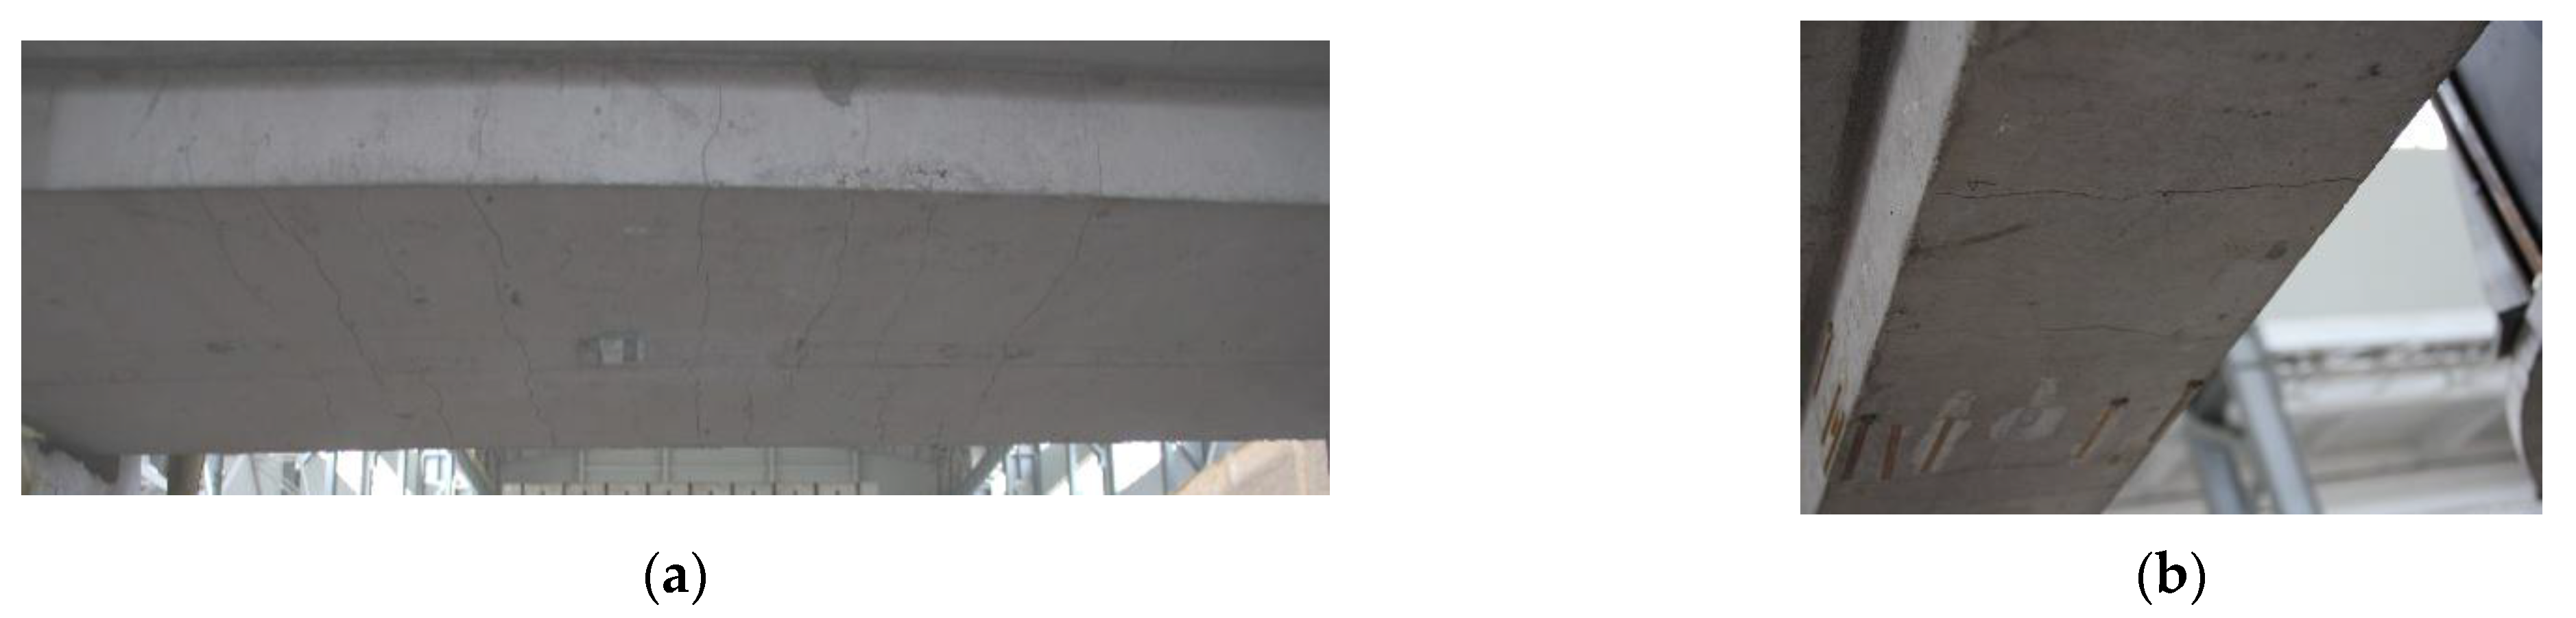
Figure 9 shows the vertical accelerations for the mid-spans of beam 1, beam 2, and L/4 of beam 3 subjected to tridirectional (X + Y + Z) El Centro and Lanzhou waves. The mid-span response was greater with the El Centro wave than with the Lanzhou wave, which was related to the frequency spectral characteristics of the excitation waves and structural properties of the bridge. Each excitation had its own frequency spectrum distribution characteristics. Meanwhile, it was verified that the dynamic responses of structures were closely related to the frequency characteristics of the input ground motions. Beam 1 had the largest mid-span acceleration response, and L/4 of beam 3 had the smallest. This was because beam 1 was straight and was simply supported without redundant constraints, so the span and weight were relatively large. Beam 2 was straight and was simply supported as well, but it was lighter than beam 1. Beam 3 was curved with redundant constraints and lightweight. Thus, beam 1 had a greater mid-span stress, and transverse cracks appeared earlier and in more abundance in the test process, than for the curved beam 3, as shown in Figure 10. This indicated that, for irregular bridges, simply supported straight beams did not provide better seismic performance than curved beams in some cases. In addition, redundant constraints could also reduce the mid-span acceleration response.

Figure 9.
Acceleration response at the mid-span with multidirectional excitation. (a) Beam 1; (b) Beam 2; (c) 1/4-span of Beam 3.

Figure 10.
Cracks in the mid-span. (a) Beam 1; (b) 1/4-span of Beam 3.
4. Analysis of Displacement Response Results
4.1. Relative Displacement at Expansion Joints
Table 6 presents the relative displacements of expansion joints 1 and 2. The variation in relative displacements under bidirectional and multidirectional excitation by the El Centro wave was inconsistent. The maximum relative displacement between beams 1 and 2 decreased from 39.714 mm, with bidirectional excitation, to 32.155 mm, with multidirectional excitation, while the maximum relative displacement between beams 1 and 3 increased from 5.282 mm to 10.453 mm. With the multidirectional excitation of the El Centro wave, the maximum relative displacement was smaller between beams 1 and 3 than between beams 1 and 2. With the multidirectional excitation of the Lanzhou wave, the maximum relative displacement was 25.131 mm between beams 1 and 2 and was 10.523 mm between beams 1 and 3. This indicated that, under the above conditions, beams 1 and 3 were more prone to collision. Thus, the junction between straight and curved beams should have a relatively large expansion joint, or improved energy dissipation facilities, to reduce the risk of collisions and any resulting structural damage.
Table 6.
Relative displacement (mm).
4.2. Relative Displacement of Piers in the Transverse Direction
To consider the possibility of collision between piers close to each other during an earthquake, Table 7 presents the relative displacements of piers 2 and 4 subjected to multidirectional excitation. Piers 2 and 4 were close to the junction between the main beam 1 and the branching beams 2 and 3. The relative displacements of the two piers were smaller under the multidirectional excitation of the Lanzhou wave than that of the El Centro wave, and they were prone to collision. The relative displacements were smaller with multidirectional excitation than with bidirectional excitation regardless of the wave, but the difference was very small.
Table 7.
Relative displacements of piers 2 and 4 in the transverse direction of the bridge (mm).
4.3. Relative Displacement of Pier and Beam
Table 8 presents the relative displacements between beam 1 and pier 2 and between beam 1 and pier 4 in the transverse direction under multidirectional excitation. The relative displacement was less with multidirectional excitation than with bidirectional excitation. Pier 2 supported the straight beams 1 and 2. The relative displacement with multidirectional excitation was smallest between beam 1 and pier 2, followed by that between beam 2 and pier 2. The relative displacements between beams 1 or 3 and pier 4 were very significant. Pier 4 supported straight and curved beams, which were extremely susceptible to falling when the lateral constraint was not strong. The test results showed that the strong excitation wave and weak transverse constraint caused shear failure of the bearings, which further weakened the transverse restraint.
Table 8.
Relative displacements of the piers and beams (mm).
The relative displacements between beams 1 or 3 and pier 4 seriously exceeded the design requirements, which indicated collision between beams 2 and 3, as shown in Figure 11. For practical applications, the transverse constraints need to be strengthened appropriately to handle these situations.
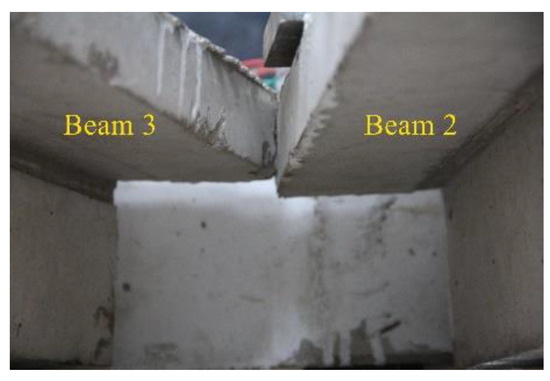
Figure 11.
Collision between beams 2 and 3.
5. Acceleration Amplification Coefficients
To investigate the amplification or attenuation of seismic waves propagating in a bridge structure, Table 9 gives the Z-direction acceleration amplification factors for piers 2 and 4. These values were the ratio of the acceleration response to the input acceleration. Only pier 2, subjected to the Lanzhou wave, showed attenuation of the peak acceleration. In contrast, the acceleration amplification factor reached 1.68 for pier 4, which would increase the axial force on this pier. With multidirectional excitation, only pier 2, subjected to the El Centro wave, showed attenuation of the seismic response. Meanwhile, the amplification factor reached 1.5 for pier 2, subjected to the Lanzhou wave.
Table 9.
Acceleration amplification factors of piers.
These results indicated that the amplification effect was most obvious for vertical acceleration with the Lanzhou wave. Therefore, a vibration isolation design needs to be carried out to improve the seismic performance and energy attenuation of this type of bridge.
The bridge prototype for this test was designed and completed by the engineer according to the specifications for the design. Although some research has been conducted herein, it is a preliminary study that can be further verified. A profound study will be made by performing nonlinear analyses using accurate models [27,28] and methods [29].
6. Conclusions
Shaking-table tests with multidirectional seismic excitation were carried out on a Y-shaped curved bridge to evaluate seismic performance. The following conclusions were obtained:
- The spectral characteristics of the excitation wave, natural vibration characteristics of the bridge, the form of the bridge structure, and constraints at the support directly and indirectly affected the seismic response of an irregular bridge structure, which led to an inconsistent response law. Due to the deviation between the stiffness and mass centers of the bridge, vertical excitation produced structural responses in the other two directions.
- With unidirectional and multidirectional excitations, the response at the top of the piers was significantly greater in the transverse direction than in the longitudinal direction. The response of piers supporting curved beams was also greater than that of side piers supporting straight girders. For irregular bridges, the seismic design needs to consider horizontally bidirectional seismic inputs.
- Cracks appeared earlier in the span of a beam with a variable cross-section, and the acceleration response was also the largest. Adding redundant constraints to the beam would reduce the mid-span acceleration response. In most cases, the response to bidirectional excitation was comparable to the response to multidirectional excitation, indicating that a feasible approach to seismic design would be to consider horizontal bidirectional excitation and neglect vertical excitation.
- Under multidirectional excitation, collisions between the main beam and curved beam were more likely to occur. This suggests that the junction between such beams should have a relatively large expansion joint or improved energy consumption facilities to minimize the risk of collision and any resulting structural damage. However, multidirectional excitation did not increase the collision risk more than bidirectional excitation.
- The relative displacements of two piers were the same with both bidirectional and multidirectional excitations. This implies that future research can only consider horizontal bidirectional excitation and ignore the influence of vertical excitation.
Bearing failure and beam falling easily occur around expansion joints, so sufficient lateral constraints should be set and further measures should be taken to prevent piers from colliding. Under multidirectional excitation, seismic wave amplification occurred along the bridge piers, which increased the axial load. Thus, vibration isolation design needs to be carried out to reduce the adverse effects of earthquakes.
Author Contributions
Conceptualization, J.Y. and Z.D.; methodology, J.Y.; software, Q.G.; validation, J.Y., Z.D. and L.T.; formal analysis, Q.G.; investigation, L.T.; resources, Q.G.; data curation, Q.G.; writing—original draft preparation, Z.D.; writing—review and editing, J.Y.; visualization, Q.G.; supervision, Z.D.; project administration, L.T.; funding acquisition, Z.D. All authors have read and agreed to the published version of the manuscript.
Funding
This research was funded by [Natural Science Foundation of Henan Province] grant number [222300420415].
Acknowledgments
The authors would like to express their sincere gratitude for the financial support from the Natural Science Foundation of Henan Province (222300420415).
Conflicts of Interest
The authors declare that they have no known competing financial interests or personal relationships that could have appeared to influence the work reported in this paper.
References
- Tseng, W.S.; Penzien, J. Seismic response of long multiple-span highway bridges. Earthq. Eng. Struct. Dyn. 1975, 4, 25–48. [Google Scholar] [CrossRef]
- Kawashima, K.; Unjoh, S. The damage of highway bridges in the 1995 hyogo-ken nanbu earthquake and its impact on Japanese seismic design. J. Earthq. Eng. 1997, 1, 505–541. [Google Scholar] [CrossRef]
- Han, Q.; Du, X.L.; Liu, J.B.; Li, L.Y.; Zhao, J.F. Seismic damage of highway bridges during the 2008 Wenchuan earthquake. Earthq. Eng. Eng. Vib. 2009, 8, 263–273. [Google Scholar] [CrossRef]
- Hsu, Y.T.; Fu, C.C. Seismic effect on highway bridges in Chi-Chi earthquake. J. Perform Constr. Facil 2004, 18, 47–53. [Google Scholar] [CrossRef]
- Liu, K.; Wang, L.H. Earthquake damage of curved highway bridges in 2008 Wenchuan earthquake. Adv. Mater. Res. 2013, 838-841, 1571–1576. [Google Scholar] [CrossRef]
- Pang, Y.T.; Zhou, X.Y.; He, W.; Zhong, J.; Hui, O.Y. Uniform design–based Gaussian process regression for data-driven rapid fragility assessment of bridges. J. Struct. Eng. 2021, 147, 04021008. [Google Scholar] [CrossRef]
- Godden, D.W.W. Seismic response of long curved bridge structures: Experimental model studies. Earthq. Eng. Struct. Dyn. 1979, 7, 107–128. [Google Scholar]
- Wilson, E.L.; Button, M.R. Three-dimensional dynamic analysis for multi-component earthquake spectra. Earthq. Eng. Struct. Dyn. 1982, 10, 471–476. [Google Scholar] [CrossRef]
- Zhong, D.; Wang, S.; Liu, W. Shaking table experimental study and theoretical analysis of the longitudinal seismic-reduced behavior of continuous-beam bridges. China Civ. Eng. J. 2012, 30, 185–187. (In Chinese) [Google Scholar]
- Zhan, J.D.; Li, X.T.; Li, Y. Comparative study on nonlinear earthquake response of girder isolated bridges with LRB and model shaking table test. Adv. Mater. Res. 2013, 706-708, 472–477. [Google Scholar] [CrossRef]
- Jiang, L.; Kang, X.; Li, C.; Shao, G. Earthquake response of continuous girder bridge for high-speed railway: A shaking table test study. Eng. Struct. 2019, 180, 249–263. [Google Scholar] [CrossRef]
- Feng, R.; Deng, T.; Lao, T.; Sextos, A.G.; Yuan, W. Theory and experimental verification of a resultant response-based method for assessing the critical seismic excitation direction of curved bridges. Eng. Struct. 2020, 216, 110713. [Google Scholar] [CrossRef]
- Qiang, H.; Du Xiuli, L.J. Seismic responsesof isolated bridges under multi-dimensional earthquake (I)—Shaking table test for model structure. J. Vib. Shock. 2008, 27, 59–65. [Google Scholar]
- Li, B.; Bi, K.; Chouw, N.; Butterworth, J.W.; Hao, H. Experimental investigation of spatially varying effect of ground motions on bridge pounding. Earthq. Eng. Struct. Dyn. 2012, 41, 1959–1976. [Google Scholar] [CrossRef]
- Li, B.; Bi, K.; Chouw, N. Effect of abutment excitation on bridge pounding. Eng. Struct. 2013, 54, 57–68. [Google Scholar] [CrossRef]
- Ni, Y.; Chen, J.; Teng, H.; Jiang, H. Influence of earthquake input angle on seismic response of curved girder bridge. J. Traffic Transp. Eng. 2015, 2, 233–241. [Google Scholar] [CrossRef]
- Li, X.; Zhang, D.Y.; Yan, W.M.; Chen, Y.J.; Xie, W.C. Shake-table test for a typical curved bridge: Wave passage and local site effects. J. Bridge Eng. 2015, 20, 04014061. [Google Scholar] [CrossRef]
- Jung, D.; Wilcoski, J.; Andrawes, B. Bidirectional shake table testing of RC columns retrofitted and repaired with shape memory alloy spirals. Eng. Struct. 2018, 160, 171–185. [Google Scholar] [CrossRef]
- Jeon, J.S.; Choi, E.; Noh, M.H. Fragility characteristics of skewed concrete bridges accounting for ground motion directionality. Struct. Eng. Mech. 2017, 63, 647–657. [Google Scholar]
- Vaiana, N.; Sessa, S.; Marmo, F.; Rosati, L. An accurate and computationally efficient uniaxial phenomenological model for steel and fiber reinforced elastomeric bearings. Compos. Struct. 2019, 211, 196–212. [Google Scholar] [CrossRef]
- Abe, M.J.; Fujino, Y.Y. Multiaxial behaviors of laminated rubber bearings and their modeling. I: Experimental study. J. Struct. Eng. 2004, 130, 1119–1132. [Google Scholar] [CrossRef]
- Moncarz, P.D.; Krawinkler, H. Similitude requirements for dynamic models. Spec. Publ. 1982, 73, 1–22. [Google Scholar]
- Zhou, Y.; Lu, X.L. Method and Technology for Shaking Table Model Test of Building Structures; Science Press: Beijing, China, 2016. (In Chinese) [Google Scholar]
- Yin, J.H.; Li, Q.N. Study on mechanical properties of grain concrete. Archit. Technol. 2019, 50, 95–97. [Google Scholar]
- Saman, Y.S. A novel approach for classification of earthquake ground-motion records. J. Seismol. 2017, 21, 885–907. [Google Scholar]
- JTG/T B02-01; Guidelines for Seismic Design of Highway Bridge. People Transportation Press: Beijing, China, 2008. (In Chinese)
- Wen, Y.-K. Method for random vibration of hysteretic systems. J. Eng. Mech. Div. 1976, 102, 249–263. [Google Scholar] [CrossRef]
- Vaiana, N.; Rosati, L. Classification and unified phenomenological modeling of complex uniaxial rate-independent hysteretic responses. Mech. Syst. Signal Processing 2023, 182, 109539. [Google Scholar] [CrossRef]
- Vaiana, N.; Sessa, S.; Paradiso, M.; Marmo, F.; Rosati, L. An efficient computational strategy for nonlinear time history analysis of seismically base-isolated structures. In Proceedings of the XXIV AIMETA Conference; Springer: Cham, Switzerland, 2019. [Google Scholar]


Publisher’s Note: MDPI stays neutral with regard to jurisdictional claims in published maps and institutional affiliations. |
© 2022 by the authors. Licensee MDPI, Basel, Switzerland. This article is an open access article distributed under the terms and conditions of the Creative Commons Attribution (CC BY) license (https://creativecommons.org/licenses/by/4.0/).