Abstract
The shear characteristics of the interfaces between soil and concrete structures are essential for the safety of the structures. In this study, a large-scale direct shear test apparatus was developed to measure the mechanical parameters of soil–concrete interfaces under conditions with different soil types, soil moisture contents, and interfacial filling materials. The results showed that the shear stress of the soil–concrete interface increased initially and then became stable with the increase in the shear displacement. The shear displacement of the sandy soil when the shear stress became stable was smaller than that of the clayey soil. The silty sand–concrete interface had a smaller friction angle than the interface with the medium-coarse sand. Moreover, with the increase in the soil moisture content, the friction angle of the clayey soil–concrete interface decreased rapidly, whereas the cohesion first increased and then decreased, and the peak cohesion was near the plastic limit of the soil. Under the same moisture content, the friction angle and cohesion of the clay–concrete interface was reduced by filling the interface with a thin layer of sandy soil, while filling the silty sand–concrete interface with a thin layer of silt reduced the friction angle and increased the interfacial cohesion. Nonetheless, the filling had little impact on the overall shear strength of the interface.
1. Introduction
The interfacial shear strength is a key engineering parameter in the design of pile foundations, retaining walls, and submerged foundations. However, there are currently limited data on the frictional parameters between different soil materials and structures (Konkol et al., 2021) [1]. The shear strength of a soil–concrete interface is affected by various factors, such as the soil moisture content, density, and confining pressure (Abdulghade et al., 2021) [2]. Current designs generally adopt a semi-empirical method based on elasticity theory and experimental data (Johnson et al., 2001) [3]. Thus, it is of great research and practical significance to obtain accurate soil–structure interfacial shear parameters.
Extensive studies have been carried out on the parameters of soil–structure interfaces. For example, in order to obtain reproducible results, Yin et al. (2021) prepared a sand–clay mixture, which showed better uniformity than specimens prepared with traditional soil reconstruction techniques [4]. Canakci et al. (2016) studied the influence of structural materials on the soil–structure interface parameters and found that the friction angle of the soil–concrete interface was larger than those of the soil–steel and soil–wood interfaces [5]. In terms of the value of the friction angle of the soil–concrete interface, Ilori et al. (2017) showed that the normal stress affected the friction coefficient of the soil–concrete interface [6]. Shakir et al. (2008) found that the surface morphology of the structure was the most important factor affecting the friction coefficient of the soil–structure interface [7]. Muszyński et al. (2019) assessed the surface morphology of the concrete pile foundation using a three-dimensional laser scanner and proposed a morphological evaluation method [8]. Konkol et al. (2021) studied the shear softening characteristics and failure load of a soft soil–concrete interface under a constant normal load. Then, a hyperbolic interface model was established based on a direct shear test [1]. Cen et al. (2020) obtained hysteresis and backbone curves under different vertical pressures and shear–displacement amplitudes [9]. Yin et al. (2020) and Ravera et al. (2022) proposed that the thermal cycle is also a potential factor affecting the soil–structure interface response [10,11]. Casagrande et al. (2020) evaluated the mechanical properties of concrete piles under thermal loads, and the results showed that there was an increase in the pile–soil frictional resistance after each thermal cycle [12]. Wang et al. (2022) studied the behavior of a soil–structure interface under a constant normal stiffness using the discrete element method and proposed an algorithm to achieve a constant normal stiffness [13]. Liu et al. (2019) argued that the interface friction angle could change during pile construction, and an on-site test was the best method to obtain the shear parameters of the soil–structure interfaces [14]. In summary, the above studies yielded many important conclusions; yet, there is still a lack of in-depth research on the influence of various factors, such as the soil type, soil moisture content, and interface filling material, on the shear strength of the soil–structure interface.
In this study, large-scale direct shear tests were carried out on different types of soil materials, including silty sand, medium-coarse sand, clay, and sandstone, in order to study the influence of the soil moisture content, normal stress, and interface filling material on the shear parameters of the soil–concrete interface.
2. Materials and Methods
2.1. Test Apparatus
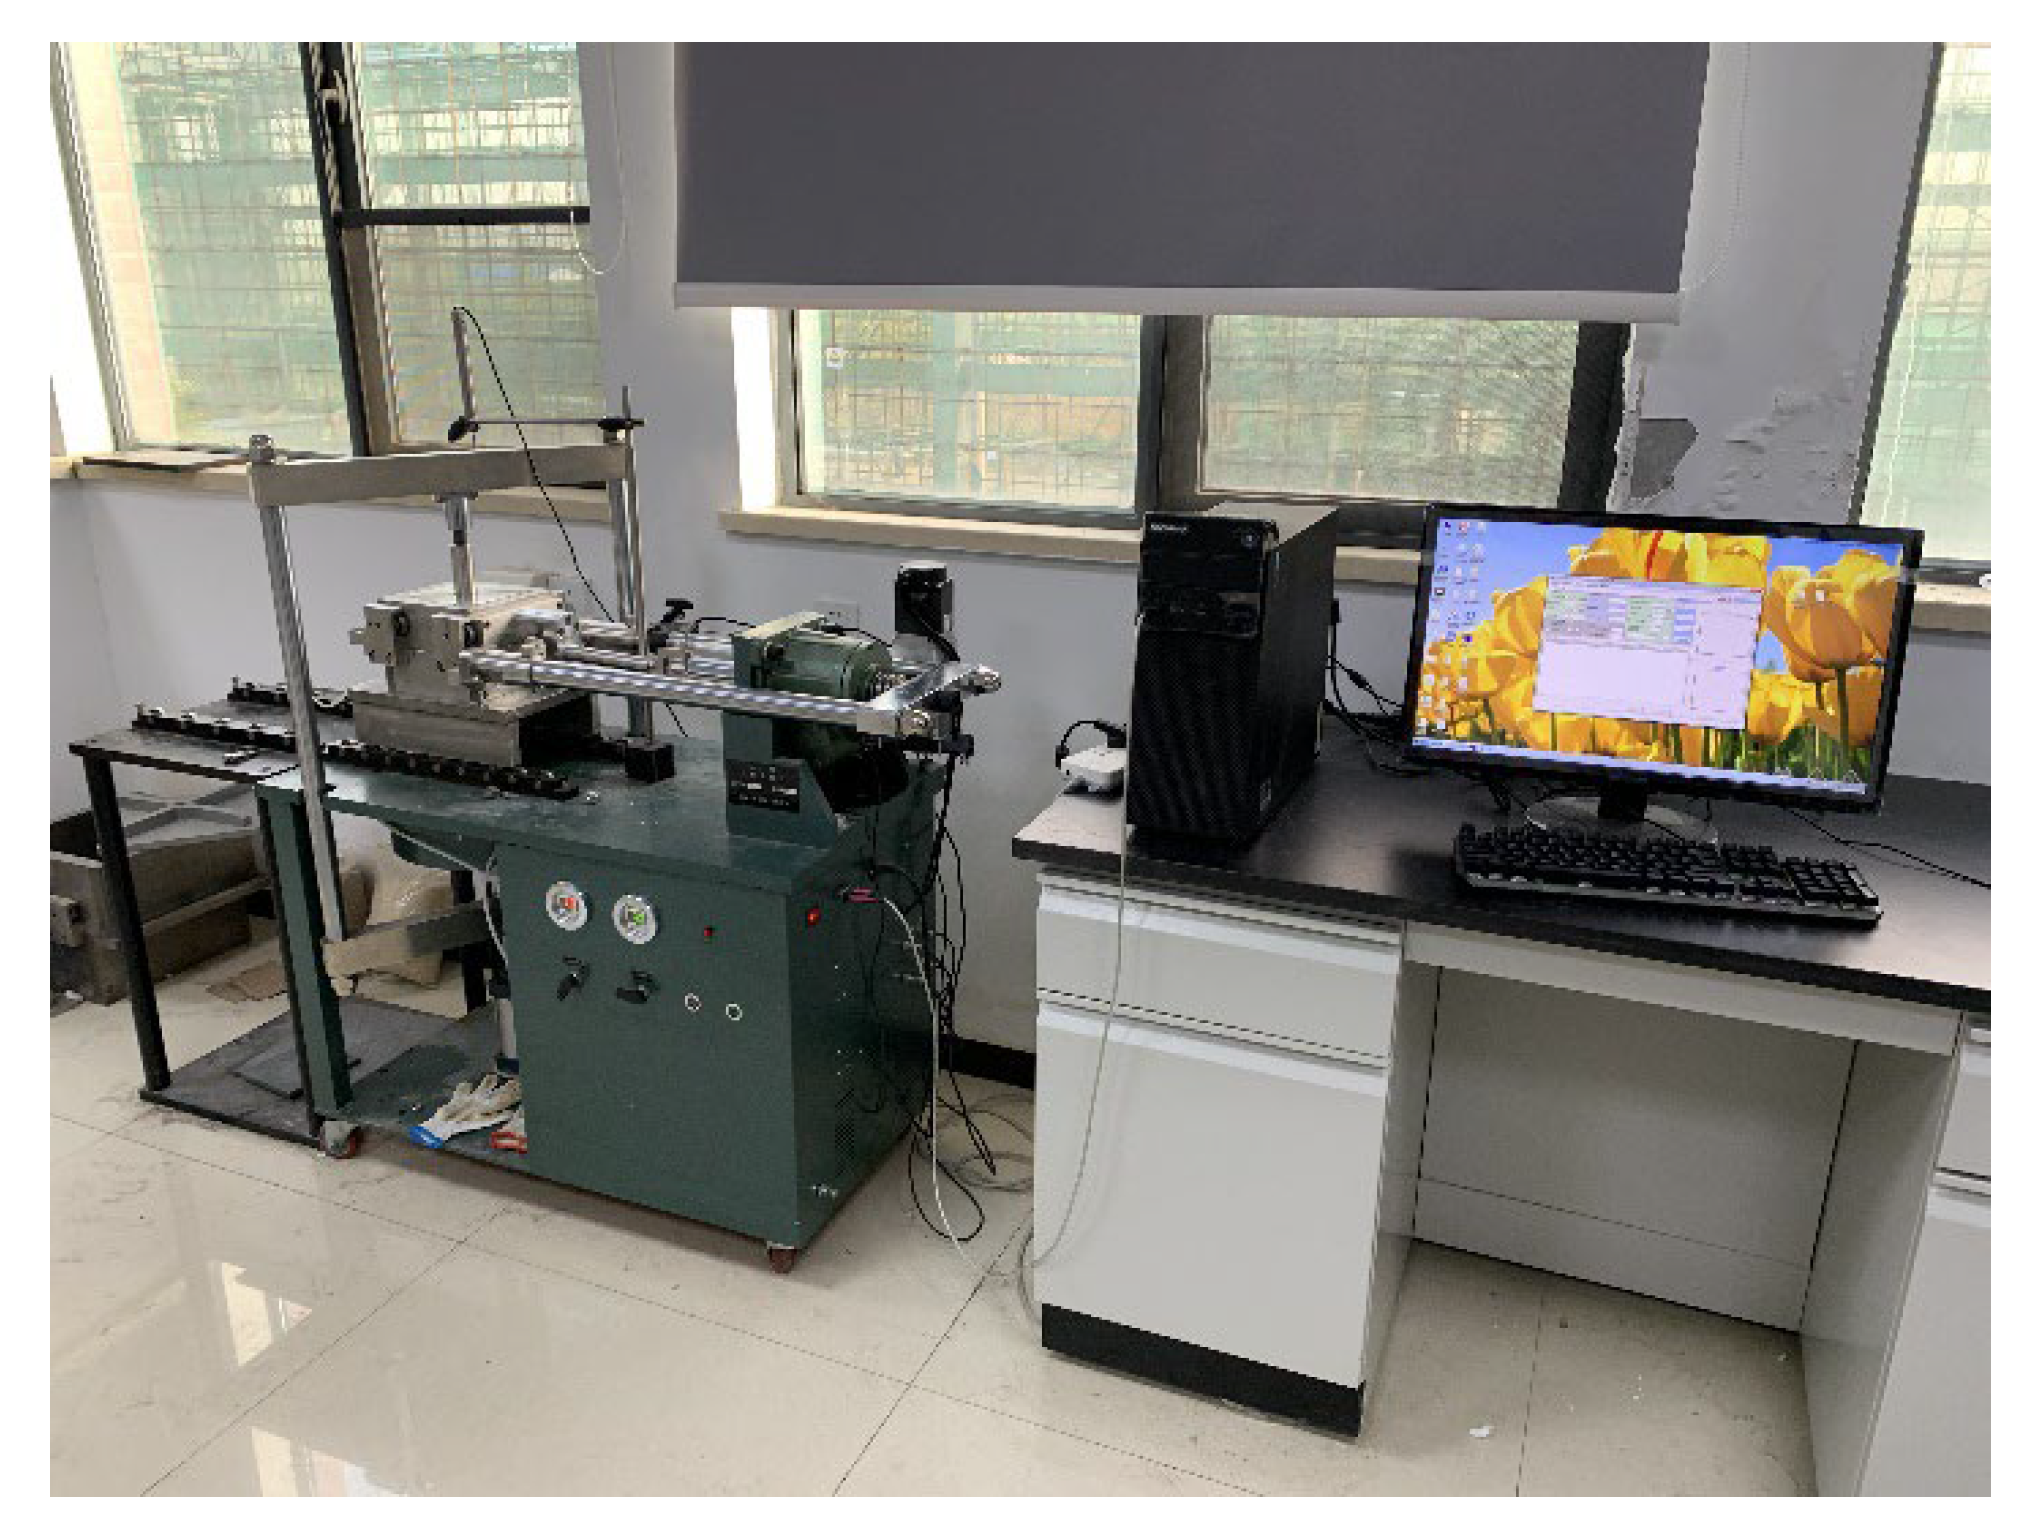
The large-scale direct shear test apparatus DZJ-1 was used in this study. The length, width, and height of the shear box were all 150 mm. A normal force was applied by a rolling diaphragm cylinder, and the horizontal shear force was under servo control. The apparatus had a horizontal shear rate range of 0.002–4.0 mm/min, and the shear rate used in this study was 1 mm/min. During the shear test, the horizontal shear displacement and shear stress were automatically collected via sensors, the accuracies of which were ±1%. The large-scale direct shear apparatus is shown in Figure 1.

Figure 1.
DZJ-1 large-scale direct shear test apparatus.
When the large-scale direct shear test apparatus was used for the shear test, C30 concrete blocks with a length of 15 cm, a width of 15 cm, and a height of 5 cm were placed in the lower shear box, and soil samples with a length of 15 cm, a width of 15 cm, and a height of 5 cm were placed in the upper shear box. The schematic diagram of the placement of the shear test samples is shown in Figure 2.
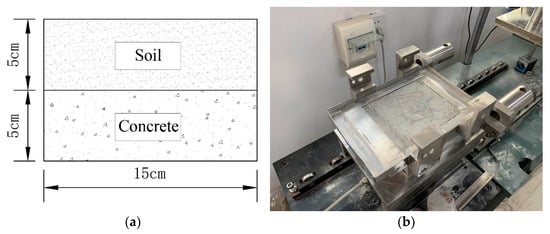
Figure 2.
The schematic diagram of the placement of shear test samples: (a) sample placement diagram and (b) concrete blocks.
2.2. Soil Materials
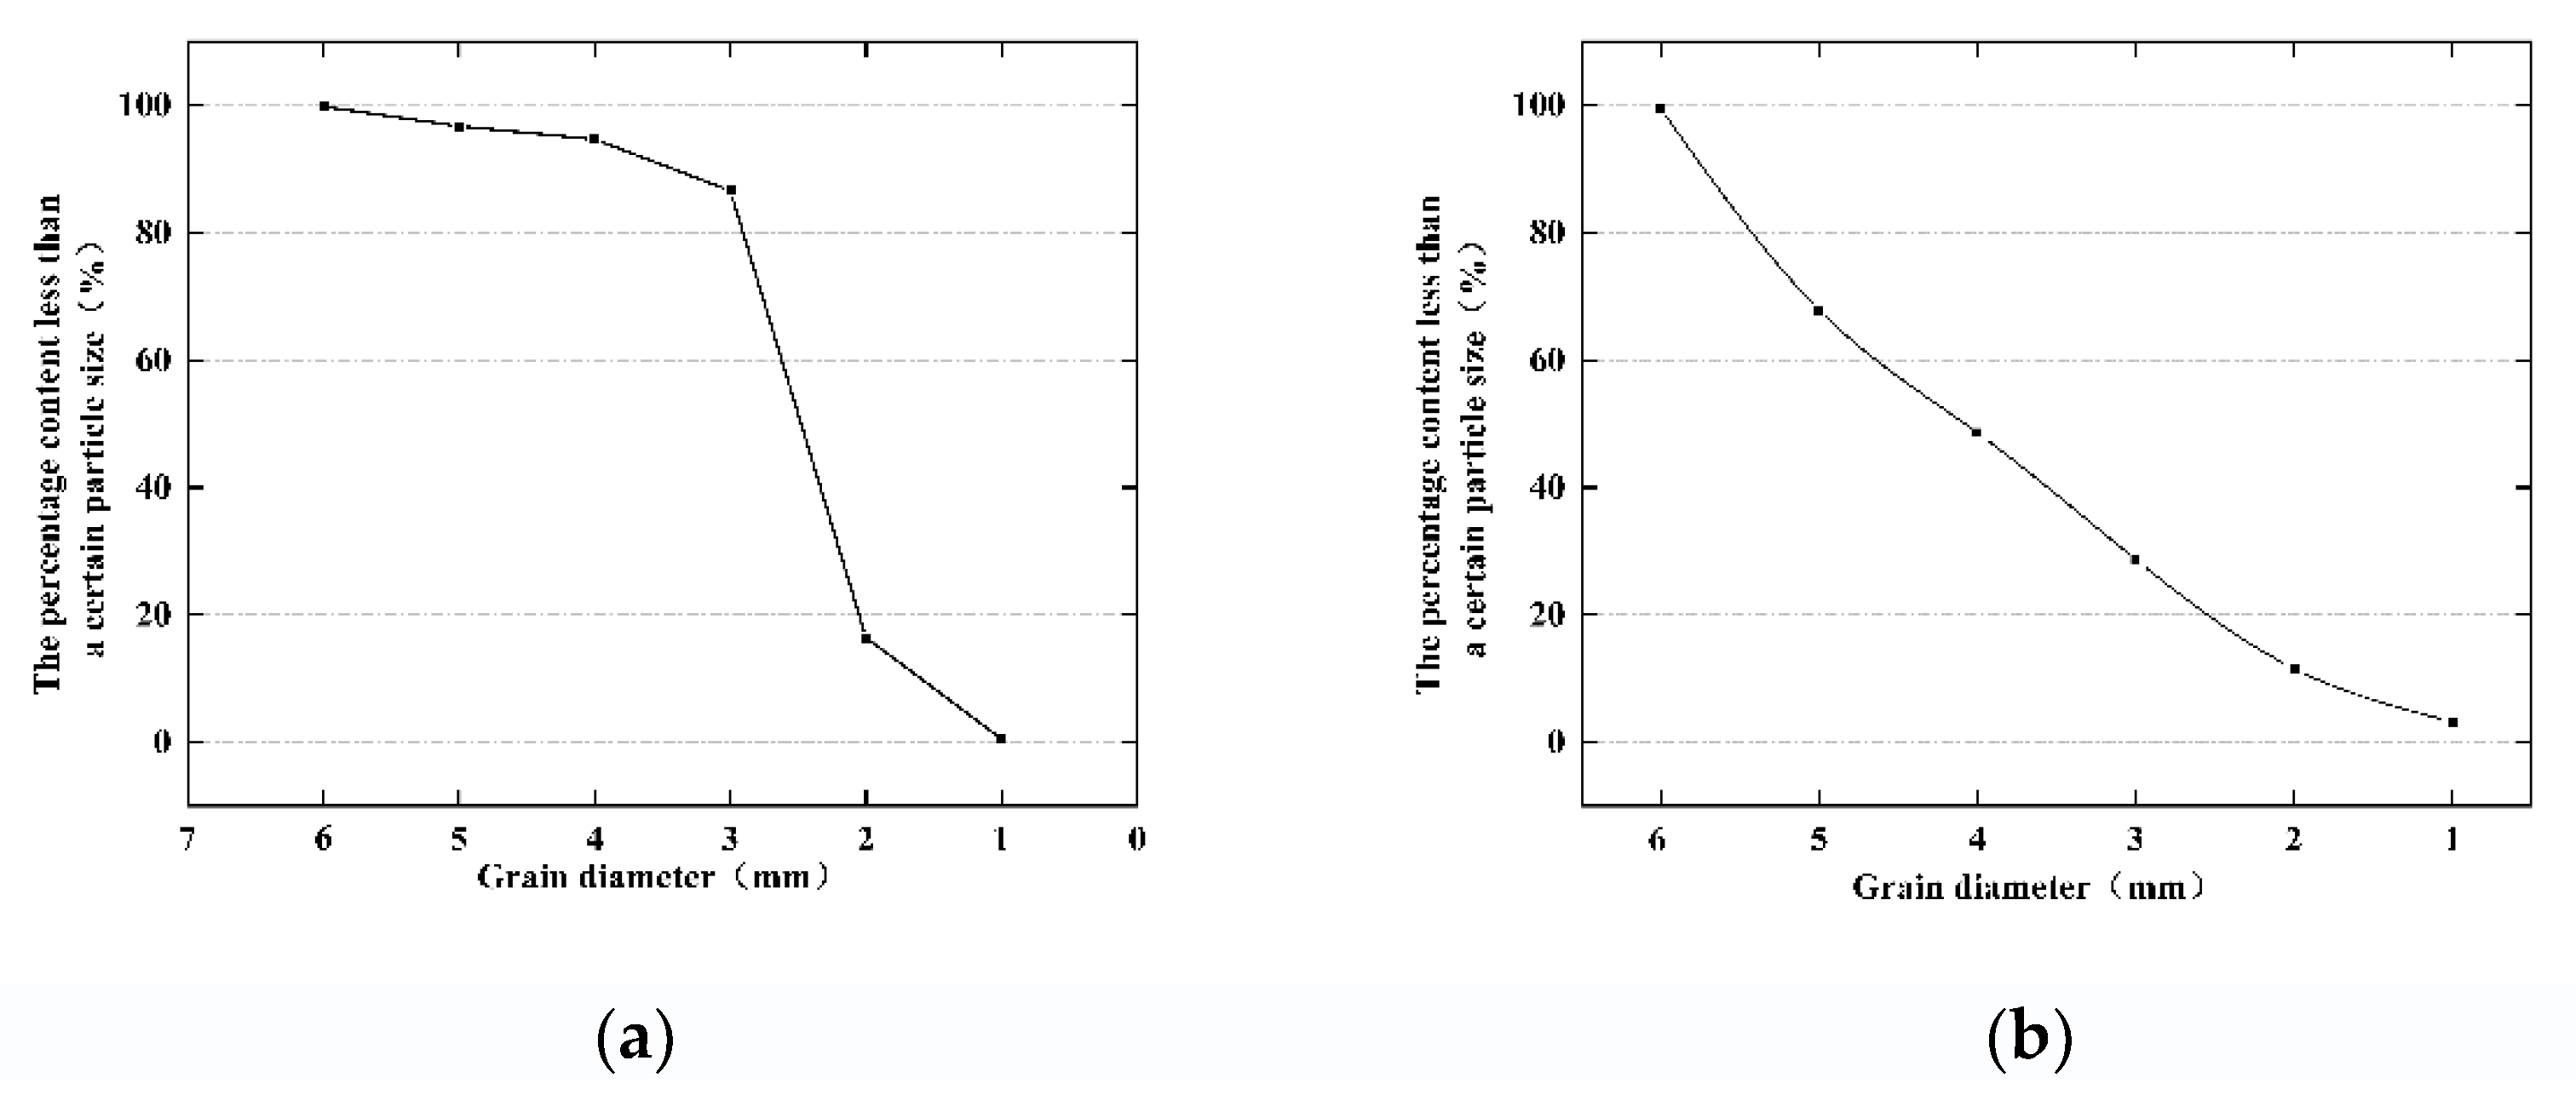
Silty sand, medium-coarse sand, and sandstone were collected from Wuhan City, Hubei Province, China. The clay was obtained from the Oujiang River estuary in Wenzhou City, Zhejiang Province, China. The soil samples were collected from the same batch, and the same soil samples had good consistency under different experimental conditions. The particle gradation of silty sand and medium-coarse sand was tested, and the gradation curve is shown in Figure 3.
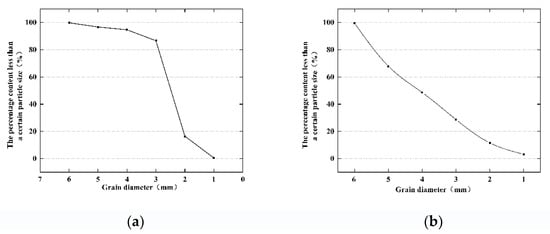
Figure 3.
Gradation curve of sandy soil particles: (a) silty sand and (b) medium-coarse sand.
The liquid limit and the plastic limit of the clay and sandstone were measured by a liquid–plastic limit testing instrument. The liquid limit and the plastic limit of the clay were 37.51% and 19.96%, respectively, and those of the sandstone were 29.64% and 17.04%, respectively. The parameters of the different soil types, such as the dry density, the proportion of the soil particles, the saturated density, and the soil classification, are shown in Table 1.

Table 1.
Physical properties of soil samples.
2.3. Test Conditions
First, four single-soil type specimens were prepared, and shear tests were carried out under four different moisture contents and three normal stress conditions. At high soil moisture contents, the strengths of the clay and sandstone were typically low. Hence, the normal stress levels on the clay were set to 25, 50, and 75 kPa when the soil moisture content was 30% and 50, 100, and 150 kPa when the moisture content was 25%. The clay–concrete interface was filled with thin layers of silty sand and medium-coarse sand, and the silty sand–concrete interface was filled with thin silt. A total of 69 shear tests were carried out, as shown in Table 2.
Table 2.
Test conditions.
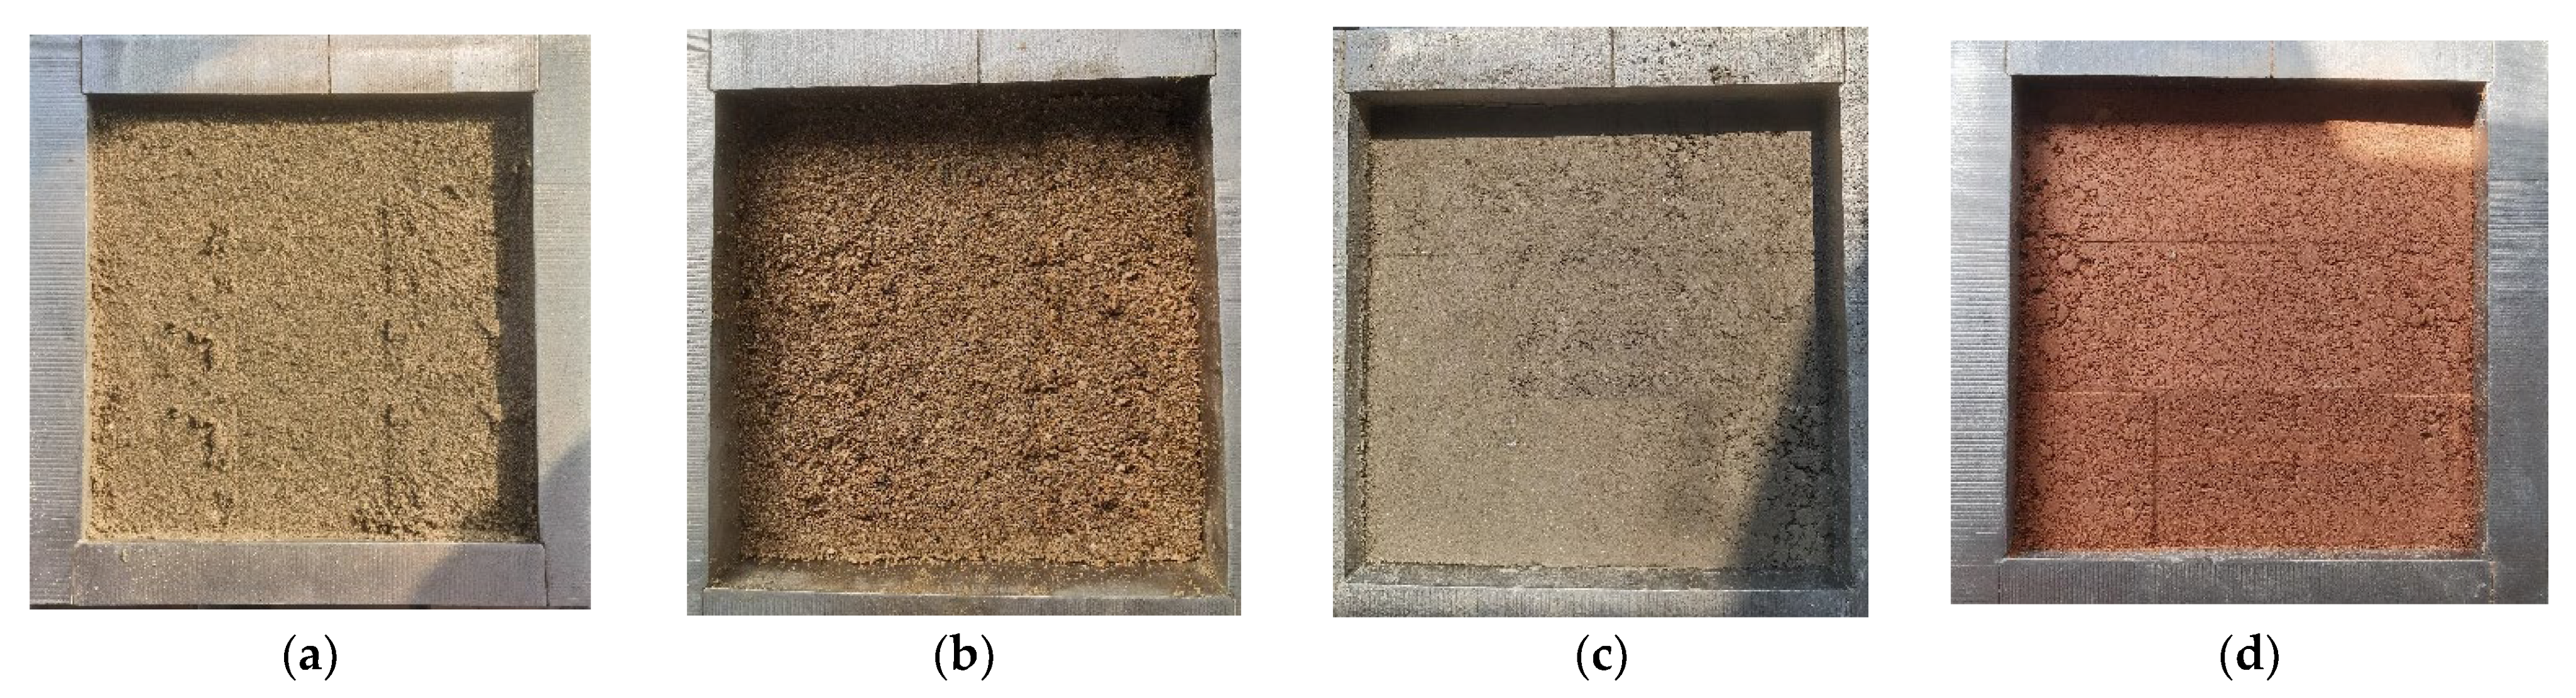
In order to ensure the reproducibility of the tests, the soil specimens were dried and ground, and different quantities of water were then added to prepare soil specimens with different moisture contents. Prefabricated concrete blocks were placed in the lower shear box, and then, the soil specimens were loaded into the shear box in layers. A predetermined normal force was applied to consolidate the soil samples. Figure 4 shows the different soil specimens. After each shear test, the soil–concrete interface was observed. Examples of the shear surfaces of the different soil specimens are shown in Figure 5.
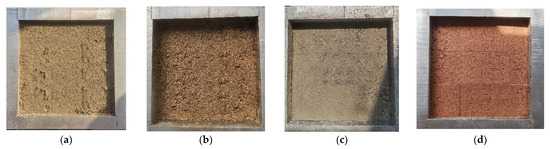
Figure 4.
Different types of soil samples: (a) silty sand, (b) medium-coarse sand, (c) clay, and (d) sandstone.
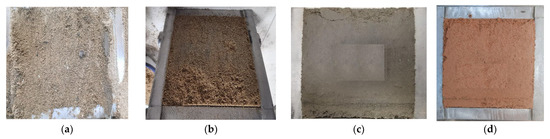
Figure 5.
Examples of interface shear surfaces: (a) silty sand, (b) medium-coarse sand, (c) clay, and (d) sandstone.
3. Results and Analysis
3.1. Shear Test of Unfilled Soil–Concrete Interface
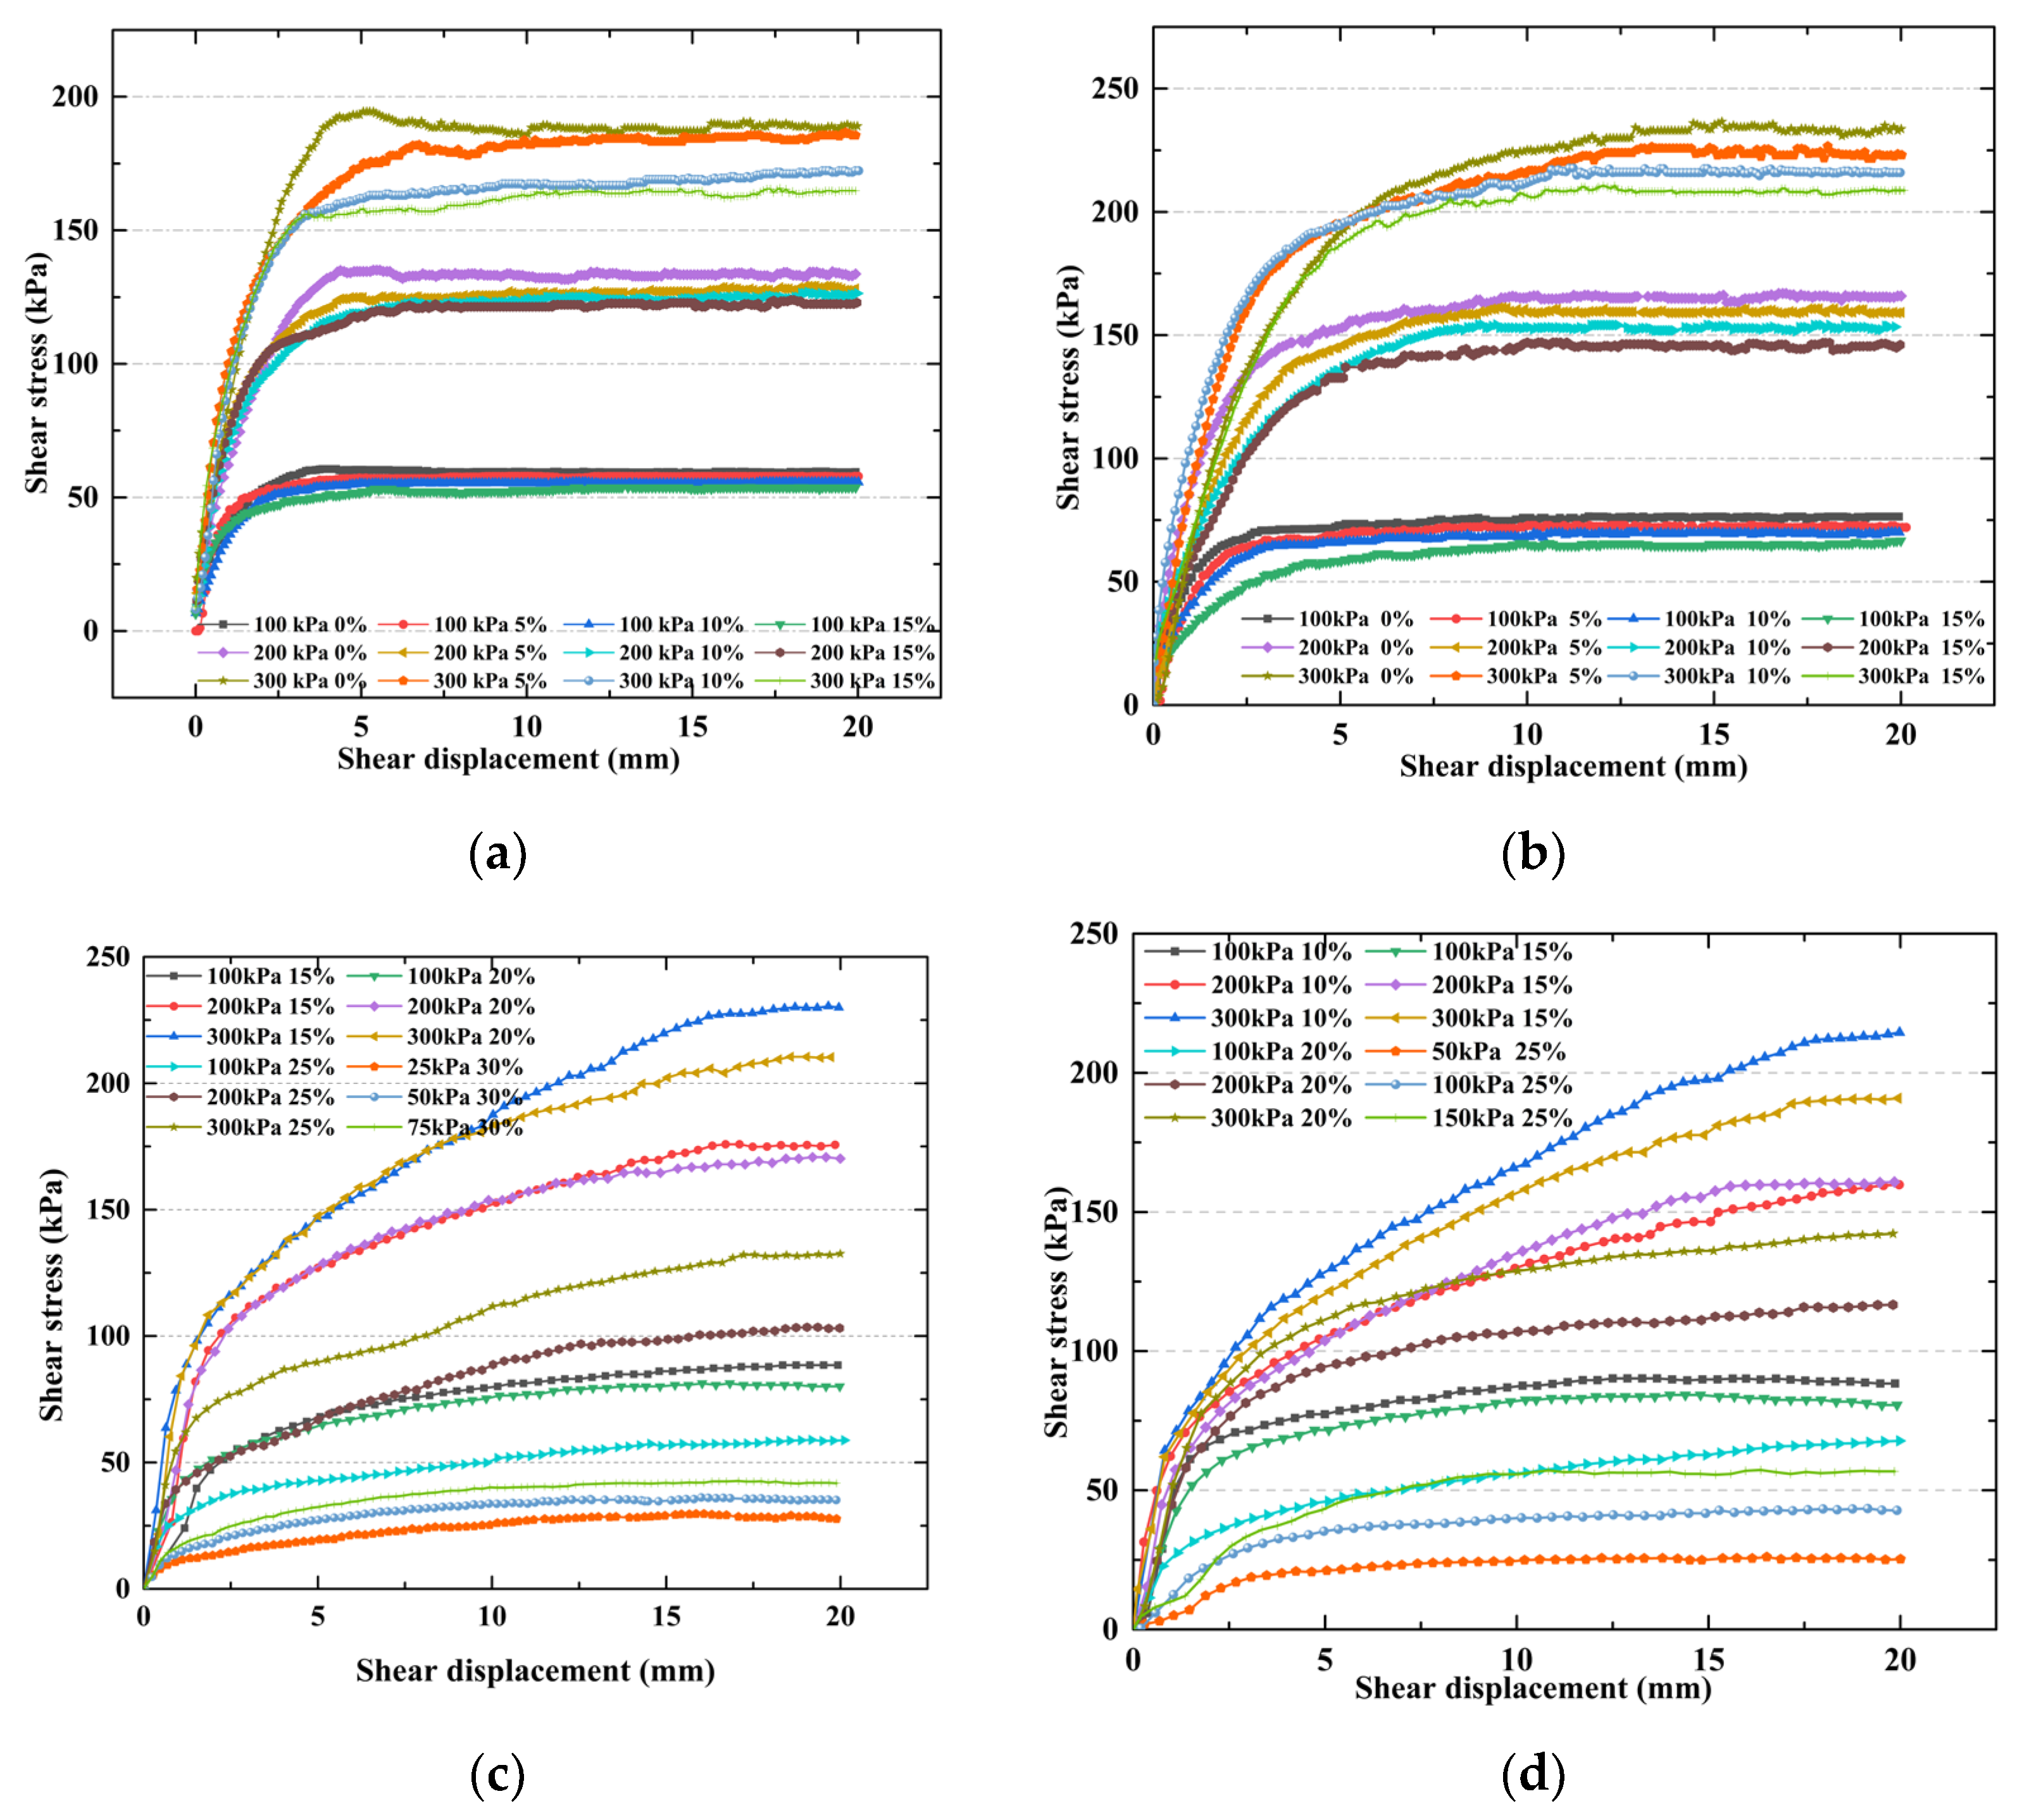
The variations of the shear stress with the shear displacement for the specimens with different moisture contents under different normal stress conditions are shown in Figure 6. The shear stresses of all the specimens first increased with the increase in the shear displacement, and when the shear displacement reached a critical value, the shear stress stabilized. The critical value increased with the increase in the normal stress. In the shear test of different samples, the shear stress first increases and then tends to be stable with the increase in the shear displacement. Silty sand and medium-coarse sand require less shear displacement to stabilize than clay and sandstone. This is mainly due to the fact that the silty and the medium-coarse sand are composed of loose particles, which are easily redistributed during the shear process. However, clay and sandstone are flocculated structures, which are damaged during shear slip, and the shear displacement required to achieve stable shear stress is large.
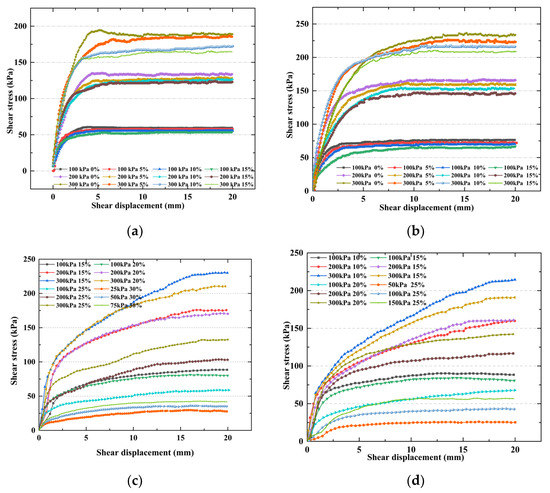
Figure 6.
Variation of shear stress with shear displacement for different soil specimens: (a) silty sand, (b) medium-coarse sand, (c) clay, and (d) sandstone.
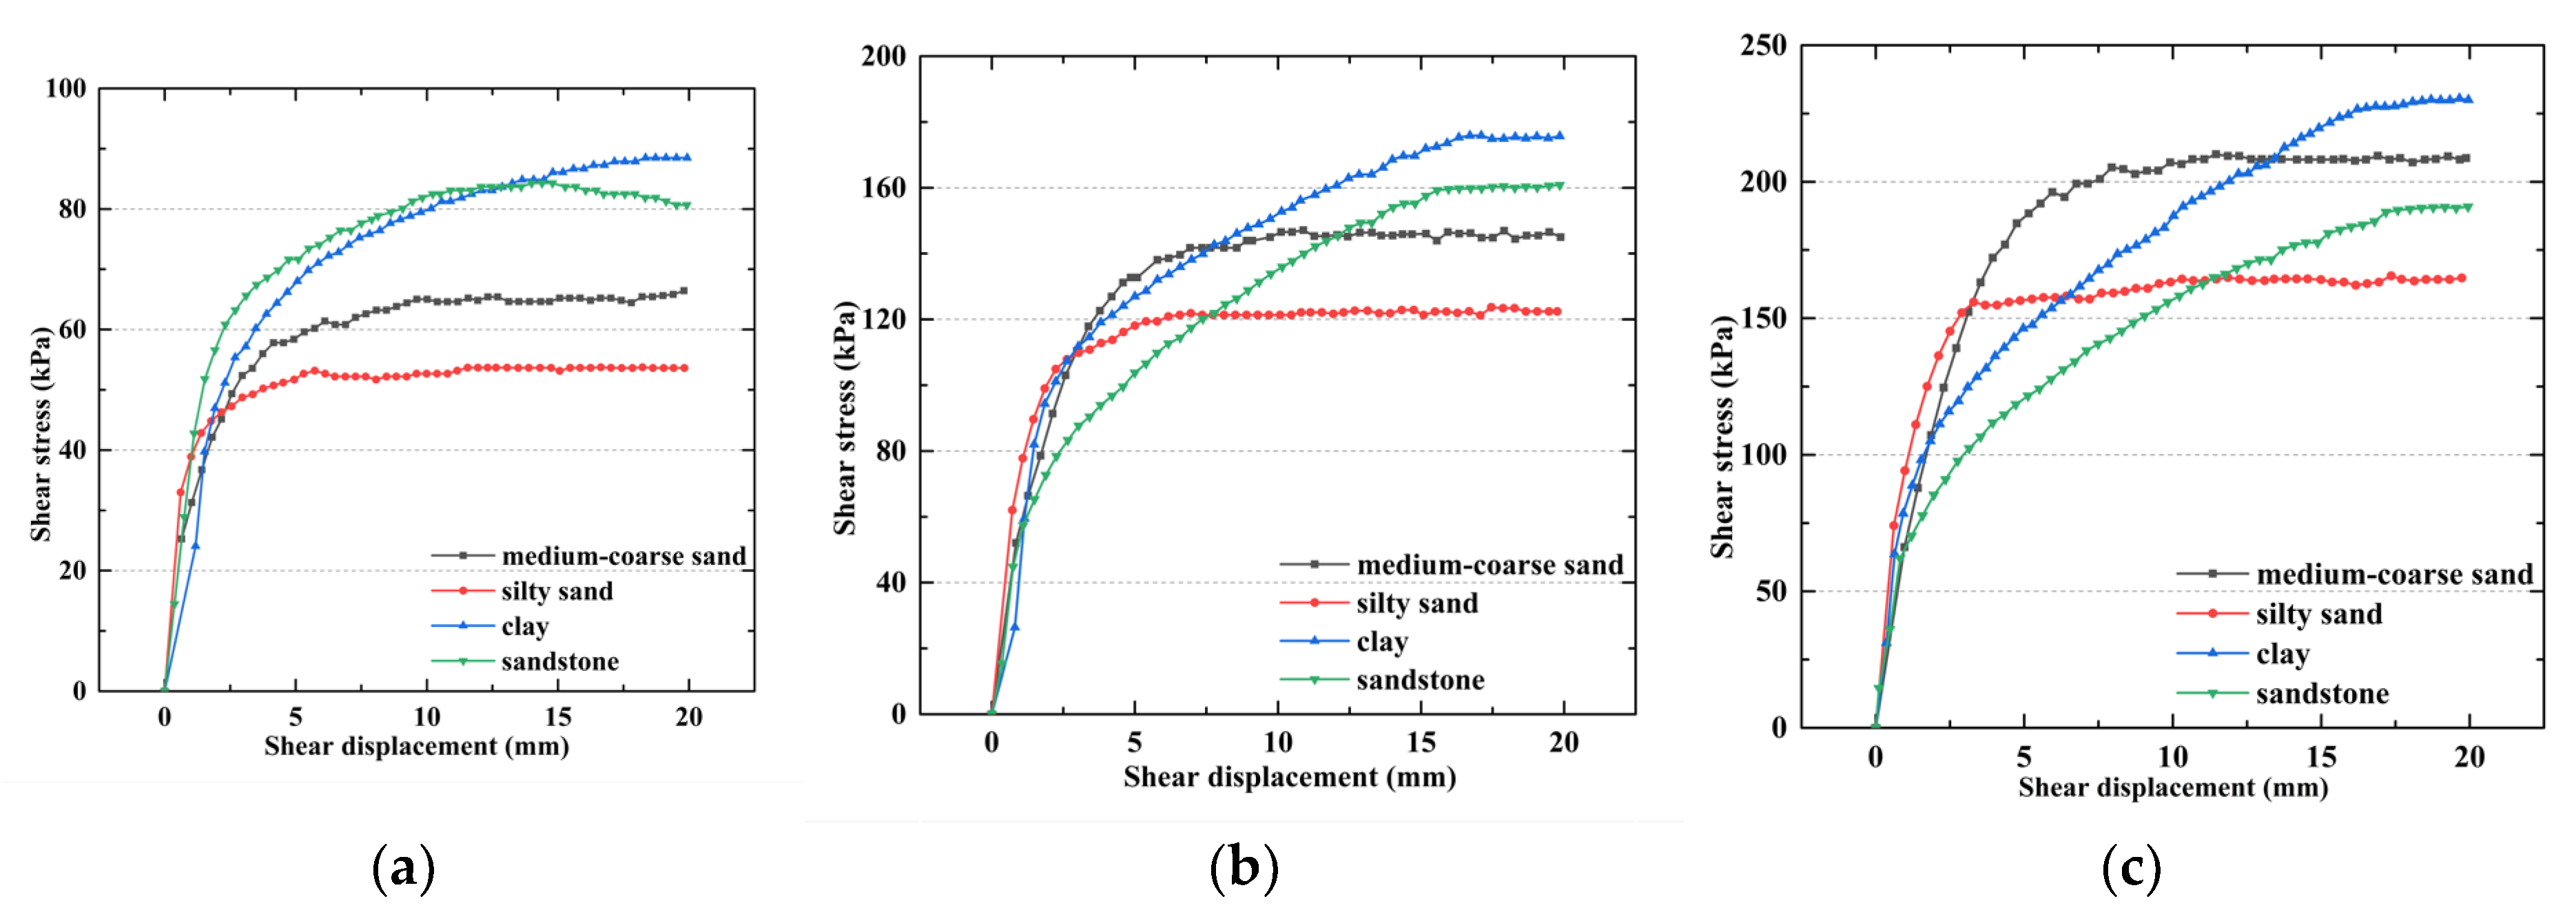
Figure 7 shows the results for different soil specimens with a moisture content of 15%. When the normal stress was 100 kPa, the maximum shear stresses of the different soil specimens in descending order were clay, sandstone, medium-coarse sand, and silty sand. The difference in the maximum shear stress between the clay and the sandstone was small; yet, as the normal stress increased, the difference gradually increased. This was mainly due to the formation of a thin layer of silt at the clayey soil–concrete interface under the action of the normal stress, which reduced the interfacial shear strength. In comparison, the sandstone had more evident water softening properties than the clayey soil. For the silty sand and medium-coarse sand, a water film formed at the interface due to water discharge. However, the water film had little effect on the shear stress of the interface. The shear stress of the silty sand was lower than that of the medium-coarse sand. This was because the particle size of the silty sand was small (0.25–0.5 mm), and compared with the medium-coarse sand, the silty sand particles could more easily fill the voids on the concrete surface, thereby reducing the interface friction coefficient. The particle sizes of the medium-coarse sand were evenly distributed in the range of 0.1–5 mm. The gaps between the particles and between the particles and the concrete surface resulted in an embedding effect, which improved the interfacial shear strength.
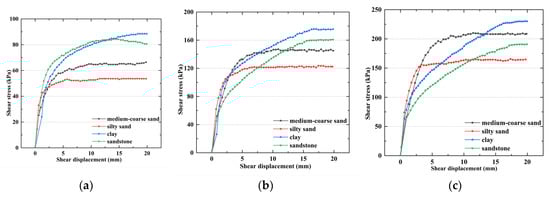
Figure 7.
Shear stress–shear displacement curves of different soil specimens with 15% moisture contents: (a) normal stress: 100 kPa, (b) normal stress: 200 kPa, and (c) normal stress: 300 kPa.
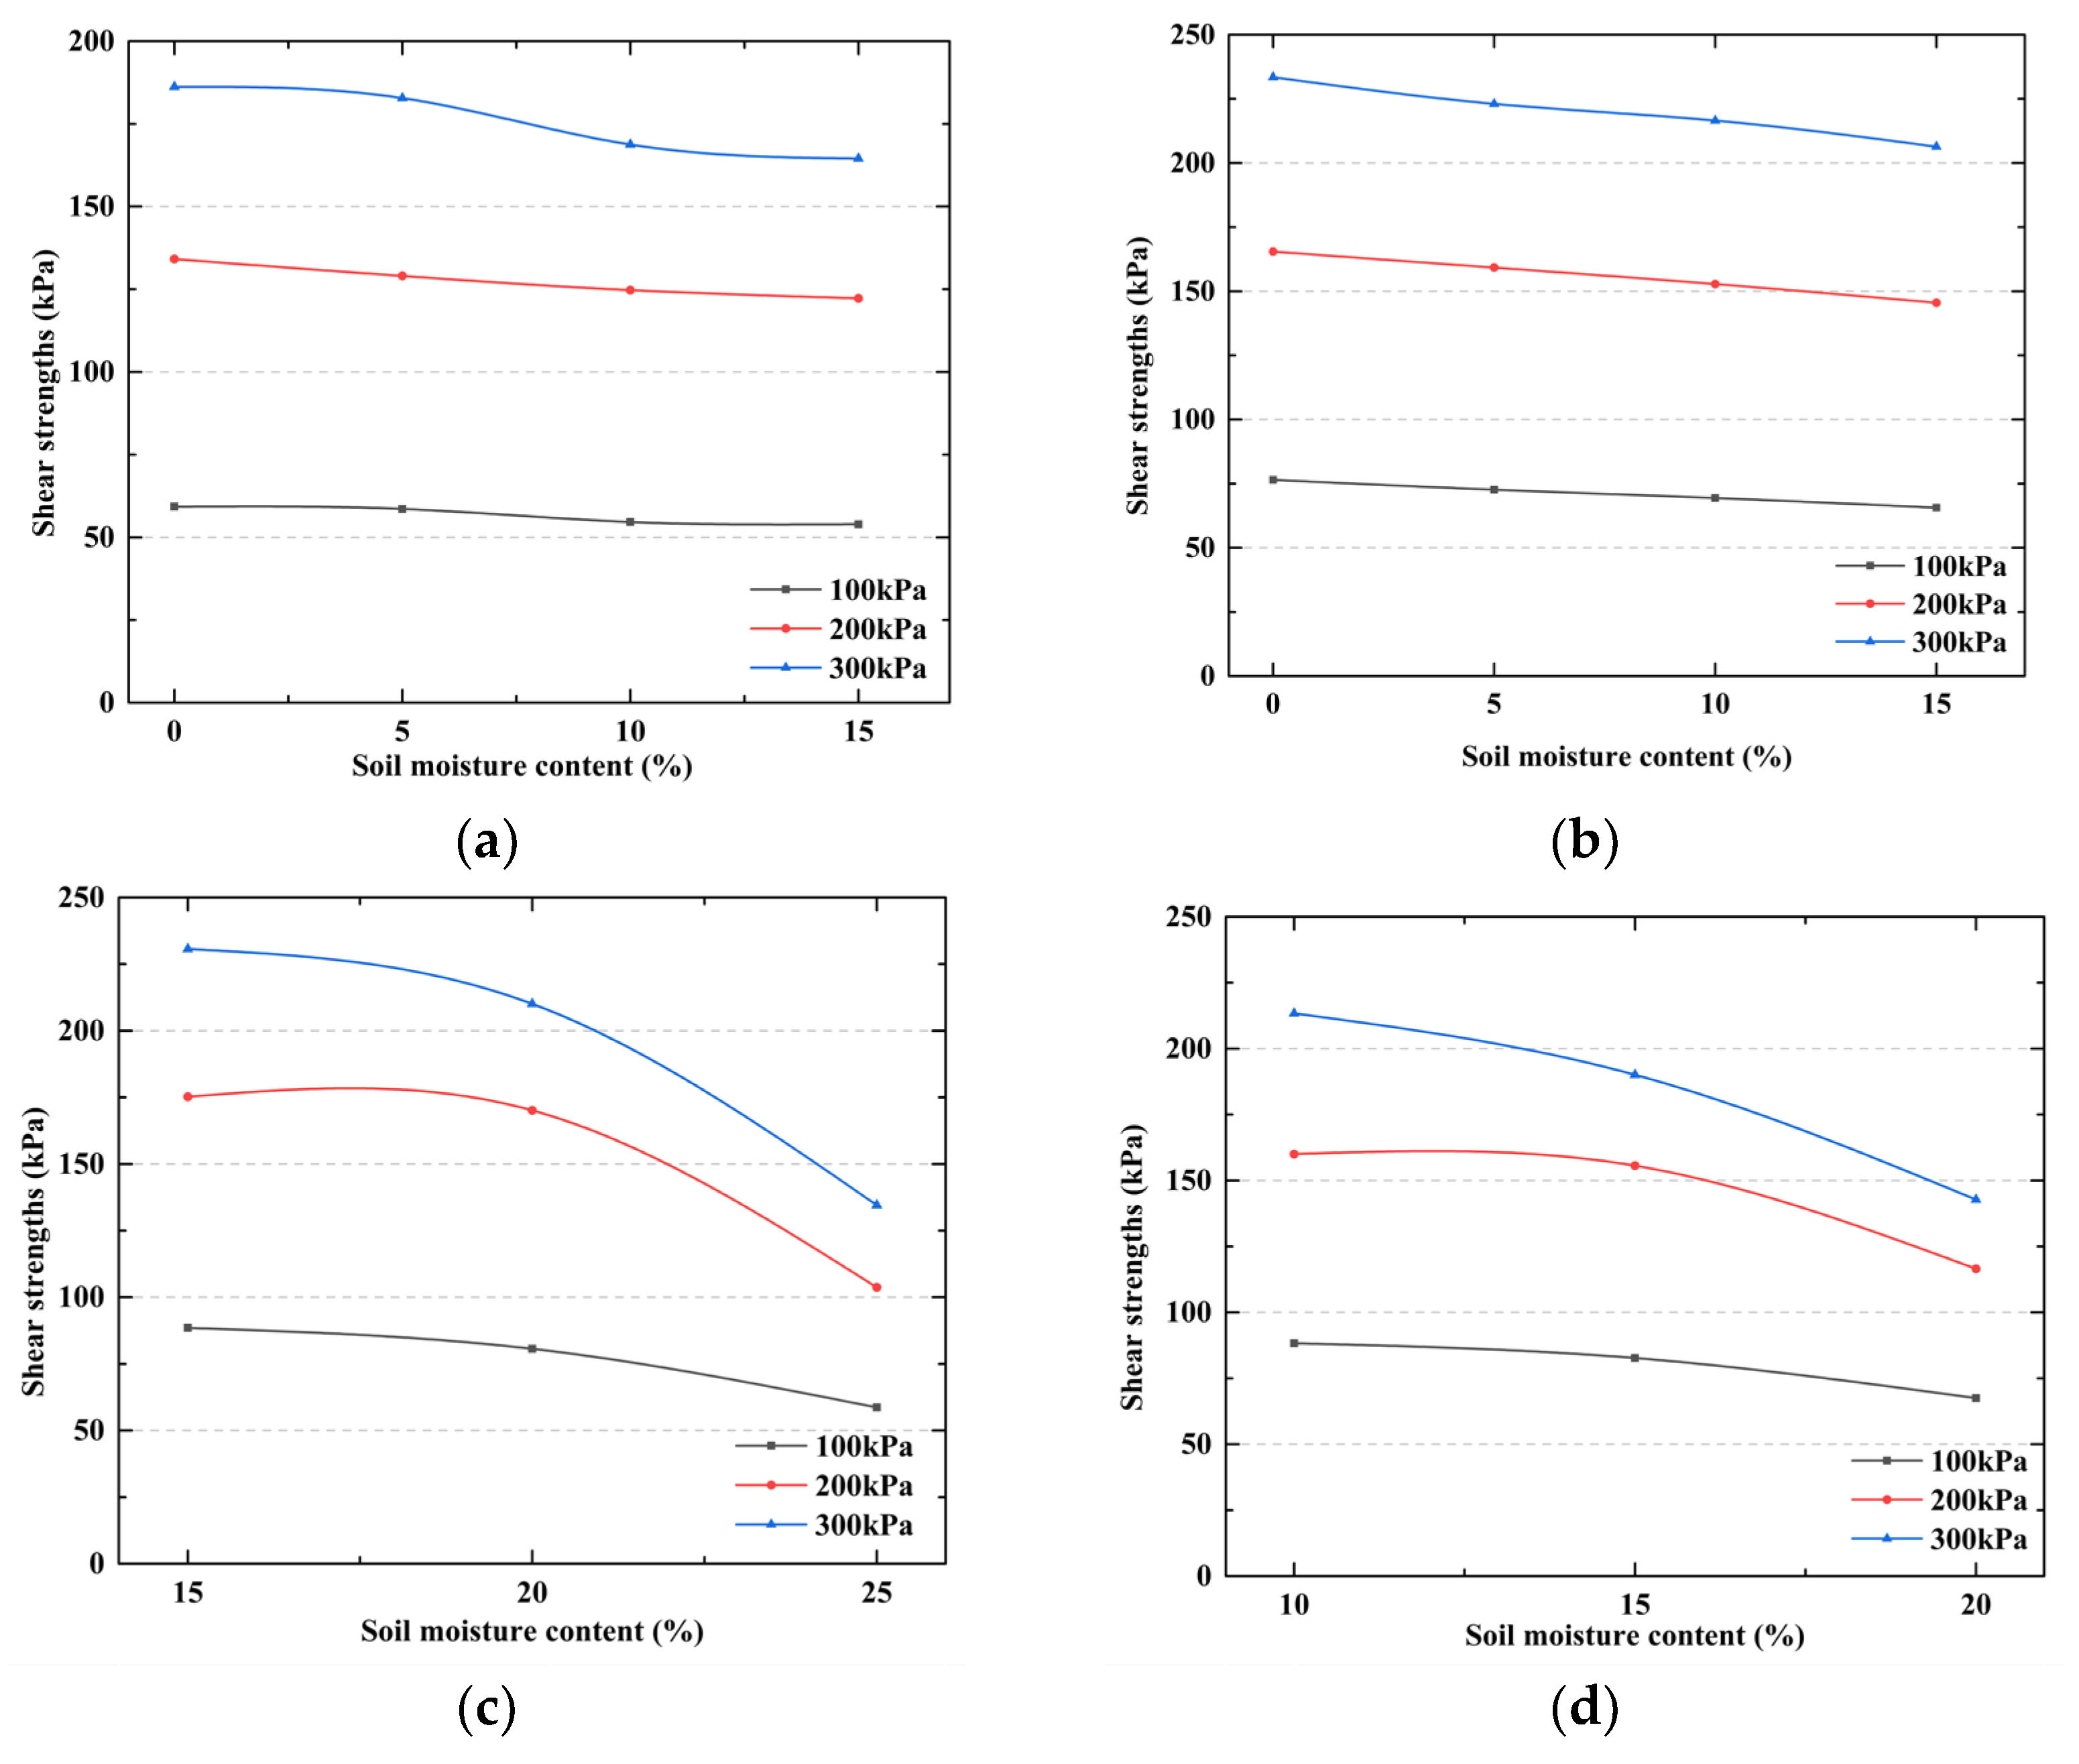
The critical values of the shear stress under the conditions of the different soil types, soil moisture contents, and normal stresses were taken as the interfacial shear strength, as shown in Figure 8. With the increase in the moisture content, the shear strengths of the different soil types decreased to varying degrees. The shear strength of the medium-coarse sand and silty sand decreased by 5–22 kPa, but the overall extent of the decrease was small. For the silt and sandstone, under the same normal stress, the interface was greatly affected by the moisture content. When the moisture content was at a low level, the shear strength of the interface decreased slightly with the increase in the moisture content. However, when the moisture content was above a certain threshold, the shear strength of the interface decreased rapidly, and the maximum decrease was 96 kPa. In addition, the shear strength of the silt and sandstone clayey soil interface was more sensitive to the soil moisture content.
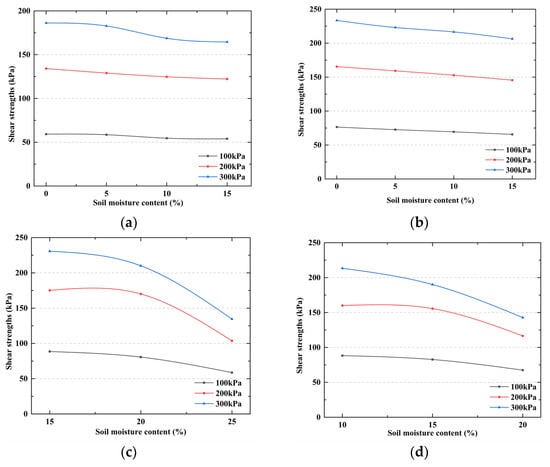
Figure 8.
Variation of interfacial shear strength with moisture content: (a) silty sand, (b) medium-coarse sand, (c) clay, and (d) sandstone.
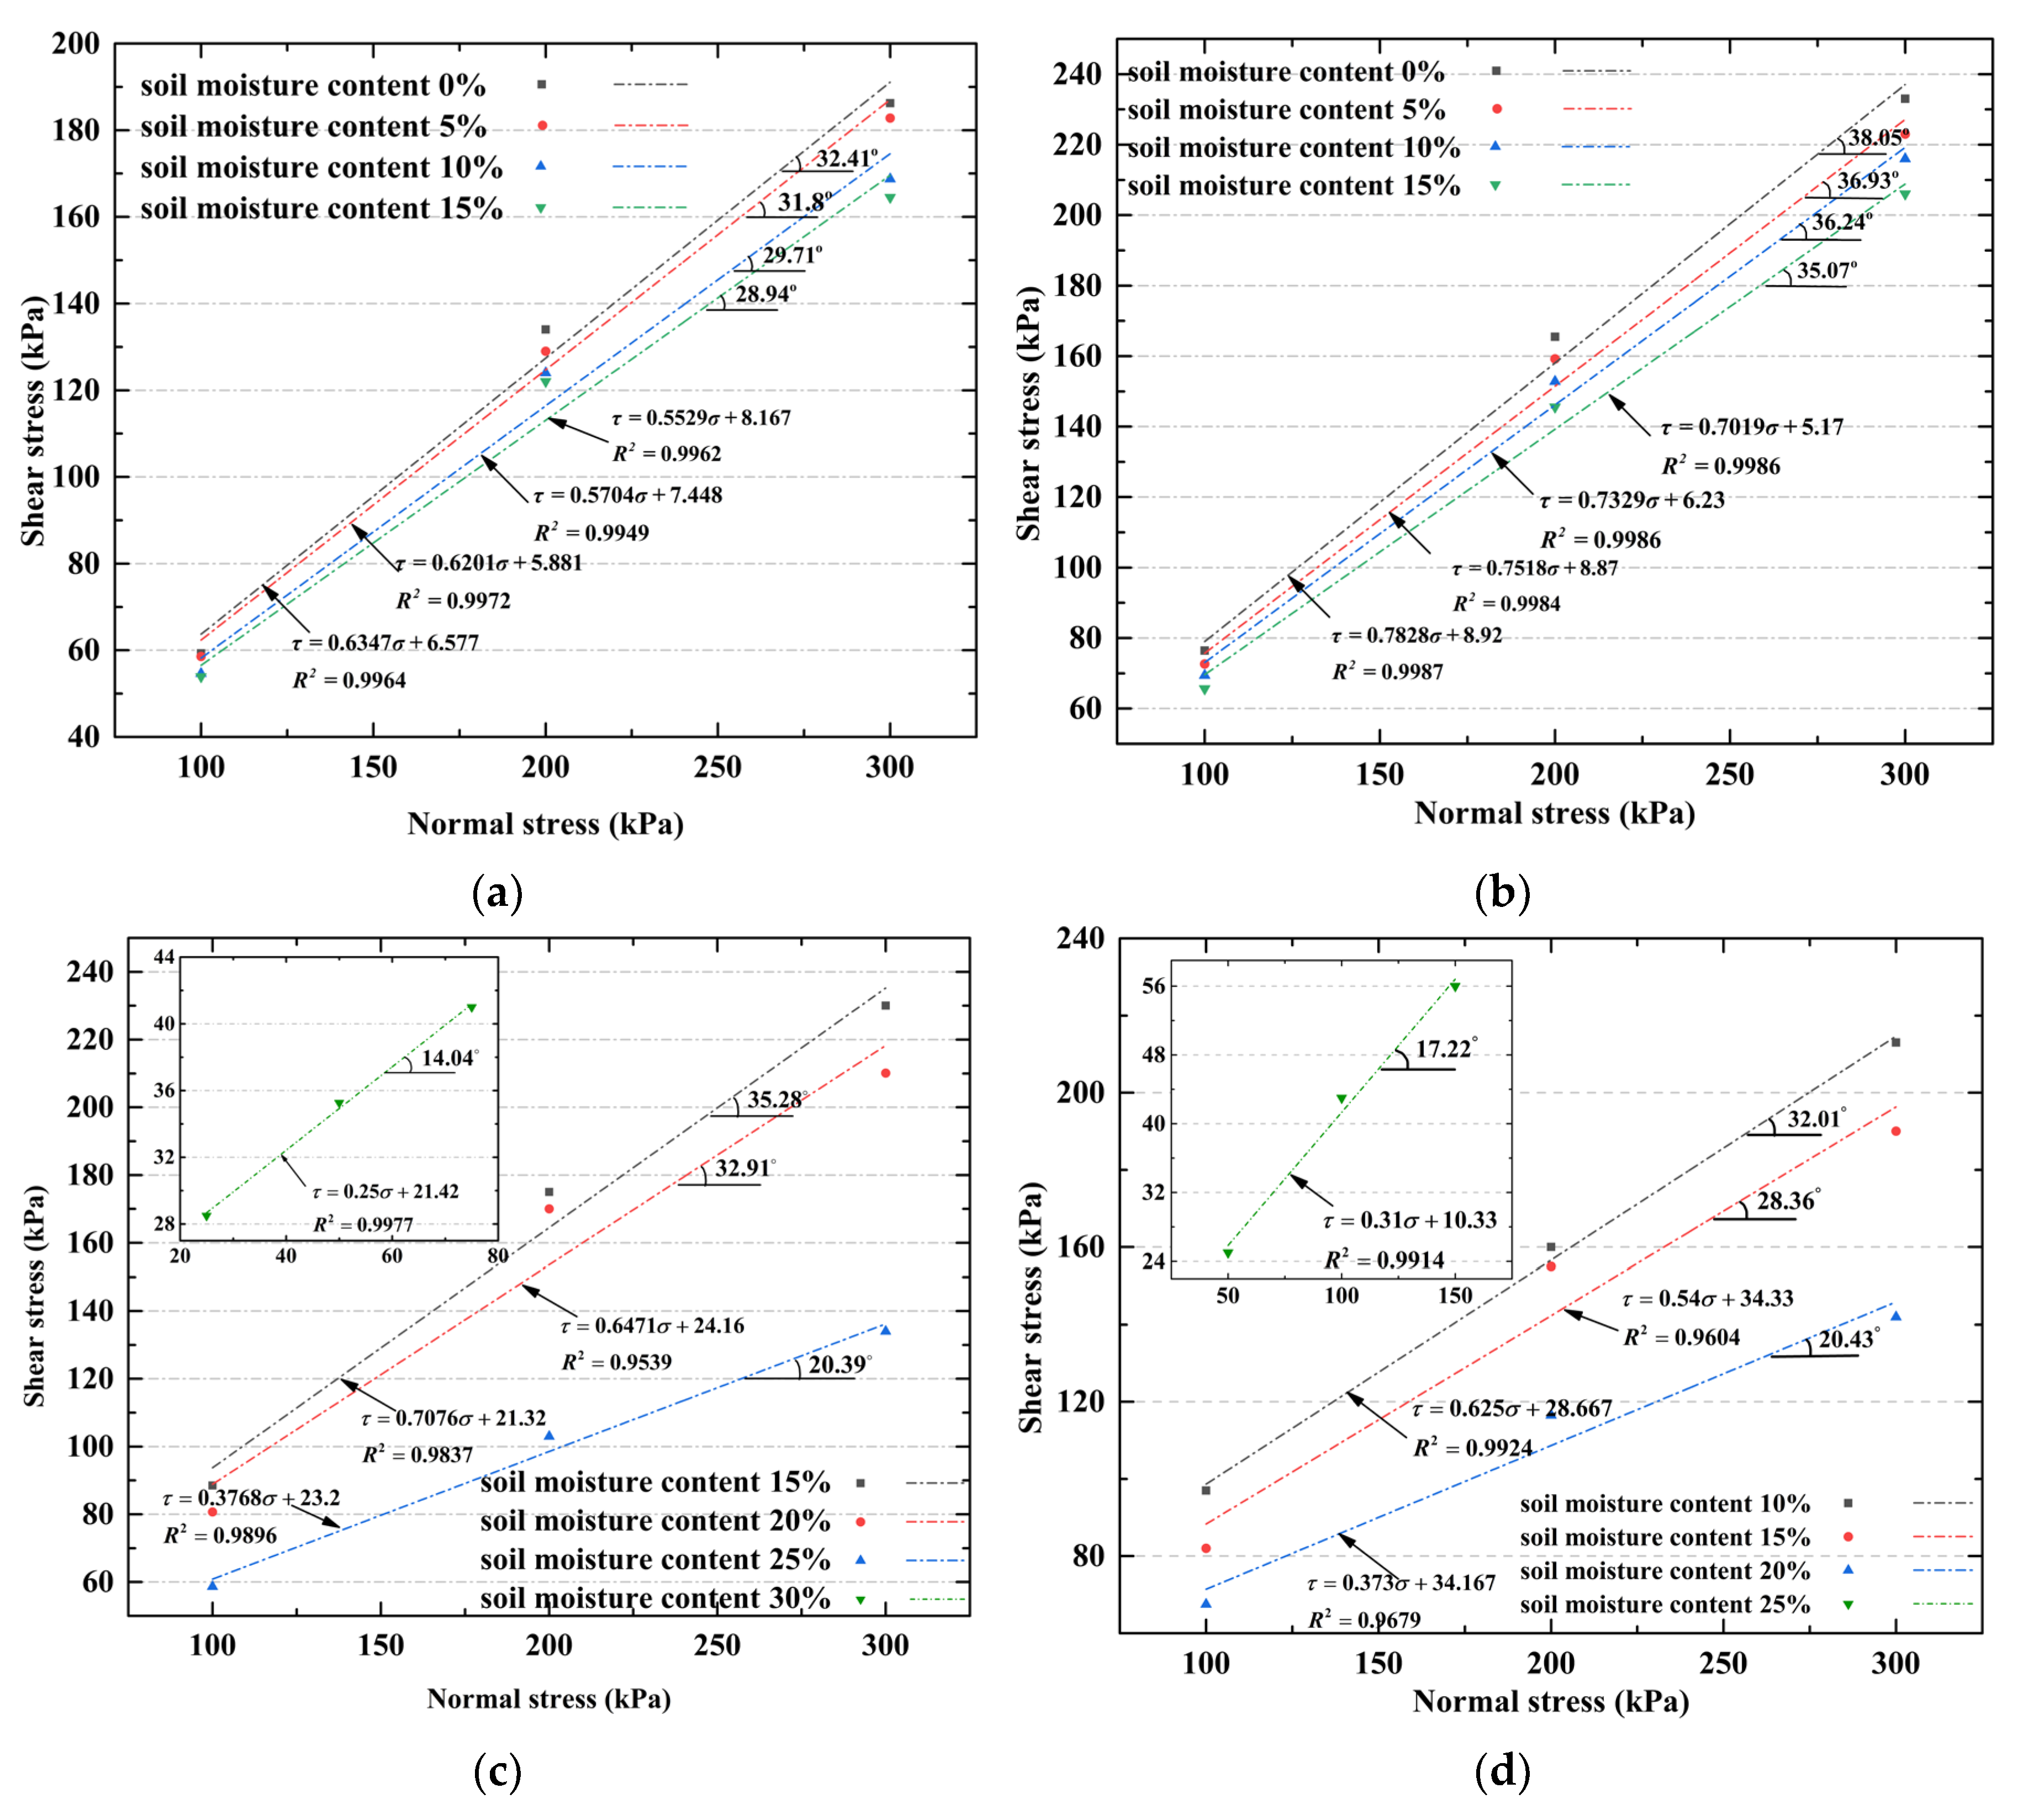
The relationship between the shear strength and the normal stress for the different soil–concrete interfaces was fitted (Figure 9) with the following equation:
where is the shear strength (kPa), is the normal stress (kPa), is the internal friction angle (°), and is the cohesion (kPa).
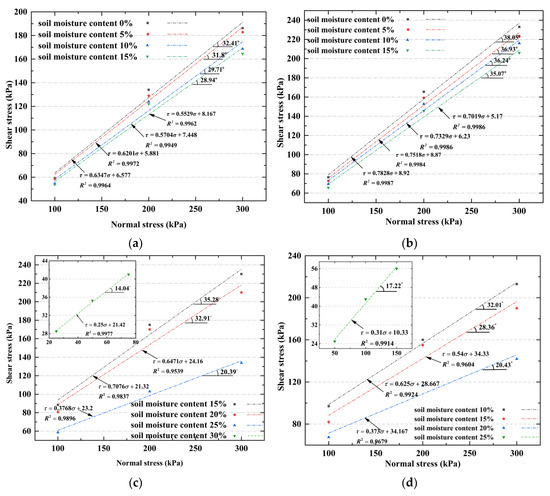
Figure 9.
Fitted shear strength curves for different interfaces: (a) silty sand, (b) medium-coarse sand, (c) clay, and (d) sandstone.
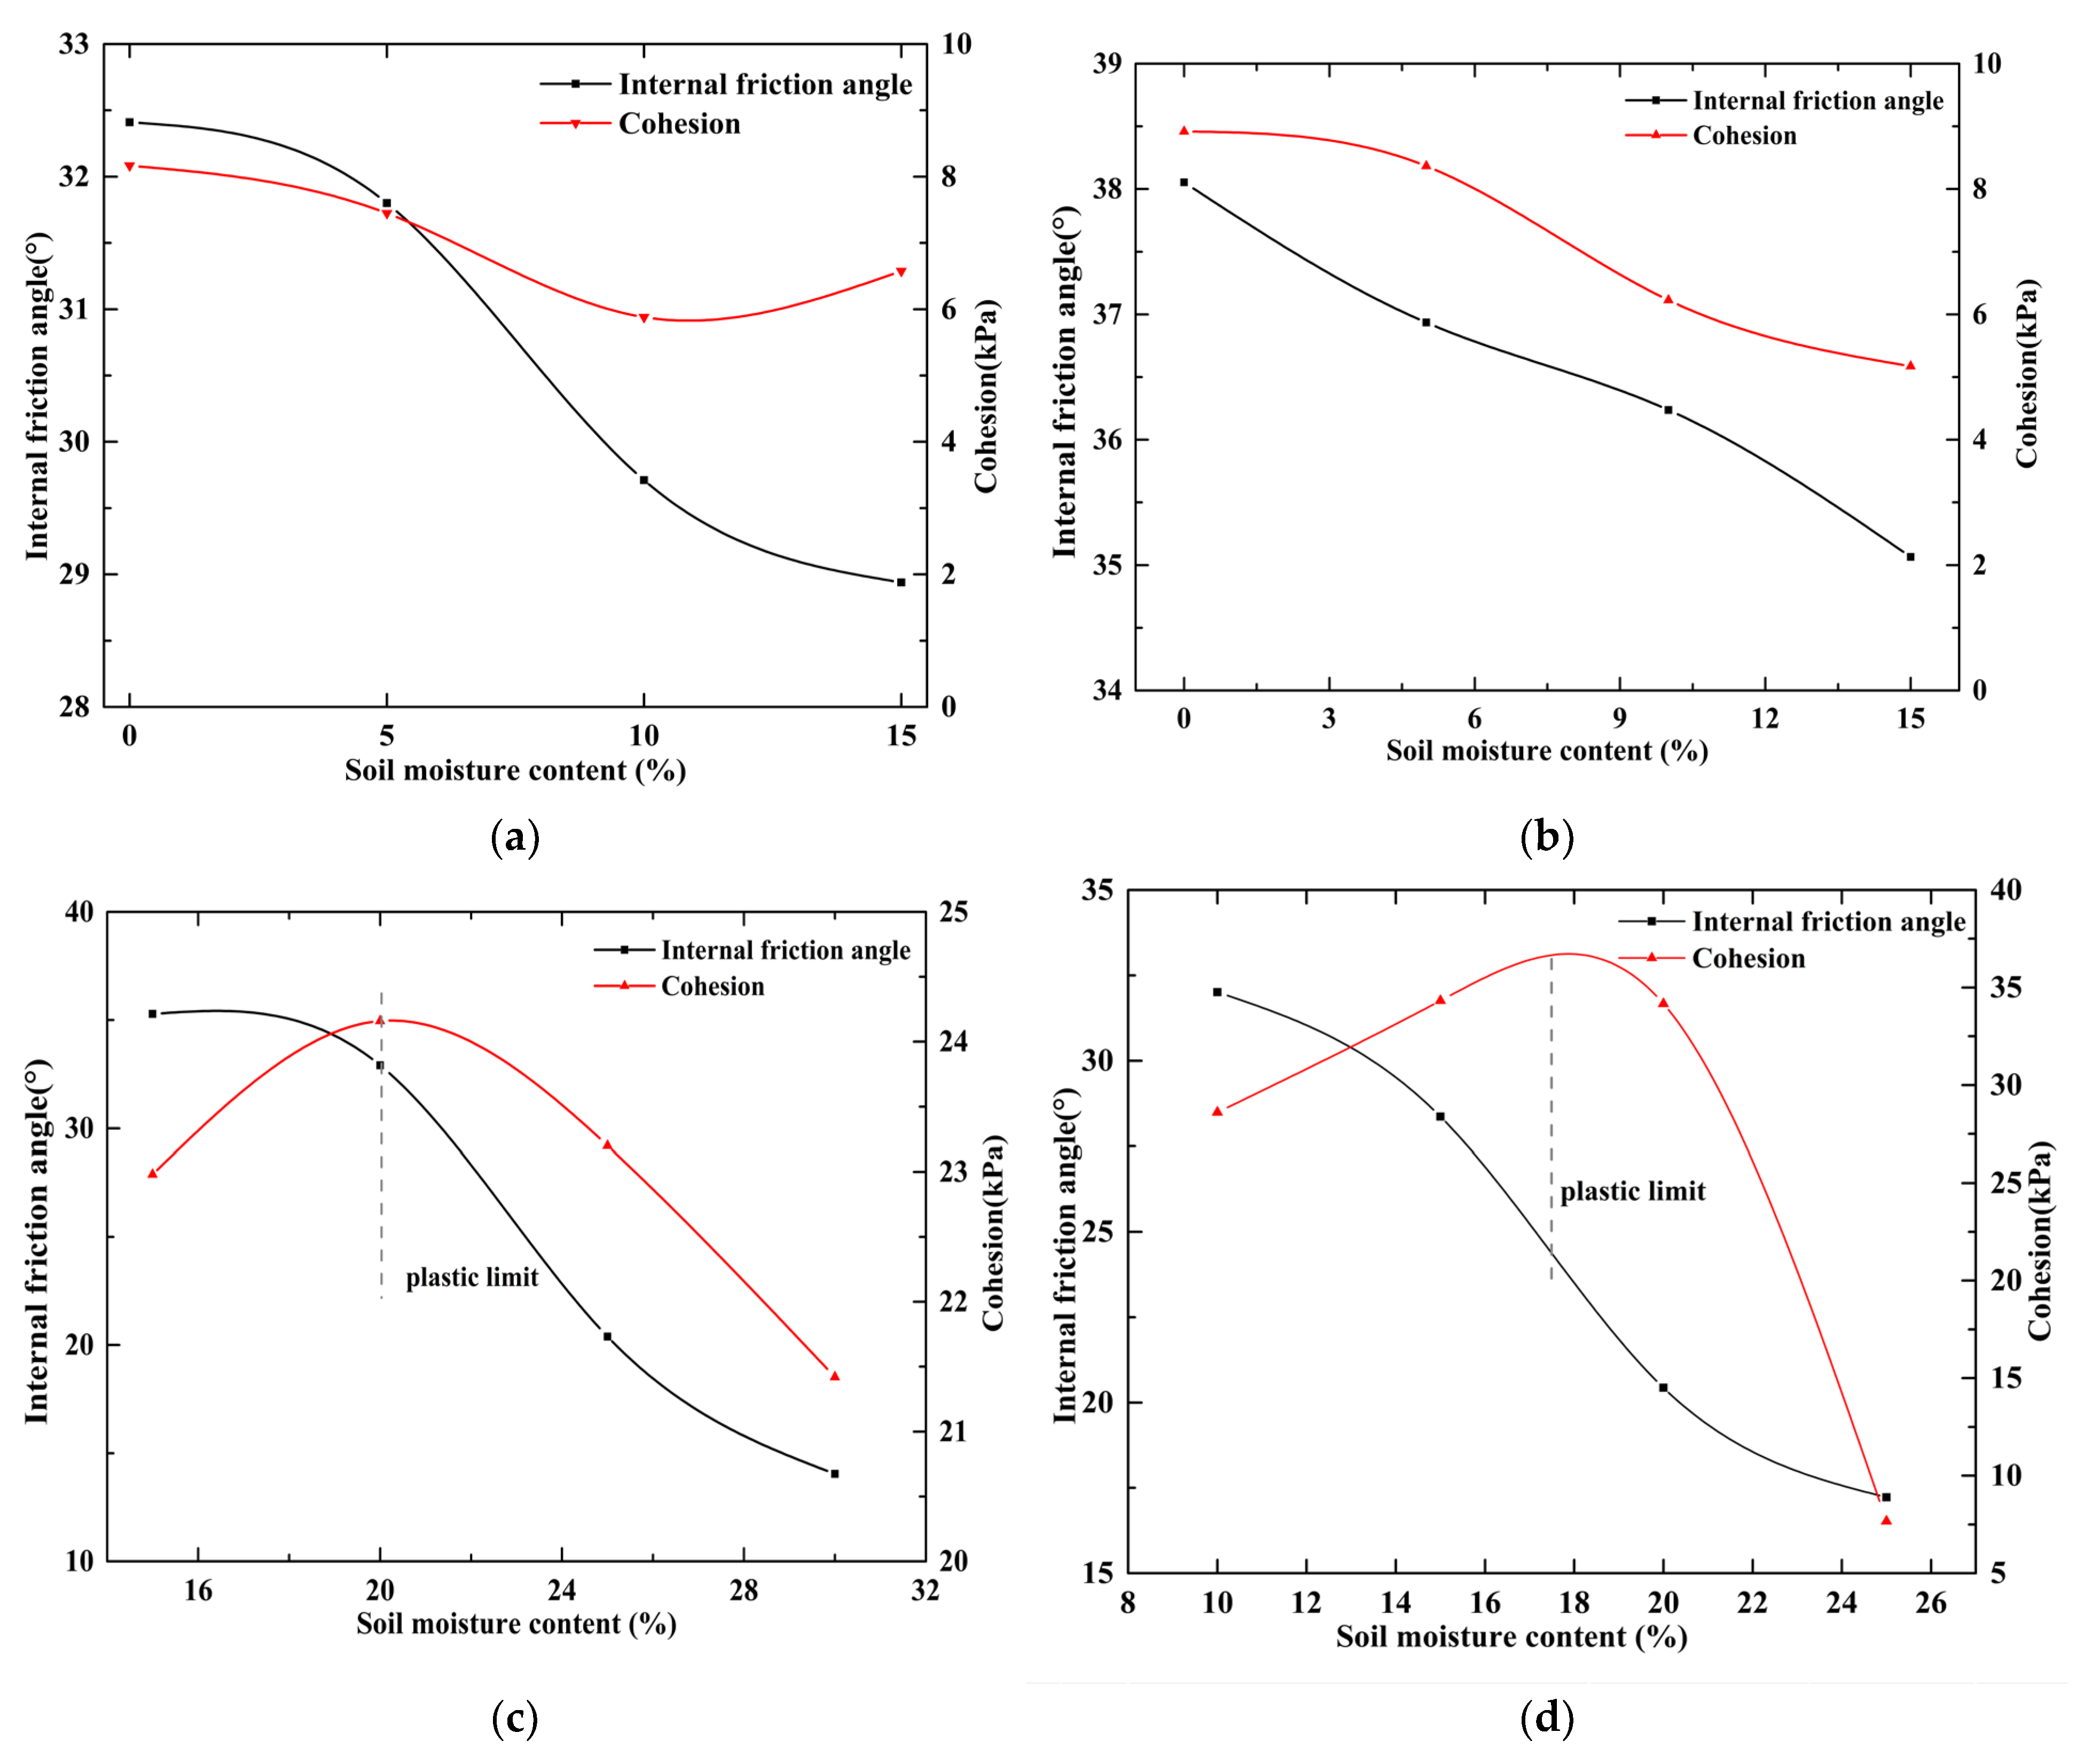
Figure 10 shows the variations of the internal friction angle and cohesion with the moisture content. With the increase in the moisture content, the internal friction angle of the soil–concrete interface showed a decreasing trend. The friction angles for the silty sand and the medium-coarse sand interfaces were in the ranges of 29–32° and 35–38°, respectively, and the friction angle was not greatly affected by the moisture content. For the clay and sandstone, the friction angles decreased rapidly with the increase in the moisture content, in the ranges of 14–35° and 8–34°, respectively. Moreover, the friction angle was significantly affected by the moisture contents of the clay and sandstone. Furthermore, the cohesion of the different soil–concrete interfaces showed different variation trends with the moisture content. The cohesion of silty sand and medium-coarse sand decreased with the increase in the moisture content, although the magnitude of the change was only about 2 kPa. As the moisture content increased, the cohesion of the clayey soil and the sandstone first increased and then decreased, and the moisture content corresponding to the maximum cohesion was near the plastic limit of the soil. This was because the adsorption of water in the soil gradually increased the cohesion. When the moisture content reached the plastic limit, the water film thickness between the soil particles increased, and the effect of the water pressure became greater than the adsorption effect. Thus, the cohesion began to decrease.
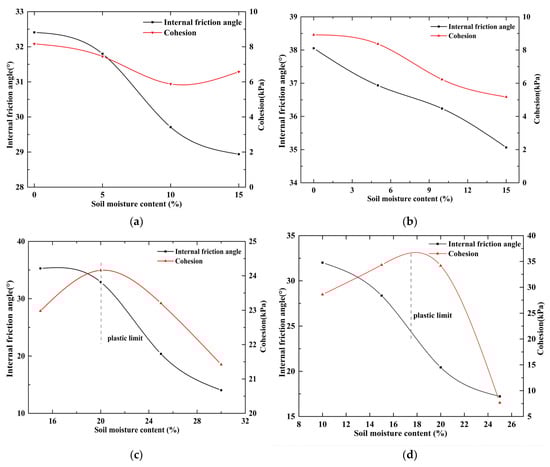
Figure 10.
Variation of shear strength parameters of different interfaces with soil moisture content: (a) silty sand, (b) medium-coarse sand, (c) clay, and (d) sandstone.
3.2. Shear Test of Filled Soil–Concrete Interface
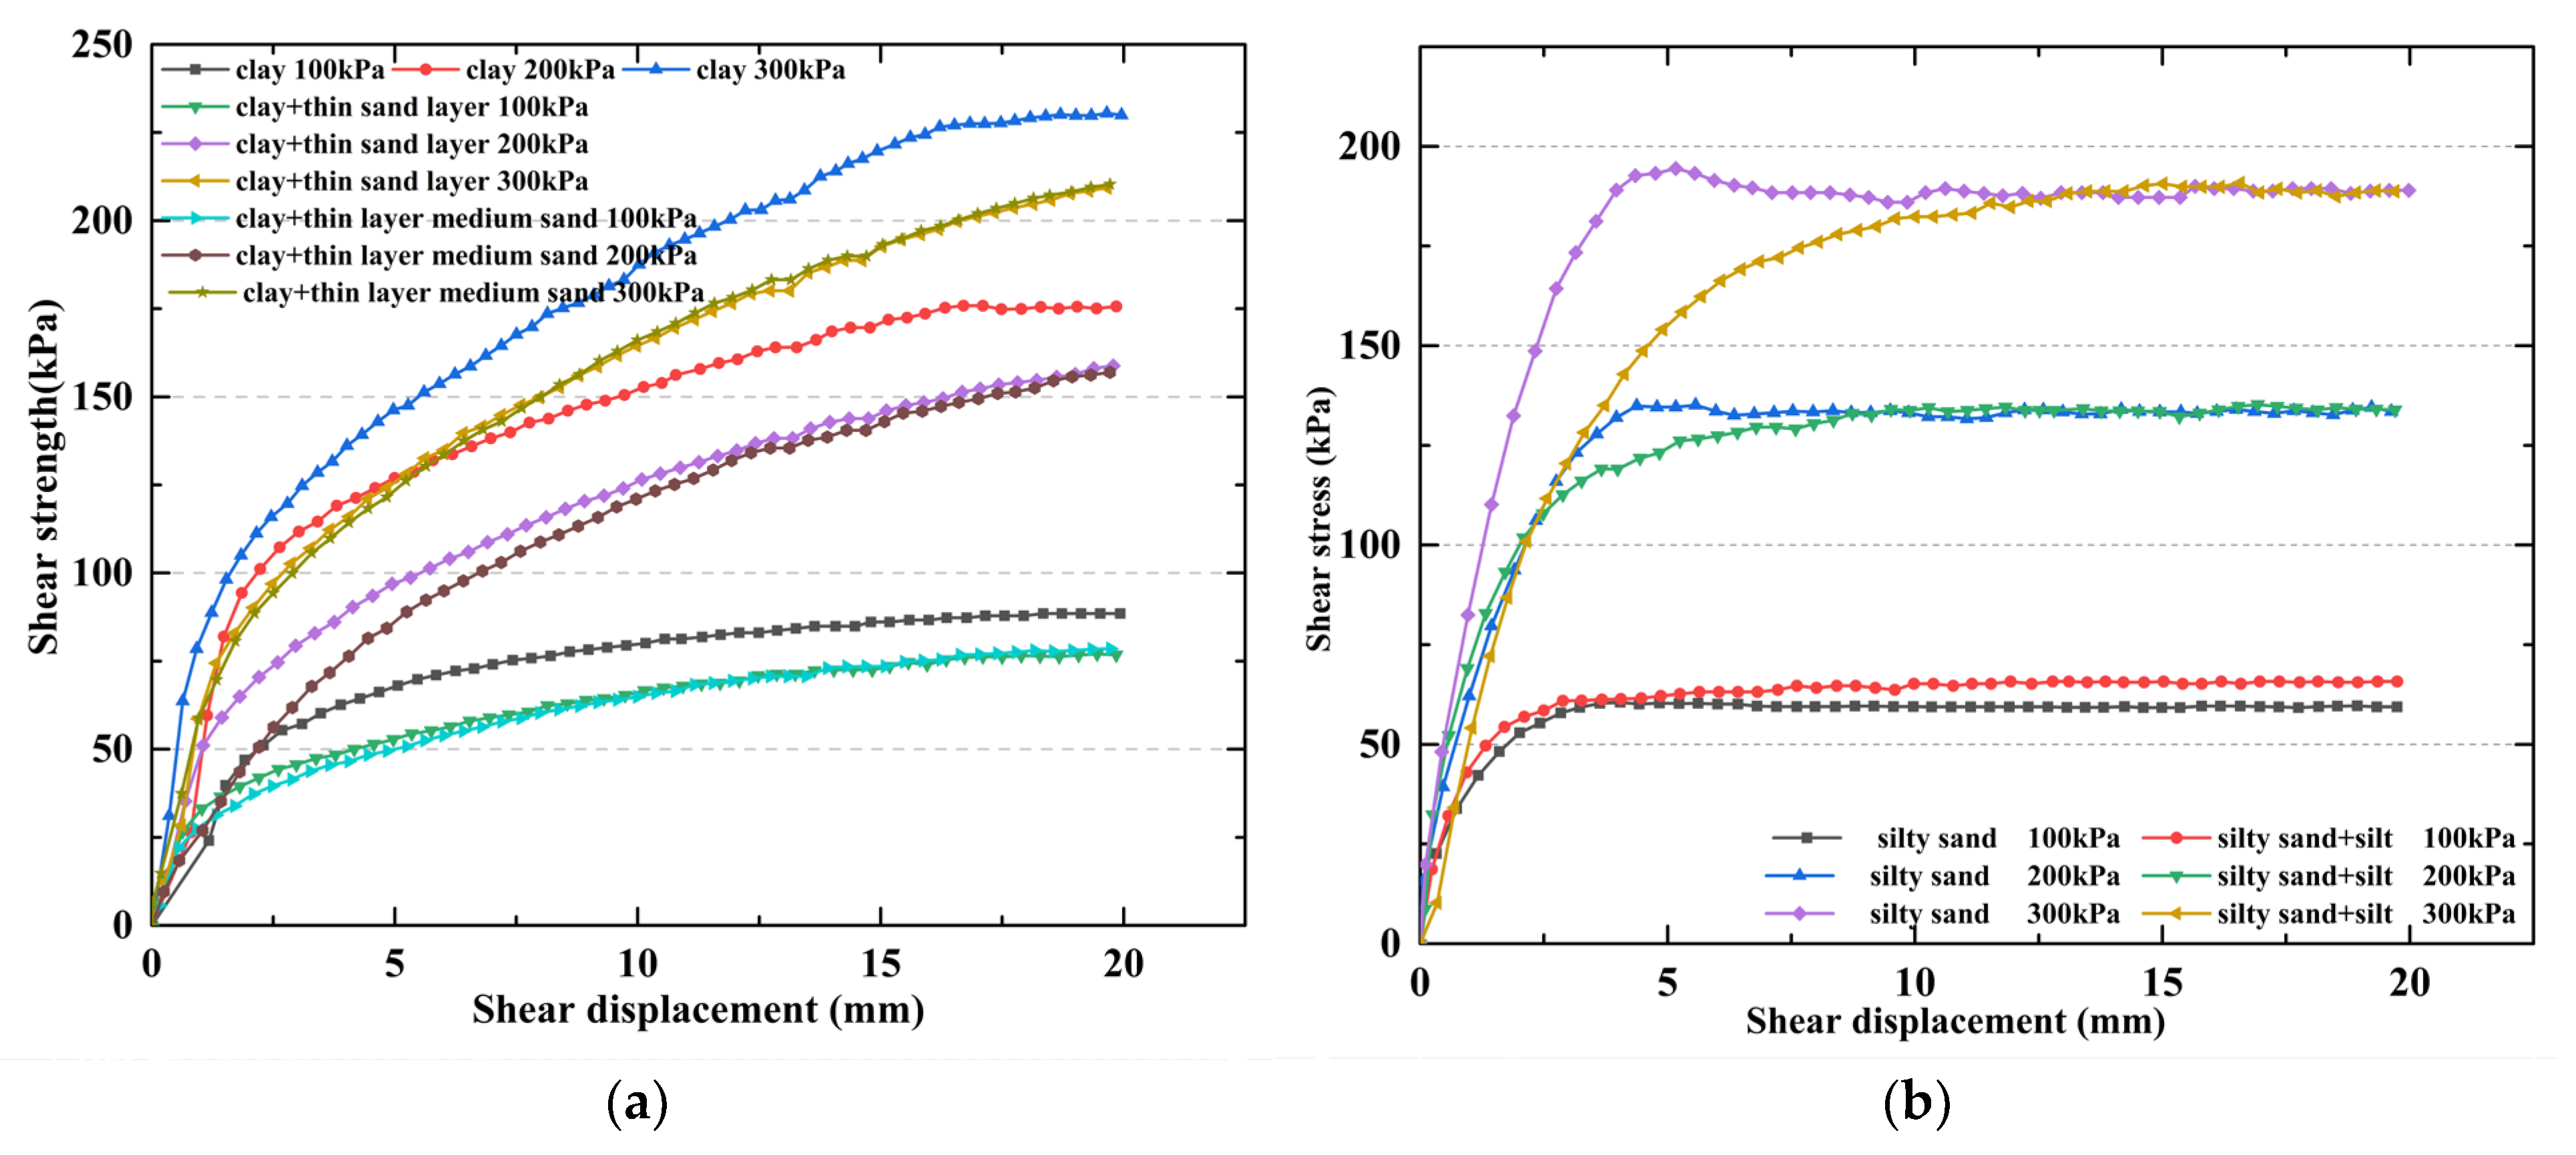
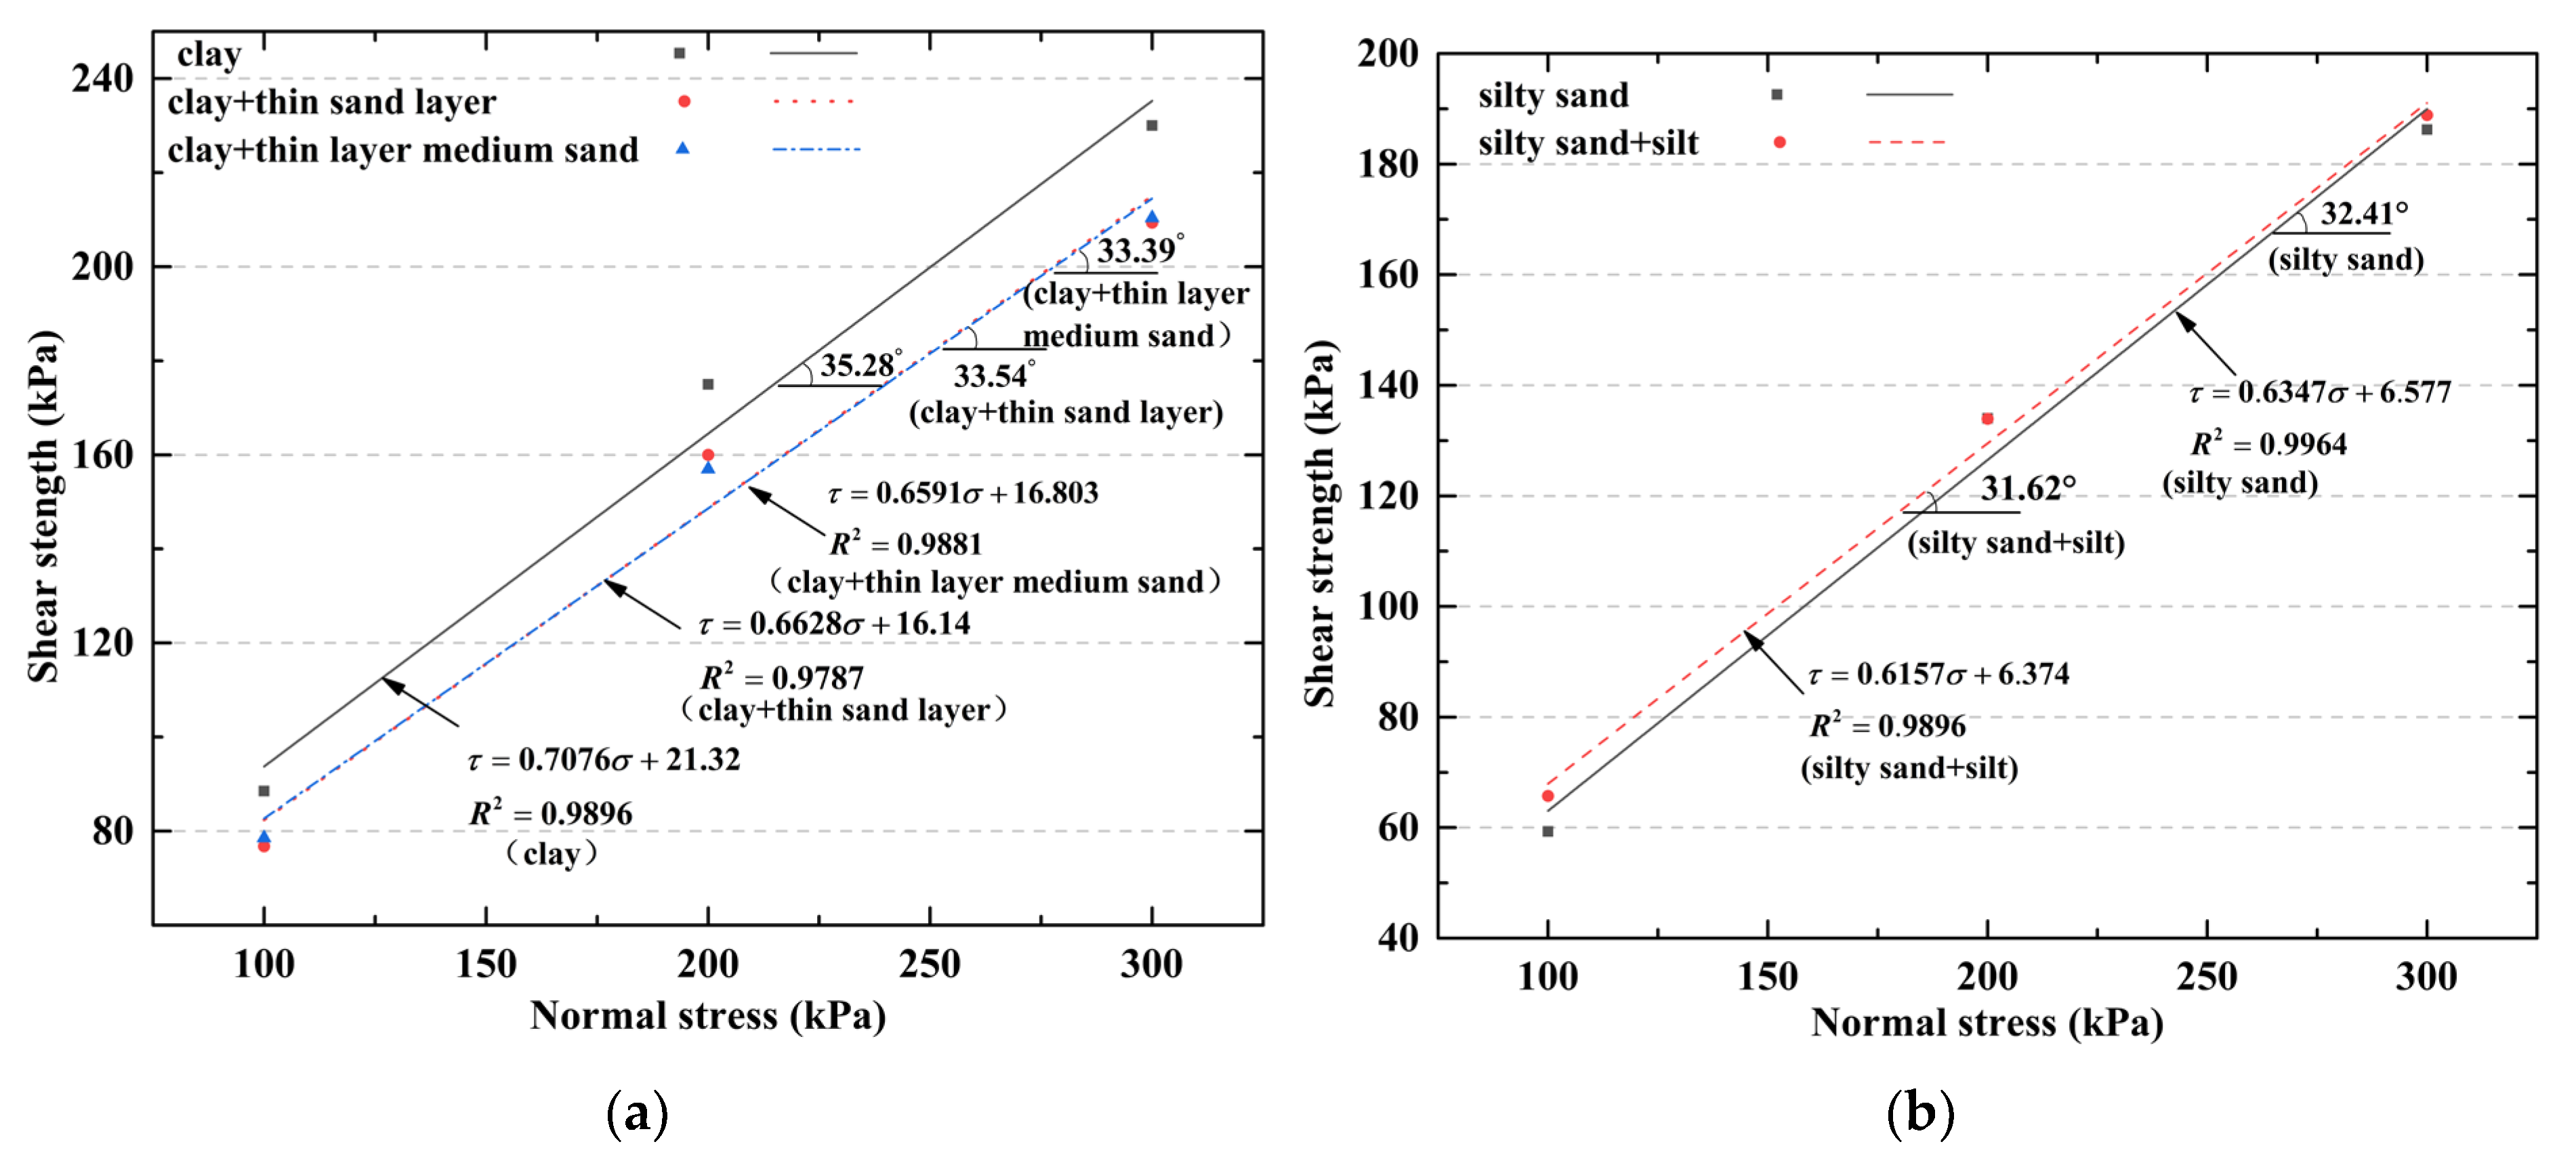
In order to study the influence of the filling materials on the shear characteristics of the soil–concrete interface, the soil–concrete interface was filled with 2 mm of medium-coarse sand or silty sand, and the silty sand–concrete interface was filled with 2 mm of silt. Figure 11 shows the variation of the shear stress with the shear displacement, and Figure 12 shows the variation of shear strength. Compared with the condition without filling materials, the shear stress of the concrete interface with a thin layer of sandy soil decreased slightly, indicating that the thin layer of sandy soil had the effect of reducing the shear strength of the interface. In terms of the strength parameters, the interfacial friction angle was 35.28° without filling material, which decreased to 33.39° and 33.54° after filling with thin layers of medium-coarse sand and silty sand, respectively. The cohesion without filling was 21.32 kPa, which changed to 16.14 and 16.803 kPa after filling with thin layers of medium-coarse sand and silty sand, respectively. The reduction in the friction angle and cohesion was mainly because the sliding friction on the soil–concrete interface was partially converted into rolling friction between the sand particles and the concrete, which reduced the friction coefficient. In addition, the sandy soil also played a certain role in reducing the adhesion of the clay to the concrete.
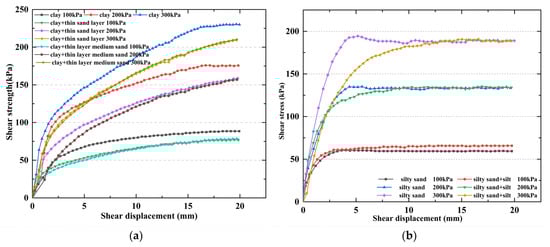
Figure 11.
Effect of filling material on shear characteristics of soil–concrete interface: (a) clay filled with sandy soil and (b) silty sand filled with silt.
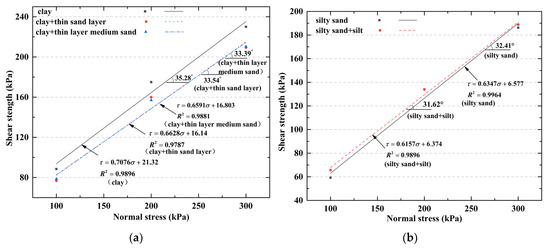
Figure 12.
Variation of shear strength for soil–concrete interfaces with different filling materials: (a) shear strength of clay–concrete interface before and after filling with sandy soil and (b) shear strength of silty sand–concrete interface before and after filling with silt.
Silt with a 50% moisture content was filled in the silty sand–concrete interface, and the variation of the shear stress with the shear deformation was basically the same as that of the unfilled interface. The interfacial friction angles were 32.41° and 31.62° before and after silt filling, respectively, and the corresponding interfacial cohesion values were 6.37 and 6.577 kPa. Thus, the friction angle decreased, whereas the cohesion increased. However, the effect on the overall shear strength of the interface was minimal. This was mainly because the silt increased the interfacial adhesion between the soil and the concrete, resulting in an increase in the interfacial cohesion. Moreover, the silt had a certain lubricating effect, and therefore, reduced the interfacial friction angle.
4. Conclusions
Through large-scale direct shear tests of the interface between the concrete and the various soil types (i.e., medium-coarse sand, silty sand, silt, and sandstone), the influences of the normal stress, moisture content, and interface filling materials on the shear strength of the soil–concrete interface were analyzed, and the following conclusions were obtained:
- (1)
- The shear stress of the soil–concrete interface increased initially and then stabilized with the increase in the shear displacement. Compared with the clayey soil, the sandy soil had a smaller shear displacement when the shear stress became stable. This was mainly because the sandy soil contained loose particles, which were more prone to redistribution than the flocculent structure of the clayey soil, and thus, the shear displacement of the sandy soil was smaller.
- (2)
- With a high normal stress, the soil pore water was discharged and formed a lubricating layer in the soil–concrete interface, resulting in a decrease in the friction coefficient of the interface. The friction coefficient between the medium-coarse sand and the concrete was greater than that of the silty sand–concrete interface. This was mainly because the gaps between the large particles and between the soil particles and concrete resulted in an embedding effect, thereby improving the interfacial friction coefficient.
- (3)
- The interfacial shear strength of the clayey soil, sandy soil, and concrete interfaces decreased with the increase in the soil moisture content. Compared with the clayey soil–concrete interface, the shear strength of the sandy soil–concrete interface was less sensitive to the moisture content. The friction angle and cohesion of the sandy soil–concrete interface decreased with the increase in the moisture content; yet, the decrease magnitude was small. The friction angle of the clayey soil–concrete interface decreased rapidly with the increase in the soil moisture content, whereas the cohesion first increased and then decreased, and the peak cohesion was seen when the moisture content was near the plastic limit.
- (4)
- For a given moisture content, filling the clay–concrete interface with a thin layer of sandy soil led to a reduction in the friction angle and the cohesion of the soil–concrete interface. Filling the silty sand–concrete interface with a thin layer of silt resulted in a decrease in the friction angle of the soil–concrete interface and an increase in the cohesion. However, the filling had little effect on the overall shear strength of the interface. In this study, the number of tests of the effects of interfacial fillings on the shear strength was limited. Further studies are needed to investigate the influences of the moisture content, filling material, and filling thickness on the shear parameters of different soil–concrete interfaces.
Author Contributions
Conceptualization, D.L. and C.S.; methodology, D.L.; validation, D.L., H.R. and B.L.; formal analysis, D.L.; investigation, C.S.; resources, D.L.; data curation, D.L.; writing—original draft preparation, D.L.; writing—review and editing, D.L.; visualization, H.R.; supervision, H.R.; project administration, D.L.; funding acquisition, C.S. All authors have read and agreed to the published version of the manuscript.
Funding
This work was supported by the National Natural Science Foundation of China (Grant No. 41,831,278 and Grant No. 51679071).
Institutional Review Board Statement
Not applicable.
Informed Consent Statement
Informed consent was obtained from all subjects involved in the study.
Data Availability Statement
Not applicable.
Acknowledgments
We would also like to thank Xutao Zeng for editing the manuscript.
Conflicts of Interest
The authors declare no conflict of interest.
References
- Konkol, J.; Mikina, K. Some aspects of shear behavior of soft soil–concrete interfaces and its consequences in pile shaft friction modeling. Materials 2021, 14, 2578. [Google Scholar] [CrossRef] [PubMed]
- Abdulghader, A.A.; Mohammad, T.R. Pile-soil interface characteristics in ice-poor frozen ground under varying exposure temperature. Cold Reg. Sci. Technol. 2021, 191, 103377. [Google Scholar] [CrossRef]
- Johnson, K.; Karunasena, W.; Sivakugan, N.; Guazzo, A. Modeling pile-soil interaction using contact surfaces. In Computational Mechanics—New Frontiers for the New Millennium; Elsevier: Amsterdam, The Netherlands, 2001; pp. 375–380. [Google Scholar]
- Yin, K.; Liu, J.; Vasilescu, A.R.; Di Filippo, E.; Othmani, K. A procedure to prepare sand–clay mixture samples for soil-structure interface direct shear tests. Appl. Sci. 2021, 11, 5337. [Google Scholar] [CrossRef]
- Canakci, H.; Hamed, M.; Celik, F.; Sidik, W.; Eviz, F. Friction characteristics of organic soil with construction materials. Soils Found. 2016, 56, 965–972. [Google Scholar] [CrossRef]
- Ilori, A.O.; Udoh, N.E.; Umenge, J.I. Determination of soil shear properties on a soil to concrete interface using a direct shear box apparatus. Int. J. Geo-Eng. 2017, 8, 17. [Google Scholar] [CrossRef]
- Shakir, R.R.; Zhu, J.-G. Mechanical behavior of soil and concrete interface. In Proceedings of SPIE—The International Society for Optical Engineering; Elsevier B.V: Amsterdam, The Netherlands, 2008; Volume 7353, pp. 1543–1550. [Google Scholar] [CrossRef]
- Muszyński, Z.; Wyjadłowski, M. Assessment of the shear strength of pile-to-soil interfaces based on pile surface topography using laser scanning. Sensors 2019, 19, 1012. [Google Scholar] [CrossRef] [PubMed]
- Cen, W.J.; Wang, H.; Du, X.H.; Sun, Y.J. Experimental evaluation on cyclic shear behavior of geomembrane–concrete interfaces. J. Test. Eval. 2020, 48, 3561–3578. [Google Scholar] [CrossRef]
- Yin, K.; Vasilescu, R.; Fauchille, A.-L.; Kotronis, P. Thermal effects on the mechanical behavior of Paris green clay-concrete interface. In E3S Web of Conferences; EDP Sciences: Les Ulis, France, 2020; p. 13006. [Google Scholar] [CrossRef]
- Ravera, E.; Laloui, L. Failure mechanism of fine-grained soil-structure interface for energy piles. Soils Found. 2022, 62, 101152. [Google Scholar] [CrossRef]
- Casagrande, B.; Saboy, F.; Tiban, S.; McCartney, J.S. Mechanical response of a thermal micro-pile installed in stratified sedimentary soil. In E3S Web of Conferences; EDP Sciences: Les Ulis, France, 2020; Volume 205, p. 05007. [Google Scholar] [CrossRef]
- Wang, P.; Yin, Z.; Zhou, W.; Chen, W. Micro-mechanical analysis of soil–structure interface behavior under constant normal stiffness condition with DEM. Acta Geotech. 2022, 17, 2711–2733. [Google Scholar] [CrossRef]
- Liu, T.; Chen, H.; Buckley, R.M.; Quinteros, V.S.; Jardine, R.J. Characterisation of sand-steel interface shearing behaviour for the interpretation of driven pile behaviour in sands. In E3S Web of Conferences; EDP Sciences: Les Ulis, France, 2019; Volume 92, p. 13001. [Google Scholar] [CrossRef]


Publisher’s Note: MDPI stays neutral with regard to jurisdictional claims in published maps and institutional affiliations. |
© 2022 by the authors. Licensee MDPI, Basel, Switzerland. This article is an open access article distributed under the terms and conditions of the Creative Commons Attribution (CC BY) license (https://creativecommons.org/licenses/by/4.0/).