Article

Energy Generation and Attenuation of Blast-Induced Seismic Waves under In Situ Stress Conditions

1
State Key Laboratory of Precision Blasting, Jianghan University, Wuhan 430056, China
2
Hubei Key Laboratory of Blasting Engineering, Jianghan University, Wuhan 430056, China
3
School of Infrastructure Engineering, Nanchang University, Nanchang 330031, China
*
Authors to whom correspondence should be addressed.
Appl. Sci. 2022, 12(18), 9146; https://doi.org/10.3390/app12189146
Submission received: 3 August 2022 / Revised: 3 September 2022 / Accepted: 9 September 2022 / Published: 12 September 2022
(This article belongs to the Section Civil Engineering)

Abstract

:
During blasting in deep mining and excavation, the rock masses usually suffer from high in situ stress. The initial seismic energy generated in deep rock blasting and its attenuation with distance is first theoretically analyzed in this study. Numerical modeling of the multiple-hole blasting in a circular tunnel excavation under varied in situ stress conditions is then conducted to investigate the influences of in situ stress levels and anisotropy on the blasting seismic energy generation and attenuation. The case study of the deep rock blasting in the China Jinping Underground Laboratory (CJPL) is finally presented to demonstrate the seismic energy attenuation laws under varied in situ stress levels. The results show that with the increase in the in situ stress level, the explosive energy consumed in the rock fracture is reduced, and more explosive energy is converted into seismic energy. The increasing in situ stress causes the seismic Q of the rock mass medium to first increase and then decrease, and consequently, the seismic energy attenuation rate first decreases and then increases. Compared to the condition without in situ stress, the blasting seismic energy decays more slowly with distance under in situ stress. Then the seismic waves generated in deep rock blasting are more likely to reach and exceed the peak particle velocity (PPV) limits stipulated in the blasting vibration standards. Under non-hydrostatic in situ stress, the generation and attenuation of the blasting seismic energy are anisotropic. The highest seismic energy density is generated in the rock mass in the minimum principal stress orientation. Its attenuation is dependent upon the in situ stress aligning the wave propagation orientation.

1. Introduction

In mining and civil industries, more and more underground caverns are being excavated in deep rock masses. It is well known that the rock masses in deep depths are generally subjected to high in situ stress caused by gravity and tectonic movements. For example, the Mponeng gold mine in South Africa has entered a depth of 4350 m [1]. The maximum principal in situ stress at this depth reaches 140 MP [2]. The Bayu tunnel of the Sichuan-Tibet railway in China is excavated with a maximum depth of 2080 m. The measured maximum principal stress approaches 50 MPa [3]. At present, the drilling and blasting method is widely used in deep mining and civil construction for rock fragmentation and removal due to its economy and applicability. During rock blasting, a small fraction of explosive energy is consumed in rock fragmentation and removal. Most of the explosive energy is dissipated in undesired forms, such as seismic waves, air shock waves, noise, light, and heat [4]. In these undesired effects, the seismic waves generated in rock blasting are of greatest concern because they can induce damage and destruction of surrounding structures.
In order to prevent structure damage and destruction caused by blasting seismic waves, systematic and intensive studies have been carried out on the generation and propagation of blasting seismic waves. A large number of research achievements have been made in seismic mechanisms, propagation laws, attenuation characteristics, and interactions with structures. It has been confirmed that different types of seismic waves are generated in rock blasting, including compressional P-waves, transverse S-waves, Love waves, and Rayleigh waves [5]. Gutowski and Dym [6] investigated the energy composition of blasting seismic waves and claimed that most of the energy (about 67%) was carried by Rayleigh waves. The theoretical and experimental studies conducted by many authors have shown that the generation of blasting seismic waves depends mainly on explosive properties, charge weights, charge structures, blasthole geometry, stemming conditions, free surfaces, and delay initiation sequences [7,8,9,10,11]. The attenuation of blasting seismic waves has also been demonstrated to be complicated, governed not only by site geology, topography, and travel distance but also by rock discontinuities such as faults, voids, and joints [12,13,14]. It is generally accepted that the structure responses under blasting seismic waves are dependent upon the vibration PPV and frequency. For dynamic safety assessments of the structures, some thumb-rule formulas were proposed by different authors to predict the PPV and dominant frequency of blasting seismic waves [15,16]. In recent years, various machine learning methods have been introduced into the prediction, in which more influencing factors are taken into account [17]. It should be noted that in addition to rock blasting, the internal explosions inside underground caverns, such as terrorist attack explosions and fuel tanker explosions, can also produce seismic waves and cause structure damage and destruction [18,19]. In this regard, Zaid and Shah [20], Zaid and Sadique [21], and Zaid et al. [22,23,24] systematically studied the rock tunnel responses caused by internal explosions under varied rock types, rock strengths, overburden depths, tunnel shapes, tunnel sizes, lining thicknesses and explosive weights. Their research results provide great insights into the blast-resistant design of subway tunnels. However, these previous studies often focus on blasting in shallow rock masses, in which the effects of in situ stress are smaller or can be ignored.
Compared with shallow rock blasting, the generation and propagation of blasting seismic waves in deep or highly stressed rock masses receive much less attention. In this respect, Yang et al. [25] numerically simulated the single-hole blasting under varied hydrostatic and non-hydrostatic in situ stress conditions. Their numerical results show that the vibration frequency of blasting seismic waves becomes higher as the in situ stress exerted on the tock mass increases. Focusing on structural discontinuities in actual rock masses, Fan and Sun [26], Liu et al. [27], and Li et al. [28] investigated the seismic wave propagation in a stressed rock mass with a single joint by using theoretical methods. It is found that the seismic wave attenuation across the joint is dependent not only on the stress level and lateral coefficient but also on the incident wave direction. Dong et al. [29] and Zhu et al. [30] carried out numerical studies on stress wave propagation in stressed rock masses with multiple joints. They find that the stress wave attenuation across the joints also relies on the number and spacing of the joints, as well as the amplitude and frequency of the incident waves. The wave propagation in the jointed rock mass is susceptible to the variation of joints when the preloaded stress is lower. However, with an increase in the initial stress, the influences of the joint variation on the stress wave propagation gradually diminish. Dong et al. [31] also carried out related experimental research. The results indicate that the transmission of incident waves across the joints first increases and then decreases as the initial stress increases from zero. In addition, Zhang et al. [32] experimentally investigated the blast-induced dynamic strain field in stressed sandstone specimens. They observe that the increase rate of the blasting strain is inhibited by the compressive strain due to the initial stress.
The above studies show that during blasting in deep or stressed rock masses, the generation and propagation of blasting seismic waves are affected by in situ stress. However, the current studies in this regard are mainly concerned with the seismic wave amplitude and its attenuation with distance or across joints. However, there are few pieces of research reported on the initial seismic energy generated in deep rock blasting and its attenuation under different in situ stress conditions, especially for multiple-hole blasting. In fact, this is an important issue because it involves energy distribution and energy efficiency of deep rock blasting.
In this study, the seismic energy generated in deep rock blasting and its attenuation with distance is theoretically analyzed first to reveal the effect mechanisms of in situ stress on blasting seismic energy. Numerical simulations of multiple-hole blasting for a circular excavation under hydrostatic and non-hydrostatic in situ stresses are then conducted with the coupled smoothed particle hydrodynamics (SPH) and finite element method (FEM). According to the simulated results, the effects of in situ stress levels and anisotropy on the initial blasting seismic energy are investigated. Furthermore, the seismic energy attenuations under varied in situ stress conditions are analyzed. Finally, a case study in which the blasting vibration monitoring was carried out in the rock masses with different in situ stress levels is presented to verify the theoretical and numerical results.

2. Theoretical Analysis of Blasting Seismic Energy Generation and Attenuation under In Situ Stress

2.1. Seismic Energy Generated in Rock Blasting under In Situ Stress

According to thermodynamics theory, the explosive energy released in rock blasting is converted into heat and work on the surrounding rock. The work can be divided into several components as follows: (a) fracture energy Ef that creates rock fragments, (b) kinetic energy Ek that translates and rotates rock fragments to form muckpiles, (c) seismic energy Es that propagates as elastic seismic waves, and (d) the other energy Eo that produces internal cracks within rock fragments, gas ejection, rock plastic deformation, heating rock, and other uncounted forms. The energy distribution of rock blasting mentioned above is mathematically expressed as [33]:
E e = E f + E k + E s + E o
where Ee is the explosive energy. It is the product of the explosive mass Qe and the specific heat of the explosion We:
E e = Q e W e
During blasting in an infinite rock medium, a crushed (extensively fractured) zone and a cracked (partially fractured) zone, which are collectively referred to as a fractured zone, is created around the blasthole wall. Outside the fractured zone, the energy of explosion-induced stress waves is not enough to directly cause the rock medium to crack. The stress waves spreading in this zone are elastic seismic waves. Therefore, the outer boundary of the fractured zone is generally defined as the elastic boundary. Related experimental and numerical results show that the radius of the elastic boundary varies between 10 and 100 times the blasthole radius, depending on explosive properties, in situ stress conditions, blasthole diameters, coupling mediums, rock discontinuities, etc. [34]. Then the seismic energy is the energy carried by the elastic seismic waves that spread outside the fractured zone. Consequently, the initial seismic energy generated in rock blasting without attenuation is calculated as the integral of the energy flow across the elastic boundary:
E s 0 = s t Φ n d t d s
where Es0 represents the initial seismic energy on the elastic boundary, Φ represents the seismic energy flux, n denotes the normal external vector of the elastic boundary, s denotes the elastic boundary area, t is the time. The energy flux Φ is obtained from the scalar product of the stress vector σ and the velocity vector v on the elastic boundary:
Φ = σ v
If the blast-induced seismic waves are considered spherical waves, the initial seismic energy in Equation (3) can be written as the function of particle velocity components:
E s 0 = 4 π r f 2 ρ [ c p 0 v 1 2 d t + c s 0 ( v 2 2 + v 3 2 ) d t ]
where rf is the fractured zone radius, ρ is the rock density, cp is the velocity of P-waves traveling in the rock, cs is the velocity of S-waves spreading in the rock, and v1, v2, and v3 are the radial, transverse, and vertical velocity components on the elastic boundary.
With regard to cylindrical wave propagation in a plane, the initial seismic energy on the elastic boundary is:
E s 0 = 2 π r f ρ ( c p 0 v 1 2 d t + c s 0 v 2 2 d t )
The ratio of the initial seismic energy on the elastic boundary to the total explosive energy is defined as the blasting seismic efficiency η [35],
η = E s 0 / E e
A series of measurements show that the seismic efficiency η is in the range of 1–12% [33]. This is a small percentage. However, this energy has the most extensive impact on the blasting site. Therefore, the seismic efficiency of blasting attracts considerable attention, and many control methods are proposed to minimize blast-induced seismic waves. From Equations (1)–(7), it is seen that the seismic energy generated in rock blasting depends not only on the weight and properties of the used explosive (Qe and We) but also on the rock properties (ρ, cp, and cs) and the size of the elastic boundary (rf). For rock blasting in deep depths, many experimental and numerical results have demonstrated that the presence of in situ stress would affect the acoustic velocity in the rock medium and the size and shape of the fractured zone. Jiang et al. [36] reported that the wave velocity along the specimen axis is positively related to the confining pressure. Wang et al. [37] further pointed out that the longitudinal wave velocity of the specimen increases with confining pressure only at the pre-peak phase of the stress-strain relationship. The experimental results of Asef and Najibi [38] reveal that the longitudinal and transverse wave velocities of the limestone core specimens exponentially increase with confining pressure below a critical value. However, beyond the critical confining pressure, the increasing trend in the wave velocities becomes linear. In addition, some researches show that in a specimen with preload compressive stress, the blast-induced fractured zone gradually shrinks as the compressive stress increases, and the major cracks align the loading direction of the compressive stress [39,40,41,42]. From the above analysis, it can be seen that for blasting in stressed rock masses, the change of the acoustic velocity and the fractured zone will inevitably affect the energy conversion from explosive energy to seismic energy.

2.2. Seismic Energy Attenuation

The seismic energy on the elastic boundary calculated from Equation (3) is the initial seismic energy generated in rock blasting. As the seismic waves spread outward from the elastic boundary, the energy carried by the seismic waves gradually decreases, which is called seismic energy attenuation. It is well known that the geophysical laws of seismic wave attenuation include viscoelastic attenuation and attenuation due to geometric spreading. The seismic wave attenuation due to geometric spreading depends on the wave propagation distance. The viscoelastic attenuation is generally described by the seismic Q, and a greater Q value represents less energy attenuation. Many studies have shown that the seismic Q varies with rock types, water content, porosity, temperature, and stress states of rock masses [43]. The experimental data in Johnston and Toksöz [44] show that the seismic Q increases with the pressure exerted on the rock masses, and the increase rate depends upon the rock types and distribution of rock discontinuities. Somogyiné Molnár et al. [45] found that the seismic Q increases rapidly with pressure at lower pressure levels but tends to be constant after the pressure reaches a higher level. Yang et al. [25] further pointed out that the seismic Q would decline with pressure when the pressure is high enough to cause rock discontinuities to extend. For rock blasting in deep depths, the seismic Q varies with in situ stress. Then the seismic energy attenuation is bound to be affected by in situ stress, which makes it different from that in shallow rock masses.

3. Numerical Study of Blasting Seismic Energy Generation and Attenuation under In Situ Stress

In this section, the multiple-hole blasting in a circular tunnel excavation under hydrostatic and non-hydrostatic in situ stresses are simulated with the coupled SPH-FEM method. According to the simulated results, the seismic efficiency and seismic energy attenuation laws under varied in situ stress conditions are investigated.

3.1. Conceptual Model of Multiple-Hole Blasting under In Situ Stress

In this numerical study, a circular tunnel with a radius of 5.0 m is considered to be excavated in a homogeneous and isotropic rock medium. The rock medium suffers from horizontal in situ stress σx and vertical in situ stress σy. The circular tunnel is excavated by the millisecond-delay blasting technology with six rounds of blastholes, as presented in Figure 1. The cutting holes in the innermost round are first fired, followed by the stoping holes in the second to fifth rounds and the contour holes in the outermost round. The distances from each round of blastholes to the center of the tunnel are 0.5, 1.2, 2.2, 3.2, 4.2, and 5.0 m, respectively. In the present study, the stoping hole blasting in the fourth round is simulated. There are twenty blastholes with a spacing of 1.0 m in this round. The blastholes are 0.04 m in diameter and are fully filled with explosive columns of the same diameter. The twenty blastholes are considered to be fired simultaneously, regardless of detonator delay errors. Before blasting the stoping holes in the fourth round, the blastholes in the previous rounds have been detonated, and a new free surface has been created, as shown in Figure 1. In the numerical study, the new free surface aligns the connecting line of the blastholes in the third round without considering over-break or under-break caused by blasting.

3.2. Numerical Model and Simulation Method

3.2.1. Coupled SPH-FEM Modeling Method

In dealing with the large deformation problem of rock blasting, the traditional FEM is prone to mesh distortion. It results in a significant reduction in computational accuracy and efficiency, and even sometimes, computations are unsustainable. The SPH modeling method is a meshless Lagrangian approach that treats materials as arbitrarily distributed particles. These particles carry material information such as position, mass, velocity, and energy. Then the behavior of materials can be obtained by tracking the trajectory and computing the dynamic equation of each particle [46]. Because the SPH approach is meshless and avoids mesh tangling, it is especially suitable for modeling the large deformation problem of rock blasting. This hydrodynamics method was originally proposed for modeling astrophysical problems with infinite boundaries. A major limitation of applying this method in other fields is that finite boundary conditions cannot be enforced [47]. Therefore, the pure SPH approach is powerless when applying in situ stress on the model boundaries for simulating the deep rock blasting. In addition, the SPH method is computationally expensive, and its computational efficiency is inferior to the FEM in handling small deformation issues such as seismic wave propagation.
Combining the strengths of each of these two modeling methods, a coupled SPH-FEM approach is adopted in this study to address the rock fracture and seismic wave propagation caused by blasting in stressed rock masses. When using the coupled method, explosives and the rock surrounding blastholes are represented by SPH particles to accommodate large distortions and deformations. Outside the fractured zone, the rock is represented by FEM elements to realize the application of in situ stress on the model boundaries and improve the computational efficiency of seismic wave propagation. The coupled interactions between the SPH particles and the FEM elements are realized via a constraint interface [48], as presented in Figure 2. In this way, the stress transmission and displacement coordination between the SPH particles and the FEM elements are achieved.

3.2.2. Rock and Explosive Models

It is generally accepted that under blast loading, the rock in the crushed zone is mainly subjected to compressive-shear failure, and the rock in the cracked zone mainly suffers tensile failure [34]. The Riedel–Hiermaier–Thoma (RHT) constitutive model developed by Riedel et al. [49] takes compression, tension, and strain rate effects into account together and is widely used in modeling rock fracture caused by blasting. Herein, the rock behavior induced by blasting under in situ stress is also simulated by using the RHT model. In this model, the change of the material strength under loading is divided into three phases, namely the elastic phase, the linear strengthening phase, and the damage softening phase, as depicted in Figure 3. The three phases are distinguished by using three stress limit surfaces, namely the initial elastic yield surface Yelastic, the failure surface Yfailure and the residual friction surface Yresidual. A more detailed description of the RHT constitutive model is presented in Riedel et al. [49] and Borrvall and Riedel [50].
In the damage softening phase, a parameterized damage model driven by plastic strain governs the evolution of material damage. The damage variable D is defined as:
D = Δ ε p ε p f ,   0 D 1
where ∆εp represents the increment of the equivalent plastic strain, ε p f denotes the equivalent plastic strain of material failure under a constant pressure p. The failure strain ε p f is given by:
ε p f = D 1 ( p * p s * ) D 2 ε f ,   min
where p* is the pressure normalized by fc, p * = p / f c , in which fc is the uniaxial compressive strength; p s * = f t / f c , in which ft is the uniaxial tensile strength; εf, min denotes the minimum strain to reach material failure; D1 and D2 are damage constants.
The post-failure stress limit surface for a given damage level is obtained by interpolating between the failure surface Yfailure and the residual friction surface Yresidual. Then the equivalent strength in the damage phase σd is expressed as:
σ d = ( 1 D ) σ f + D σ r
where σf represents the equivalent failure surface strength, and σr represents the equivalent residual strength.
The damaged shear modulus GD is given through the following Equation:
G D = ( 1 D ) G 0 + D G r
where G0 denotes the undamaged shear modulus, and Gr denotes the residual value.
The explosive detonation process is simulated by using the Jones–Wilkins–Lee (JWL) equation of state (EOS). The JWL EOS defines the detonation pressure as a function of the volume and energy of detonation products,
P = C 1 ( 1 ω R 1 V ) e R 1 V + C 2 ( 1 ω R 2 V ) e R 2 V + ω E 0 V
where P denotes the detonation pressure, V is the relative volume of detonation products, E0 is the initial special internal energy, and C1, C2, R1, R2, and ω are explosive constants.

3.2.3. Validation of Material Models and Parameters

Li [51] studied the RHT model parameters of different rocks through SHPB tests and comparisons between laboratory tests and numerical simulations. In the present study, the RHT model parameters of marble reported in Li [51] are adopted, as listed in Table 1. The explosive constants in the JWL equation for many common explosives have been determined by dynamic experiments [52,53]. In this simulation, the JWL parameters of emulsion explosives validated by Castedo et al. [52] are used as follows: C1 = 191.722 GPa, C2 = 1.316 GPa, R1 = 4.629, R2 = 0.588, E0 = 1.933 and ω = 0.37. The other explosive properties used in the simulation are: density ρe = 1188 kg/m3, velocity of detonation VD = 5323 m/s, Chapman–Jouguet pressure PCJ = 7.90 GPa, and specific heat of explosion We = 2235 kJ/kg [53].
Jung et al. [54] have carried out single-hole blasting tests on marble slabs. In their tests, the marble slabs have a width of 0.2 m, a height of 0.2 m, and a thickness of 0.023 m, and the circular blastholes have a radius of 0.004 m. Jung et al. [54] performed two sets of tests, one without initial stress on the slab boundaries and the other one with initial stress of 5 MPa uniaxially applied to the slab boundaries. The two sets of tests are simulated in this study to validate the selected material models and parameters. In the simulation, the sizes of the marble slabs and blastholes and the initial stress conditions remain consistent with those in the laboratory tests. The rock fracture modes obtained by the numerical modeling are shown in Figure 4. Both the testing and numerical results show that when the marble slab is free from initial stress, the blast-induced cracks spread radially around the blasthole. While the initial stress of 5 MPa is applied, the crack propagation tends to the uniaxial stress direction. In the laboratory tests, the longest crack is about 27 times the blasthole radius. In our numerical modeling, the longest crack extends to a length of 24 times the blasthole radius. The agreement between the laboratory tests and the numerical simulations on the blast-induced rock fracture mode and crack length indicates that the chosen material models and parameters are appropriate, whether in the presence or absence of initial stress.

3.2.4. Numerical Model and Boundary Conditions

The explicit dynamic analysis software AUTODYN is employed to simulate the multiple-hole blasting of the circular tunnel excavation under varied in situ stress conditions. In real tunnel blasting, cylindrical blastholes are commonly used, and the explosives placed at different depths are detonated at different times because of the limited detonation velocity. Therefore, real tunnel blasting is a complicated three-dimensional (3D) problem. In order to study the explosion seismic wave energy attenuation with distance, the numerical model needs to extend to a region with a radius of at least 50 m. Furthermore, to ensure simulation accuracy, the element size should not exceed 1/12–1/6 of the shortest wavelength [8]. Under these requirements, the number of elements will exceed one billion if a fully 3D model is used. The computation at this scale is too time-consuming, especially in implementing stress initialization. Therefore, in this numerical study, the explosives at different depths are assumed to be fired simultaneously, and the blasthole pressure is considered to be consistent along the blasthole axis. Under these assumptions, the multiple-hole blasting can be treated as a plane strain issue.
A plane model with a width of 100 m and a height of 100 m is developed for the multiple-hole blasting of the circular tunnel excavation, as shown in Figure 5. The twenty stoping holes in the fourth round are located 3.2 m away from the tunnel center. The free surface created by the blasting of the blastholes in the previous rounds has a radius of 2.2 m. In most cases, the blast-induced fractured zone extends to a range within 100 of the blasthole radius. Therefore, the explosive and the rock within 5.2 m from the tunnel center are discretized into SPH particles. In order to improve computational efficiency, the rock in the other region is discretized into FEM elements. The size of the FEM elements near the blastholes is set to 0.005 m to satisfy the relative relationship between the element size and the shortest wavelength. As the seismic waves spread outward, the wavelength gradually increases. Accordingly, the FEM mesh size gradually increases from 0.005 m near the blastholes to 0.5 m at the outer boundaries.
During the modeling, the horizontal stress σx and the vertical stress σy are first applied to the external boundaries of the numerical model to perform stress initialization. When the static stress reaches a stable state, the JWL EOS is then activated to simulate the explosion loading. To investigate the effects of the in situ stress level and anisotropy on the blasting seismic energy, hydrostatic (σx = σy) and non-hydrostatic (σxσy) in situ stress conditions are considered in the numerical study. Under hydrostatic stress conditions, the stress levels varying from 0 to 60 MPa are considered. Under non-hydrostatic stress conditions, the vertical stress σy keeps constant at 10 MPa, and the lateral coefficient σx/σy is set to 2 and 3, respectively.

3.3. Seismic Energy Generation and Attenuation under Hydrostatic In Situ Stress

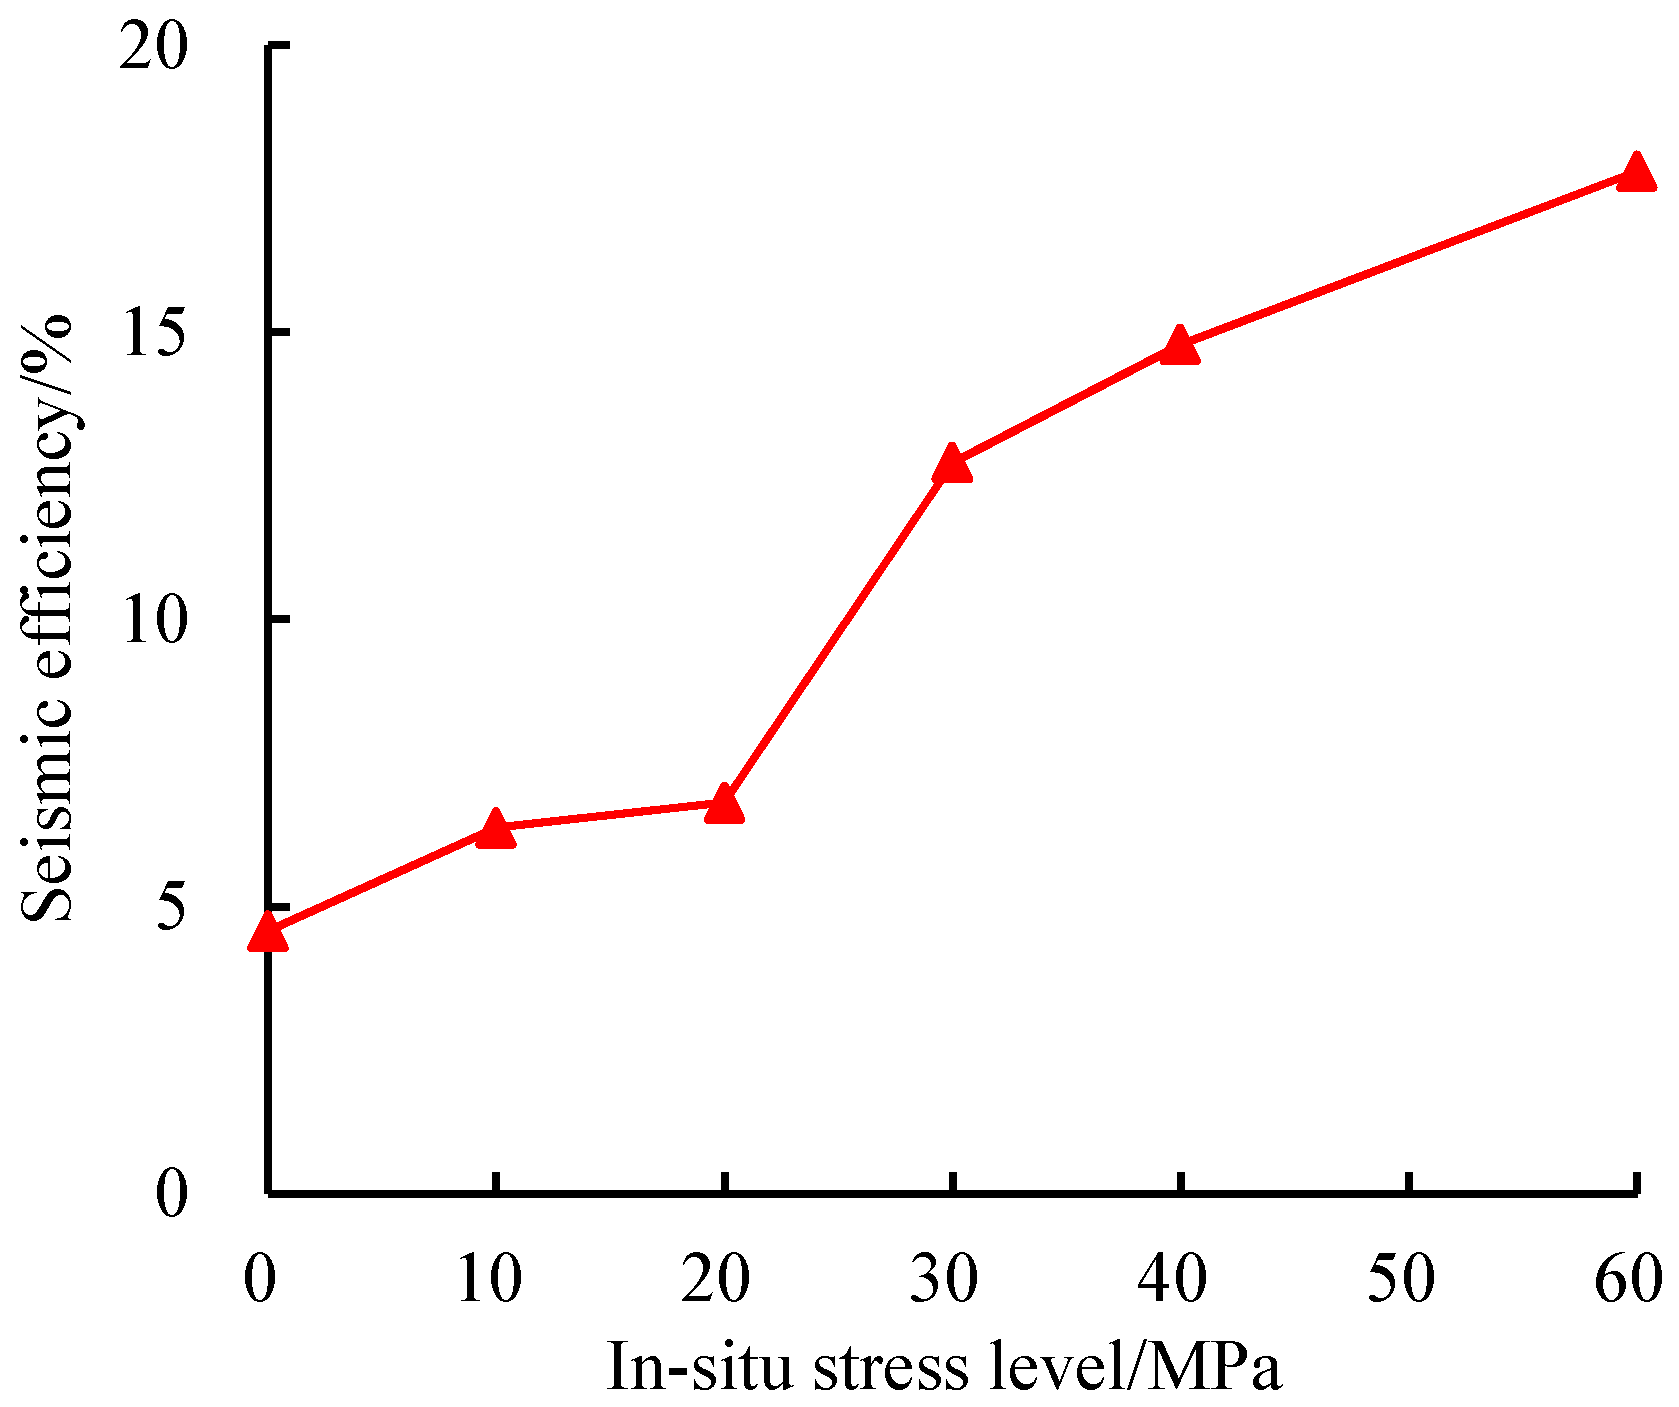
3.3.1. Seismic Energy on the Elastic Boundary

The rock fracture caused by the blasting of the stoping holes in the fourth round under hydrostatic in situ stress is shown in Figure 6. This figure presents the fractured zones in the remaining rock mass under σx = σy = 0, 10, 30, and 60 MPa. As expected, the rock mass next to the blastholes is more severely fractured than that between the adjacent blastholes. The major cracks grow radially from the blasthole walls into the surrounding rock mass. Under σx = σy = 0 MPa, the major cracks extend 1.8 m into the remaining rock mass. Under σx = σy = 10, 30 and 60 MPa, the longest cracks are 1.1, 0.9 and 0.6 m, respectively. The fractured zone produced by blasting decreases significantly with the increase in the in situ stress level.
The rock mass beyond the crack tip is elastic. Therefore, the circle boundary, which takes the tunnel center as the center and takes the distance from the tunnel center to the tip of the longest crack as the radius, is treated as the outer boundary of the fractured zone, namely the elastic boundary. Extracting the velocity histories on the elastic boundary and substituting them into Equation (6) yields the blasting seismic energy on the elastic boundary. According to Equation (7), the blasting seismic efficiency η can be obtained. Figure 7 shows the blasting seismic efficiency variation with the in situ stress levels. Under σx = σy = 0 MPa, the seismic blasting efficiency is 4.6%, which means that only 4.6% of the explosive energy is converted into blasting seismic energy. This percentage agrees well with the average of the measurements by Sanchidrián et al. [33]. Under σx = σy = 60 MPa, a seismic efficiency of 17.8% is attained. The initial blasting seismic energy at this in situ stress level is about four times that of the case without in situ stress. Clearly, the initial blasting seismic energy increases significantly with increasing in situ stress levels. This indicates that compared to blasting in shallow rock masses, more seismic energy is generated in deep rock mass blasting. This is because with the increase in the in situ stress level, the extent of the fractured zone is reduced, and the explosive energy consumed in the rock fracture is accordingly reduced. Consequently, more explosive energy is converted into blasting seismic energy.

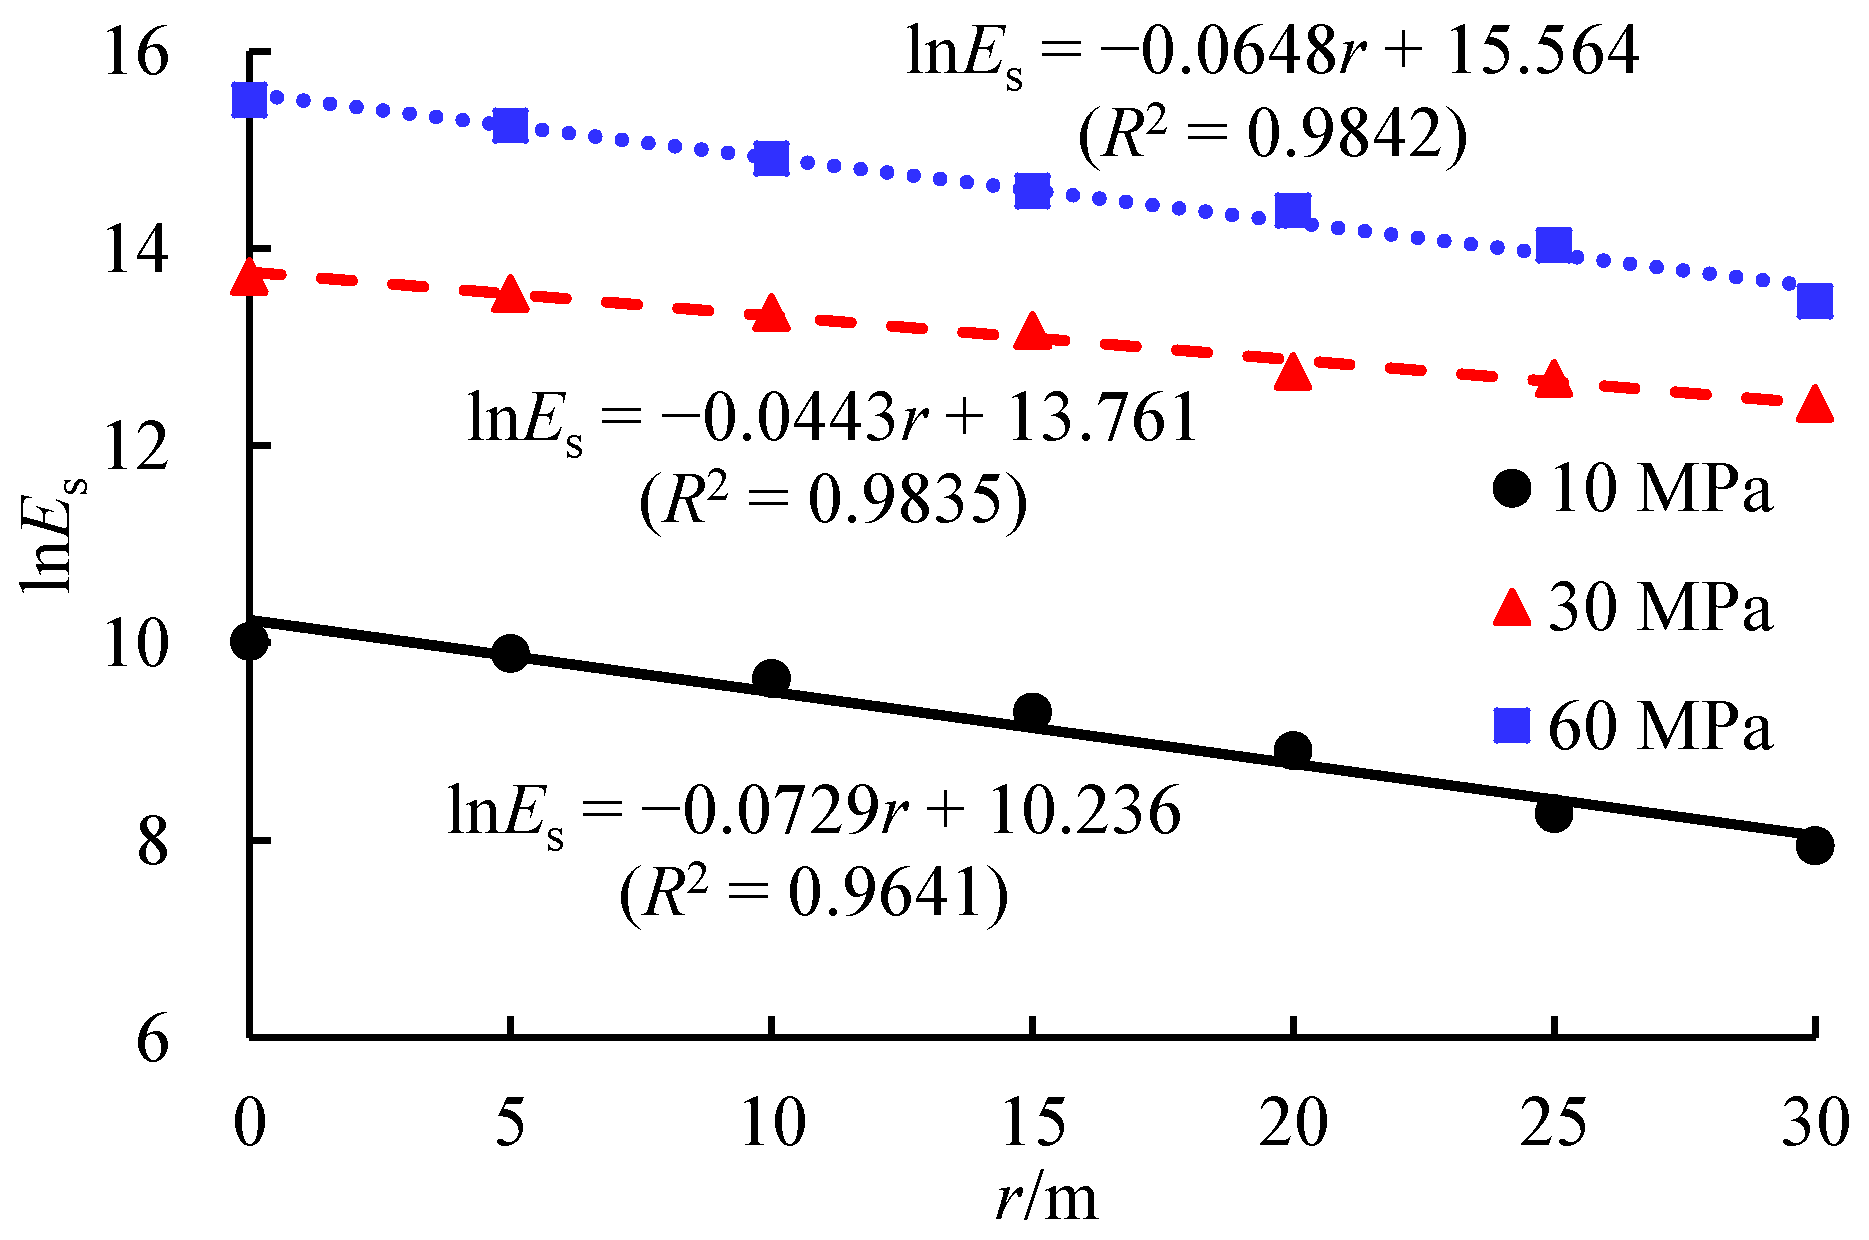
3.3.2. Seismic Energy Attenuation with Distance

By extracting the velocity histories at different distances, the seismic energy at various locations can be obtained. It is acknowledged that during seismic wave propagation, the relative reduction in seismic energy is proportional to the travel distance [55]. The seismic energy at a distance r from the elastic boundary is denoted as Es. The seismic energy reduction over a travel distance dr is represented as −dEs. Then,
d E s E s = α d r
where α is the attenuation index of seismic energy. A greater α value means that the seismic energy decays faster with distance.
The seismic energy variation with distance is obtained by the integration of Equation (13). According to the boundary condition Es0 = ηEe = ηQeWe at r = 0, the seismic energy Es is given by:
E s = η Q e W e e α r
Through taking logarithms on both sides, Equation (14) becomes a linear function as follows:
ln E s = α r + ln ( η Q e W e )
Figure 8 presents the seismic energy versus distance on a logarithmic plot. The attenuation index α of seismic energy can be acquired through linear regression of the scattered data pairs. In the linear regression, the slope of the best fit straight line represents the attenuation index α. In this figure, the symbol R2 denotes the squared correlation coefficient between the scattered data pairs and the best fit straight line. The squared correlation coefficients are all greater than 0.95. This indicates that the seismic energy attenuation with distance does follow the exponential function described in Equation (14). Figure 8 only shows the regression analysis for the in situ stress conditions σx = σy = 10, 30, and 60 MPa. The attenuation indexes obtained by the regression analysis for the other in situ stress conditions are summarized in Table 2. As the hydrostatic in situ stress level increases from 0 to 30 Mpa, the attenuation index of seismic energy decreases from 0.0940 to 0.0443. The blasting seismic energy attenuation with distance becomes slower with increasing in situ stress levels. However, when the stress continues to increase from 30 to 60 Mpa, the attenuation index turns to increase instead from 0.0443 to 0.0648. The attenuation of seismic energy accelerates after the in situ stress reaches 30 Mpa. Anyway, the attenuation is still slower than that of the case without in situ stress. Overall, the attenuation index of seismic energy first decreases and then increases with the increase in the hydrostatic in situ stress. Notably, since the seismic energy attenuation with distance is described by an exponential function, a small value is assigned to the attenuation index. Nevertheless, from the relative change of the attenuation index, the variation of the hydrostatic in situ stress level causes a significant change in the seismic energy attenuation rate.
From the analysis in Section 2.2, in situ stress mainly affects the viscoelastic attenuation of seismic waves. The viscoelastic attenuation is specified by the seismic Q. The inverse of the seismic Q is defined as [43]:
Q 1 = 1 2 π Δ E E max
where ∆E is the amount of energy dissipated per cycle of a harmonic excitation in a certain volume, and Emax is the peak elastic energy in the same volume.
By applying a harmonic wave on the free surface and calculating the seismic energy dissipation over a wavelength, the seismic Q is obtained, as shown in Table 2. The seismic Q first increases with increasing in situ stress. Then it falls off after the hydrostatic stress level exceeds 30 Mpa. This corresponds to the change of the seismic energy attenuation index with in situ stress levels.
Actual rock masses are discontinuous and contain a lot of defects, such as micro-cracks, micro-cavities, and joints. With regard to the RHT material model, the initial material defects are considered and described by two constants, the initial porosity and the porosity exponent. Therefore, the RHT model can well reflect the mechanical behavior of defective rock mass under loads. These defects within rock masses tend to close due to compression as the in situ stress increases from zero to a certain level. The rock mass integrity and the seismic Q are thereby improved, and the energy dissipation during the seismic wave propagation is thus reduced. However, when a higher level of in situ stress is reached, these initial defects would be extended, and furthermore, new cracks would be generated due to the compression-shear action under in situ stress. As a result, the rock mass integrity and the seismic Q are deteriorated, and consequently, the seismic energy is more easily attenuated.

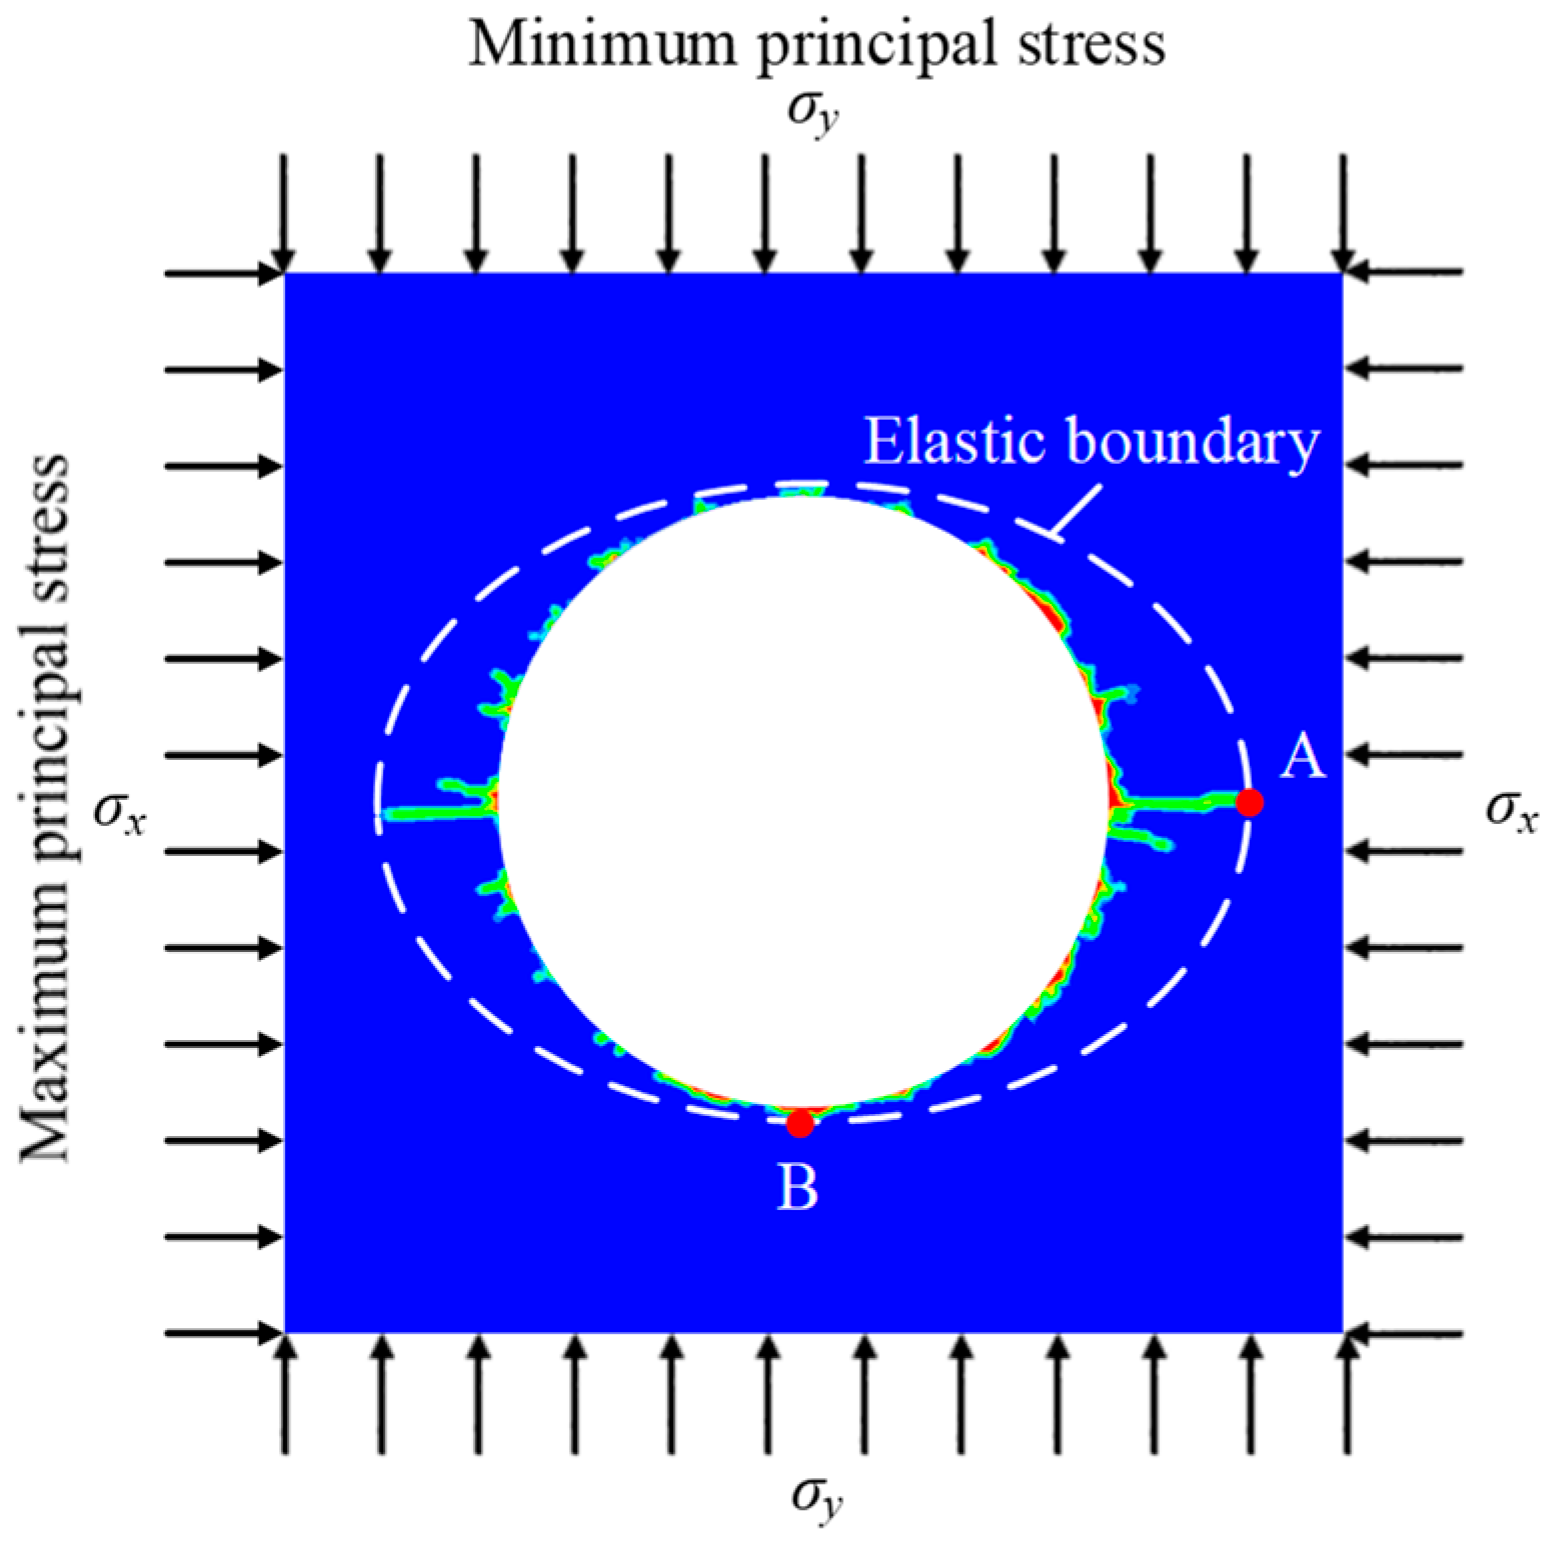
3.4. Seismic Energy Generation and Attenuation under Non-Hydrostatic In Situ Stress

3.4.1. Seismic Energy Density on the Elastic Boundary

Under non-hydrostatic in situ stress, in order to investigate the blasting seismic energy generated in different directions, the total seismic energy on the entire elastic boundary is no longer used in this section. Instead, the seismic energy density at individual observation points is studied. The seismic energy density es is given by the integral of the seismic energy flux over time:
e s = t Φ n d t
Figure 9 gives the fractured zone caused by the multiple-hole blasting under non-hydrostatic in situ stress. In this figure, the case σx = 3σy = 30 MPa is presented only as an example. The envelope of the fractured zone, namely the elastic boundary, is elliptical. The major axis of the elliptical elastic boundary aligns with the maximum principal stress direction. This accords with the case of single-hole blasting. The individual observation points A and B on the elastic boundary are selected to assess the initial seismic energy density generated in different directions. The seismic energy densities at points A and B are 9.74 kJ/m2 and 14.03 kJ/m2, respectively. The initial seismic energy density generated in minimum principal stress orientation is higher. The distribution of the initial seismic energy density on the elastic boundary exhibits anisotropy. Under non-hydrostatic in situ stress, the rock fracture produced in the minimum principal stress orientation is smaller. The explosive energy consumed in the rock fracture in this direction is less. As expected, more seismic energy is generated in this direction, corresponding to a higher seismic energy density.

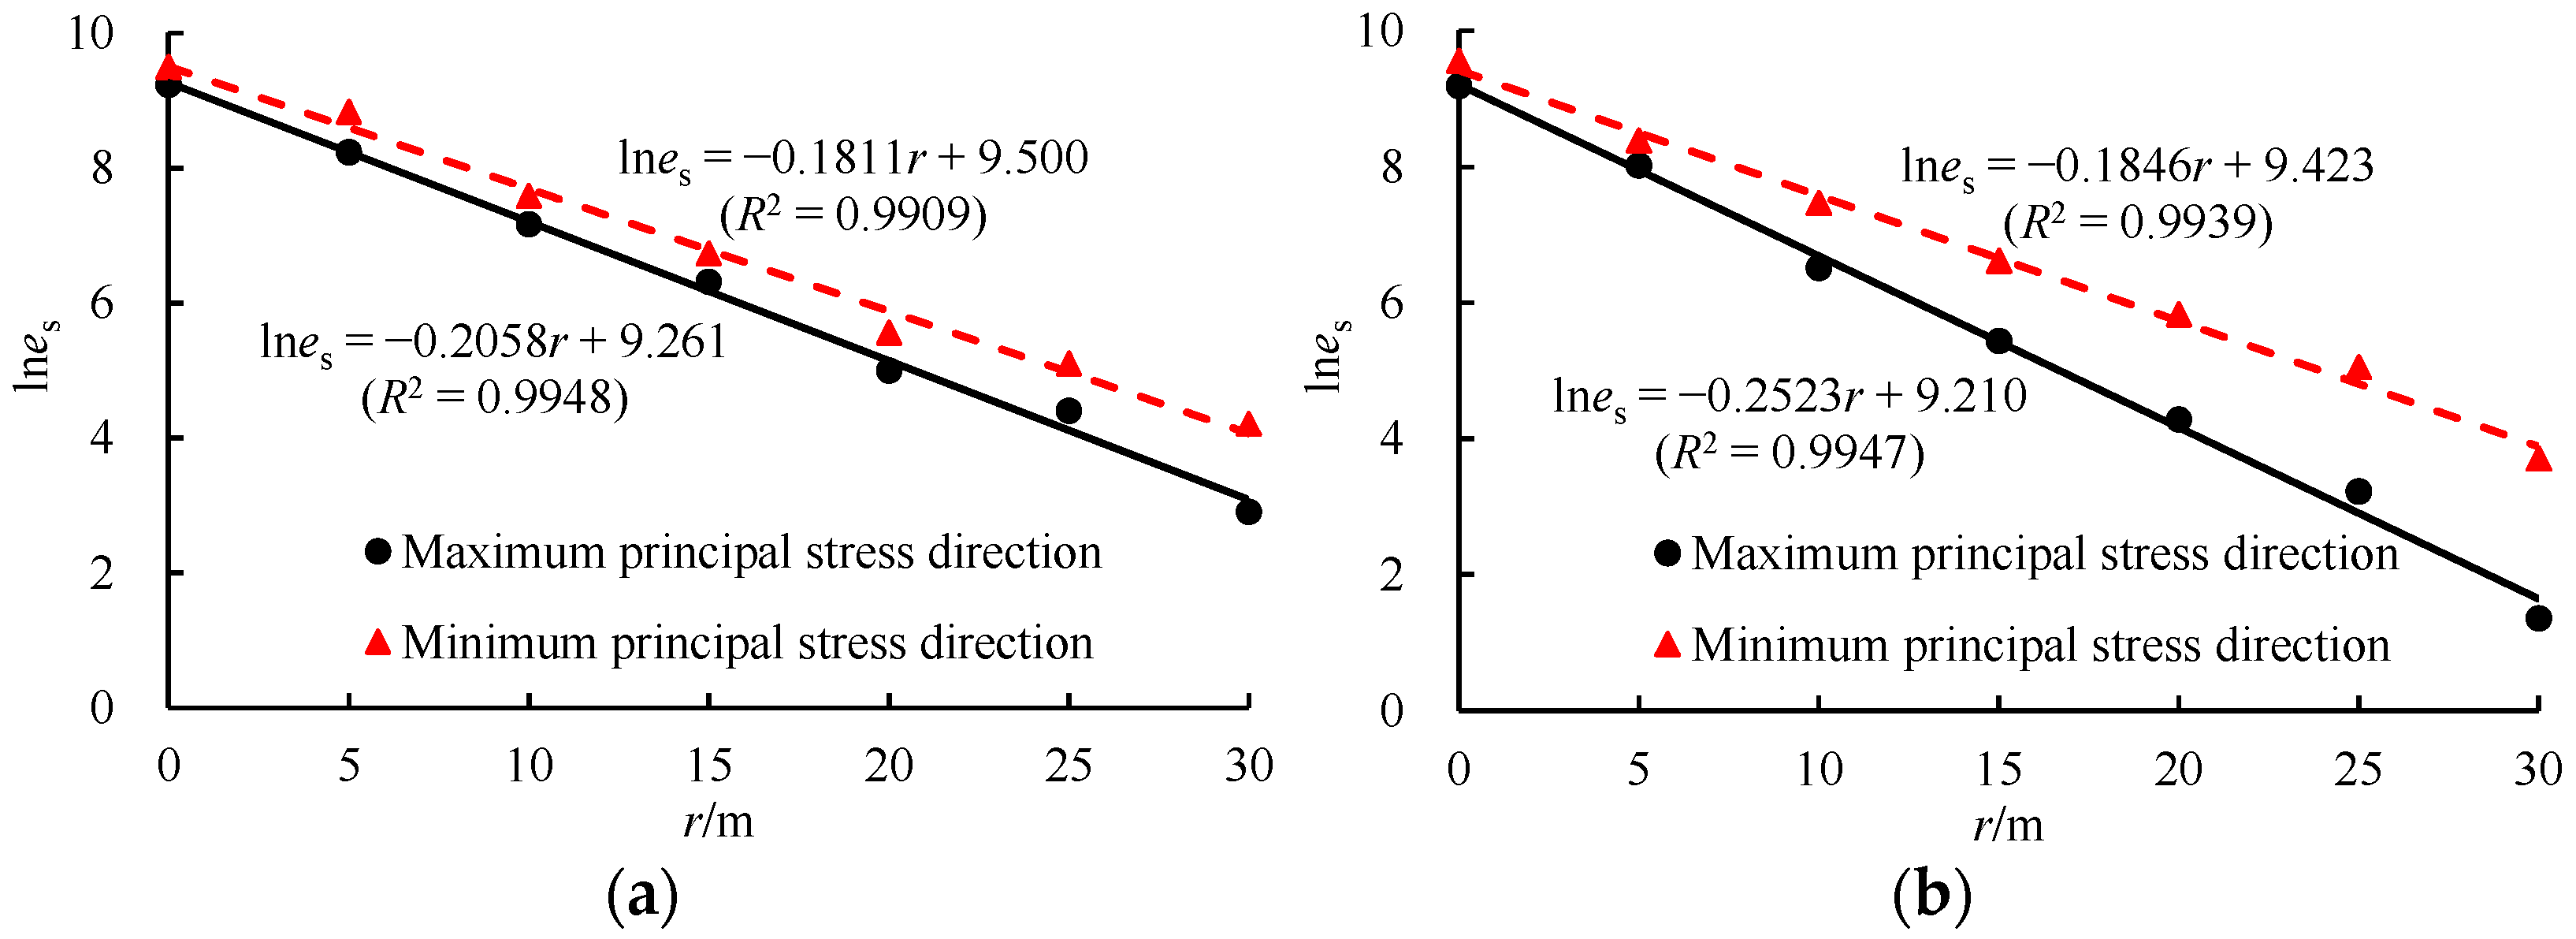
3.4.2. Seismic Energy Density Attenuation with Distance

A series of observation points along the principal stress directions are chosen to investigate the seismic energy density attenuation with distance along different directions. It is assumed that the seismic energy density also follows the attenuation law of an exponential function as the seismic energy. Figure 10 gives the seismic energy density versus distance on a logarithmic plot for the observation points in different directions. The best fit straight line for solving the attenuation index of seismic energy density is also plotted in this figure. At σx = 2σy = 20 MPa, the attenuation indexes of the seismic energy densities in the maximum and minimum principal stress directions are 0.2058 and 0.1811, respectively. At σx = 3σy = 30 MPa, the attenuation indexes are 0.2523 and 0.1846, respectively. Under non-hydrostatic in situ stress conditions, the seismic energy density decays at different rates in each direction. The seismic energy density attenuation with distance exhibits anisotropy. The relative magnitude of the attenuation rates in different directions depends on the state of rock defects under in situ stress. If the initial defects are closed under in situ stress, the attenuation index becomes smaller compared to the case in the absence of in situ stress. If the initial defects are expanded, or new cracks are induced due to higher in situ stress, which means stress-induced rock mass damage, the attenuation index will increase. In this numerical example, the rock mass nearby the free surface in the maximum principal stress direction is damaged due to stress redistribution and concentration. Therefore, the seismic Q of the rock mass in the maximum principal stress direction decreases and the seismic energy density in this direction decays faster with increasing distance.
When the lateral coefficient σx/σy is equal to 2, the attenuation index of the seismic energy density differs by 13.6% between the maximum and minimum principal stress directions. For σx/σy = 3, the difference reaches 36.7%. With the increase in the lateral coefficient, the anisotropy of the seismic energy density attenuation becomes more pronounced. In the numerical modeling, the minimum principal stress σy keeps constant at 10 MPa, and the maximum principal stress σx increases from 20 to 30 MPa. It is seen that as σx changes, the attenuation index in the minimum principal stress direction remains almost constant, while the attenuation index in the maximum principal stress varies significantly. It means that the stress along the seismic wave propagation direction plays a major role in influencing seismic energy attenuation.

4. A Case Study

In this section, the blasting vibration signals monitored inside the rock masses with different in situ stress levels are analyzed to demonstrate the effect of in situ stress levels on the attenuation of blasting seismic energy. The vibration tests were performed in the blasting of the CJPL, which is the deepest underground laboratory in the world.

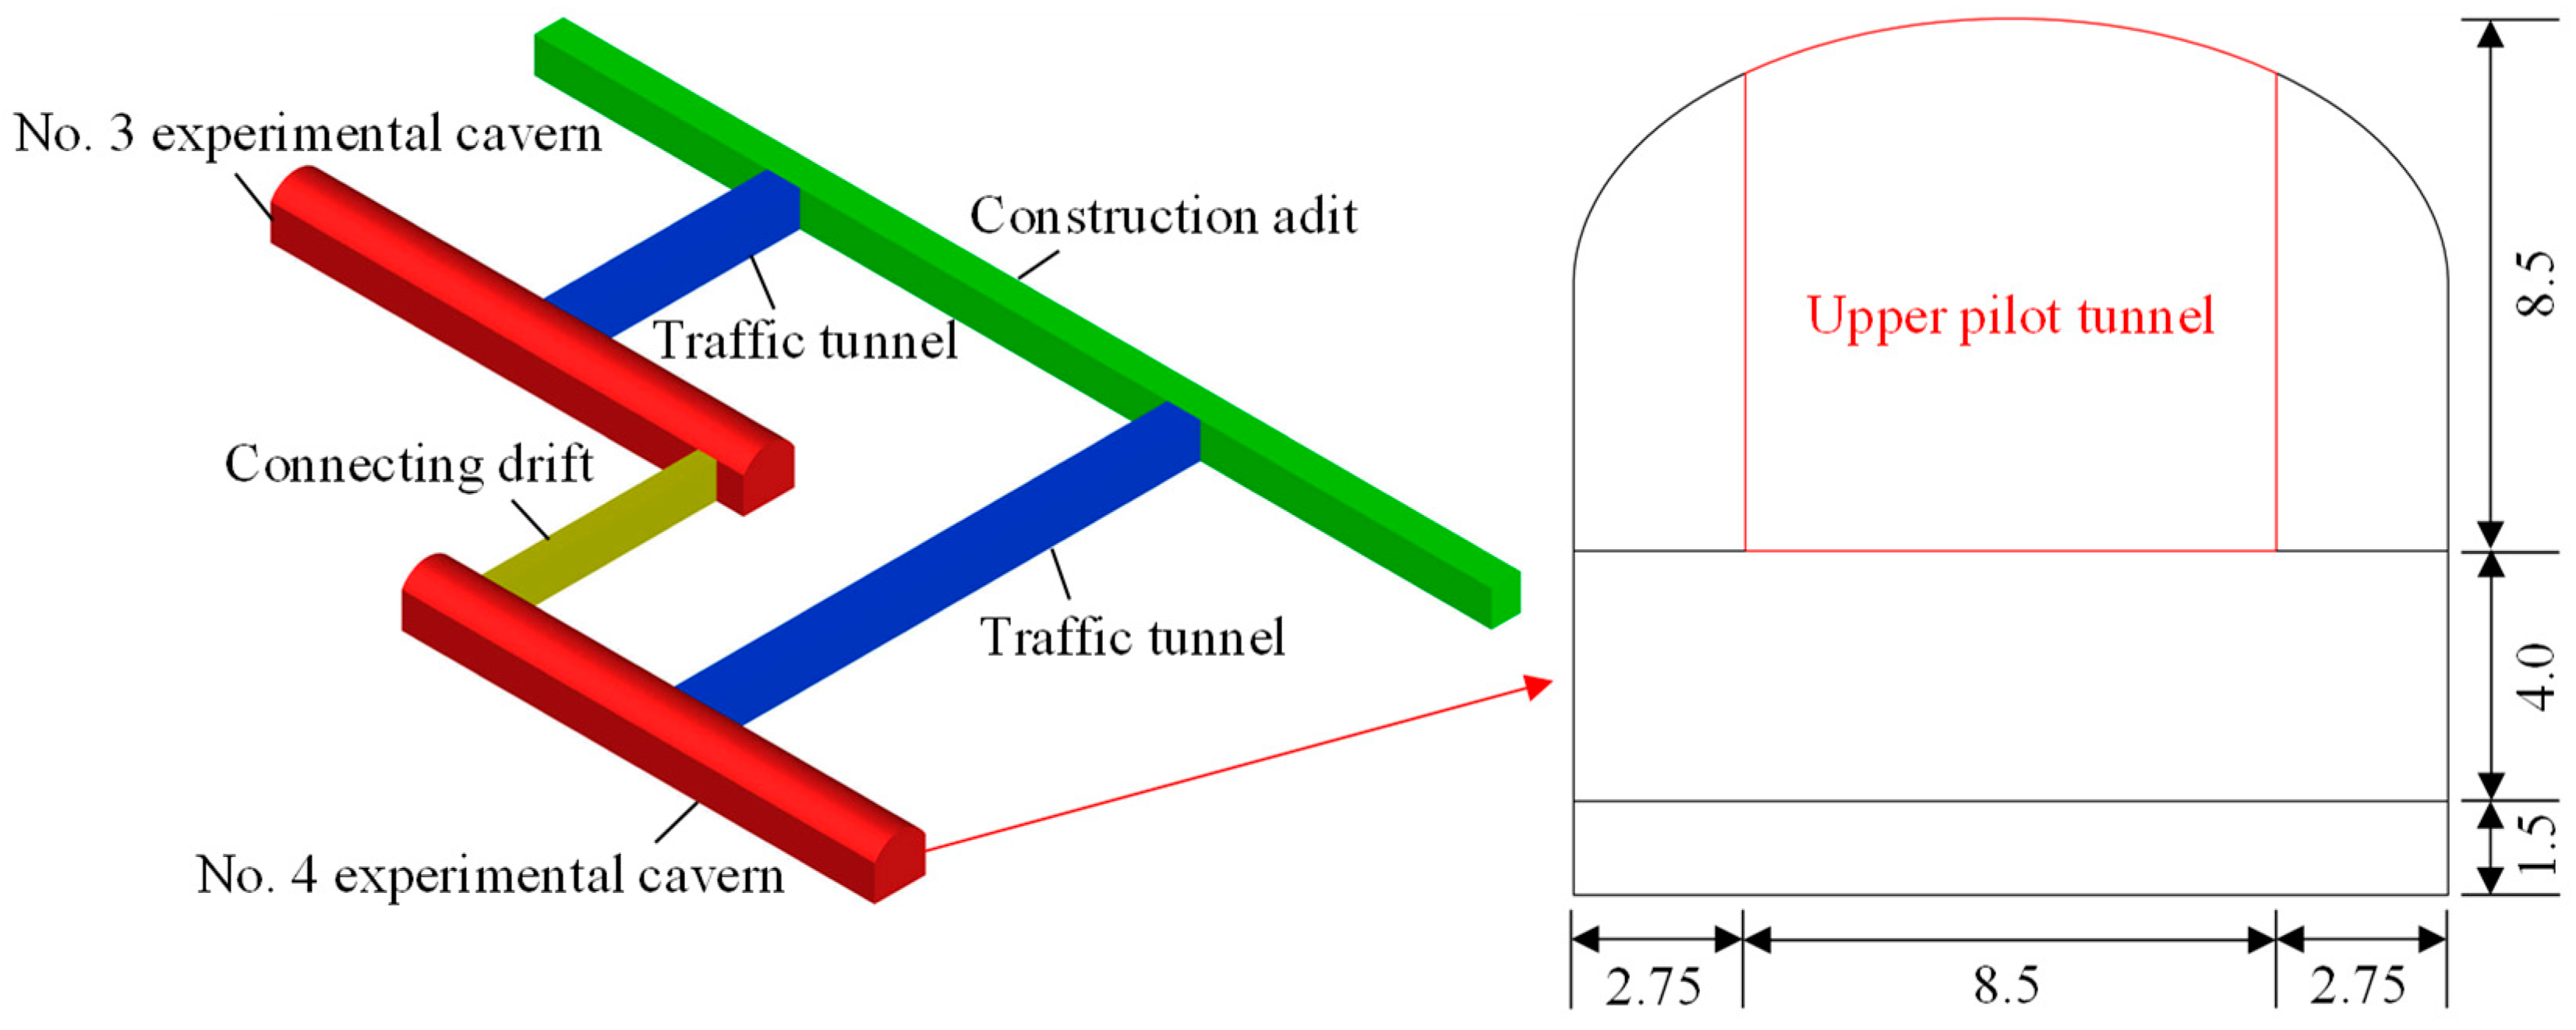
4.1. Site Description

The CJPL is mainly composed of experimental caverns, traffic tunnels, and connecting drifts, as presented in Figure 11. It is excavated underground at a depth exceeding 2000 m. The maximum principal in situ stress measured on-site exceeds 70 MPa. The rock mass in this project is mainly fresh and intact marble. The experimental caverns in the CJPL have a length of 130 m, a width of 14 m, and a height of 14 m. It is excavated in three layers by using the drilling and blasting method. During the excavation of the upper layer, a pilot tunnel measuring 8.5 m wide and 8.5 m high is first blasted, and then the two sides are followed. The bench blasting with vertical holes is employed in the middle layer. The lower layer is a protective layer, and the smooth blasting method with horizontal holes is used in the excavation of this layer.

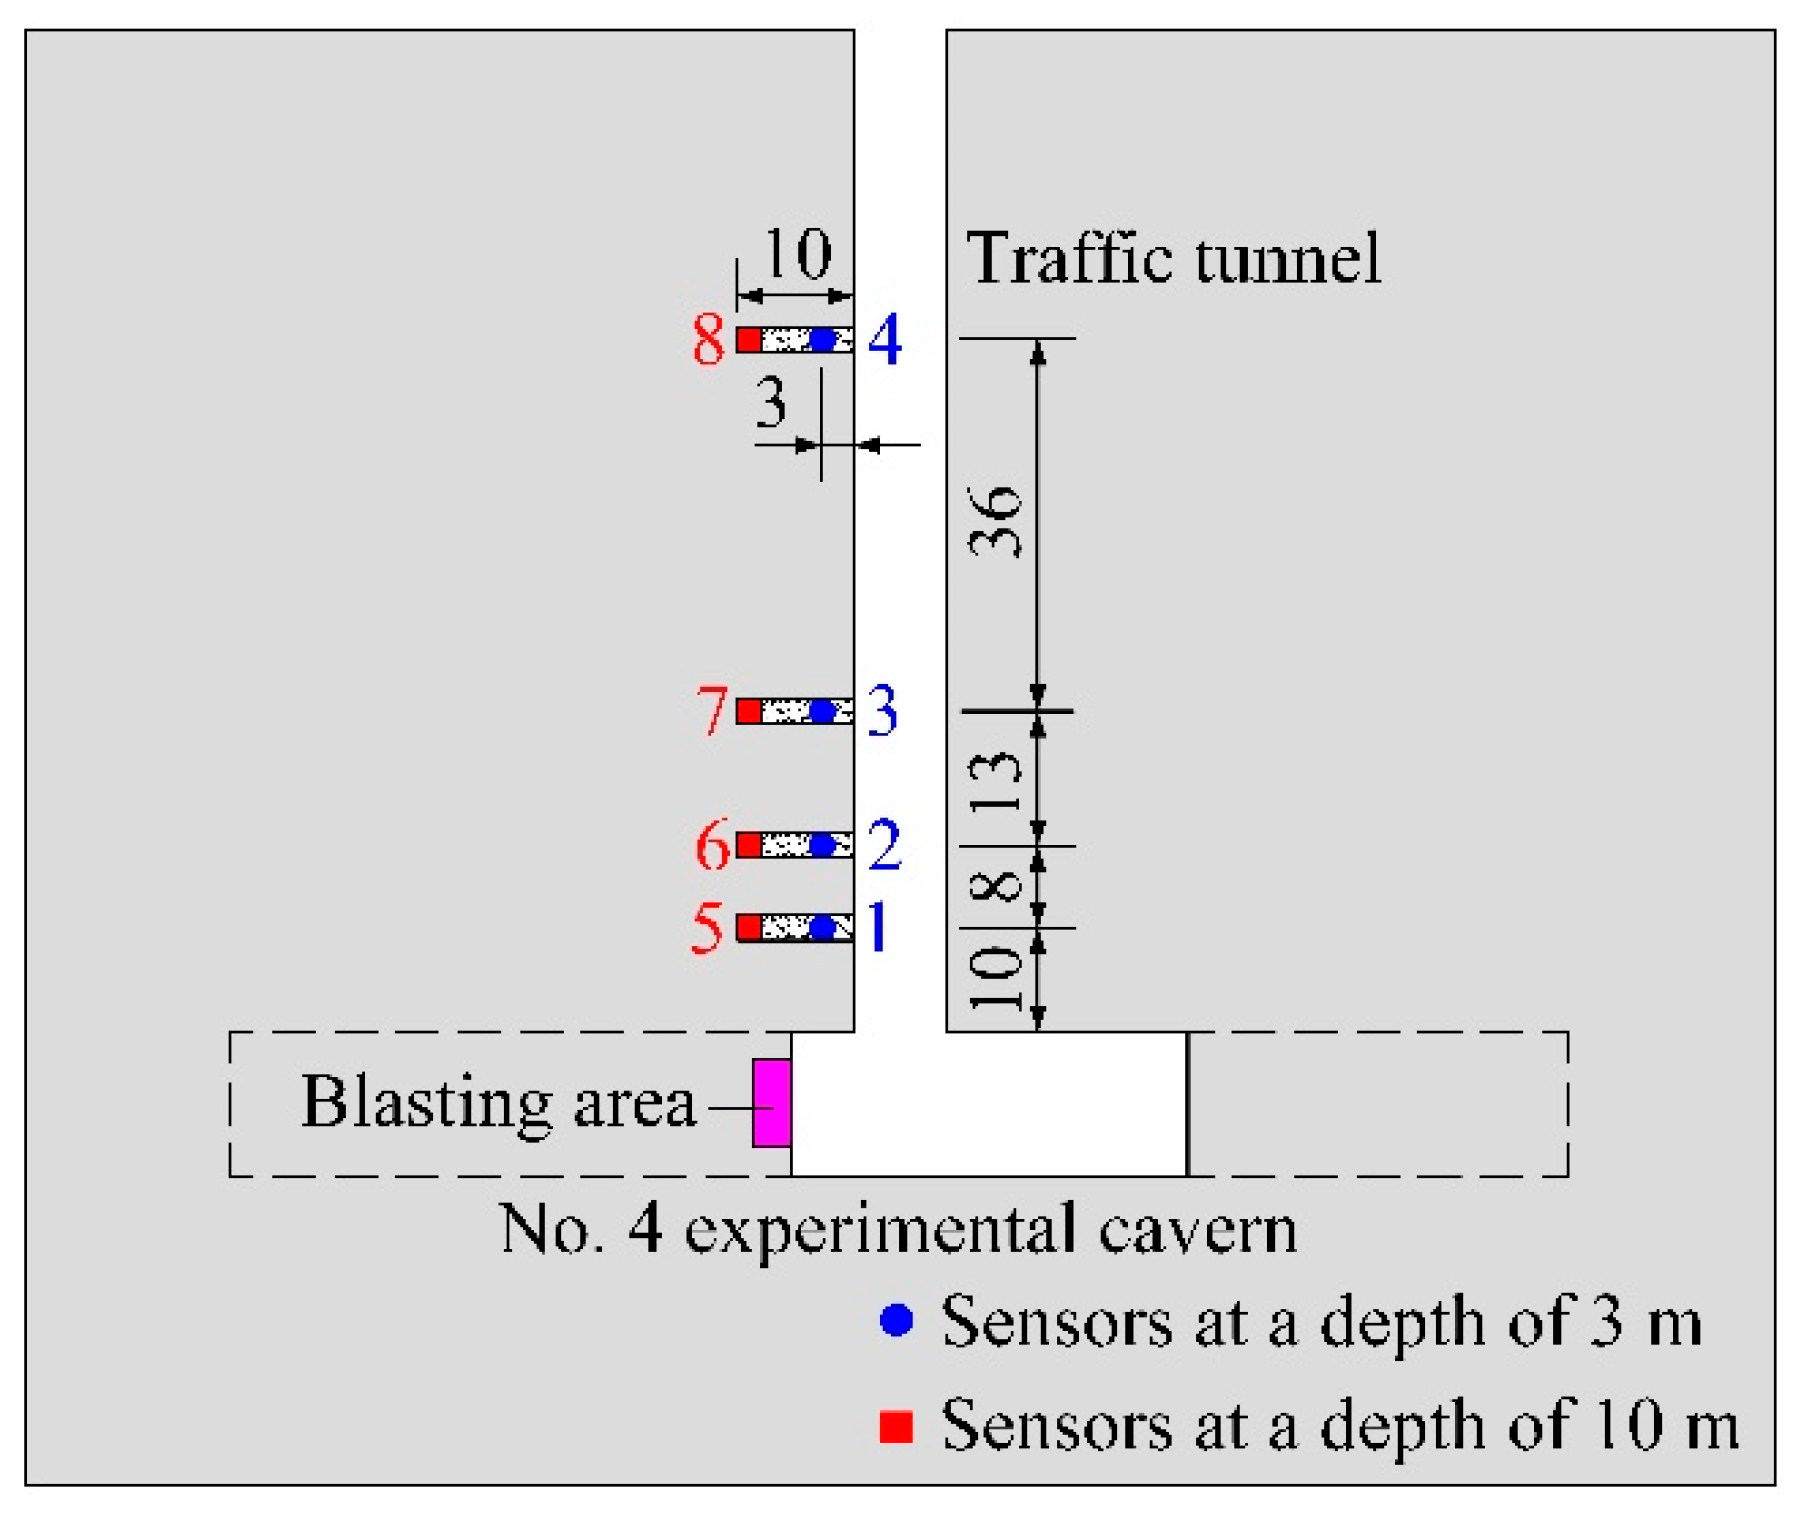
4.2. Blasting Design and Vibration Monitoring

During the upper pilot tunnel blasting in No. 4 experimental cavern, blasting vibration monitoring was conducted within the surrounding rock mass. The pilot tunnel is blasted by using the millisecond-delay blasting method, in which the cutting holes are first fired, followed by the stoping holes and contour holes with time intervals in milliseconds. The blastholes have a length of 3.5 m and a diameter of 0.05 m. The explosive columns filled within the blastholes are 0.032 m in diameter. The cutting hole blasting has a maximum charge weight per delay of 60 kg.
In order to monitor the blasting vibration within the rock mass, four instrument installment holes that are 10 m in length are drilled horizontally from the traffic tunnel wall into the surrounding rock mass, as shown in Figure 12. These holes are located almost at the same elevation, that is, 1.2 m above the traffic tunnel floor. The straight distance between the instrument installment holes and the experimental cavern wall varies from 10 to 67 m. Eight triaxial velocity sensors are installed in the instrument holes. Among them, Nos. 1–4 sensors are placed at a depth of 3 m from the traffic tunnel wall, and Nos. 5–8 sensors are fixed at a depth of 10 m from the traffic tunnel wall. The seismic wave signals collected by the velocity sensors are synchronously transmitted to the data loggers. In order to ensure the high-frequency seismic waves near the blasting source can be recorded, the sampling frequency of the data loggers is set to 10 kHz.

4.3. Seismic Energy Attenuation Analysis and Discussion

According to the in situ stress measurements in the CJPL, Yang et al. [56] numerically analyzed the stress redistribution surrounding the traffic tunnel. The numerical results show that at these monitoring points where the velocity sensors are placed, the vertical in situ stress varies from 45.0 to 51.3 MPa with a small difference. However, the horizontal in situ stress for the monitoring points at different depths is quite different. For Nos. 1–4 monitoring points at a depth of 3 m, the average horizontal stress ranges from 17.2 to 20.6 MPa. While for Nos. 5–8 monitoring points at a depth of 10 m, the average horizontal stress reaches 28.6–32.4 MPa. The horizontal in situ stress at Nos. 5–8 monitoring points is significantly higher than that at 1–4 monitoring points. Therefore, comparing the horizontal vibrations between Nos. 1–4 points and Nos. 5–8 points can reflect the influence of in situ stress levels on the blasting seismic energy attenuation.
The seismic waves produced in the cutting hole blasting are used for analysis in this study because in this delay, the strongest vibration is induced. Due to the small number of monitoring points, the measured waves from eight blasting tests are collected for analysis. In practical blasts, it is a great challenge to determine the seismic wavefront shape, the stress and velocity on the entire wavefront, and the rock mass properties on the wave propagation path. Therefore, the rigorous theoretical Equations (3) and (17) are rarely used to calculate the seismic energy and the seismic energy density for practical blasts. Instead, twice the kinetic energy per unit mass is usually used to characterize the vibration energy or seismic energy at a point. After obtaining the horizontal radial and horizontal tangential velocity histories at a point, the seismic energy of the horizontal vibration is given by:
E s = 0 T ( v 1 2 + v 2 2 ) d t
where T is the period of the velocity history.
According to the measured velocity histories, the seismic energy versus distance on a logarithmic plot is shown in Figure 13. In this figure, the circular symbol represents the monitoring points at a depth of 3 m, and the triangular symbol denotes the monitoring points at a depth of 10 m. Their best fit straight lines are plotted by the solid blue line and red dashed line, respectively. Based on the regression analysis results, the seismic energy attenuation for the monitoring points at a depth of 3 m is:
E s = 0.130 Q e W e e 0.082 r ( R 2 = 0.9578 )
and for the monitoring points at a depth of 10 m, the seismic energy attenuation follows:
E s = 0.117 Q e W e e 0.061 r ( R 2 = 0.9047 )
The squared correlation coefficients exceed 0.90. For the field monitoring vibration signals, their seismic energy attenuation with distance also follows the exponential function law well. For the seismic wave propagation paths with depths of 3 m and 10 m, the attenuation indexes of seismic energy are 0.082 and 0.061, respectively, with a relative difference of 26%. The seismic energy decays more slowly along Nos. 5–8 monitoring points at a greater depth of 10 m. This is because, at a greater depth from the traffic tunnel wall, the rock mass is subjected to higher horizontal in situ stress. Hence the seismic Q at this location is higher, and then the seismic energy of the horizontal vibration decays at a slower rate. This conclusion is consistent with the theoretical and numerical results obtained above. According to the analysis of the field monitoring data, it is demonstrated that in situ stress does have an important effect on the energy attenuation of blast-induced seismic waves.
The theoretical, numerical, and case studies conducted in this paper indicate that during rock blasting under in situ stress, the blasting seismic energy generation and attenuation are closely related to the stress level and lateral coefficient. However, in the current rock blasting theory with respect to explosive energy distribution, seismic wave attenuation, vibration prediction, and safety standards, the role of in situ stress has not been properly addressed. This probably results in an inappropriate blasting design for deep mining and excavation, thereby affecting rock fragmentation and excavation profile formation. In severe cases, it may induce dynamic disasters such as rockbursts.
As analyzed above, during rock blasting under in situ stress, more blasting seismic energy is generated, and the seismic energy attenuation becomes slower. Then the PPV caused by deep rock blasting is greater than that caused by shallow rock blasting at the same charge weight. This means that under the current blasting vibration standards that are developed in terms of PPV limits, the seismic waves generated in deep rock blasting are more likely to reach and exceed the limits. In order to prevent this from happening for statutory compliance, the charge weight is usually reduced by designers as it is directly related to the PPV. This is also the most commonly used optimization method in shallow rock blasting. However, simply reducing the charge weight may result in insufficient rock fragmentation, leading to large blocks and under-break for deep rock blasting. This is because, in this case, the explosive energy is reduced, and furthermore, in situ stress inhibits the growth of the cracks caused by blasting. Conversely, it is inadvisable to blindly increase the charge weight to promote rock fragmentation. On the one hand, the vibration levels of blast-induced seismic waves are subjected to statutory compliance. More importantly, the superposition of the explosion-related energy and the rock strain energy due to high in situ stress is likely to exceed the rock energy storage limit. The excess energy causes rock spalling and is released in the form of violent rockbursts, threatening construction personnel and equipment safety, as well as cavern stability. Therefore, in order to ensure construction safety and quality in deep mining and excavation, it is urgent to develop the deep rock blasting theory, in which the influences of in situ stress on rock fragmentation and blasting seismic waves are considered.
During the research in this study, several simplifications and assumptions are made, particularly in numerical modeling. For example, multiple-hole blasting is assumed to be a two-dimensional (2D) problem, and the rock mass is considered to be homogeneous without taking structural features into account. Notwithstanding its limitations, 2D modeling still reveals the role of in situ stress on the generation and attenuation of blasting seismic energy. In order to enrich the deep rock blasting theory, the vibration thresholds of rock damage for blasting under in situ stress need to be studied in the future.

5. Conclusions

In this paper, the influences of in situ stress on the energy generation and attenuation of blast-induced seismic waves were investigated by using theoretical analysis, numerical modeling, and a case study. The following conclusions are obtained:
(1)
In situ stress has an important effect on the initial seismic energy generated in deep rock blasting. With the increase in the in situ stress level, the explosive energy consumed in the rock fracture is reduced, and more explosive energy is converted into seismic energy.
(2)
The blasting seismic energy attenuation, specifically its viscoelastic attenuation, is affected by the in situ stress level. The increasing in situ stress causes the seismic Q to first increase and then decrease, and thereby the attenuation rate of the seismic energy first decreases and then increases. The blasting seismic energy attenuation under in situ stress conditions is slower than that of the case without in situ stress. Compared to shallow rock blasting, the seismic waves generated in deep rock blasting are more likely to reach and exceed the PPV limits specified in the blasting vibration standards.
(3)
Under non-hydrostatic in situ stress, the blasting seismic energy generation and attenuation are anisotropic. The anisotropy becomes more significant with an increase in the lateral coefficient that is greater than 1.0. The seismic energy density generated in the minimum principal stress orientation is the highest. The attenuation rate of the seismic energy density is mainly affected by the stress that aligns with the wave propagation orientation.

Author Contributions

Conceptualization, J.Y.; methodology, J.S. and Y.J.; software, Y.Y.; investigation, J.Y. and J.S.; data curation, J.Y.; writing-original draft preparation, J.Y.; writing-review and editing, J.S. and Y.J.; supervision, Y.J.; project administration, Y.Y.; funding acquisition, J.S., Y.J. and Y.Y. All authors have read and agreed to the published version of the manuscript.

Funding

This research was funded by the National Natural Science Foundation of China (grant nos. 51969015 and 52179102), the Open Research Program of Hubei Key Laboratory of Blasting Engineering (Jianghan University) (grant no. HKLBEF202007), and the Natural Science Foundation of Jiangxi Province (grant nos. 20204BCJ23002 and 20204BCJ24004).

Institutional Review Board Statement

Not applicable.

Informed Consent Statement

Not applicable.

Data Availability Statement

The data used to support the findings of this study are available from the corresponding author upon request.

Acknowledgments

Special thanks for organizing and conducting the case study to the researchers in the State Key Laboratory of Precision Blasting, Jianghan University.

Conflicts of Interest

The authors declare no conflict of interest.

References

  1. Scheepers, L.; Malan, D.F. A Case Study of Geotechnical Conditions Affecting Mining-Induced Seismicity in a Deep Tabular Mine. J. S. Afr. Inst. Min. Metall. 2022, 122, 115–124. [Google Scholar] [CrossRef]
  2. Yabe, Y.; Abe, S.; Ito, T.; Ishida, A.; Sugimura, K.; Kanematsu, M.; Higashi, M.; Tadokoro, R.; Ogasawara, H.; Funato, A.; et al. In-Situ Stress around Source Faults of Seismic Events in and beneath South African Deep Gold Mines. In Proceedings of the Deep Mining 2019: Proceedings of the Ninth International Conference on Deep and High Stress Mining, Johannesburg, South Africa, 24–25 June 2019; pp. 399–411. [Google Scholar]
  3. He, S.; Lai, J.; Zhong, Y.; Wang, K.; Xu, W.; Wang, L.; Liu, T.; Zhang, C. Damage Behaviors, Prediction Methods and Prevention Methods of Rockburst in 13 Deep Traffic Tunnels in China. Eng. Fail. Anal. 2021, 121, 105178. [Google Scholar] [CrossRef]
  4. Zhang, Z.X.; Ouchterlony, F. Energy Requirement for Rock Breakage in Laboratory Experiments and Engineering Operations: A Review. Rock Mech. Rock Eng. 2022, 55, 629–667. [Google Scholar] [CrossRef]
  5. Ainalis, D.; Kaufmann, O.; Tshibangu, J.P.; Verlinden, O.; Kouroussis, G. Modelling the Source of Blasting for the Numerical Simulation of Blast-Induced Ground Vibrations: A Review. Rock Mech. Rock Eng. 2017, 50, 171–193. [Google Scholar] [CrossRef]
  6. Gutowski, T.G.; Dym, C.L. Propagation of Ground Vibration: A Review. J. Sound Vib. 1976, 49, 179–193. [Google Scholar] [CrossRef]
  7. Blair, D.P. Blast Vibration Dependence on Charge Length, Velocity of Detonation and Layered Media. Int. J. Rock Mech. Min. Sci. 2014, 65, 29–39. [Google Scholar] [CrossRef]
  8. Blair, D.P. The Free Surface Influence on Blast Vibration. Int. J. Rock Mech. Min. Sci. 2015, 77, 182–191. [Google Scholar] [CrossRef]
  9. Gu, W.; Wang, Z.; Chen, J.; Liu, J.; Lu, M. Experimental and Theoretical Study on Influence of Different Charging Structures on Blasting Vibration Energy. Shock Vib. 2015, 2015, 248739. [Google Scholar] [CrossRef]
  10. Roy, M.P.; Mishra, A.K.; Agrawal, H.; Singh, P.K. Blast Vibration Dependence on Total Explosives Weight in Open-Pit Blasting. Arab. J. Geosci. 2020, 13, 531. [Google Scholar] [CrossRef]
  11. Mpofu, M.; Ngobese, S.; Maphalala, B.; Roberts, D.; Khan, S. The Influence of Stemming Practice on Ground Vibration and Air Blast. J. S. Afr. Inst. Min. Metall. 2021, 121, 1–10. [Google Scholar] [CrossRef]
  12. Gui, Y.L.; Zhao, Z.Y.; Jayasinghe, L.B.; Zhou, H.Y.; Goh, A.T.C.; Tao, M. Blast Wave Induced Spatial Variation of Ground Vibration Considering Field Geological Conditions. Int. J. Rock Mech. Min. Sci. 2018, 101, 63–68. [Google Scholar] [CrossRef]
  13. Yu, C.; Yue, H.; Li, H.; Xia, X.; Liu, B. Scale Model Test Study of Influence of Joints on Blasting Vibration Attenuation. Bull. Eng. Geol. Environ. 2021, 80, 533–550. [Google Scholar] [CrossRef]
  14. Gonen, A. Investigation of Fault Effect on Blast-Induced Vibration. Appl. Sci. 2022, 12, 2278. [Google Scholar] [CrossRef]
  15. Yilmaz, O. The Comparison of Most Widely Used Ground Vibration Predictor Equations and Suggestions for the New Attenuation Formulas. Environ. Earth Sci. 2016, 75, 269. [Google Scholar] [CrossRef]
  16. Sun, P.; Lu, W.; Zhou, J.; Huang, X.; Chen, M.; Li, Q. Comparison of Dominant Frequency Attenuation of Blasting Vibration for Different Charge Structures. J. Rock Mech. Geotech. Eng. 2022, 14, 448–459. [Google Scholar] [CrossRef]
  17. Jung, D.; Choi, Y. Prediction of Blast Vibration in Quarry Using Machine Learning Models. Tunn. Undergr. Space 2021, 31, 508–519. [Google Scholar]
  18. Zaid, M.; Sadique, M.R. Numerical Modelling of Internal Blast Loading on a Rock Tunnel. Adv. Comput. Des. 2020, 5, 417–443. [Google Scholar]
  19. Zaid, M.; Sadique, M.R. A Simple Approximate Simulation Using Coupled Eulerian-Lagrangian (CEL) Simulation in Investigating Effects of Internal Blast in Rock Tunnel. Ind. Geotech. J. 2021, 51, 1038–1055. [Google Scholar] [CrossRef]
  20. Zaid, M.; Shah, I.A. Numerical Analysis of Himalayan Rock Tunnels under Static and Blast Loading. Geotech. Geol. Eng. 2021, 39, 5063–5083. [Google Scholar] [CrossRef]
  21. Zaid, M.; Sadique, M.R. The Response of Rock Tunnel When Subjected to Blast Loading: Finite Element Analysis. Eng. Rep. 2021, 3, e12293. [Google Scholar] [CrossRef]
  22. Zaid, M.; Sadique, M.; Alam, M. Blast Analysis of Tunnels in Manhattan-Schist and Quartz-Schist Using Coupled-Eulerian–Lagrangian Method. Innov. Infrastruct. Solut. 2021, 6, 69. [Google Scholar] [CrossRef]
  23. Zaid, M.; Sadique, M.R.; Samanta, M. Effect of Unconfined Compressive Strength of Rock on Dynamic Response of Shallow Unlined Tunnel. SN Appl. Sci. 2020, 2, 2131. [Google Scholar] [CrossRef]
  24. Zaid, M.; Sadique, M.R.; Alam, M.M.; Samanta, M. Effect of Shear Zone on Dynamic Behaviour of Rock Tunnel Constructed in Highly Weathered Granite. Geomech. Eng. 2020, 23, 245–259. [Google Scholar]
  25. Yang, J.; Wu, Z.; Sun, W.; Yao, C.; Wang, Q. Numerical Simulation on Radiation and Energy of Blast-Induced Seismic Waves in Deep Rock Masses. J. Cent. South Univ. 2022, 29, 645–662. [Google Scholar] [CrossRef]
  26. Fan, L.F.; Sun, H.Y. Seismic Wave Propagation through an In-Situ Stressed Rock Mass. J. Appl. Geophys. 2015, 121, 13–20. [Google Scholar] [CrossRef]
  27. Liu, T.; Li, X.; Zheng, Y.; Meng, F.; Song, D. Analysis of Seismic Waves Propagating through an In Situ Stressed Rock Mass Using a Nonlinear Model. Int. J. Geomech. 2020, 20, 04020002. [Google Scholar] [CrossRef]
  28. Li, Z.; Li, J.; Li, H.; Zhao, J. Effects of a Set of Parallel Joints with Unequal Close-Open Behavior on Stress Wave Energy Attenuation. Wave Random Complex 2021, 31, 2427–2451. [Google Scholar] [CrossRef]
  29. Dong, Q.; Li, X.; Jia, Y.; Sun, J. A Numerical Simulation of Blasting Stress Wave Propagation in a Jointed Rock Mass under Initial Stresses. Appl. Sci. 2021, 11, 7873. [Google Scholar] [CrossRef]
  30. Zhu, J.; Li, Y.; Peng, Q.; Deng, X.; Gao, M.; Zhang, J. Stress Wave Propagation across Jointed Rock Mass under Dynamic Extension and Its Effect on Dynamic Response and Supporting of Underground Opening. Tunn. Undergr. Sp. Technol. 2021, 108, 103648. [Google Scholar] [CrossRef]
  31. Dong, Q.; Li, X.; Huang, J. Model Test Study on Cylindrical Blasting Stress Wave Propagation across Jointed Rock Mass with Different Initial Stresses. Adv. Civil Eng. 2020, 2020, 8881302. [Google Scholar] [CrossRef]
  32. Zhang, F.; Yan, G.; Yang, Q.; Gao, J.; Li, Y. Strain Field Evolution Characteristics of Free Surface during Crater Blasting in Sandstone under High Stress. Appl. Sci. 2020, 10, 6285. [Google Scholar] [CrossRef]
  33. Sanchidrián, J.A.; Segarra, P.; López, L.M. Energy Components in Rock Blasting. Int. J. Rock Mech. Min. Sci. 2007, 44, 130–147. [Google Scholar] [CrossRef]
  34. Zhu, Z.; Mohanty, B.; Xie, H. Numerical Investigation of Blasting-Induced Crack Initiation and Propagation in Rocks. Int. J. Rock Mech. Min. Sci. 2007, 44, 412–424. [Google Scholar] [CrossRef]
  35. Hinzen, K.G. Comparison of Seismic and Explosive Energy in Five Smooth Blasting Test Rounds. Int. J. Rock Mech. Min. Sci. 1998, 35, 957–967. [Google Scholar] [CrossRef]
  36. Jiang, G.; Zuo, J.; Li, Y.; Wei, X. Experimental Investigation on Mechanical and Acoustic Parameters of Different Depth Shale Under The Effect of Confining Pressure. Rock Mech. Rock Eng. 2019, 52, 4273–4286. [Google Scholar] [CrossRef]
  37. Wang, Y.; Liu, D.Q.; Zhao, Z.H.; Wang, H.J. Investigation on the Effect of Confining Pressure on the Geomechanical and Ultrasonic Properties of Black Shale Using Ultrasonic Transmission and Post-Test CT Visualization. J. Petrol. Sci. Eng. 2020, 185, 106630. [Google Scholar] [CrossRef]
  38. Asef, M.R.; Najibi, A.R. The Effect of Confining Pressure on Elastic Wave Velocities and Dynamic to Static Young’s Modulus Ratio. Geophysics 2013, 78, D135–D142. [Google Scholar] [CrossRef]
  39. Córdova, E.; Gottreux, I.; Anani, A.; Ferrada, A.; Contreras, J.S. Blasting and Preconditioning Modelling in Underground Cave Mines under High Stress Conditions. J. S. Afr. Inst. Min. Metall. 2021, 121, 71–80. [Google Scholar] [CrossRef]
  40. Li, X.; Zhu, Z.; Wang, M.; Wan, D.; Zhou, L.; Liu, R. Numerical Study on the Behavior of Blasting in Deep Rock Masses. Tunn. Undergr. Sp. Technol. 2021, 113, 103968. [Google Scholar] [CrossRef]
  41. Yan, G.; Yang, Q.; Zhang, F.; Hao, Q.; Wang, X.; Wang, H. Experimental Study on the Effects of In Situ Stress on the Initiation and Propagation of Cracks during Hard Rock Blasting. Appl. Sci. 2021, 11, 11169. [Google Scholar] [CrossRef]
  42. Ding, C.; Yang, R.; Yang, L. Experimental Results of Blast-Induced Cracking Fractal Characteristics and Propagation Behavior in Deep Rock Mass. Int. J. Rock Mech. Min. Sci. 2021, 142, 104772. [Google Scholar] [CrossRef]
  43. Picotti, S.; Carcione, J.M.; Ba, J. Rock-Physics Templates Based on Seismic Q. Geophysics 2019, 84, MR13–MR23. [Google Scholar] [CrossRef]
  44. Johnston, D.H.; Toksöz, M.N. Ultrasonic P and S Wave Attenuation in Dry and Saturated Rocks under Pressure. J. Geophys. Res. 1980, 85, 925–936. [Google Scholar] [CrossRef]
  45. Somogyiné Molnár, J.; Kiss, A.; Dobróka, M. Petrophysical Models to Describe the Pressure Dependence of Acoustic Wave Propagation Characteristics. Acta. Geod. Geophys. 2015, 50, 339–352. [Google Scholar] [CrossRef]
  46. Fakhimi, A.; Lanari, M. DEM–SPH Simulation of Rock Blasting. Comput. Geotech. 2014, 55, 158–164. [Google Scholar] [CrossRef]
  47. Koneshwaran, S.; Thambiratnam, D.P.; Gallage, C. Blast Response of Segmented Bored Tunnel Using Coupled SPH–FE Method. Structures 2015, 2, 58–71. [Google Scholar] [CrossRef]
  48. Lu, Y.; Wang, Z.; Chong, K. A Comparative Study of Buried Structure in Soil Subjected to Blast Load Using 2D and 3D Numerical Simulations. Soil Dyn. Earthq. Eng. 2005, 25, 275–288. [Google Scholar] [CrossRef]
  49. Riedel, W.; Thoma, K.; Hiermaier, S.; Schmolinske, E. Penetration of Reinforced Concrete by BETA-B-500 Numerical Analysis Using a New Macroscopic Concrete Model for Hydrocodes. In Proceedings of the 9th International Symposium on the Effects of Munitions with Structures, Berlin, Germany, 3–7 May 1999; pp. 211–221. [Google Scholar]
  50. Borrvall, T.; Riedel, W. The RHT Concrete Model in LS-DYNA. In Proceedings of the 8th European LS-DYNA User Conference, Strasbourg, France, 23–24 May 2011. [Google Scholar]
  51. Li, H. The Study of the Rock RHT Model and to Determine the Values of Main Parameters. Ph.D. Thesis, China University of Mining & Technology-Beijing, Beijing, China, 2016. [Google Scholar]
  52. Sanchidrian, J.A.; Castedo, R.; Lopez, L.M.; Segarra, P.; Santos, A.P. Determination of the JWL Constants for ANFO and Emulsion Explosives from Cylinder Test Data. Cent. Eur. J. Energ. Mat. 2015, 12, 177–194. [Google Scholar]
  53. Castedo, R.; Natale, M.; López, L.M.; Sanchidrián, J.A.; Santos, A.P.; Navarro, J.; Segarra, P. Estimation of Jones-Wilkins-Lee Parameters of Emulsion Explosives Using Cylinder Tests and Their Numerical Validation. Int. J. Rock Mech. Min. Sci. 2018, 112, 290–301. [Google Scholar] [CrossRef]
  54. Jung, W.J.; Utagawa, M.; Ogata, Y.; Seto, M.; Katsuyama, K.; Miyake, A.; Ogawa, T. Effects of Rock Pressure on Crack Generation during Tunnel Blasting. J. Japan Explos. Soc. 2001, 62, 138–146. [Google Scholar]
  55. Ben-Menahem, A.; Singh, S.J. Seismic Waves and Sources; Springer Science & Business Media: New York, NY, USA, 2012. [Google Scholar]
  56. Yang, J.; Lu, W.; Li, P.; Yan, P. Evaluation of Rock Vibration Generated in Blasting Excavation of Deep-Buried Tunnels. KSCE J. Civ. Eng. 2018, 22, 2593–2608. [Google Scholar] [CrossRef]
Figure 1. Conceptual model of multiple-hole blasting under in situ stress.
Applsci 12 09146 g001
Figure 2. Schematic diagram of the coupled SPH-FEM method.
Applsci 12 09146 g002
Figure 3. Illustration of the RHT constitutive model.
Applsci 12 09146 g003
Figure 4. Numerical modeling of rock fracture caused by single-hole blasting: (a) without initial stress; (b) with a uniaxial stress of 5 MPa.
Applsci 12 09146 g004
Figure 5. Numerical model of the multiple-hole blasting in the circular tunnel excavation (unit: m).
Applsci 12 09146 g005
Figure 6. Distributions of the fractured zones caused by blasting under varied hydrostatic in situ stress levels: (a) σx = σy = 0 MPa; (b) σx = σy = 10 MPa; (c) σx = σy = 30 MPa; (d) σx = σy = 60 MPa.
Applsci 12 09146 g006
Figure 7. Blasting seismic efficiency variation with in situ stress levels.
Applsci 12 09146 g007
Figure 8. Regression analysis of blasting seismic energy attenuation with distance under varied hydrostatic in situ stress levels.
Applsci 12 09146 g008
Figure 9. Distribution of the fractured zone caused by blasting under a non-hydrostatic in situ stress condition σx = 3σy = 30 MPa.
Applsci 12 09146 g009
Figure 10. Regression analysis of seismic energy density attenuation with distance under non-hydrostatic in situ stress conditions: (a) σx = 2σy = 20 MPa; (b) σx = 3σy = 30 MPa.
Applsci 12 09146 g010
Figure 11. Layout of the CJPL and cross-section of No. 4 experimental cavern (unit: m).
Applsci 12 09146 g011
Figure 12. Arrangements of monitoring for blast-induced seismic waves (unit: m).
Applsci 12 09146 g012
Figure 13. Regression analysis of seismic energy attenuation with distance along the monitoring points at different depths.
Applsci 12 09146 g013
Table 1. RHT model parameters for marble.
TypeParameterValueParameterValue
Basic parametersMass density (kg/m3)2700Relative tensile strength0.10
Shear modulus (GPa)8.0Relative shear strength0.25
Compressive strength (MPa)48.0
Strength parametersFailure surface parameter A1.65Tensile yield surface parameter0.70
Failure surface parameter N0.56Shear modulus reduction factor0.44
Lode angle dependence factor Q00.70Minimum damaged residual strain0.01
Lode angle dependence factor BQ0.0105Residual surface parameter B1.59
Compressive yield surface parameter0.78Residual surface parameter M0.62
Damage parametersDamage parameter D10.0037Damage parameter D21
Strain rate parametersReference compressive strain rate (s−1)3.0 × 10⁻⁵Break tensile strain rate (s−1)3.0 × 1025
Reference tensile strain rate (s−1)3.0 × 10⁻⁶Compressive strain rate dependence exponent0.024
Break compressive strain rate (s−1)3.0 × 1025Tensile strain rate dependence exponent0.029
EOS parametersInitial porosity1.078Hugoniot polynomial coefficient A2 (GPa)40.851
Porosity exponent4.000Hugoniot polynomial coefficient A3 (GPa)4.198
Crush pressure (GPa)0.016Parameter for polynomial EOS B00.900
Compaction pressure (GPa)0.800Parameter for polynomial EOS B10.900
Gruneisen gamma0Parameter for polynomial EOS T1 (GPa)45.390
Hugoniot polynomial coefficient A1 (GPa)45.390Parameter for polynomial EOS T2 (GPa)0
Table 2. Seismic energy attenuation indexes and seismic Q under varied hydrostatic in situ stress levels.
In Situ Stress Levels (Mpa)Energy Attenuation IndexSeismic Q
00.094082
100.0729102
200.0597116
300.0443120
400.057898
600.064890
Publisher’s Note: MDPI stays neutral with regard to jurisdictional claims in published maps and institutional affiliations.

