Article

Determination of Seed Volume Based on Selected Seed Dimensions

Department of Heavy Duty Machines and Research Methodology, University of Warmia and Mazury in Olsztyn, Oczapowskiego 11, 10-719 Olsztyn, Poland
*
Author to whom correspondence should be addressed.
Appl. Sci. 2022, 12(18), 9198; https://doi.org/10.3390/app12189198
Submission received: 17 August 2022 / Revised: 9 September 2022 / Accepted: 13 September 2022 / Published: 14 September 2022
(This article belongs to the Special Issue Innovative Solutions for Intelligent and Sustainable Machinery)

Abstract

:
The volume coefficient, which denotes a simple relationship between selected seed dimensions and seed volume, can be used to facilitate volume calculations in individual seeds, in particular in species with a complex seed shape. For this reason, seed thickness, width, and length were measured in nine species of forest trees and shrubs. The volume of seeds belonging to each plant species was determined by pycnometry, and the results were used to calculate 10 volume coefficients based on different combinations of basic seed dimensions. The calculated coefficients had different values, and they were lowest when volume was determined based on the cube of seed length and highest when volume was determined based on the cube of seed thickness. In a formula based on all three basic dimensions, the calculated volume coefficient ranged from 0.376 to 0.537, and Cornus macrophylla, Picea abies, and Cornus sanguinea seeds most closely resembled an ellipsoid. When seed volume was determined with the use of two basic dimensions, formulas based on the square of the smaller dimension produced somewhat smaller errors in individual seeds. In turn, seed thickness should be used in formulas that rely on a single dimension. Seed volume coefficients were most strongly correlated with the sphericity index, which indicates that this parameter can be used to estimate their values. The sphericity index was most strongly correlated with volume coefficients; the strongest correlations were observed for volume coefficients calculated based on the square of the seed length and seed width, and the cube of the seed length.

1. Introduction

Seeds constitute a large group of products that are processed and handled in agriculture and forestry, and in the food and transport industries. The physical properties of seeds influence operations such as sowing, harvest, storage, and transport. A thorough knowledge of the properties of the processed material is required to design technological and industrial operations [1,2]. Seed volume is one such property, and it is used to divide seed batches into size classes. Seed volume plays a very important role in planning seed drying [3,4], coating, dressing, and scarification operations [5,6].
The characteristics of the processed granular material, including the volume of individual particles, have to be reliably determined before planning a research study. Particle volume affects the behavior of the entire batch of granular material. Three groups of methods are generally used to determine the volume of particles, including the seeds of crops, forest trees, and shrubs. In the first method, seed dimensions are measured, and seed shape is described with the use of simple geometric figures, such as a sphere, a spheroid, or a cylinder [6,7,8,9]. The measured dimensions are substituted into general mathematical equations to calculate seed volume. The volume of seeds with a complex shape is determined with the use of parametric equations. A model of the corresponding geometric figure is built and used to calculate the seed parameters [10,11,12,13]. The second group of methods relies on digital images and image-processing software to elicit information about the geometric properties of seeds [14,15,16,17,18,19,20]. An image provides two-dimensional information about the examined particle. To calculate the third dimension, the seed is rotated by 90° and an additional image is captured, or a system of mirrors is used to acquire two projections in an image. Multiple cross-sections of the analyzed particle embedded in a fixing material can also be photographed, and the resulting images can be used to build a 3D model [21,22] to determine the particle volume. In the third group of methods, 3D scanners are used to generate a 3D model of the examined object [23,24,25,26]. The model can be used to measure the geometric parameters of a particle, including its external dimensions and volume. However, this approach is laborious and time-consuming, and it requires specialist equipment and image processing software. The scanned object has to be fixed to a rotating stage with the use of glue or a pin. In a virtual model, glue and pins have to be removed, and the surface of the object at the point of attachment has to be modified.
Most research studies rely on the first method, which is the easiest to use. In this approach, the basic geometric parameters of seeds have to be determined. The shape of the analyzed seed cannot always be described with a simple geometric figure, which is why the volume coefficient k is often calculated [8]. The volume coefficient is determined with the use of a glass pycnometer based on the relationship between the volume of liquid displaced by seeds and the reference volume of seeds. The reference volume of seeds is determined on the assumption that individual seeds are cuboids whose size is described by the measured parameters. Depending on the number of the measured dimensions, seed volume V can be calculated with one of the below equations:
V = k · a · b · c
V = k · a · b 2
V = k · a 3
where a, b, and c are the basic dimensions of a seed, measured perpendicular to each other, and the volume coefficient k has a different value in each equation. In this formula, seed shape does not have to be determined, and a corresponding geometric figure for mathematical calculations does not have to be selected. However, the process of calculating the seed volume coefficient is relatively laborious because at least one seed dimension has to be measured in a large batch of seeds of a given species. The following research question was thus formulated: is the seed volume coefficient correlated with the parameters describing seed shape or size? Therefore, the aim of the study was to calculate seed volume coefficients with the use of formulas involving selected seed dimensions, and to determine the correlations between the volume coefficients and the shape factors of seeds.

2. Materials and Methods

2.1. Sample Preparation

The seeds of nine tree and shrub species (Figure 1) were acquired in 2012–2018 from three sources in Poland: Dendrona in Pęcice, Florpak in Końskowola (supplier of tree, shrub, perennial and annual herb seeds), and the Seed Extraction Plant in Jedwabno (Table 1). These companies are members of the Polish Seed Trade Association, and they purchase seeds from reputable foreign companies and regular domestic suppliers. The selected tree and shrub species differed in the average sphericity index. The sphericity index is defined in subsequent parts of the article. Seed surfaces were cleaned, and seed coat remnants were removed whenever needed.
The seeds of every tree and shrub species were sampled from seed batches of around 100 g each. Seed samples were obtained by halving. The seeds were spread on a flat surface; the batch was split into two equal parts, and one part was randomly selected for further division [27]. The halving process was repeated until around 100 seeds of every species were obtained per sample. The resulting samples were composed of 105 to 119 seeds each (Table 1).

2.2. Physical Parameters of Seeds

The basic seed parameters were measured in three perpendicular directions with the use of the MWM 2325 (PZO, Warszawa, Poland) laboratory microscope and a dial indicator thickness gauge designed by the authors. Seed parameters were determined to the nearest 0.01 mm with the use of both devices.
Seed length L and width W were determined in the first step of the procedure. Seeds were placed on a transparent slide with the long axis parallel to the slide. The plate was placed on the microscope stage whose position was adjusted with the Y knob until the crosshair in the reticle was aligned with one end of the seed contour. The position of the seed contour was recorded. The stage was then moved until the crosshair in the reticle was aligned with the other end of the seed contour. The position of the seed contour was recorded. Seed length L was defined as the absolute difference between the two measurements. Seed width W was determined without changing the seed’s position on the slide, and the above procedure was repeated by moving the microscope stage with the X knob. Seed thickness T was determined with the dial indicator gauge. The gauge was calibrated, the seed was placed between flat contact points parallel to the contact surface, and seed thickness was read from the dial indicator. The same procedure was applied to measure the seeds of all analyzed plant species.
The geometric mean diameter D, the aspect ratio R, and the sphericity index Φ were calculated based on the measured seed dimensions [28]:
D = T · W · L 3
R = W L
Φ = D L
The sphericity index Φ equals 1 in spherical particles (where all dimensions are equal), and it is smaller than 1 in seeds modeled by other geometric figures.
The volume Vp of all seeds in a given sample was determined with a 25 cm3 glass pycnometer with a capillary tube and a thermometer. The pycnometer was filled with distilled water. The following parameters were determined: seed mass (m1), the mass of the pycnometer filled with distilled water (m2), and the mass of the pycnometer containing the seeds of each plant species after excess water had been removed (m3). Seeds were weighed on the WAA 100/C/2 laboratory scale (RADWAG Radom, Poland) to the nearest 0.1 mg. The total seed volume Vp of every plant species was determined with the use of Equation (7) by summing up all three mass measurements and dividing them by the density ρ of distilled water:
V p = m 1 + m 2 m 3 ρ
Seed volume coefficients were calculated with the use of the below equations based on seed volume Vp and seed dimensions (T, W, and L) in each plant species (with n seeds per sample):
k 0 = V p ( L · W · T )
k 1 = V p ( L 2 · W )
k 2 = V p ( L 2 · T )
k 3 = V p ( W 2 · L )
k 4 = V p ( W 2 · T )
k 5 = V p ( T 2 · L )
k 6 = V p ( T 2 · W )
k 7 = V p L 3
k 8 = V p W 3
k 9 = V p T 3
Seed volume V of each plant species was calculated with the following equation:
V = k 0 · L · W · T
Since not all seed dimensions are always known, seed volume can also be calculated with one of the following formulas:
V 1 = k 1 · L 2 · W
V 2 = k 2 · L 2 · T
V 3 = k 3 · W 2 · L
V 4 = k 4 · W 2 · T
V 5 = k 5 · T 2 · L
V 6 = k 6 · T 2 · W
V 7 = k 7 · L 3
V 8 = k 8 · W 3
V 9 = k 9 · T 3
The error in seed volume calculations involving Equations (19)–(27) was determined relative to volume V (Equation (18)) as the most accurate value, and the following formula was applied:
d i = | V i V | V · 100
where i ranges from 1 to 9.

2.3. Statistical Analysis

The measured seed parameters were analyzed statistically in Statistica PL (v. 13.3, StatSoft Polska Sp. z o.o., Kraków, Poland) at a significance level of α = 0.05. The differences in the evaluated parameters were determined by one-way analysis of variance (ANOVA). The normal distribution in groups was checked with the Shapiro–Wilk test, and the homogeneity of variance was determined with Levene’s test. Homogeneous groups were identified with Tukey’s multiple range test. The strength of the relationships between seed attributes was evaluated based on the values of correlation coefficients, and the functions describing these correlations were determined in a regression analysis. Statistical functions were tested, but significant differences in the coefficient of determination were not observed, and only linear regressions were presented in the article.

3. Results and Discussion

3.1. Experimental Material

The accuracy with which the average geometric parameters of seeds are measured is determined by the standard error of the estimate [29], which is calculated based on sample size, the standard deviation of the analyzed trait, and the Student’s t-distribution at a given level of significance. For the analyzed sample size (105 to 119 seeds) and the observed variations in seed dimensions, the standard error of the estimate for average seed dimensions did not exceed 0.1 mm.
The basic seed dimensions and the calculated indicators are presented in Table 2. The results of Shapiro-Wilk and Levene’s tests did not reveal non-normal distribution or heteroscedasticity. The sphericity index Φ ranged from 0.510 (Pseudotsuga menziesii (Mirb.) Franco) to 0.951 (Cornus macrophylla Wall.), and it differed significantly across the analyzed plant species. Considerable differences were also noted in the values of the aspect ratio, and the only homogeneous group was formed by the following pair of species: Cotoneaster horizontalis Decne. and Juniperus scopulorum Sarg. The aspect ratio was highest in Cornus macrophylla (0.960) and lowest in Pseudotsuga menziesii (0.504). Pseudotsuga menziesii had the longest seeds, with an average length of 6.93 mm, and a similar range of values (5–7 mm) was reported by Da Ronch et al. [30]. An analysis of average seed thickness and width revealed that Picea abies (L.) H. Karst. was characterized by the smallest seeds, whereas Cornus sanguinea L. was characterized by the largest seeds. Pseudotsuga menziesii seeds resembled Juniperus communis L. and Cotoneaster horizontalis seeds in terms of thickness. Two groups of species with a similar average seed length were identified: Juniperus communis, Juniperus scopulorum and Picea abies, and Cotoneaster horizontalis, Cornus macrophylla, and Picea abies. The following pairs of species formed homogeneous groups based on seed width: Picea abies and Juniperus communis, and Juniperus scopulorum and Tilia cordata Mill. Average seed volume ranged from 7.31 mm3 (Juniperus communis) to 54.87 mm3 (Cornus sanguinea). Similar values were reported by Ganhão and Dias [31]; therefore, the analyzed seeds can be regarded as representative of the evaluated species. The following pairs of species formed homogeneous groups based on seed volume: Picea abies and Juniperus communis, and Juniperus scopulorum, Pseudotsuga menziesii, and Tilia cordata. In general, similar variations in the dimensions of the analyzed seed species were given in the literature [31,32,33].

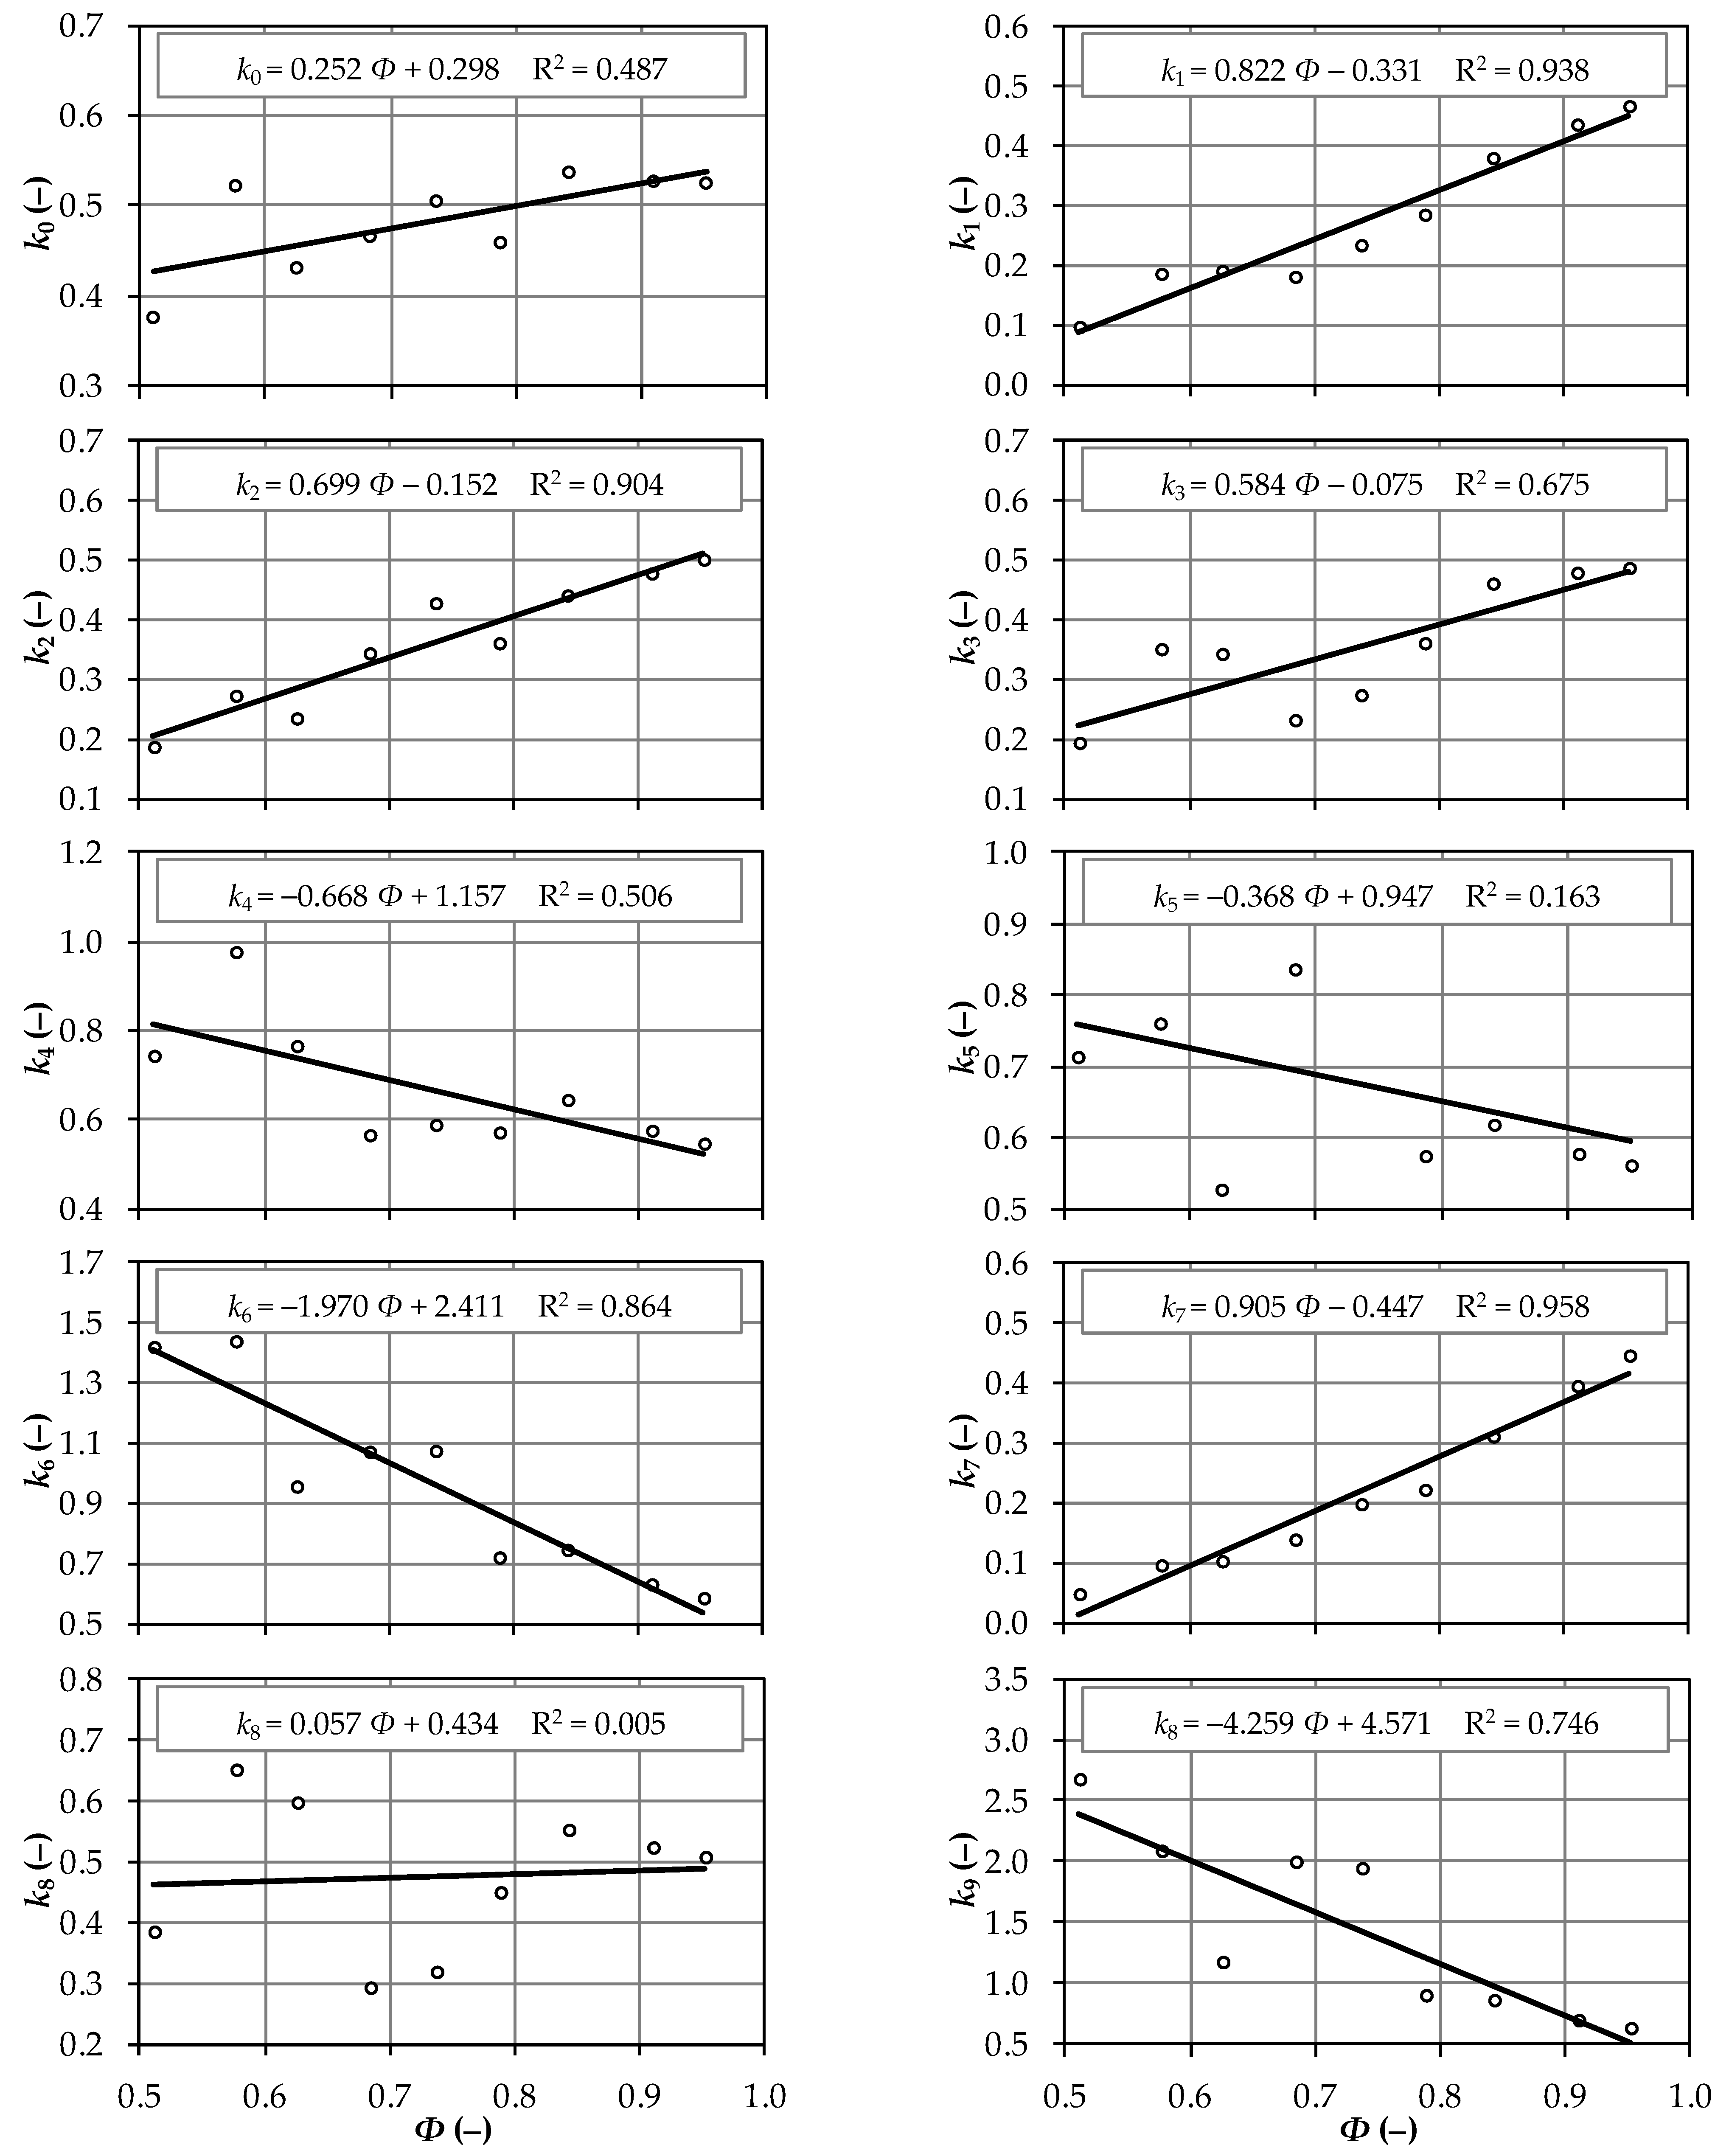
3.2. Coefficients of Seed Volume

The seed volume coefficients for the analyzed plant species are presented in Table 3. The value of this parameter, calculated with Equation (6), ranged from 0.376 (Pseudotsuga menziesii) to 0.537 (Tilia cordata). A typically ellipsoidal seed has a volume coefficient of π/6 = 0.524 [8]. The calculated volume coefficients indicate that Cornus macrophylla, Picea abies, and Cornus sanguinea have ellipsoidal seeds; therefore, the ellipsoid can be used as a model figure to determine the volume of seeds in these plant species. In this case, the error in seed volume calculations (the percentage of the product of the absolute difference between coefficient k0 and the volume coefficient of an ellipsoid relative to the volume coefficient of an ellipsoid) reached 0.27%, 0.31%, and 0.65%, respectively. The volume coefficient of Pseudotsuga menziesii seeds was least similar to that of an ellipsoid, and the error in seed volume calculations was very high at 39.25%. In the analyzed species, the remaining seed volume coefficients were determined within the following range of values:
  • k1—from 0.098 to 0.468,
  • k2—from 0.188 to 0.502,
  • k3—from 0.195 to 0.488,
  • k4—from 0.548 to 0.978,
  • k5—from 0.528 to 0.917,
  • k6—from 0.587 to 1.440,
  • k7—from 0.049 to 0.447,
  • k8—from 0.294 to 0.653,
  • k9—from 0.628 to 2.674.
Equation (17) produced the highest values, and Equation (15) produced the lowest values of the coefficient of seed volume, which can be directly attributed to the dimensions applied in the calculations (smallest and largest, respectively).

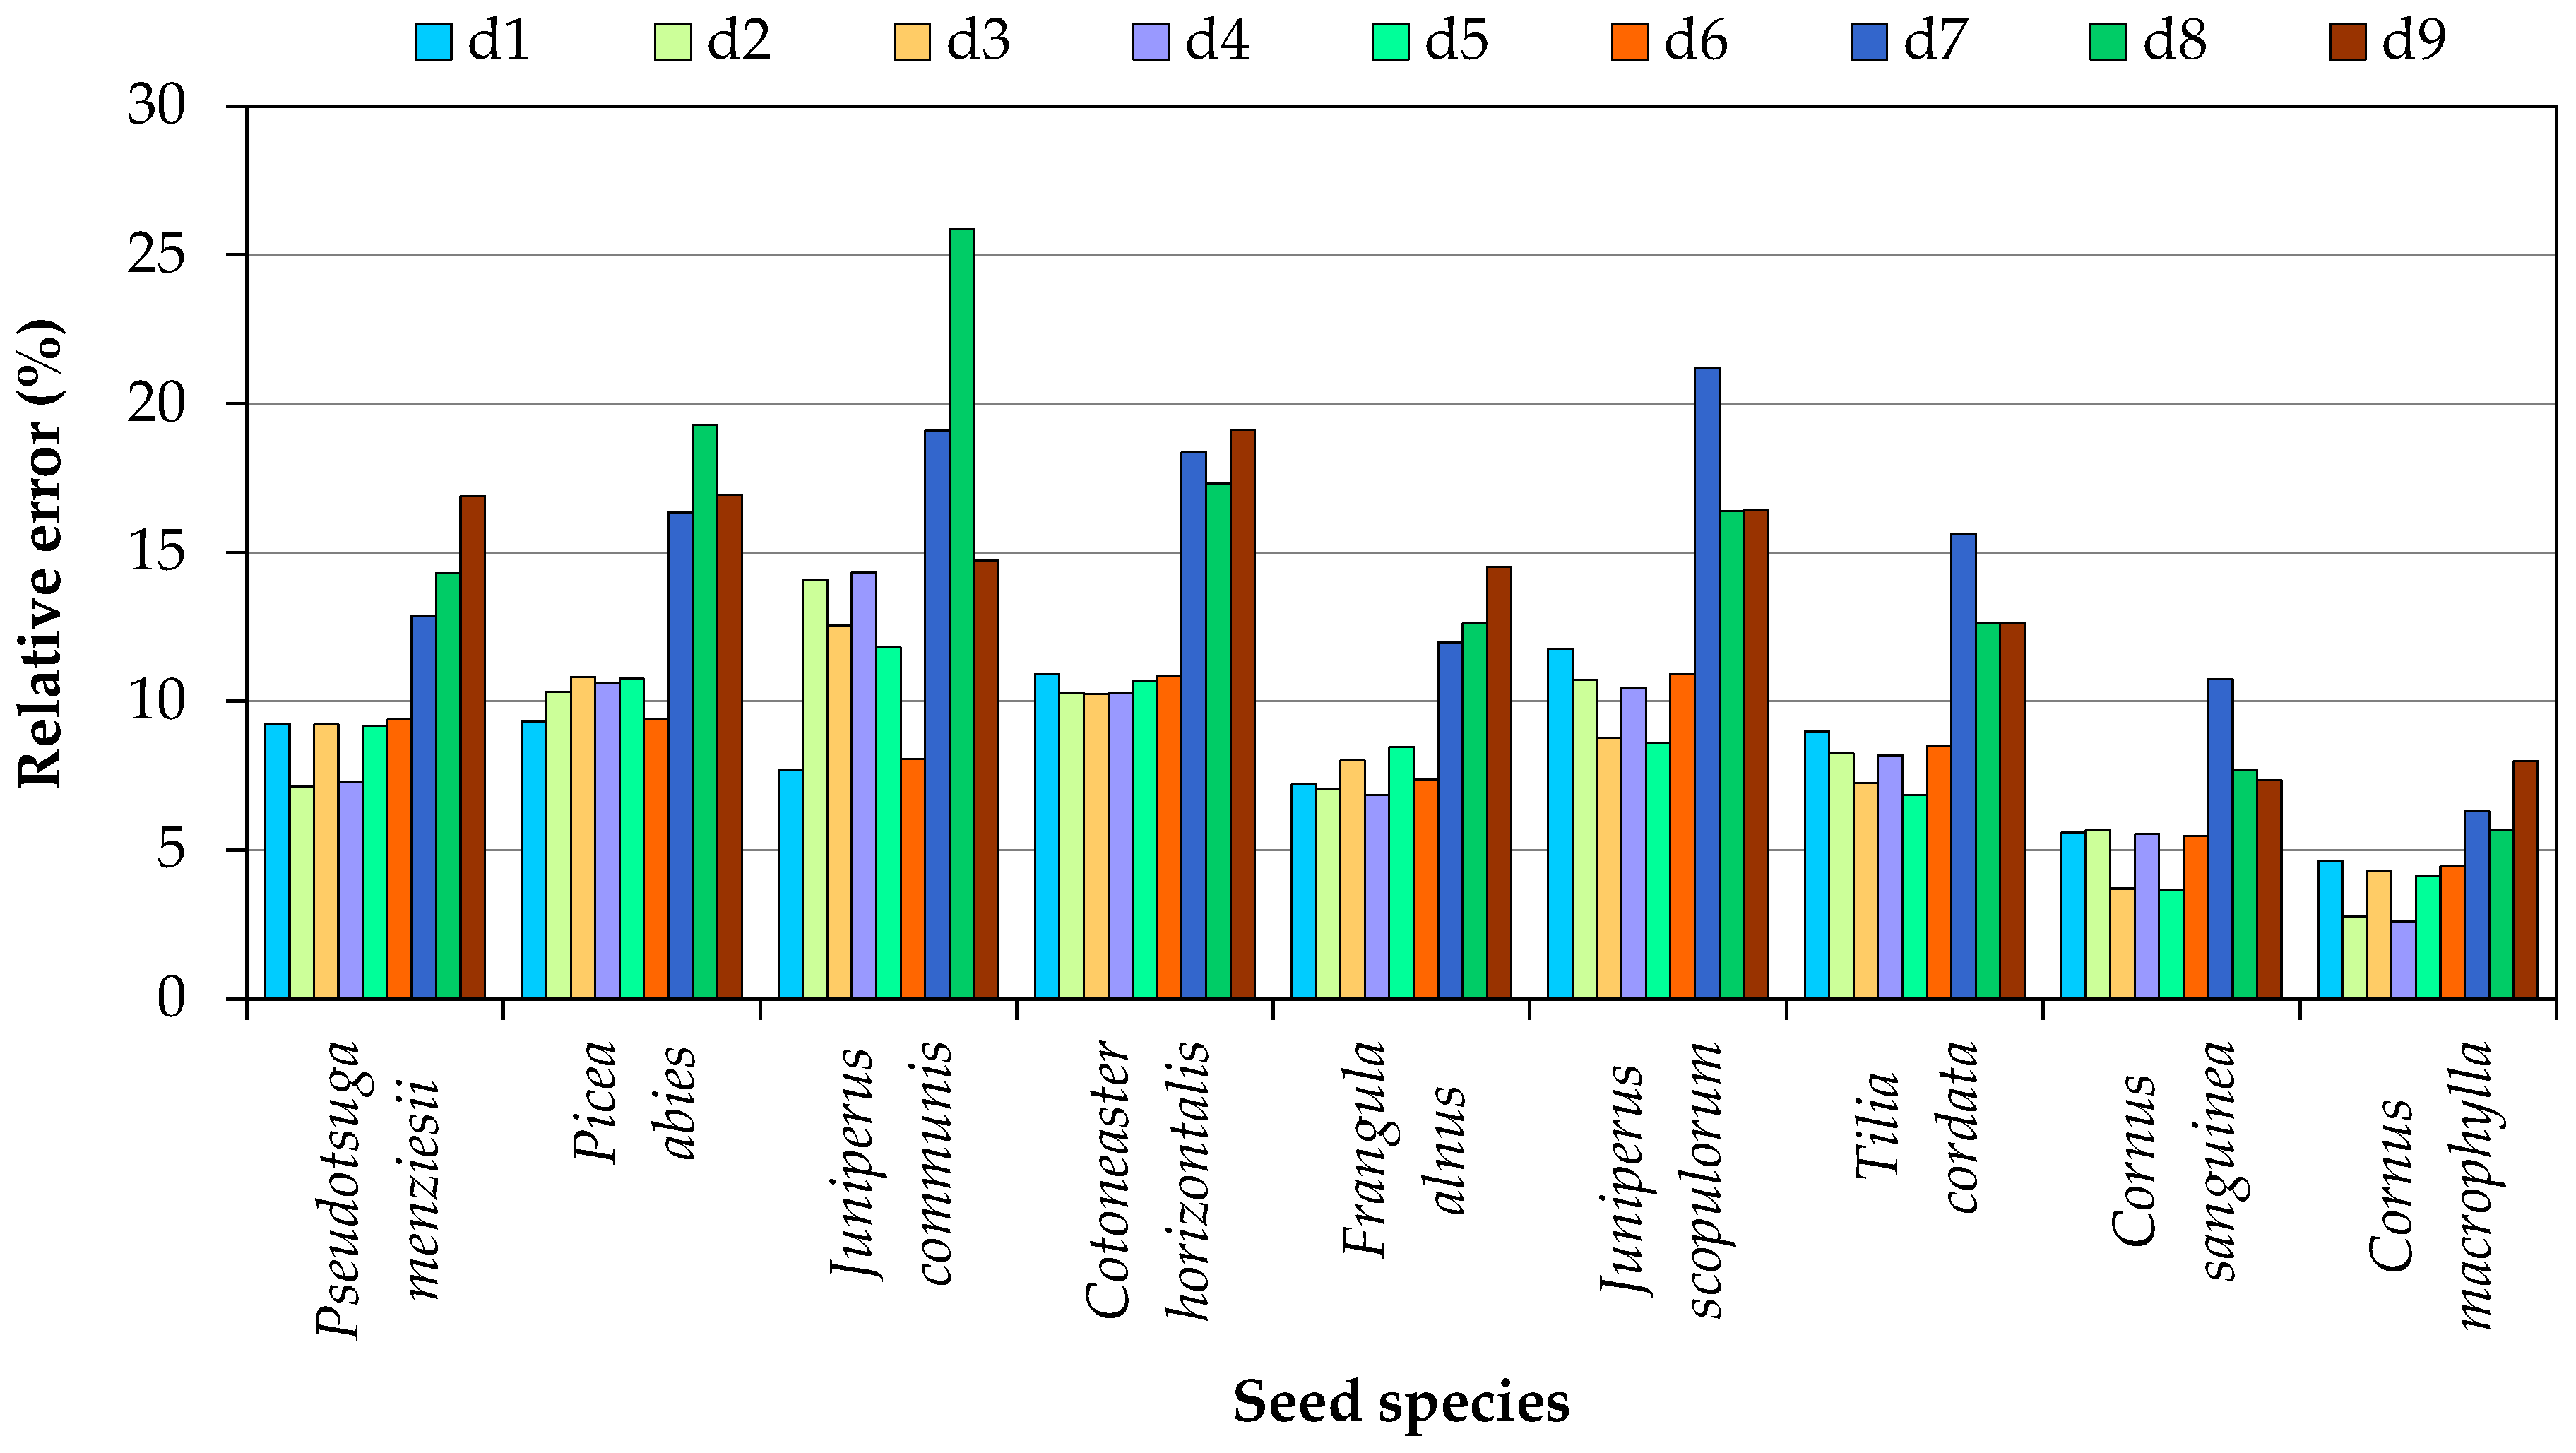
3.3. Error in Seed Volume Calculations

In the calculations of individual seed volume, the smallest potential error was generated by Equation (18), which is based on all three basic dimensions. For this reason, seed volume calculated with Equation (18) was regarded as the baseline value when determining errors in volume calculations based on two or one basic seed dimensions. Obviously, when the sample is large enough, total seed volume is similar regardless of the applied equation. However, the calculated volumes of individual seeds differ from the baseline value (they can be higher or lower than the baseline value), which can lead to certain errors. The mean error values in volume calculations involving simplified equations (based on two or one basic dimensions) are presented in Figure 2. Depending on the applied equation, the errors in seed volume calculations fall within the following ranges:
  • Pseudotsuga menziesii—from 7.3% to 16.9%,
  • Picea abies—from 9.3% to 19.3%,
  • Juniperus communis—from 7.7% to 25.9%,
  • Cotoneaster horizontalis—from 10.2% to 19.1%,
  • Frangula alnus Mill.—from 7.1% to 14.5%,
  • Juniperus scopulorum—from 8.6% to 21.2%,
  • Tilia cordata—from 6.9% to 15.6%,
  • Cornus sanguinea—from 3.7% to 10.8%,
  • Cornus macrophylla—from 2.7% to 8.0%.
When seed volume was calculated based on two basic dimensions, the smallest error (2.7%) was noted in Cornus macrophylla (d2—formula based on the product of the square of seed length and seed thickness), and the greatest error (14.3%) was noted in Juniperus communis (d4—formula based on the product of the square of seed width and seed thickness). Therefore, volume should be calculated with the use of Formula (17) for Picea abies and Juniperus communis seeds, Formula (18) for Frangula alnus and Cornus macrophylla seeds, formula 19 for Cotoneaster horizontalis seeds, and Formula (21) for Juniperus scopulorum, Tilia cordata and Cornus sanguinea seeds. The mean error in seed volume calculations based on two basic dimensions was similar regardless of the applied formula, and the smallest error (8.2%) was noted for the equation based on the product of the square of seed thickness and seed length, whereas the greatest error (8.5%) was noted for the equation based on the product of the square of seed length and seed thickness. Somewhat smaller errors was observed when the volume of an individual seed was determined using equations based on the square of the smaller dimension (Formulas (21), (23), and (24)). The error was greater for volume calculations based on one basic dimension than two dimensions, and its mean value ranged from 14.1% to 14.7% in the seeds of all analyzed species. The smallest error was noted when the volume of Pseudotsuga menziesii, Picea abies, and Frangula alnus seeds was determined with Formula (23); when the volume of Cotoneaster horizontalis, Juniperus scopulorum, Tilia cordata, and Cornus macrophylla seeds was calculated with Formula (24); and when the volume of Juniperus communis and Cornus sanguinea seeds was calculated with Formula (25).

3.4. Correlation Coefficients

The correlation coefficients describing the relationship between seed volume coefficient vs. seed dimensions and shape factors are presented in Table 4. The calculated correlation coefficients were statistically significant (minimum 0.666) in 22 out of 60 comparisons, and the absolute value of the correlation coefficient was highest in a comparison of seed volume coefficient k7 and the sphericity index. In turn, the correlation coefficient was lowest in a comparison of seed volume coefficient k8 and the geometric mean diameter. In the group of basic dimensions, seed volume coefficients were most strongly correlated with average seed thickness. However, in most cases (8 out of 10), significant correlations were found between seed volume coefficients and the sphericity index. The sphericity index was the only parameter that was significantly correlated with seed volume coefficients k0 and k4. This suggests that formulas based on the sphericity index should be used in calculations when the seed volume coefficient in a given plant species is unknown.
The relationships between the sphericity index, the volume coefficients of seeds, and linear regression equations are presented in Figure 3. The coefficient of determination was highest for seed volume coefficient k7, followed by seed volume coefficient k1, although high values of this parameter were also noted for seed volume coefficients k2 and k6. These observations suggest that the seed volume coefficient of a new species can be predicted based on the average seed shape factor. Seed volume coefficient k8 will be predicted least accurately. Very strong correlations in the range of 0.9 < r < 0.96 were observed in only 3 out of 10 cases, which confirms the high natural variability of seeds belonging to different plant species [18,34].

4. Conclusions

The volume of an individual seed of a given plant species can be determined based on one, two, or three basic dimensions and the calculated seed volume coefficient. The seed volume coefficient was lowest when seed volume was calculated based on seed length only (0.049 to 0.447), and it was highest when seed volume was determined based on seed thickness only (0.628 to 2.674).
Seed volume can be most accurately determined with the use of the formula based on all three basic dimensions and a seed volume coefficient in the range of 0.376 (Pseudotsuga menziesii) to 0.537 (Tilia cordata). The volume coefficients of Cornus macrophylla (0.525), Picea abies (0.522), and Cornus sanguinea (0.527) seeds are most similar to the volume coefficient of an ellipsoid (0.524).
When the volume of individual seeds was calculated with simplified formulas, the mean error ranged from 2.7% to 14.3% when two basic seed dimensions were used and from 5.6% to 25.9% when only one basic seed dimension was used. Seed volume can be most accurately determined with the formula based on the square of seed thickness and seed length when two dimensions are used, and with the formula based on the cube of seed thickness when only one dimension is used.
Seed volume coefficients are most strongly correlated with the sphericity index; therefore, the sphericity index can be used to estimate volume coefficients when pycnometric measurements are not performed. In such a case, the sphericity index can be estimated based on the basic dimensions of a relatively small number of seeds. Seed volume coefficients can be most accurately determined with the use of equations based on the square of seed length and seed width, and the cube of seed length.

Author Contributions

Conceptualization, Z.K.; methodology, Z.K.; software, Z.K.; validation, Z.K.; formal analysis, Z.K., D.C. and A.L.; investigation, Z.K.; resources, Z.K.; data curation, Z.K.; writing—original draft preparation, Z.K.; writing—review and editing, Z.K., D.C. and A.L; visualization, Z.K.; supervision, Z.K.; project administration, Z.K.; and funding acquisition, D.C. All authors have read and agreed to the published version of the manuscript.

Funding

This research was financed by the Ministry of Science and Higher Education of the Republic of Poland.

Institutional Review Board Statement

Not applicable.

Informed Consent Statement

Not applicable.

Data Availability Statement

The datasets used and/or analyzed during the current study available from the corresponding author on reasonable request.

Acknowledgments

The authors would like to thank Aleksandra Poprawska for the English-language editing and proofreading of this manuscript.

Conflicts of Interest

The authors declare no conflict of interest.

References

  1. Boac, J.M.; Casada, M.E.; Maghirang, R.G.; Harner, J.P., III. Material and interaction properties of selected grains and oilseeds for modeling discrete particles. Trans. ASABE 2010, 53, 1201–1216. [Google Scholar] [CrossRef]
  2. Sologubik, C.A.; Campañone, L.A.; Pagano, A.M.; Gely, M.C. Effect of moisture content on some physical properties of barley. Ind. Crops Prod. 2013, 43, 762–767. [Google Scholar] [CrossRef]
  3. Gastón, A.L.; Abalone, R.M.; Giner, S.A. Wheat drying kinetics. Diffusivities for sphere and ellipsoid by finite elements. J. Food Eng. 2002, 52, 313–322. [Google Scholar] [CrossRef]
  4. Vizcarra Mendoza, M.G.; Martínez Vera, C.; Caballero Domínguez, F.V. Thermal and moisture diffusion properties of amaranth seeds. Biosyst. Eng. 2003, 86, 441–446. [Google Scholar] [CrossRef]
  5. Pedrini, S.; Merritt, D.J.; Stevens, J.; Dixon, K. Seed coating: Science or marketing spin? Trends Plant Sci. 2017, 22, 106–116. [Google Scholar] [CrossRef] [PubMed]
  6. Anders, A. Metody Wyznaczania Geometrycznych Parametrów Nasion (Determination of the Geometric Parameters of Seeds with Different Methods); University of Warmia and Mazury in Olsztyn: Olsztyn, Poland, 2019. (In Polish) [Google Scholar]
  7. Koc, A.B. Determination of watermelon volume using ellipsoid approximation and image processing. Postharvest Biol. Technol. 2007, 45, 366–371. [Google Scholar] [CrossRef]
  8. Kaliniewicz, Z.; Tylek, P.; Markowski, P.; Anders, A.; Rawa, T.; Zadrożny, M. Determination of shape factors and volume coefficients of seeds from selected coniferous trees. Tech. Sci. 2012, 15, 217–228. [Google Scholar]
  9. Dias, L.S.; Dias, A.S. The relationship between shape and size of diaspores depends on being seeds or fruits. Horticulturae 2019, 5, 65. [Google Scholar] [CrossRef]
  10. Mabille, F.; Abecassis, J. Parametric modelling of wheat grain morphology: A new perspective. J. Cereal Sci. 2006, 37, 43–53. [Google Scholar] [CrossRef]
  11. Keefe, R.F.; Davis, A.S. Modeling individual conifer seed shape as a sum of fused partial ellipsoids. Can. J. For. Res. 2010, 40, 2175–2186. [Google Scholar] [CrossRef]
  12. Mieszkalski, L. The method of mathematical modeling of the triticale grain shape with Bézier surface patches. Agric. Eng. 2013, 2, 225–233. [Google Scholar]
  13. Cervantes, E.; Gómez, J.J.M. Seed shape description and quantification by comparison with geometric models. Horticulturae 2019, 5, 60. [Google Scholar] [CrossRef] [Green Version]
  14. Abalone, R.; Cassinera, A.; Gastón, A.; Lara, M.A. Some physical properties of amaranth seeds. Biosyst. Eng. 2004, 89, 109–117. [Google Scholar] [CrossRef]
  15. Tańska, M.; Rotkiewicz, D.; Kozirok, W.; Konopka, I. Measurement of the geometrical features and surface color of rapeseeds using digital image analysis. Food Res. Int. 2005, 38, 741–750. [Google Scholar] [CrossRef]
  16. Ercisli, S.; Sayincib, B.; Karab, M.; Yildiz, C.; Ozturk, I. Determination of size and shape features of walmut (Juglans regia L.) cultivars using image processing . Sci. Hortic. 2012, 133, 47–55. [Google Scholar] [CrossRef]
  17. Tylek, P. Size and shape as separation properties of pedunculate oak seeds (Quercus robur L.). Acta Agrophys. 2012, 19, 673–687. [Google Scholar]
  18. Cervantes, E.; Martín, J.J.; Saadaoui, E. Updated methods for seed shape analysis. Scientifica 2016, 2016, 5691825. [Google Scholar] [CrossRef]
  19. Martín-Gómez, J.J.; Rewicz, A.; Goriewa-Duba, K.; Wiwart, M.; Tocino, Á.; Cervantes, E. Morphological description and classification of wheat kernels based on geometric models. Agronomy 2019, 9, 399. [Google Scholar] [CrossRef]
  20. Gierz, Ł.; Markowski, P.; Chmielewski, P. Validation of an image-analysis-based method of measurement of the overall dimensions of seeds. J. Phys. Conf. Ser. 2021, 1736, 012007. [Google Scholar] [CrossRef]
  21. Frączek, J.; Wróbel, M. Methodic aspects of seed shape assessment. Agric. Eng. 2006, 12, 155–163. [Google Scholar]
  22. Weres, J. Information system for acquiring data on geometry of agricultural products exemplified by a corn kernel. Agric. Eng. 2010, 7, 229–235. [Google Scholar]
  23. Uyar, R.; Erdoğdu, F. Potencial use of 3-dimensional scanners for food process modeling. J. Food Eng. 2009, 93, 337–343. [Google Scholar] [CrossRef]
  24. Polo, M.E.; Felicísimo, A.M. Analysis of uncertainty and repeatability of a low-cost 3D laser scanner. Sensors 2012, 12, 9046–9054. [Google Scholar] [CrossRef]
  25. Anders, A.; Markowski, P.; Kaliniewicz, Z. The application of a 3D scanner for the evaluation of geometric properties of Cannabis sativa L. seeds. Acta Agrophys. 2014, 21, 391–402. [Google Scholar]
  26. Bagheri, G.; Bonadonna, C.; Manzella, I.; Vonlanthen, P. On the characterization of size and shape of irregular particles. Powder Technol. 2015, 270, 141–153. [Google Scholar] [CrossRef]
  27. Załęski, A. Nasiennictwo Leśnych Drzew i Krzewów Iglastych (Management of Coniferous Forest Trees and Shrubs for Seed Production); Oficyna Edytorska “Wydawnictwo Świat”: Warszawa, Poland, 1995; pp. 117–121. (In Polish) [Google Scholar]
  28. Mohsenin, N.N. Physical Properties of Plant and Animal Materials; Gordon and Breach Science Public: New York, NY, USA, 1986. [Google Scholar]
  29. Greń, J. Statystyka Matematyczna: Modele i Zadania (Mathematical Statistics: Models and Tasks); PWN: Warszawa, Poland, 1984. (In Polish) [Google Scholar]
  30. Da Ronch, F.; Caudullo, G.; de Rigo, D. Pseudotsuga menziesii in Europe: Distribution, habitat, usage and threats. In European Atlas of Forest Tree Species; San-Miguel-Ayanz, J., de Rigo, D., Caudullo, G., Houston Durrant, T., Mauri, A., Eds.; Publication Office of the European Union: Luxembourg, 2016; p. e01a4f5. [Google Scholar]
  31. Ganhão, E.; Dias, L.S. Seed volume dataset—An ongoing inventory of seed size expressed by volume. Data 2019, 4, 61. [Google Scholar] [CrossRef] [Green Version]
  32. Adriaens, D.; Honnay, O.; Hermy, M. Does seed retention potential affect the distribution of plant species in highly fragmented calcareous grasslands. Ecography 2007, 30, 505–514. [Google Scholar] [CrossRef]
  33. Enescu, C.M.; Houston Durrant, T.; Caudullo, G.; de Rigo, D. Juniperus communis in Europe: Distribution, habitat, usage and threats. In European Atlas of Forest Tree Species; San-Miguel-Ayanz, J., de Rigo, D., Caudullo, G., Houston Durrant, T., Mauri, A., Eds.; Publication Office of the European Union: Luxembourg, 2016; p. e01d2de. [Google Scholar]
  34. Frączek, J.; Wróbel, M. Using computer graphics for 3D reconstruction of seeds. Agric. Eng. 2009, 6, 87–94. [Google Scholar]
Figure 1. Seeds of (a) Pseudotsuga menziesii (Mirb.) Franco, (b) Picea abies (L.) H. Karst., (c) Juniperus communis L., (d) Cotoneaster horizontalis Decne., (e) Frangula alnus Mill., (f) Juniperus scopulorum Sarg., (g) Tilia cordata Mill., (h) Cornus sanguinea L., and (i) Cornus macrophylla Wall.
Applsci 12 09198 g001
Figure 2. Errors in seed volume calculated with simplified formulas.
Applsci 12 09198 g002
Figure 3. Relationships between the sphericity index and seed volume coefficients.
Applsci 12 09198 g003
Table 1. Analyzed seed samples.
Seed SpeciesSourceNumber of Seeds
Douglas fir
(Pseudotsuga menziesii (Mirb.) Franco)
Florpak Sp. z o.o., Branch in Młynki, Końskowola118
Norway spruce
(Picea abies (L.) H. Karst.)
Seed extraction plant in Jedwabno114
Common juniper
(Juniperus communis L.)
Florpak Sp. z o.o., Branch in Młynki, Końskowola114
Wall spray
(Cotoneaster horizontalis Decne.)
Dendrona Sp. z o.o., Pęcice116
Alder buckthorn
(Frangula alnus Mill.)
Dendrona Sp. z o.o., Pęcice115
Rocky Mountain juniper
(Juniperus scopulorum Sarg.)
Dendrona Sp. z o.o., Pęcice105
Small-leaved lime
(Tilia cordata Mill.)
Seed Extraction Plant in Jedwabno118
Common dogwood
(Cornus sanguinea L.)
Florpak Sp. z o.o., Branch in Młynki, Końskowola119
Large-leaved dogwood
(Cornus macrophylla Wall.)
Florpak Sp. z o.o., Branch in Młynki, Końskowola116
Table 2. Mean values of the physical properties of seeds and the significance of differences.
Seed SpeciesL (mm)W (mm)T (mm)D (mm)R (–)Φ (–)V (mm3)
Pseudotsuga menziesii6.93 a3.48 d1.83 f3.53 c0.504 h0.510 i16.71 d
Picea abies4.21 de2.22 g1.52 g2.41 h0.531 g0.576 h7.49 f
Juniperus communis4.08 e2.24 g1.81 f2.54 g0.552 f0.625 g7.31 f
Cotoneaster horizontalis4.36 d3.38 e1.78 f2.96 f0.782 e0.683 f11.78 e
Frangula alnus4.70 c4.00 c2.20 e3.45 d0.853 c0.736 e20.99 c
Juniperus scopulorum4.10 e3.22 f2.55 d3.22 e0.789 e0.787 d15.74 d
Tilia cordata3.83 f3.17 f2.74 c3.21 e0.832 d0.842 c18.22 d
Cornus sanguinea5.15 b4.68 a4.26 a4.68 a0.909 b0.909 b54.87 a
Cornus macrophylla4.34 d4.16 b3.89 b4.13 b0.960 a0.951 a37.92 b
L—length, W—width, T—thickness, D—geometric mean diameter, R—aspect ratio, Φ—sphericity index, V—volume; and a…i—superscript letters denote significant differences between properties at p < 0.05 (Tukey’s test).
Table 3. Coefficients of seed volume.
Seed
Species
Coefficient of Seed Volume Calculated as:
L · W · T L 2 · W L 2 · T W 2 · L W 2 · T T 2 · L T 2 · W L 3 W 3 T 3
Pseudotsuga menziesii0.3760.0980.1880.1950.7450.7141.4210.0490.3862.674
Picea abies0.5220.1870.2740.3520.9780.7611.4400.0970.6532.085
Juniperus communis0.4310.1920.2360.3440.7670.5280.9580.1040.5991.171
Cotoneaster horizontalis0.4660.1820.3450.2330.5670.8371.0730.1400.2941.995
Frangula alnus0.5050.2350.4290.2750.5900.9171.0760.1990.3201.942
Juniperus scopulorum0.4590.2860.3620.3620.5730.5750.7220.2230.4510.898
Tilia cordata0.5370.3810.4420.4620.6460.6190.7470.3120.5540.858
Cornus sanguinea0.5270.4370.4790.4800.5770.5780.6330.3960.5250.693
Cornus macrophylla0.5250.4680.5020.4880.5480.5620.5870.4470.5090.628
L—length, W—width, and T—thickness.
Table 4. Correlations between seed volume coefficients vs. dimensions and indicators describing seed shape.
IndicatorsSeed Volume Coefficient
k0k1k2k3k4k5k6k7k8k9
L−0.627−0.374−0.429−0.4520.1180.0980.431−0.301−0.2770.529
W0.1670.5970.5350.454−0.512−0.352−0.5710.643−0.033−0.479
T0.5280.9230.8160.788−0.608−0.501−0.8230.9460.124−0.761
D0.2140.6840.5860.524−0.541−0.405−0.6040.735−0.022−0.503
R0.5490.8510.8050.762−0.600−0.465−0.8780.8450.161−0.850
Φ0.6980.9690.9510.822−0.711−0.404−0.9290.9790.070−0.864
k0…k9—seed volume coefficient (calculated with Formulas (8)–(17)), L—length, W—width, T—thickness, D—geometric mean diameter, R—aspect ratio, and Φ—sphericity index). Bold values denote significant correlations at 0.05.
Publisher’s Note: MDPI stays neutral with regard to jurisdictional claims in published maps and institutional affiliations.

