Abstract
To effectively analyze the safety risk of chemical enterprises and ensure the safety of production and management of enterprises, the contradiction problems in the process of index selection and risk early warning model in practical application are addressed. In this paper, extension engineering is introduced into the safety-security field of chemical enterprises to extract hidden useful information from the production environment and outdoor environment data and provide decision support for the managers of chemical enterprises. First, based on data preprocessing and extension analysis, the safety-security data of chemical enterprises that meet the quality requirements and can be efficiently mined are searched. Then, the outdoor environment is combined in the paper to conduct the mining of these data in two aspects: (1) comprehensive analysis and evaluation of data quality; (2) key factors affecting factory safety mining, realizing the safety-security evaluation of intelligent factories in chemical enterprises. Based on the proposed chemical factory safety extension prerisk model, the risk assessment of the safety status of a chemical enterprise in Hebei Province is carried out. The research results of this paper provide a theoretical basis for the safety production analysis of such chemical enterprises and put forward practical suggestions for preventing possible accidents in the production process.
1. Introduction
Industrial safety is an important guarantee technology for industrial upgrading to fully automated production of intelligent systems. Industrial accidents have their own characteristics; accidents are relatively rare compared with the whole life cycle of production, and the scope of consequences is large [1,2]. The characteristics of equipment reliability are not always the determining factors when assessing industrial safety risks; the industrial safety of complex processes is influenced by both external and internal factors [3,4]. During the production process, the geographical location, the quality of the raw materials, the weather conditions, unsafe conditions of the environment, the technological process, unsafe operation of personnel, the unsafe state of objects, and many other factors can cause negative phenomena. However, most of the raw materials and products of chemical enterprises are in flammable, explosive, toxic, and harmful states. These dangerous goods easily cause casualties and property losses in accidents [5,6]. Early detection of these factors is important to take timely preventive measures to prevent the occurrence of harm. To study the abnormal behavior of complex process systems, the mathematical modeling method is usually used, and the problem of studying various processes is simplified to the problem of studying the properties of mathematical models. Thus, the risk early warning model for the production process of chemical enterprises is established, and the massive data accumulated over the years in the chemical industry are used for risk early warning. Therefore, how to incorporate environmental factors in the production process into the safety assessment and provide safety-security assisted decision support for chemical enterprise managers has become an urgent problem to be solved in the safety-security field of intelligent factories.
Most of the existing factory risk assessment methods use index or probability evaluation [7,8,9]. The adoption of the index makes the system structure complex, and it is difficult to express that the evaluation of the risk unit has a feasible method using the probability. The evaluation method focuses on different production links and aspects that are not the same, and it is difficult to form a complete system. At the same time, although single factor and single index evaluation are widely used in a short time due to their simplicity and convenience, there are some shortcomings, such as insufficient comprehensive information and easy distortion, which cannot meet the increasingly strict and accurate requirements of chemical factory risk evaluation. In recent years, it has gradually developed from single factor and single index analysis to systematic comprehensive evaluation and examination direction. For the evaluation of complex dangerous environments, the most commonly used evaluation methods mainly include the comprehensive index method [10], set pair analysis method [11], fuzzy comprehensive evaluation method [12], neural network method [13], gray theory comprehensive evaluation method [14], and ICI Mond evaluation method [15]. The literature [7] established a security system dynamics model based on the methods of system dynamics. The model reflects the complex relationship among the safety factors of the storage and distribution station. The methods of system dynamics are used to model and analyze the relationship among the safety influencing factors. The literature [10] established the index system for coal mine safety assessment according to the influencing factors of coal mine safety: a comprehensive safety evaluation model for coal mine is built on the basis of analytic hierarchy process, and the effective safe management measures are proposed. The literature [11] built an evaluation and prediction model for occupational hazards in coal mines based on set pair analysis. The model uses three aspects of identity–discrepancy–contrast to study the relationship between uncertainty and certainty of a factor or event. The literature [12] established a quantitative risk assessment model of the third party damage based on analytic hierarchy process and fuzzy comprehensive evaluation. The weight of factors could be determined by improving the analytic hierarchy process, and the importance of each factor is calculated by fuzzy comprehensive evaluation model. The literature [13] proposed a 5M safety model by combination with the characteristics of the rail transit safety assessment, including complexity, dynamic, ambiguity, etc. The neural network method is used to dynamically evaluate railway safety. The application of gray numbers will improve the ability of decision-making models to respond to the ambiguity that arises from having incomplete information. The GM (1,1) model is constructed by using annual datasets of work-related deaths from five branches: mining and commercial casualties, highway traffic accidents, railway traffic accidents, fire disasters, and all fatal casualties [14]. The safety assessment of a waste incineration power plant is carried out by using Imperial Chemical Company (ICI, Kaohsiung, Taiwan) Mond fire and explosion index evaluation of toxicity. The difference between before and after compensation of the total risk coefficient R of different units in the plant is obtained [15]. Zhang et al. analyzed the evaluation method of the safety degree of chemical enterprises. A risk evaluation model of the coal chemical production process is established based on fuzzy comprehensive evaluation theory. It provides a theoretical basis for the safety production analysis of such coal chemical enterprises and puts forward practical suggestions for preventing accidents that may occur in the process of production [16]. Orsoni A. combined simulation and fuzzy logic techniques, considered the domino effect of possible unexpected events, and conducted a systematic risk assessment of the design and layout configuration specified for the plant handling hazardous substances. The design schemes are evaluated and compared quantitatively by the fuzzy method [17]. A mathematical model of the styrene production process function was established by using neural network technology. Based on the prediction results, some suggestions are put forward for the industrial safety assessment of special hazardous production processes [18]. Bozzano M. et al. combined system design activities with safety assessment and the methods used to help safety engineers realize the automation of some working stages to maintain an adequate level of safety [19]. Alanen J. et al. established a network security risk analysis method for industrial control systems. Based on the hybrid risk assessment ontology, security risk assessment management is carried out, and the method is successfully demonstrated [20]. However, most of the existing methods are greatly affected by subjective factors, such as the fuzzy comprehensive evaluation method [21,22]. Some are dependent on the quality and quantity of sample data, and the physical significance is not clear enough, such as the neural network method [23,24], and some are too complex to be calculated and go against popularization and application, such as the comprehensive index method. The most important step in the traditional evaluation method is determining the evaluation index and its weight; mostly, a single weighting method is used. The subjective weighting method is subjectively influenced by decision-makers and lacks objectivity. The objective weighting method ignores the difference in the importance of indicators to evaluation objects [25]. Therefore, we consider that the importance degree of different indicators is different in the actual evaluation work, and the evaluation of the importance of indicators will be affected by the subjective willingness of decision-makers. Meanwhile, the data collected by the production monitoring system are certain values and have some errors. These values are difficult to effectively describe the fuzzy, complex, and uncertain accident patterns of the system, and the states of these patterns usually fluctuate within a range.
To the best of our knowledge, there is no research on the impact of using extension engineering on the safety-security evaluation of the factory and the production environment of the workshop on personnel work [26,27,28,29,30]. Extension data mining uses an extension set as the basis of set theory, combined with extension methods and existing data mining methods, to mine knowledge based on extension transformation in a database or data warehouse, and the bases for decision-making and technical innovation in the economy, finance, management, marketing, planning, medicine, design, and other fields are provided [31,32]. Extenics is a new discipline established by scholars led by Cai Wen, Yang Chunyan, etc. It uses formal models to study the possibility of things’ expansion and the rules and methods of exploration and innovation, and it is also used to solve contradictory problems [33,34,35]. The core of extenics is transforming contradictory problems into compatible problems, and the key of extenics is determining the weight coefficient of the evaluation index. There are many contradictory problems in the real world, as in the production process of chemical enterprises as the chemical workshop wants to achieve higher production in the safest state. However, the production of more finished products requires the workshop and personnel to bear a large load, which can easily amplify the potential safety hazards. It also means that the warehouse needs to store a larger amount of finished products, and the possibility of damage is increased [36,37,38,39,40]. At the same time, due to the particularity and individual differences of actual production operations and working conditions, the production safety influencing factors of different workshops are not the same, so the parameter selection of workshop safety level evaluation is also different. In the specific production process, the parameter selection of safety factors and the evaluation index weight coefficient need to be determined by more objective and scientific methods. In this paper, the weight coefficient determined by the establishment of an analytic digital model is completely transformed into field monitoring data.
The safety evaluation of chemical plant (SECP) model proposed in this paper is an extension mathematical model driven by the real-time monitoring data and outdoor meteorological data of the production operation in the factory. It is used to solve the contradictions of production requirements and safety prevention and conduct regular safety evaluation of the production safety prevention in the chemical factory. In chemical plant security evaluation, data integrity, correctness, and consistency caused by measurement, calculation, packet loss, and human factors in the actual data input and collection process are greatly affected by data errors, incomplete information, and human subjective factors. Since hardware error cannot be avoided, it is difficult for the data measured in the industrial field to be an accurate value. It is a common phenomenon that the time series data collected by the on-site monitoring system of the enterprise have local fluctuations, and such fluctuations are often random. In terms of data collection, this may lead to data deviation, resulting in the distortion of the data in terms of reflecting the real world. That is, there is an uncertainty difference in the process of characterizing real-world production systems by using data, and this uncertainty will reduce the accuracy of the final safety evaluation results. This paper uses the chemical factory safety extension prerisk model to assess the process risk of chemical production systems. The uncertainty of the data can be well described by converting the observed values into interval data. The risk assessment of the production process using extension theory can relate the degree of risk to each influencing factor (including production factors and environmental factors). Through the multi-level index division, the risk degree of the joint action of the factory production equipment and the surrounding environment can be assessed to achieve the purpose of early warning. This paper first comprehensively analyzes and evaluates the data quality. It has good objectivity, fairness, and interpretability. The key point is selecting suitable examination evaluation index dimensions according to the application scenes. Second, because the sensor has certain errors in collecting data, the certainty numerical data are converted into uncertainty interval data to make the later training results more accurate, and the index weight is determined by the game theory comprehensive weighting method. Finally, the safety comprehensive evaluation is carried out by the uncertainty elementary dependent function in two nested regions.
The rest of the paper is organized as follows: Section 2 discusses the primitive representation of safety-security data of chemical enterprises. Section 3 provides a chemical factory safety extension prerisk model and discusses the details of the model. Section 4 presents the evaluation and analysis of safety and environmental data of each workshop in chemical enterprises. Section 5 discusses the evaluation results. Section 6 concludes the paper and discusses possible future works.
2. Primitive Representation of Safety-Security Data of Chemical Enterprises
SECP is a process of systematically collecting information according to the requirements of production objectives and safety principles, and the safety level of process monitoring and the production environment in the process of production operations are judged and evaluated. SECP includes workshop safety evaluation, hazard source risk assessment, toxicant analysis, employee self-assessment, and accident consequence simulation analysis. As real-time data monitoring of gas concentration in workshops and data collection of indoor and outdoor environment information are the main methods to obtain safety-security feedback information, they are also important ways to check the safety level and evaluate production safety and the environment. In this paper, the analysis and mining of the safety and environmental data of chemical industry (SEDCI) mainly aimed at real-time gas concentration data. The outdoor meteorological index data are used to assist in determining the daily risk and the suspected hazard source location, and then the workshop working condition data (noise, light, etc.) are combined for analysis, the value implied by these data is fully mined to further improve workshop safety and work quality. The following is the preparation stage of “workshop safety and environment evaluation data” and “factory outdoor meteorological data”, which are expressed in primitive form and divided into two steps: data selection and data preprocessing.
2.1. Data Selection
SECP indicators should be selected according to the actual production operation environment. Based on the results of field investigation, it is found that the working environment of the factory is complex, and the dangerous sources and dangerous situations are complex. Through investigation, screening, and confirmation with the field engineer, the indexes with smaller influencing factors are removed. Meanwhile, according to the following principles: (1) Principles of practicality and representativeness: practicability is the first principle and basic premise of constructing the early warning index system. There are many factors that cause accidents in chemical plants, and the problems involved are also very wide. People often choose many evaluation indicators in order to achieve a more comprehensive and accurate description of the research object. However, there are many factors that cannot reflect specific problems well. These indicators not only have great difficulties in quantification and operation but also may affect the accuracy of the evaluation results. Therefore, when establishing the early warning index system, it should have a certain representativeness so as to make the established early warning index more concise and easy to operate. In this paper, the indicators are screened according to the opinions of experts in the field, and a simple and easy-to-operate evaluation index system is established. (2) Principles of scientificity and systematicness: the indicators should be based on the prior knowledge of the field, and it should be able to objectively reflect the various factors that affect the production of chemical products of an enterprise and their interrelationships so as to accurately reveal the safety status of chemical enterprises. Early warning management involves all aspects of the safety management of chemical enterprises. The accuracy of early warning can be ensured only by comprehensively integrating and analyzing various risk factors and using a number of quantitative indicators to predict the risk degree of chemical production. (3) The principle of combining qualitative and quantitative aspects: quantitative indicators can reduce the influence of subjective factors and try to make the early warning objective and real. Due to the influencing factors being complex, it is sometimes difficult to accurately describe with numbers. Especially when the data are insufficient, qualitative indicators are particularly important, which can be used to identify a certain development trend of the stage. Therefore, it is necessary to consider these two indicators in the early warning. The following parameters are selected as the evaluation basis in this paper, as shown in Figure 1.
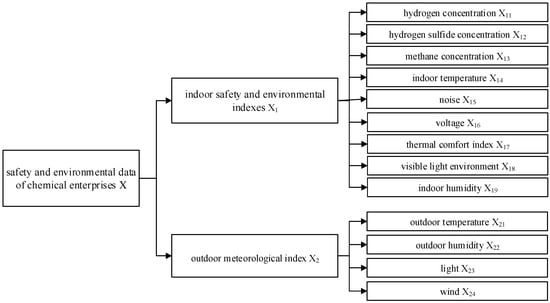
Figure 1.
SEDCI index screening and hierarchical division.
Based on the basic indicators of the workshop, the thermal comfort index and visible light environment are introduced to evaluate the influence of the working environment on the working state of employees in the workshop. Among them, the thermal comfort index is introduced to evaluate the thermal environment, and the thermal comfort index refers to the comprehensive reflection of various factors of the human body on the thermal environment. This paper selects the predicted mean vote (PMV) to describe the thermal comfort index. The original range of the PMV index is [−3, +3], and the corresponding thermal sensation is 7 levels of cold, cool, slightly cool, comfortable, slightly warm, warm, and heat. In this paper, the PMV index is redefined according to field working conditions, as shown in Table 1.

Table 1.
PMV level division.
The data collection in the visible light environment is performed by the Likert 5-point scale method. During the production process, visible light intensity data at different positions in the workshop are collected. In this paper, the visible light environment assessment index level is determined according to the measured environment, as shown in Table 2.
Table 2.
Visible light index division.
The purpose of data selection is to determine the operation object of the discovery task, which means extracting relevant data from the original database to form the target data according to the needs of users.
where N1(t) is the object, c is the feature name of the object, v is the magnitude of N1(t) on c, and t is a general parameter. For example, for SEDCI, N1(t) = hydrogen production workshop A, c1 = hydrogen concentration, c2 = oxygen concentration, c3 = hydrogen sulfide concentration..., vn(t) is the magnitude corresponding to cn. At the same time, four hydrogen workshops in the factory are selected as examples to select the following indexes for the data from March 2019 to August 2019 as the SEDCI. SEDCI is the real monitoring data for gas chemical production workshops in the real world. The workshops monitor and control the production behaviors of the systems by integrating digits and equipment. The collected data contain the following information: (1) the running data of production system between March and August (excluding equipment maintenance and time outside the production schedule); (2) the data of 2000 collection points in four hydrogen workshops are collected (one point represents a collected attribute, such as the temperature of equipment is a point). Since there are a large number of attributes irrelevant to safety evaluation in the collected points, we have screened these attributes under the guidance of experts; (3) for production-related data, the read frequency from the real-time database is once per second; (4) for environment-related data, we collect them every five minutes.
2.2. Data Preprocessing
In modern society, data are the necessary foundation for enterprises to progress to informationalization. However, with the rapid expansion of enterprise application system data, the emergence of new applications, and the integration of applications, data quality problems have become increasingly prominent. These problems are mainly reflected in incorrect data, incomplete data, inconsistent data, and other aspects. Poor-quality data have become an important factor affecting the correct decision-making, safety prevention, and dangerous source investigation of chemical enterprises. Therefore, data quality management will become an essential link in the informationalization process of chemical enterprises.
Data analysis and mining rely on real and accurate data, and the quality of data affects the success or failure of data application. There are many reasons for the low data quality of chemical factories studied in this paper, including careless input of original data, low accuracy of equipment, interference of the external environment, data packet loss, and dislocation of data integration. Data collection in workshops is frequent and varied, and data quality problems are more prominent. Due to the large amount of data, the complex correlation between data and the diversification of data structure, the consistency and integrity of data are difficult to maintain. This is a potential vulnerability for obtaining knowledge-assisted security decision-making through data mining. Data preprocessing processes the extracted data R1(t) to meet the requirements of data mining. Its main work includes data filling, data deduplication, outlier data deletion, derivation calculation of missing data, and data type conversion. This step is mainly studying the quality of data and finding datasets that meet the requirements and can be effectively mined to prepare for further analysis. The dataset can be represented by the multidimensional matter element R2:
At present, the problem of data quality has become an important factor affecting the application of data mining. Due to the existence of incorrect, incomplete, redundant, or sparse data, the credibility of the final mining conclusion is reduced. For example, in SECP, abnormal data are often generated due to incorrect input of transcribing information and other factors. At this time, these abnormal data must first be eliminated and cleaned, and then data mining is performed. Otherwise, data mining cannot be performed. Even if the data mining is made, the accuracy of conclusion is also very low, and it greatly affects the application value. However, data cleaning work often takes considerable time. With the increase in data, new information with possible data quality problems is imported into the database every time and every day. Data cleaning must be carried out continuously to ensure the data quality used for data mining.
Since the SEDCI is mainly sensor data, there are discrete numerical data and sinusoidal electrical signals. First, the quartile method is adopted in this paper for discrete data, and the daily data are regarded as an individual. The range of outliers of data is determined by historical data, as shown in Figure 2. The outlier data and daily data missing by more than 50% are deleted, and the missing value is interpolated by cubic spline interpolation. For sinusoidal signals, the collected signal data are converted into the time domain to the frequency domain, and error data, such as peak load shifting and abnormal cycles, are removed. The first digit of the daily data individual is taken as the first peak position. The last bit is taken as the last trough position. Daily individual data are interpolated to the same length, and then the data are inversely transformed from the time domain to the frequency domain. Thus, an extension set is established on the raw dataset.
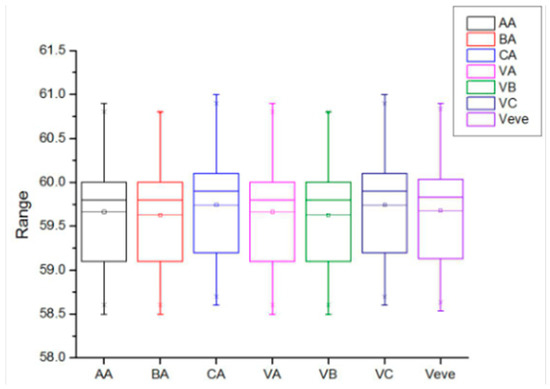
Figure 2.
Workshop index data box diagram.
The matter element extension model in extenics is an evaluation method to solve the fuzziness, diversity, and incompatibility of evaluation objects, but there are also imperfections in theory and application. For example, when the index data exceed the controlled field, the dependent function cannot be calculated and, thus, cannot be evaluated. At the same time, due to the influence of each index unit, an excessively large magnitude difference between indexes will easily affect the accuracy of the analysis results. To make each index more convenient for scientific induction, the data should be normalized. The influence of each index on the workshop safety environment is both positive and negative, so different normalization treatments should be carried out. For the indicator of positive effect, the expression is:
Additionally, for the indicator of negative effect:
The data of each index value after data preprocessing are evaluated by the extension method of point to interval. The correct, complete, and consistent set of data individuals is selected from the raw dataset so that the data quality can meet the requirements of effectively mining and determining the weight of the model to ensure the balance between the available quality of data and the original information of data. Therefore, the matter element model of the workshop safety evaluation index data quality is denoted as:
The judgment standards, such as correctness, integrity, and consistency, are as follows. The score of each index is the ratio of counting to total number after querying according to the standard:
- (1).
- column not null (weight: 9, expected value: 90): integrity;
- (2).
- column: reach the specified length (weight: 10, expected value: 90): effectiveness;
- (3).
- column: value is within the standard range (weight: 10, expected value: 98): effectiveness.
According to the definition of the extension set and the type of extension transform, the domain extension transform, association rule extension transform, and element extension transform are carried out to select the dataset for mining.
3. Chemical Factory Safety Extension Prerisk Model
The index system of safety and environmental data of chemical enterprises is determined, and the index weight is determined by using the comprehensive weighting method based on game theory. The extension prerisk model of safety and environmental data of chemical enterprises is established by combining the one-dimensional uncertainty elementary dependent function in two nested regions, which provides theoretical support for evaluating the safety and environmental data of chemical enterprises.
3.1. Comprehensive Weighting Method Based on Game Theory
There are many methods to calculate the weight of indicators, such as the analytic hierarchy process (AHP), simple correlation function method, entropy weight method, gray correlation method, neural network, and expert scoring method. Most of them are subjective or too complex, and they are inconvenient to use in practice, and some of them rely too much on data. Therefore, game theory combines the subjective weighting method (the fuzzy analytic hierarchy process (FAHP) and the objective weighting method (the coefficient of variation method)) to improve the scientificity of weight assignment in this paper, which not only overcomes the subjective deficiency of the AHP method but also makes up for the defects of the coefficient of variation method that relies too much on data and ignores the important effect of indexes on the evaluation objects. The weights obtained by the two weighting methods are optimized comprehensively, and then the comprehensive weights of safety and environmental data indexes of chemical enterprises are obtained.
Suppose L kinds of methods are used to calculate the index weight of safety and environmental data of chemical enterprises, and the value of L is 2 in this paper. The basic weight set is ωk = {ωk1,ωk2,…,ωkm}(k = 1, 2, …, L), and we set α = {α1,α2,…,αk} as a linear combination coefficient. Then, any combination of L vectors is:
With the aim of minimizing the deviation with ω and each ωk, L linear combination coefficients αk in Formula (3) are optimized to obtain the most satisfactory weight ωk* in ω. The countermeasure mode thus obtained is:
The linear equations of the optimal derivative conditions equivalent to Formula (4) are:
where (α1,α2,…,αL) is calculated and normalized:
Then, the comprehensive weight of the evaluation index obtained by combination weighting is:
The comprehensive weights ω* obtained by the optimization of Formula (7) are substituted into the one-dimensional uncertainty elementary dependent function in two nested regions formula, and the evaluation results of safety and environmental data of chemical enterprises can be obtained.
3.2. Establish the Extension Prerisk Model
This paper uses a one-dimensional uncertainty elementary dependent function in two nested regions to conduct quantitative calculations. The safety and environmental data of the chemical enterprises index are shown in Figure 1. The calculation steps are as follows.
3.2.1. Establish the Extension Matter Element
The extension matter element is denoted as Q = (U, X, V). In this paper, the influencing factor set of safety and environmental data of chemical enterprises is X = {X1, X2}, where X1 = {X11, X12, X13, X14, X15, X16, X17, X18, X19}, and X2 = {X21, X22, X23, X24}.
In this paper, the safety and environmental data of chemical enterprises are evaluated at four levels. The evaluation level set is U = {U1, U2, U3, U4}, where U1 is nonrisk, U2 is light risk, U3 is medium risk, and U4 is heavy risk. V is the evaluation set of U with respect to X.
3.2.2. Determine the Classical Field and Controlled Field
The classical field of safety and environmental data of chemical enterprises is represented by Qji, and its expression is as follows:
where Uj is the Jth prerisk level, j = 1, 2, 3, 4; Xin is the influencing factor, n = 1, 2,…, m, i = 1, 2, and Vj is the value range of each index at Uj.
The expression of the controlled field Qui is:
where U represents all prerisk levels and Vu is the value range of Xin.
The matter element to be evaluated is determined.
where i = 1, 2.
3.2.3. Calculate the Correlation Degree
1. The one-dimensional certainty elementary dependent function in two nested regions is the distance between point x and interval X0.
Definition 1.
Let x be any point on the real axis, X0 = <a, b> be any interval in the real domain, and called
is the distance between point x and interval X0.
In practical problems, in addition to the position relation between a point and an interval, it is often necessary to consider the position relation between a point and two intervals.
Definition 2.
Let X0 = <a, b>, X = <c, d>, and X0⊂ X; then, the position value of point x regarding the nested interval composed of intervals X0 and X is specified as
D(x,X0,X) describes the position relation of point x regarding the nested interval composed of intervalsX0 andX.
According to the definition of distance and position value, it is obvious that D(x, X0, X) < 0.
Definition 3.
LetΧ0=⟨a, b⟩,Χ=⟨c, d⟩, andΧ0⊂ Χ, denoting the common endpoint ofΧ0 andΧ isxz (if there is no common endpoint,xz is an empty set); then, for any x≠ xz,
K(x) is the elementary dependent function of point x with respect to X0 and X.
2. One-dimensional uncertainty elementary dependent function in two nested regions.
Usually, extension theory calculates distance from point to interval when dealing with evaluation problems. Since this paper is to evaluate the safety risks in chemical enterprises, the real value is distorted due to the fluctuation in the environment, personnel operation, and data acquisition process in the workshop site. It is difficult to use definite measurement values to represent the actual running state of the equipment; that is, the acquisition results have uncertain fluctuations. Therefore, we convert the determined measurement value into the form of uncertain interval value to reduce the influence of external factors and make the evaluation results more objective and scientific.
(1) Combining the interval distance formula of the one-dimensional uncertainty elementary dependent function in two nested regions, the distance value of each first level index in the four prerisk levels is calculated as ρiu, where i = 1, 2, u = 1, 2, 3, 4. The calculation formula is shown as follows:
where Ω1 is the classical field and Ω2 is the controlled field. Ω2 is the overall range of the standard values of all evaluation indicators, and Ω1 is the range of each standard value of the evaluation indicators by levels.
(2) Using the position value formula of the one-dimensional uncertainty elementary dependent function in two nested regions, the position value of each first level index is calculated as Diu(Χi, Ω1, Ω2), where i = 1, 2, u = 1, 2, 3, 4. The calculation formula is shown as follows:
(3) Using the formula of the one-dimensional uncertainty elementary dependent function in two nested regions, the correlation degree of each first level index is calculated as Ku(Xi), where i = 1, 2, u = 1, 2, 3, 4. The calculation formula is shown as follows:
3.2.4. Extension Comprehensive Evaluation
First, according to step 4, the correlation matrix of each first-level index is calculated as follows:
Second, the weights of the two first-level indexes are calculated as follows:
The comprehensive correlation degree of the four evaluation levels of safety and environmental data in the four workshops of chemical enterprises is calculated by using the fuzzy analytic hierarchy process (FAHP). The calculation formula is as follows:
where Ku(Xi) is the correlation function matrix of each first-level index, and K(X) is the comprehensive correlation function matrix of safety and environmental data evaluation of chemical enterprises.
Finally, according to the following formula:
The safety and environmental data of four workshops in chemical enterprises are comprehensively evaluated.
4. Evaluation and Analysis of Safety and Environmental Data of Each Workshop in Chemical Enterprises
According to the chemical factory safety extension prerisk model, the real scene and data of the specialty gas production workshop in a chemical plant are taken as an example for calculation and analysis. The chemical enterprise area studied in this paper is located in northern China. The city has a temperate continental monsoon climate. The spring is varied, windy and dry, the summer is hot and has less rainfall, the autumn is mild, the winter is cold and dry, the annual sunshine time is long, and the sunshine intensity is high. The factory mainly produces hydrogen, nitrogen trifluoride, tungsten hexafluoride, trifluorome- thanesulfonic acid, high-purity gas, and mixed gas. The annual output can reach 7300 tons of specialty gas and 80,000 tons of liquid nitrogen. The production flow chart of a workshop in the chemical plant is shown in Figure 3.
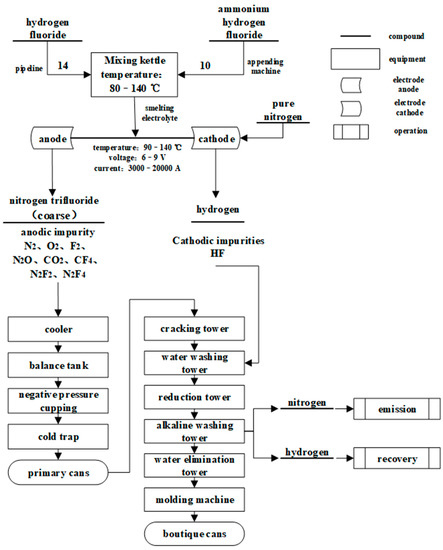
Figure 3.
The production flow chart of a workshop in the chemical plant.
The production workshop has a large area and high lifting frame; gas monitoring sensors need to be set in layers and sections (the data collection scheme is shown in Figure 4), and the working environment is characterized by high noise, high temperature, and dark lighting. The warehouse in the factory stores inflammable, explosive and toxic raw materials, semifinished products, and finished products. Once an accident happens, it will cause great harm to the life and safety of personnel. Gas leakage accidents are the most common in the factory, while explosion accidents are the most harmful. An explosion will cause a significant impact to the whole city, residents, and surrounding areas, and the leaked toxic gases will cause harm to the factory area and surrounding people. At the same time, the flammable, explosive, and toxic chemical raw materials and complicated fire conditions in the factory area will greatly hinder the effective implementation of rescue work by firefighters.
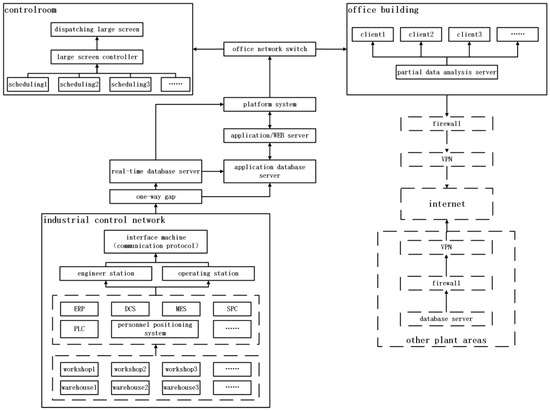
Figure 4.
The data collection scheme diagram of workshops in the chemical plant.
Through the calculation of Formula (7), the weight of each index of safety and environmental data of chemical enterprises are shown in Table 3:
Table 3.
First-level index weight value.
The classical field and controlled field of safety and environmental data evaluation of each workshop in chemical enterprises are shown in the following Table 4 and Table 5:
Table 4.
Classical field of indoor safety and environment indexes (N1).
Table 5.
Classical field of outdoor meteorological indexes (N2).
Controlled field:
According to the actual situation of the chemical factory studied in this paper, the index value of the matter element to be evaluated is determined. Taking hydrogen production in the first workshop as an example, the index value is:
The second workshop:
The third workshop:
The fourth workshop:
Taking hydrogen concentration in indoor safety and environmental indexes as an example, the correlation degree is calculated as follows:
Nonrisk:
First, the interval distance values of hydrogen concentration calculated by Formulas (11) and (12) are:
Second, by using Formula (13), the position value is:
Finally, Formula (14) is used to obtain the correlation degree when there is nonrisk:
Similarly, the correlation degree of light risk, medium risk, and heavy risk can be calculated, and the results are −0.25, −0.52, and −0.68, respectively.
The correlation degree of each second index in indoor safety and environmental and outdoor meteorological indexes are obtained, as shown in Table 6 and Table 7.
Table 6.
Correlation degree of indoor safety and environmental indexes.
Table 7.
Correlation degree of outdoor meteorological indexes.
Therefore, according to Formula (15), the comprehensive correlation degree between indoor safety and environmental indexes and outdoor meteorological indexes is calculated as follows:
By the above calculation, the weight and correlation degree of the two first-level indexes can be obtained. Therefore, the comprehensive correlation degree of the first workshop of safety and environmental data of chemical enterprises can be calculated according to Formula (15), as shown in the following:
Finally, according to Formula (16), the prerisk level of the first workshop of safety and environmental data of chemical enterprises is determined to be nonrisk. Similarly, the comprehensive correlation degree of the second workshop, third workshop, and fourth workshop can be obtained as follows:
In the end, the prerisk levels of the four workshops are nonrisk, light-risk, light-risk, and nonrisk.
5. Discussion
Risk analysis of chemical enterprises is an important part of safety production and safety management of chemical enterprises, which is used to improve the level of safety management of chemical enterprises. Therefore, the safety analysis method should not only be scientific, reasonable, and clear but also more objective and truly reflect the safety status of chemical enterprises, which is a problem to be solved at present. In this paper, the safety production factors of chemical enterprises are investigated and analyzed, different levels of safety indicators are selected as evaluation indicators, and extension engineering theory is used to establish a risk early warning model for chemical enterprises. The selection of safety evaluation indexes is the basis for establishing the safety evaluation method of chemical enterprises. The safety risk analysis of chemical enterprises involves personnel, equipment, and facilities, the operating environment, safety management, and other aspects in the production process. Safety workers at home and abroad have made great efforts in this regard. However, the production of chemical products is a complex system for the production and management of chemical enterprises, involving strict processing conditions, complete equipment and facilities, and numerous dangerous and harmful factors. It is difficult for a single index to fully reflect the actual safety status of the enterprise. It is necessary to select the best influencing variables that affect the safe production of chemical enterprises from different levels and play a dominant role in the nature of the variables. Each index should follow the principles of practicality, representativeness, scientificity, systematicness, and the combination of being qualitative and quantitative as much as possible.
Once the degree of damage for each trigger has been assessed, this information can be aggregated into a single risk index, and each estimate can be combined with the corresponding probability of occurrence. We use the safety evaluation model to comprehensively evaluate the safety status of a typical chemical enterprise in Hebei, China. The chemical production process involves a variety of dangerous chemical substances, and the intermediate and finished products in the production process are usually toxic, flammable, and explosive. Therefore, the plant area of chemical plants is usually identified as a major source of danger, and chemical accidents will not only threaten the enterprise itself but also threaten the local city. According to the risk early warning model proposed in this paper, the prerisk level of the final safety evaluation result is light-risk. Combined with the actual situation of the enterprise, this paper puts forward four feasible safety risk management suggestions for the safety production and risk management of the chemical plant: (1) further strengthen personnel operation standards; (2) indicators with low scores in the model represent potential risks. It is suggested that enterprises conduct risk investigations and focus monitoring to improve the current inappropriate production modes; (3) strengthen gas concentration monitoring at pipelines; and (4) strengthen the management of electrolytic equipment. Therefore, a theoretical basis for the safety production analysis of such chemical enterprises is provided through the risk early warning model of chemical enterprises in this paper.
6. Conclusions
Applying the extension data mining technology to the safety quality evaluation of chemical enterprises will help to determine the useful information that cannot be obtained (or not completely obtained) in the safety aspect of chemical enterprises. This paper mainly aims at data mining, such as safety factors, working conditions, and outdoor meteorological factors, in the workshop. First, this paper preliminarily preprocesses the common quality problems of monitoring data in chemical factories and removes the basic data quality problems in the raw data, such as outlier removal and data alignment. Second, the index weight is determined by the game theory comprehensive weighting method, and the correlation degree of safety and environmental data of the four workshops in chemical enterprises is calculated by the fuzzy analytic hierarchy process (FAHP) and uncertainty elementary dependent function in two nested regions. Finally, according to the dependent function evaluation rules, the safety and environmental data of four workshops of chemical enterprises are comprehensively evaluated. The research in this paper is only a preliminary exploration of the application of extension data mining in the field of chemical factory safety security, aiming to provide a starting point for further research. According to the existing prior knowledge and open data of chemical factories, the early warning evaluation results and chemical safety opinions of chemical enterprises studied in this paper are the best and most comprehensive results we have obtained. The method in this paper is based on extension theory, which is very suitable for establishing evaluation models and addressing the impact of uncertain data fluctuations on the reliability of evaluation results. However, the increase in dimension will increase the time-consuming nature of function calculation of the model, and the increase in dimension and data volume will lead to lower efficiency of the model. At the same time, the generalization ability of the model is weak, and it needs to be modeled separately for different enterprises, workshops, and even some key production stages. To solve these limitations and make the model more suitable for real working conditions, we consider adding more complex probabilistic dynamics into the model in our future work. At the same time, in view of the discrete and uncertain characteristics of chemical industry data, another direction is to focus on the real distribution of data so that the data can more realistically reflect the behavior of the production system. This will allow our model to establish a dynamic model that is more in line with the real scene according to the real complex working conditions of the production system so as to improve the limitation of the model in generalization ability.
Author Contributions
Conceptualization, P.L.; Data curation, P.L.; Formal analysis, P.L.; Funding acquisition, Q.H.; Methodology, P.L.; Resources, Q.H.; Validation, Z.M.; Writing—Original draft, P.L.; Writing—Review and editing, Z.M. All authors have read and agreed to the published version of the manuscript.
Funding
This research was funded by the National Key R&D Program of China under Grant No. 2020YFB1710200.
Institutional Review Board Statement
Not applicable.
Informed Consent Statement
Not applicable.
Data Availability Statement
The datasets generated during the current study are available from the corresponding author on reasonable request.
Conflicts of Interest
The authors declare no conflict of interest.
References
- Li, Y.; Liu, T.; Zhu, J.; Wang, X. IoT Security Situational Awareness Based on Q-Learning and Bayesian Game. In Proceedings of the International Conference of Pioneering Computer Scientists, Engineers and Educators, Taiyuan, China, 17–20 September 2021; Springer: Singapore, 2021; pp. 190–203. [Google Scholar] [CrossRef]
- Cai, Z.; Wang, J.; Zhang, J.; Chen, X. Design and Implementation of Intrusion Detection System Based on Neural Network. In Proceedings of the International Conference of Pioneering Computer Scientists, Engineers and Educators, Taiyuan, China, 17–20 September 2021; Springer: Singapore, 2021; pp. 179–189. [Google Scholar] [CrossRef]
- Li, N.; Cui, B.; Liu, Z.; Ni, J.; Zhang, C.; Kong, H. IoT Honeypot Scanning and Detection System Based on Authorization Mechanism. In Proceedings of the International Conference of Pioneering Computer Scientists, Engineers and Educators, Taiyuan, China, 17–20 September 2021; Springer: Singapore, 2021; pp. 217–228. [Google Scholar] [CrossRef]
- Bronselaer, A.; De Mol, R.; De Tre, G. A Measure-Theoretic Foundation for Data Quality. IEEE Trans. Fuzzy Syst. 2017, 26, 627–639. [Google Scholar] [CrossRef]
- Batini, C.; Cappiello, C.; Francalanci, C.; Maurino, A. Methodologies for data quality assessment and improvement. ACM Comput. Surv. 2009, 41, 1–52. [Google Scholar] [CrossRef]
- He, C.; Tan, Z.; Chen, Q.; Sha, C. Repair diversification: A new approach for data repairing. Inf. Sci. 2016, 346–347, 90–105. [Google Scholar] [CrossRef]
- Giribone, P.; Orsoni, A. Simulation for risk assessment in LPG storage and distribution plant. In Proceedings of the IASTED International Conference on Modelling and Simulation (MS 2003), Palm Springs, CA, USA, 24–26 February 2003; pp. 543–548. [Google Scholar]
- Zhou, T.; Modarres, M.; Droguett, E.L. Multi-unit nuclear power plant probabilistic risk assessment: A comprehensive survey. Reliab. Eng. Syst. Saf. 2021, 213, 107782. [Google Scholar] [CrossRef]
- Modarres, M.; Zhou, T.; Massoud, M. Advances in multi-unit nuclear power plant probabilistic risk assessment. Reliab. Eng. Syst. Saf. 2017, 157, 87–100. [Google Scholar] [CrossRef]
- Liu, Y.; Mao, S.; Yao, J. Comprehensive Safety Evaluation of Coal Mine Based on Analytic Hierarchy Process. Min. Res. Dev. 2007, 27, 82–84. [Google Scholar]
- Chong, T.; Yi, S.; Heng, C. Application of set pair analysis method on occupational hazard of coal mining. Saf. Sci. 2017, 92, 10–16. [Google Scholar] [CrossRef]
- Qiu, Z.; Liang, W.; Wang, X.; Lin, Y.; Zhang, M. Study on quantitative risk assessment model of the third party damage for natural gas pipelines based on fuzzy comprehensive assessment. J. Phys. Conf. Ser. 2017, 842, 12048. [Google Scholar] [CrossRef]
- Wang, G.; Zeng, X.Q.; Li, J. Method for Evaluation of Railway Dynamic Safety Based on 5M Model and Neural Network Algorithm. Appl. Mech. Mater. 2015, 743, 445–449. [Google Scholar] [CrossRef]
- Wei, J.; Zhou, L.; Wang, F.; Wu, D. Work safety evaluation in Mainland China using grey theory. Appl. Math. Model. 2015, 39, 924–933. [Google Scholar] [CrossRef]
- Ren, Z.G.; Zhang, S.H.; Xue, Z.Q. Application of mond in the safety assessment of waste incineration power plant. J. Saf. Sci. Technol. 2011, 7, 123–126. [Google Scholar]
- Zhang, L.; Sun, Z.; Dai, S.; Sun, W.; Tao, Y. Safety risk evaluation of China coal chemical industry on the basis of fuzzy mathematics theory. In Proceedings of the 2nd International Conference on Computing and Data Science, Stanford, CA, USA, 28–30 January 2021. [Google Scholar] [CrossRef]
- Orsoni, A. Fuzzy and simulation-based techniques for industrial safety and risk assessment. Int. J. Gen. Syst. 2006, 35, 619–635. [Google Scholar] [CrossRef]
- Artamonov, A.A.; Bogdanova, L.M.; Nagibin, S.Y.; Loskutov, D.I.; Chemakin, A.S. Mathematical model of chemical process prediction for industrial safety risk assessment. Procedia Comput. Sci. 2021, 190, 107–114. [Google Scholar] [CrossRef]
- Bozzano, M.; Cavallo, A.; Cifaldi, M.; Valacca, L.; Villafiorita, A. Improving Safety Assessment of Complex Systems: An Industrial Case Study. In International Symposium of Formal Methods Europe; Springer: Berlin/Heidelberg, Germany, 2003; pp. 208–222. [Google Scholar] [CrossRef]
- Alanen, J.; Linnosmaa, J.; Malm, T.; Papakonstantinou, N.; Ahonen, T.; Heikkilä, E.; Tiusanen, R. Hybrid ontology for safety, security, and dependability risk assessments and Security Threat Analysis (STA) method for industrial control systems. Reliab. Eng. Syst. Saf. 2021, 220, 108270. [Google Scholar] [CrossRef]
- Li, W.; Liang, W.; Zhang, L.; Tang, Q. Performance assessment system of health, safety and environment based on experts’ weights and fuzzy comprehensive evaluation. J. Loss Prev. Process Ind. 2015, 35, 95–103. [Google Scholar] [CrossRef]
- Xin, Z.; Huiliang, Z.; Qianjin, D.; Lijun, W. Safety assessment of control system based on fuzzy comprehensive evaluation. In Proceedings of the 2012 9th International Conference on Fuzzy Systems and Knowledge Discovery, Chongqing, China, 29–31 May 2012; pp. 586–591. [Google Scholar]
- Song, H.S. Network safety evaluation based on Pso-Rbf neural network. Fifth International Conference on Machine Vision (ICMV 2012): Algorithms, Pattern Recognition, and Basic Technologies. SPIE 2013, 8784, 385–388. [Google Scholar]
- Niu, D.; Wang, Y.; Ma, X. Power plant construction project safety management evaluation with fuzzy neural network model. In Proceedings of the APCCAS 2008-2008 IEEE Asia Pacific Conference on Circuits and Systems, Macao, China, 30 November–3 December 2008; pp. 489–492. [Google Scholar] [CrossRef]
- Men, K.; Zhang, P. Research on evaluation of ecological security in Shanghai City based on subjective and objective weighting method. J. Anhui Agric. Sci. 2011, 39, 2838–2840. [Google Scholar]
- Hurme, M.; Rahman, M. Implementing inherent safety throughout process lifecycle. J. Loss Prev. Process Ind. 2005, 18, 238–244. [Google Scholar] [CrossRef]
- Gentile, M.; Rogers, W.; Mannan, M. Development of a Fuzzy Logic-Based Inherent Safety Index. Process Saf. Environ. Prot. 2003, 81, 444–456. [Google Scholar] [CrossRef]
- Han, Q.; Liang, S.; Zhang, H. Mobile cloud sensing, big data, and 5G networks make an intelligent and smart world. IEEE Netw. 2015, 29, 40–45. [Google Scholar] [CrossRef]
- Han, Q.; Liu, P.; Zhang, H.; Cai, Z. A Wireless Sensor Network for Monitoring Environmental Quality in the Manufacturing Industry. IEEE Access 2019, 7, 78108–78119. [Google Scholar] [CrossRef]
- Bao, Z.; Du, J.; Zhang, W.; Wang, J.; Qiu, T.; Cao, Y. A Transformer Model-Based Approach to Bearing Fault Diagnosis. In Proceedings of the International Conference of Pioneering Computer Scientists, Engineers and Educators, Taiyuan, China, 17–20 September 2021; Springer: Singapore, 2021; pp. 65–79. [Google Scholar]
- Ye, J. Application of extension theory in misfire fault diagnosis of gasoline engines. Expert Syst. Appl. 2009, 36, 1217–1221. [Google Scholar] [CrossRef]
- Wang, J.; Pang, J.; Wei, J. Security-as-a-Service with Cyberspace Mimic Defense Technologies in Cloud. In Proceedings of the International Conference of Pioneering Computer Scientists, Engineers and Educators, Taiyuan, China, 17–20 September 2021; Springer: Singapore, 2021; pp. 129–138. [Google Scholar] [CrossRef]
- Wang, M.-H. Application of extension theory to vibration fault diagnosis of generator sets. IEE Proc.-Gener. Transm. Distrib. 2004, 151, 503–508. [Google Scholar] [CrossRef]
- Liu, S.-T.; Kao, C. Solution of fuzzy matrix games: An application of the extension principle. Int. J. Intell. Syst. 2007, 22, 891–903. [Google Scholar] [CrossRef]
- Daocai, C.; Tao, M.; Song, L. Application of extension assessment method based on game theory to evaluate the running condition of irrigation areas. Trans. Chin. Soc. Agric. Eng. 2008, 24, 36–39. [Google Scholar]
- Che, L.C.; Zhou, X.J.; Xu, Z.N.; Cheng, Y.D. Application of extension method in multisensory data fusion for parts recognition. Syst. Eng. Theory Pract. 2000, 20, 91–94. [Google Scholar]
- Yichen, Z.; Lei, N.; Fanqi, M. Application of extension theory evaluation model based on optimal combination weighting law. J. Jilin Univ. Earth Sci. Ed. 2011, 4, 1110–1135. [Google Scholar]
- Li, W.; Xiao, H.B.; Ning, H.L.; Zuo, X.L.; Chen, Z.D. Application of extension theory to large span tunnel collapse risk evaluation. J. Nat. Disasters 2015, 3, 97–103. [Google Scholar]
- Weaver, A.C. Distributed Data Security for Factory Automation. ETFA 2005, 9, 243–244. [Google Scholar]
- Khan, F.I.; Husain, T.; Abbasi, S.A. Safety weighted hazard index (SWeHI): A new, user-friendly tool for swift yet comprehensive hazard identification and safety evaluation in chemical process industrie. Process Saf. Environ. Prot. 2001, 79, 65–80. [Google Scholar] [CrossRef]


Publisher’s Note: MDPI stays neutral with regard to jurisdictional claims in published maps and institutional affiliations. |
© 2022 by the authors. Licensee MDPI, Basel, Switzerland. This article is an open access article distributed under the terms and conditions of the Creative Commons Attribution (CC BY) license (https://creativecommons.org/licenses/by/4.0/).