Article

Removal and Recovery of Dissolved Oil from High-Salinity Wastewater Using Graphene–Iron Oxide Nanocomposites

1
Division of Sustainable Development, College of Science and Engineering, Hamad Bin Khalifa University, Doha P.O. Box 34110, Qatar
2
Chemical Engineering Program, Texas A&M University Qatar, Doha P.O. Box 23874, Qatar
*
Author to whom correspondence should be addressed.
Appl. Sci. 2022, 12(19), 9414; https://doi.org/10.3390/app12199414
Submission received: 22 August 2022 / Revised: 2 September 2022 / Accepted: 6 September 2022 / Published: 20 September 2022
(This article belongs to the Section Environmental Sciences)

Abstract

:
We report the synthesis of reduced graphene oxide (rGO)-α-Fe2O3 nanocomposite and its application to remove and recover dissolved oil from a high-salinity oil–water emulsion in batch and column/breakthrough setups. Scanning electron microscopy (SEM), X-ray diffraction (XRD), and nitrogen adsorption characterized the synthesized nanocomposite’s structure, morphology, and surface properties. Both batch and continuous breakthrough adsorption studies were investigated. The effect of the adsorption parameters on the adsorption capacity and removal efficiency was analyzed. The rGO-Fe2O3 nanocomposite (rGO-Fe2O3-NC) demonstrated a superior adsorption capacity, both when measured experimentally (1213 mg/g) and predicted using the Freundlich isotherm (1301 mg/g). The adsorption process followed pseudo-second-order kinetic, and the rGO-Fe2O3-NC exhibited a very rapid removal, with more than 60% of oil being removed within 10 min. Breakthrough confirmed the exceptional removal capacities with good regeneration and cycling ability under a short contact time. Moreover, the adsorption capacity was enhanced with an emulsion salinity of up to 100,000 ppm, confirming the suitability for high-salinity wastewater.

1. Introduction

Produced water (PW) is the largest waste stream associated with the production and processing of oil and gas. PW from oil production is a mixture of reservoir-trapped water, formation water, and injection water injected into the oil and gas reservoir during water-flooding or enhanced oil recovery (EOR) operations [1]. The physicochemical properties of PW are influenced by the reservoir hydrocarbon type, geographic location of the reservoir field, and hydrocarbon properties. PW from an oil reservoir is a complex mixture of high-salinity water containing organic/inorganic components, heavy metals, oil droplets, and dissolved oil [2]. Properly treated PW can be used for water flooding or EOR instead of disposing of it in the environment [3].
The main stages for PW treatment are deoiling, desalination, suspended particle removal, radioactive and soluble organic materials, softening, and disinfection [4]. To achieve these objectives and fulfill the stringent environmental regulations, especially for oil-contaminated water, researchers have studied combined and standalone physical, chemical, and biological techniques for PW treatment [5]. Among these methods, adsorption is efficient for removing dissolved oil from water in terms of time, cost, and industrial applicability. Adsorption is a surface phenomenon by which mass transfer from a fluid to a solid surface proceeds due to the adhesion of a substance at the interface of two phases [6].
Developing new functional adsorbents for deoiling oily wastewater depends on factors such as surface charge density, surface area, porosity, pore size distribution, and thermal and chemical stability [7]. There is remarkable potential for the remediation of environmental issues with the advent of nanomaterials [8,9,10]. Unlike conventional materials, nanomaterials are promising because of their high surface area and faster adsorption rate [11,12]. Various studies have confirmed that nanomaterials are effective in wastewater treatment [13,14,15,16]. Nonetheless, pristine graphene has limited application in wastewater treatment. In contrast, the modified graphene or graphene composites incorporating functional moieties or nanoparticles on the graphene surface increase its potential applications. The oxygen groups and defects on the surface of graphene oxide (GO) and reduced graphene oxide (rGO) make them ideal as a support for nanoclusters of metal-based nanoparticles, such as iron oxide [10,17,18,19].
Graphene-based nanomaterials are excellent adsorbents for removing various organic pollutants. The main mechanisms of removing organic contaminants using graphene nanomaterials are anion interaction, cation interaction, π-π interaction, and functional group interaction [20]. Wang et al. [21,22] synthesized magnetic graphene nanocomposites (G/Fe2O3) to remove fuchsine dye. The dye sorption was very fast and reached equilibrium within 30 min, with a reported sorption efficiency of 0.0894 g/g. They concluded that G/Fe3O was a very effective adsorbent and could be easily regenerated using acidic ethanol. Cong et al. [23] studied the reduction of GO and α-Fe3O4 for synthesizing G/Fe3O4 hydrogels for the adsorption of oil and heavy metals from wastewater, reporting a removal efficiency of 92% for gasoline removal.
Moreover, the G/Fe3O4 hydrogel showed good adsorption capacity towards other oils, e.g., paraffin and vegetable oils, with an adsorption capacity of ~27 g/g and very high recyclability. In the adsorption of hydrocarbon oils containing aromatic hydrocarbons, π-π interactions have a primary role in oil removal. Graphene-based nanomaterials were reported to have a higher adsorption capacity than other adsorbents such as activated carbon, organic/inorganic adsorbents, and fly ash [24,25,26,27,28].
Several functional and nano-adsorbents have been used to remove emulsified oil from wastewater. The performance of such adsorbents is summarized in Table 1. These adsorbents can be classified into three groups: (i) low-performance adsorbents with an adsorption capacity of less than 100 mg/g, (ii) moderate performance adsorbents with an adsorption capacity between 150 and 800 mg/g, and (iii) high-performance adsorbents with an adsorption capacity >1000 mg/g, including the adsorbent developed in this study. It is also worth noting that the studies were carried out using different concentrations of emulsified oil, and the adsorption capacity was highly dependent on the initial oil concentration, as it increased with the initial oil concentration.
This article reports the synthesis of an rGO-iron (III) oxide nanocomposite (rGO-Fe2O3-NC) to remove emulsified oil from high-salinity water simulating PW streams. The prepared nanohybrid was characterized, and its performance for removing emulsified oil from high-salinity water, as simulated PW, was measured in batch and breakthrough/column setups. Moreover, the adsorption isotherms and kinetics were investigated, and the regeneration and recycling of the nanohybrid were also analyzed.

2. Materials and Methods

2.1. Materials

Graphene oxide was supplied by HK E-Sun International Co. Ltd., Guangdong, China. It was prepared using the Hummer method. Ammonium hydroxide 28–30% solution (Merck, Burlington, MA, USA) and iron (II) acetate, 95% (Sigma Aldrich, St. Louis, MO, USA), were used as delivered. Diesel was obtained from Wooqod Gas Station (Doha, Qatar) and was utilized as a model oil.

2.2. Oil–Water Emulsion: Preparation and Characterization

The oil in the water emulsion was prepared by mixing diesel and water using probe sonication (Cole-Parmer Ultrasonic Processors CV334) for 30 min and 3 s on and 1 s off pulses, plus 30 min of bath sonication. The emulsion salinity was regulated using pure sea salt (NaCl). The emulsion zeta potential and droplet size distribution were analyzed using (Zeta Analyzer Nano ZS instrument, Malvern, UK) laser-scattering particle size and zeta potential analyzer. The droplet size distribution was calculated by analyzing the scattered light using the Mie principle. The zeta potential measurement assessed the electrophoretic mobility of the colloidal particles. The diesel concentration of oil–water was measured by a combustion-type TOC analyzer (Shimadzu, Kyoto, Japan, model TOC-L). For the column experiments, emulsified oil concentration was measured by UV–visible spectrophotometer (Shimadzu) using a calibration curve and the Beer–Lambert Law:
A = l o g I 0 I = E l c
where A is the absorbance, I 0 and I are the incident and transmitted light intensity, E is constant, l is the path length, and c is oil concentration [42].

2.3. Characterization of rGO-Fe2O3

rGO-Fe2O3 with 47 wt.% iron oxide was prepared hydrothermally using iron II acetate as iron precursors. In a typical experiment, GO (500 mg) was dispersed in water (100 mL) by probe sonication (CV334, Cole–Parmer, Court Vernon Hills, IL, USA) for 5 min. Iron acetate was dissolved in 100 mL of deionized water and added to the GO suspension under stirring with dropwise addition of NH4OH solution to adjust the pH to 10 ± 0.1. The mixture was then transferred to 200 mL, Teflon-lined stainless-steel cell, sealed, heated to 80 °C, and maintained for four hours. After cooling the hydrothermal cell to 25 °C, the solid product was retrieved via filtration, washed with ethanol, dispersed in water, and freeze-dried (Freeze-Dryer 6 Plus, LABCONCO, Kansas City, MO, USA). The dry sample was calcined at 400 °C in a tube furnace for 4 h under 40 mL/min Argon flow.
The X-ray diffraction (XRD) patterns of GO and rGO-Fe2O3 were performed using MiniFlex-600 X-ray diffractometer (Rigaku, Tokyo, Japan) with Cu Kα radiation (λ = 0.154 nm). XRD scans (2θ from 5 to 60°) were collected at a scan rate of 1.0°/min and 0.02° step size. The adsorbent morphology was analyzed using a scanning electron microscope (SEM) (JCM-6000PLUS, NeoScope, Joel, Tokyo, Japan). The surface area, pore volume, and pore size were measured via nitrogen adsorption at 80 K (ASAP 2020, Micromeritics, Norcross, GA, USA). Thermal gravimetric analysis (TGA) (SDT 600, TA Instruments, New Castle, DE, USA) determined the nanocomposite thermal stability and iron oxide loading. The sample was heated from RT to 650 °C at 20°/min under air (20 mL/min).

2.4. Batch Adsorption

The impacts of initial oil concentration (C0), adsorbent dosage, adsorption time, and salinity on the adsorption capacity and removal efficiency were investigated via batch adsorption experiments. C0 varied from 25 to 200 ppm, and the rGO-Fe2O3 dose varied between 1 and 20 mg, yielding a dissolved oil to the adsorbent ratio of 50 to 8000 mg/g. The emulsion salinity varied between 0 and 200,000 mg/L using NaCl.
The adsorption capacity (qt, mg/g) and removal efficiency (RE, %) were calculated using Equations (2) and (3):
q t = C 0 C t × V m g
R E = C 0 C f C 0 × 100
where Ct is the oil concentration (ppm) at time t, and V and mg are the emulsion volume (L) and the adsorbent mass (g).

2.5. Breakthrough/Column Experiments

Column adsorption measurements were carried out using a fixed-bed adsorber at 22 ± 1 °C using a glass column with a 1″ diameter and a bed (2 cm height) containing 0.2 g of adsorbent mixed with 4 mm glass spheres. A syringe pump fed the oil emulsion (100 ppm) to the bottom of the column at 200 mL/h. Effluent samples from the exit of the adsorption column were collected every 10 min, and the oil concentration was measured using a UV-VIS spectrometer. The continuous experiment was continued until a breakthrough was observed. A control experiment was carried out in the same manner, except no adsorbent was added to the glass spheres bed to account for any adsorption by the column of the Teflon-fritted support. At the end of each adsorption cycle, the adsorbent regeneration was carried out by adding 50 mL of ethanol to dissolve the adsorbed oil.

2.6. Adsorption Isotherms

The batch experiment results were analyzed to reveal the adsorption mechanism using Langmuir, Freundlich, Temkin, and Dubinin–Radushevich (D-R) isotherms, and the results are consistent with the Freundlich isotherm. Analysis of the results against these models indicated the Freundlich isotherm provides the best fit for the results. The Freundlich isotherm is an empirical equation that describes heterogeneous adsorption. The Freundlich isotherm model is given by:
q e = k f C e 1 n
where n and kf are the constants related to the sorption intensity and capacity of the adsorbent [43]. The linear form of the Freundlich model is:
l n q e = l n k f + 1 n l n C e

2.7. Adsorption Kinetics

To study the kinetics of the adsorption process, 5 mg of the adsorbent was added to 400 mL of a 100-ppm emulsion, and the mixture was agitated at 350 rpm and 25 °C using a mechanical shaker. The residual oil concentration was measured at 10 min intervals. The pseudo-first-order and pseudo-second-order models were tested. The pseudo-first-order (Lagergren model) assumes the adsorption rate is proportional to the number of unoccupied sites [44]. It is linearized as:
ln q e q t = l n q e k 1 t
where qt is the sorption capacity (mg/g) at time t and k1 is the rate constant (min−1). To calculate the adsorption rate constant, ln q e q t is plotted versus t [45], and the slope and intercept of the linear fit are calculated.
The linear form of the pseudo-second-order model is:
t q t = 1 k 2 q e 2 + t q e
where k2 is the pseudo-second-order rate constant (g/mg.min), and t is the constant time (min). A linear fit of t q t versus t indicates the model applicability with slope = 1 q e and the intercept = 1 k 2 q e 2 [46], allowing for calculating k 2 and   q e [44].

3. Results

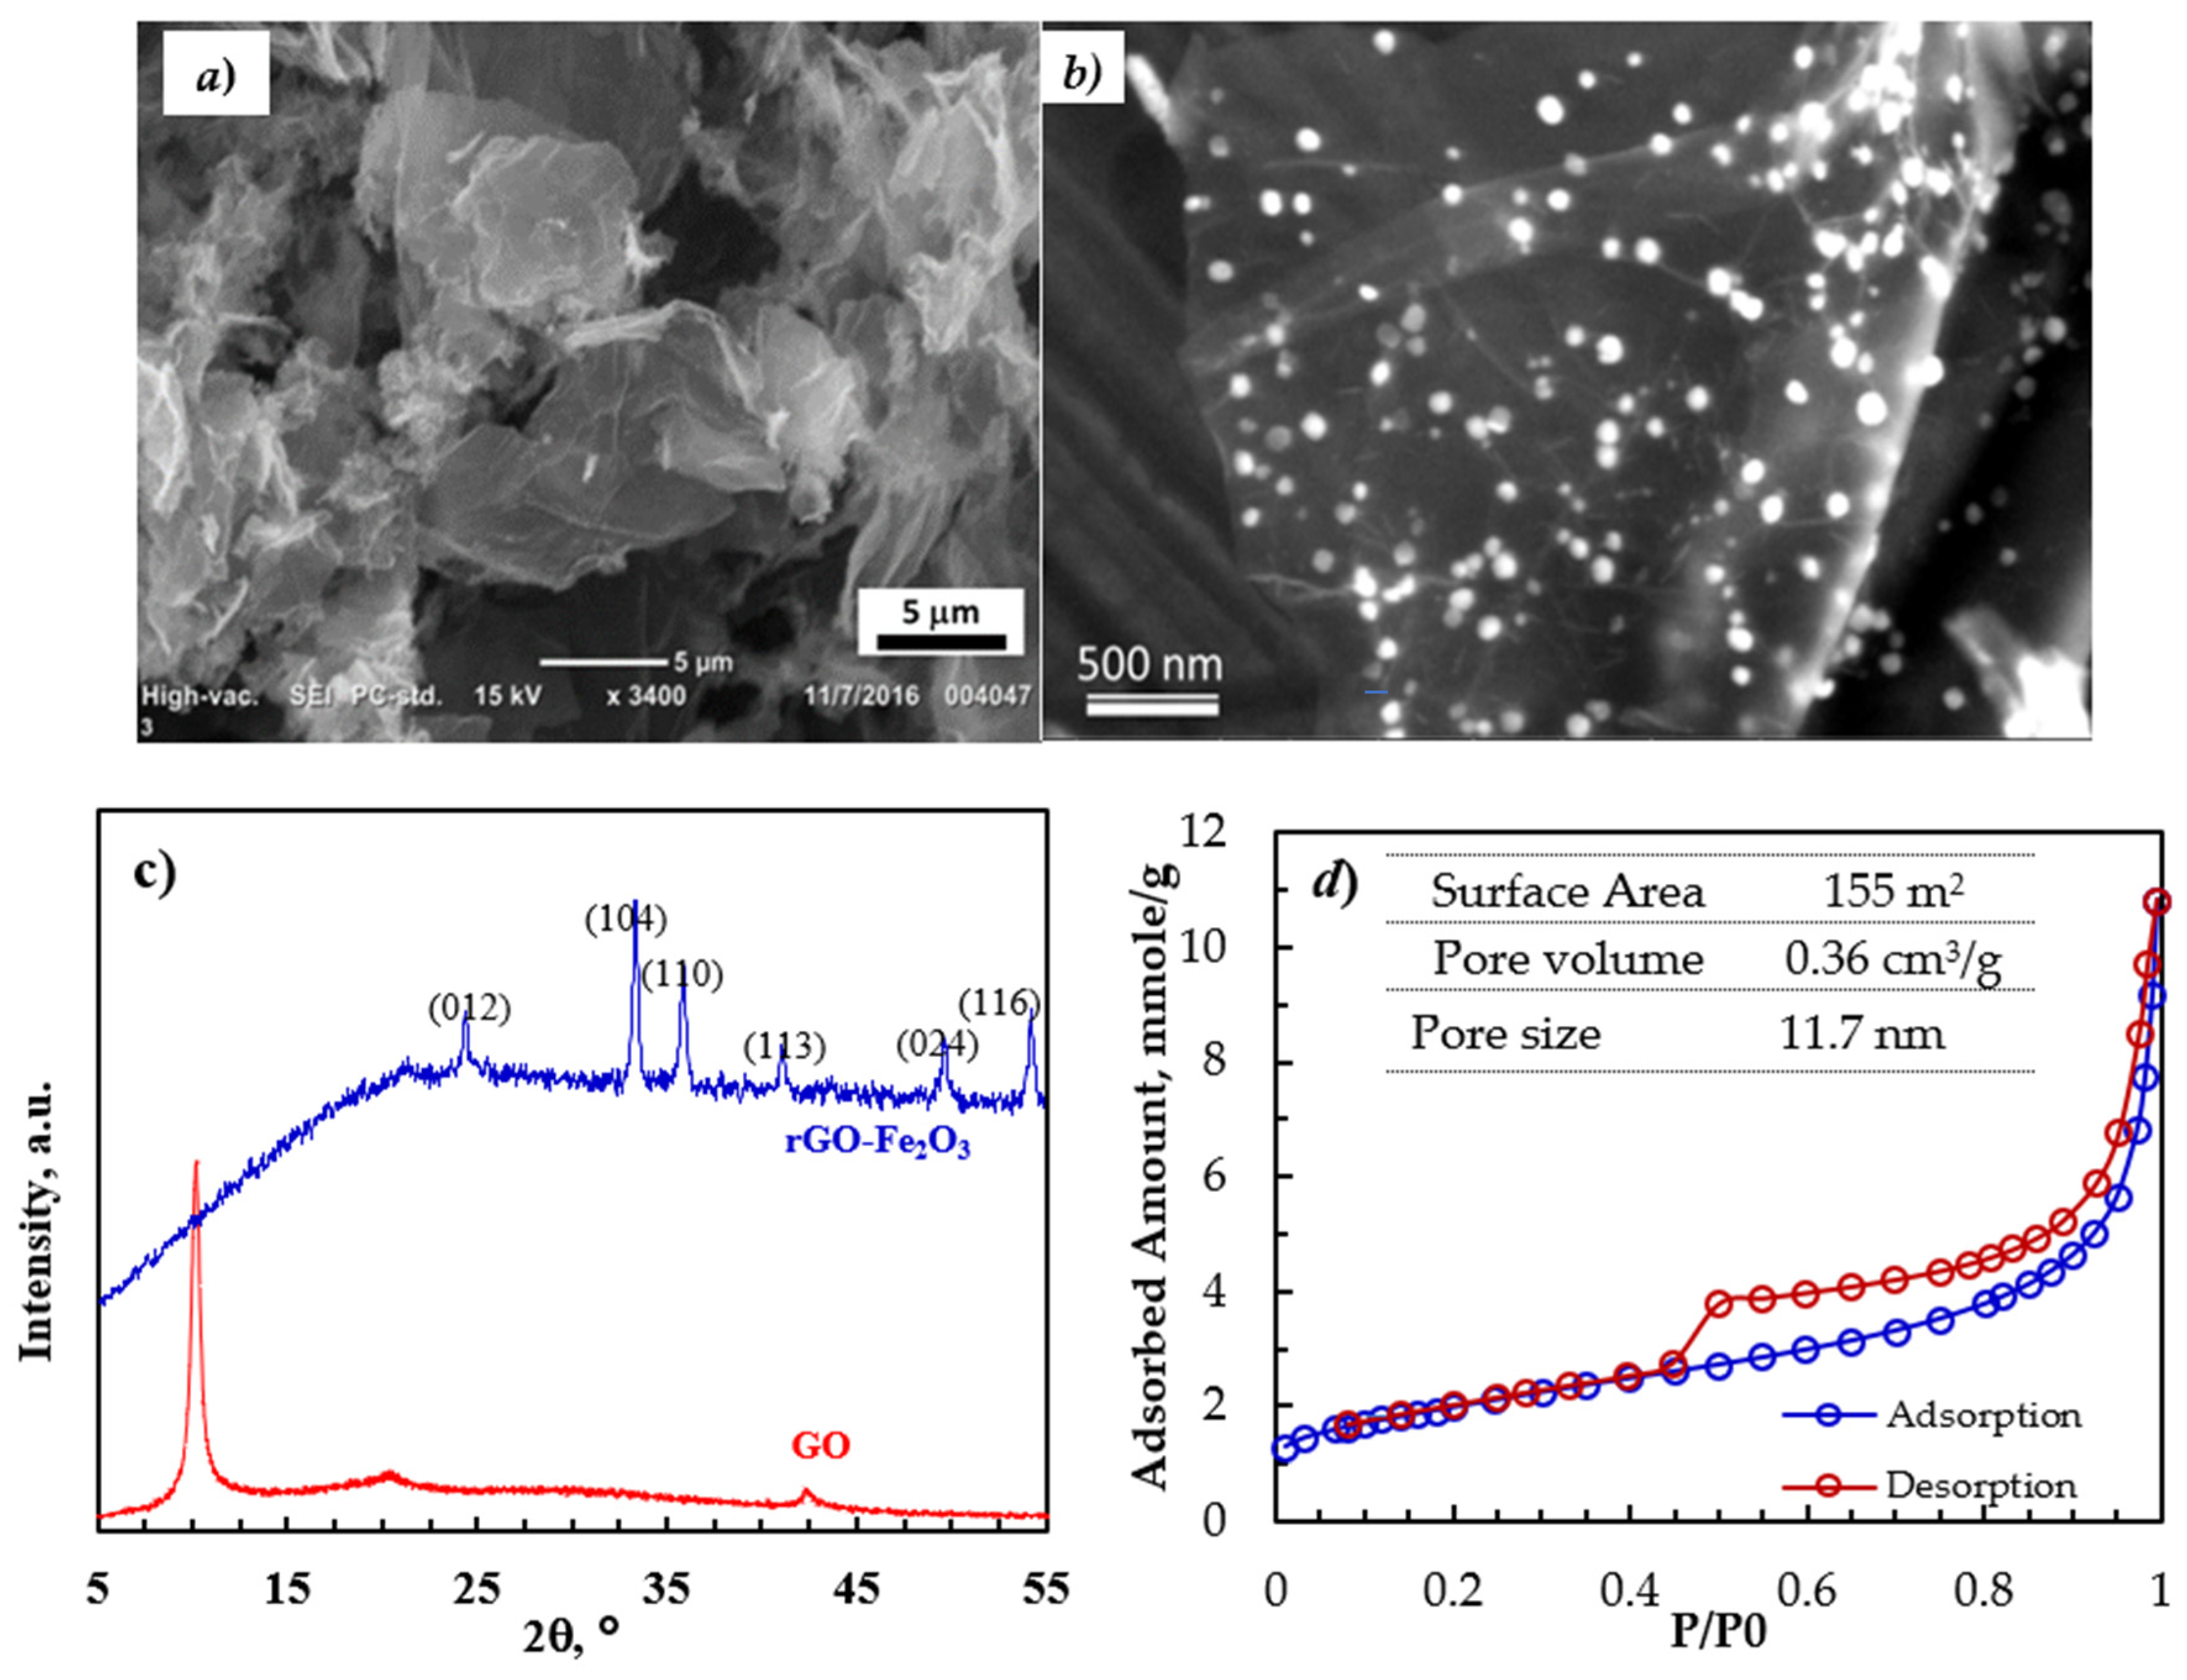
3.1. Adsorbent Characterization

Pristine graphene has a very high surface area but no functional groups to facilitate the attachment of metals or metal oxides on its surface [3]. On the other hand, GO readily disperses in water and has strong interaction with other substances, making it promising support for depositing different inorganic compounds on its surface. GO can be reduced hydrothermally [3].
The surface topography of the rGO-Fe2O3 nanocomposite was analyzed using SEM. The SEM image (Figure 1a) shows a thin platelet-like structure with lateral dimensions of a few to several µm. Moreover, the HR SEM image in Figure 1b shows the 10–20-nm Fe2O3 nanoparticles that are highly distributed on the surface of rGO.
Figure 1c shows the XRD patterns of GO and rGO-Fe2O3. The polar oxygen functionalities on the surface of GO and with the adsorbed water molecules expanded the interlayer spacing of GO compared to graphite, shifting the characteristic (002) peak to 2θ of 10.56°, corresponding to the d-spacing of 7.22 Å. Upon reducing GO to rGO, the sharp (002) peak of GO disappeared, confirming the reduction/exfoliation of GO to rGO. The diffraction pattern of the nanocomposite had diffraction peaks of the (012), (104), (110), (113), (024), and (116) planes of the α-Fe2O3 crystal consistent with the JCPDS profile no. 33–0664.
The N2 adsorption–desorption isotherms (80 K) for the rGO-Fe2O3 nanocomposite (Figure 1d) were consistent with the type IV isotherm characterized by a hysteresis loop at high P / P 0 due to the presence of mesopores. The pore volume was calculated at lower pressure using the Barrett–Joyner–Halenda (BJH) analysis. The Kelvin equation was used to determine the pore size distribution of rGO-Fe2O3. Moreover, micropore volume was calculated via density functional theory (DFT). The nanocomposite had a good surface area of 150 m2/s and a reasonable pore volume of 0.36 cm3/g.

3.2. Emulsion Characterization

The droplet size distribution of different concentrations of the diesel emulsion, as shown in Table 2, reveals a bimodal droplet size distribution with a droplet size range between 50 and 106 nm for the small population and 140 and 4800 nm for the large population. The dissolved oil’s zeta potential at various concentrations indicates the emulsion had a sizeable negative potential of −41 to −27 mV. Therefore, droplet coalescence would be unlikely due to electrostatic repulsion force [47].

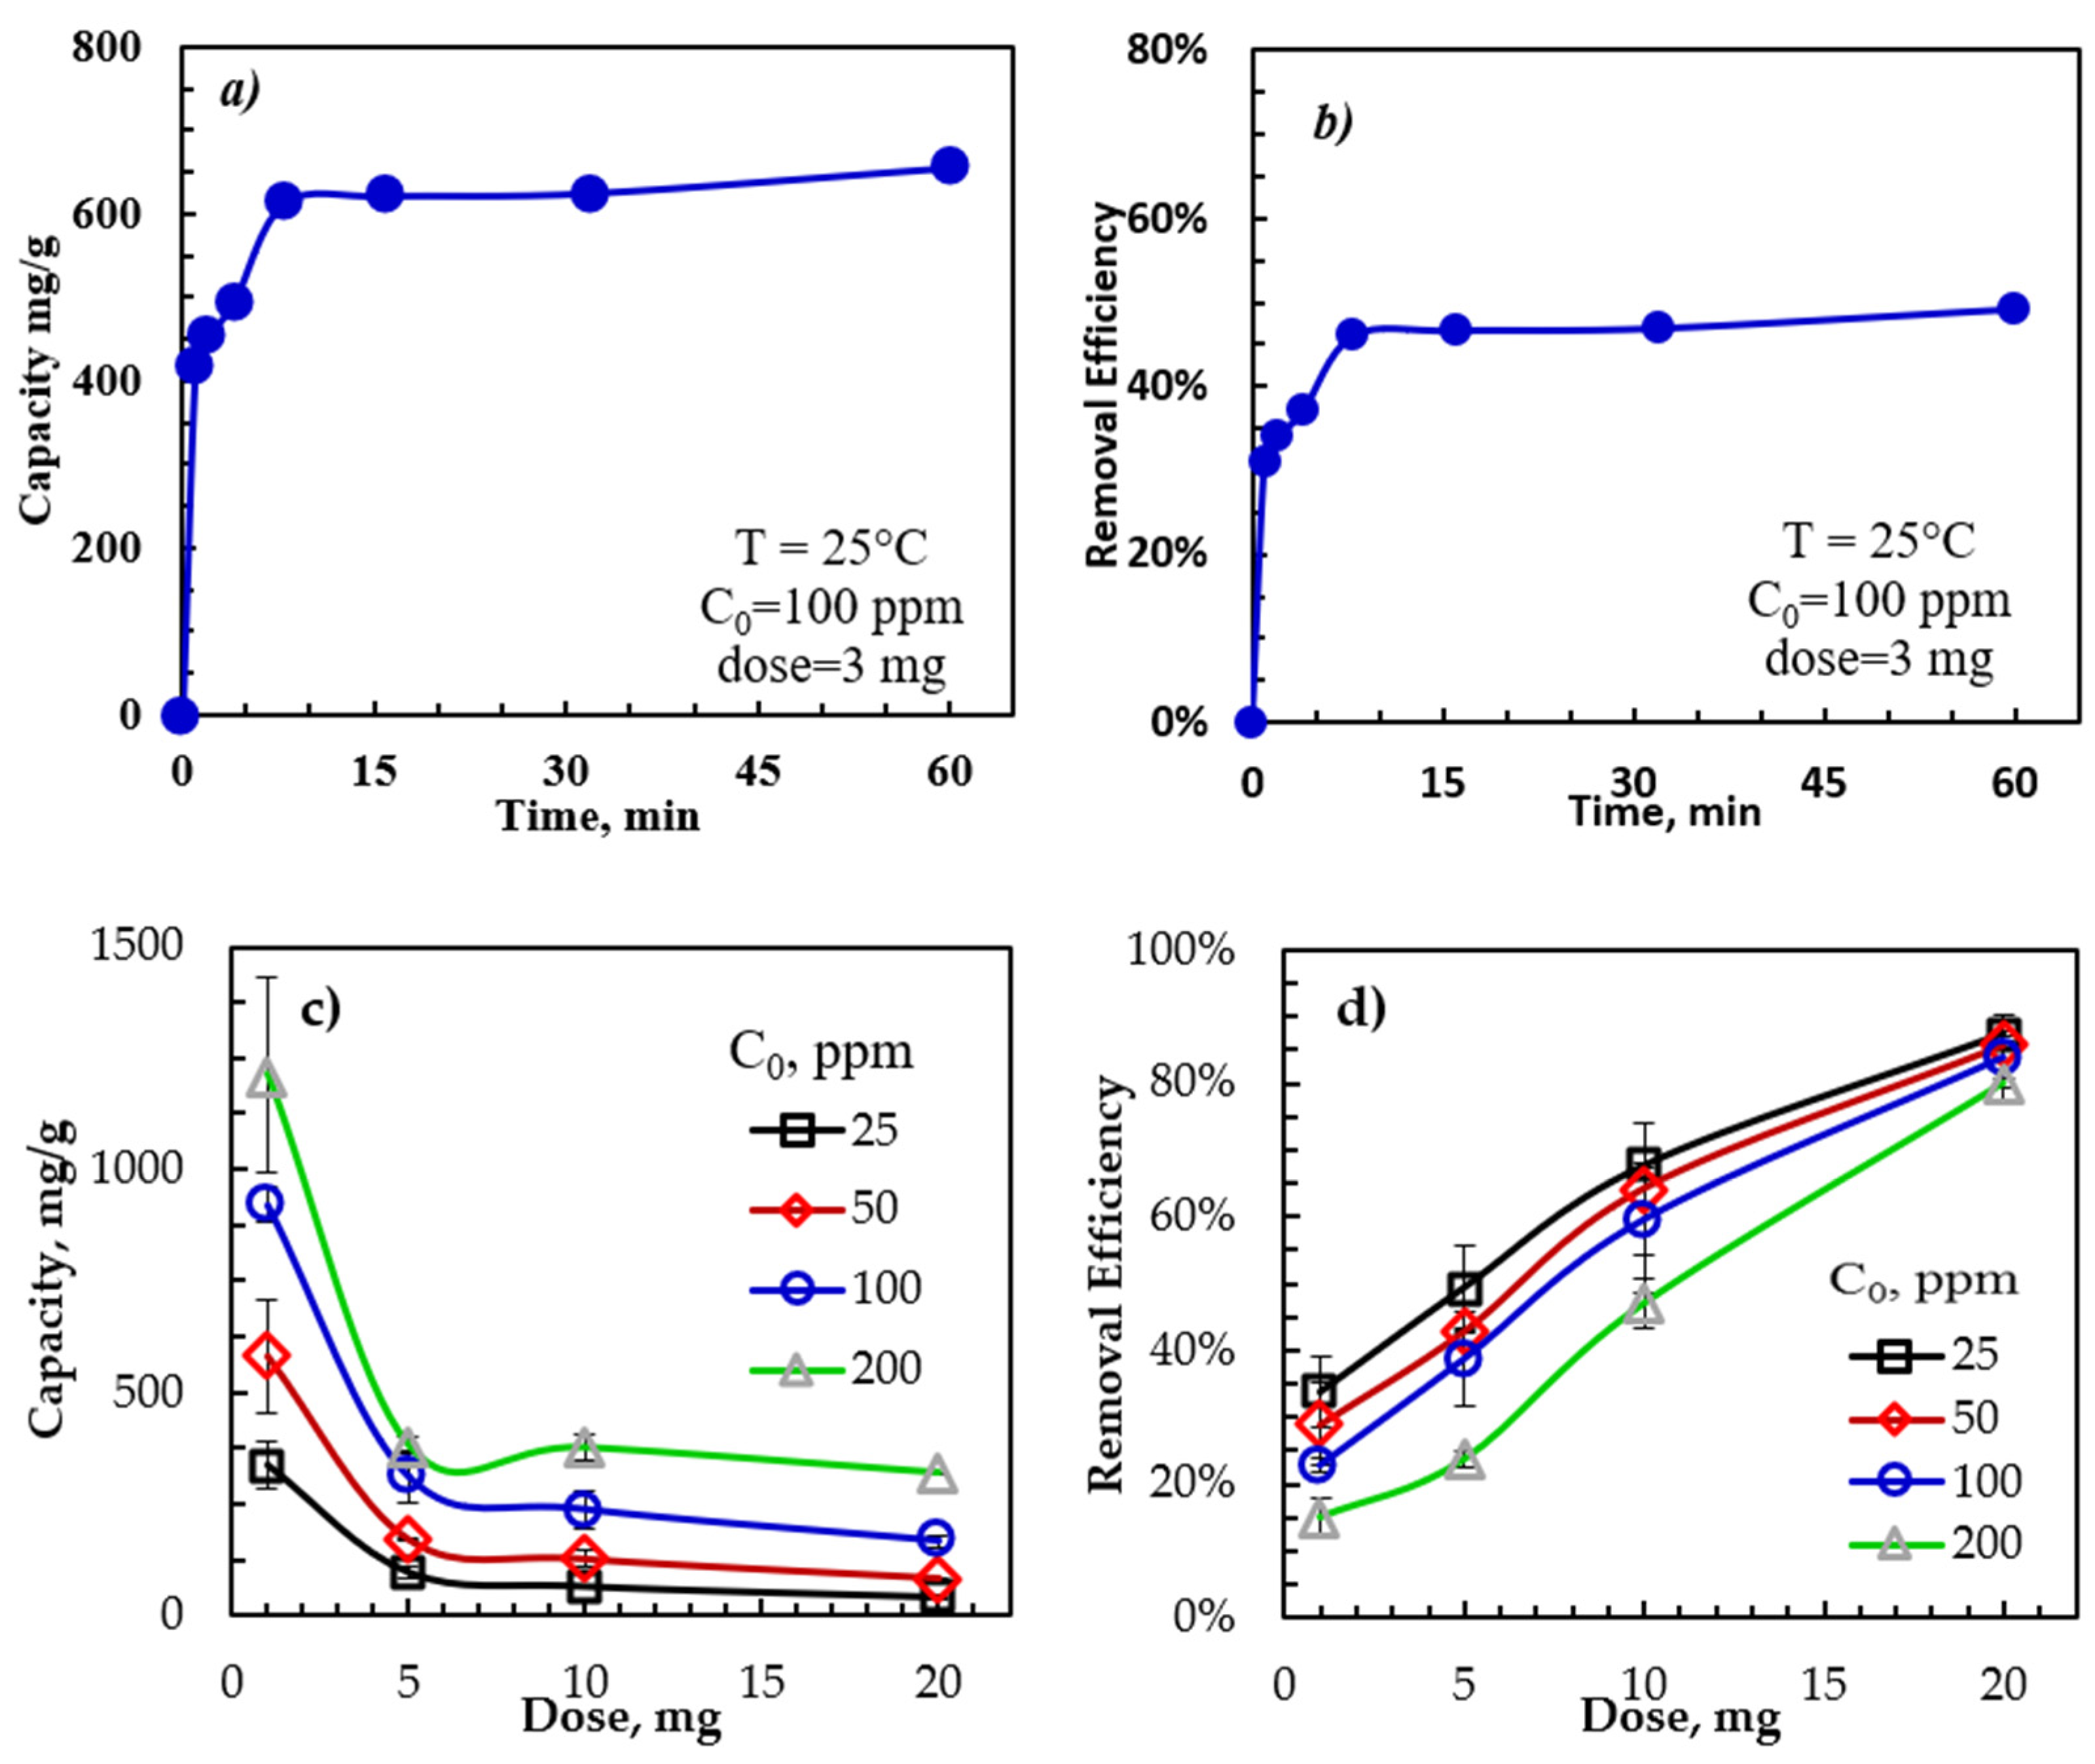
3.3. Effect of Adsorption Parameters

To evaluate the contact time effect on the adsorption capacity and removal efficiency, measurements were performed with contact times between 0 and 60 min using adsorbent dosage, initial oil concentration, temperature, and a sample trembling speed of 22 °C, 3 mg adsorbent, 100 ppm, and 350 rpm. As shown in Figure 2, the removal efficiency of the emulsified oil by rGO-Fe2O3 was very rapid in the first several minutes, with 95% of the equilibrium capacity achieved in 10 min. This initial rapid adsorption was due to the abundance of empty binding sites on the rGO-Fe2O3 surface. As the rGO-Fe2O3 surface became saturated with the adsorbed oil molecules, the adsorption rate slowed, approaching an equilibrium. In addition, the repulsion between the rGO-Fe2O3 and the emulsified oil molecules could occur due to the increased electrostatic (repulsive) force as the active sites on the rGO-Fe2O3 surface became saturated with dissolved oil molecules [48].
Batch measurements were performed to study the influence of the rGO-Fe2O3 dose and the initial oil concentration on the adsorption capacity and removal efficiency. The dosage varied between 1 and 20 mg, and the initial oil concentrations were between 25 and 200 ppm. All other parameters, including temperature, agitation speed, and contact time, were constant at 30 min, 350 rpm, and 22 ± 1 °C. Figure 2c,d show the adsorption capacity and removal efficiency dependence on the rGO-Fe2O3 nanocomposite dose and the initial oil concentration. The adsorption capacity rose with the initial oil concentration due to the increased mass transfer driving force caused by the higher concentration gradient between the bulk solution and the rGO-Fe2O3 surface at a higher initial oil concentration [49].
Furthermore, the adsorption capacity declined with rGO-Fe2O3 doses of up to 5 mg but remained constant for dosages of more than 5 mg, possibly because of the adsorbent saturation with oil. Therefore, 1 mg of rGO-Fe2O3 was chosen as the standard adsorbent dosage for the remaining experiments. Meanwhile, the removal efficiency of emulsified oil dropped with increasing C0, while the capacity increased with C0. Thus, the maximum removal efficiency occurred at lower initial concentrations due to the limited vacant adsorption sites.

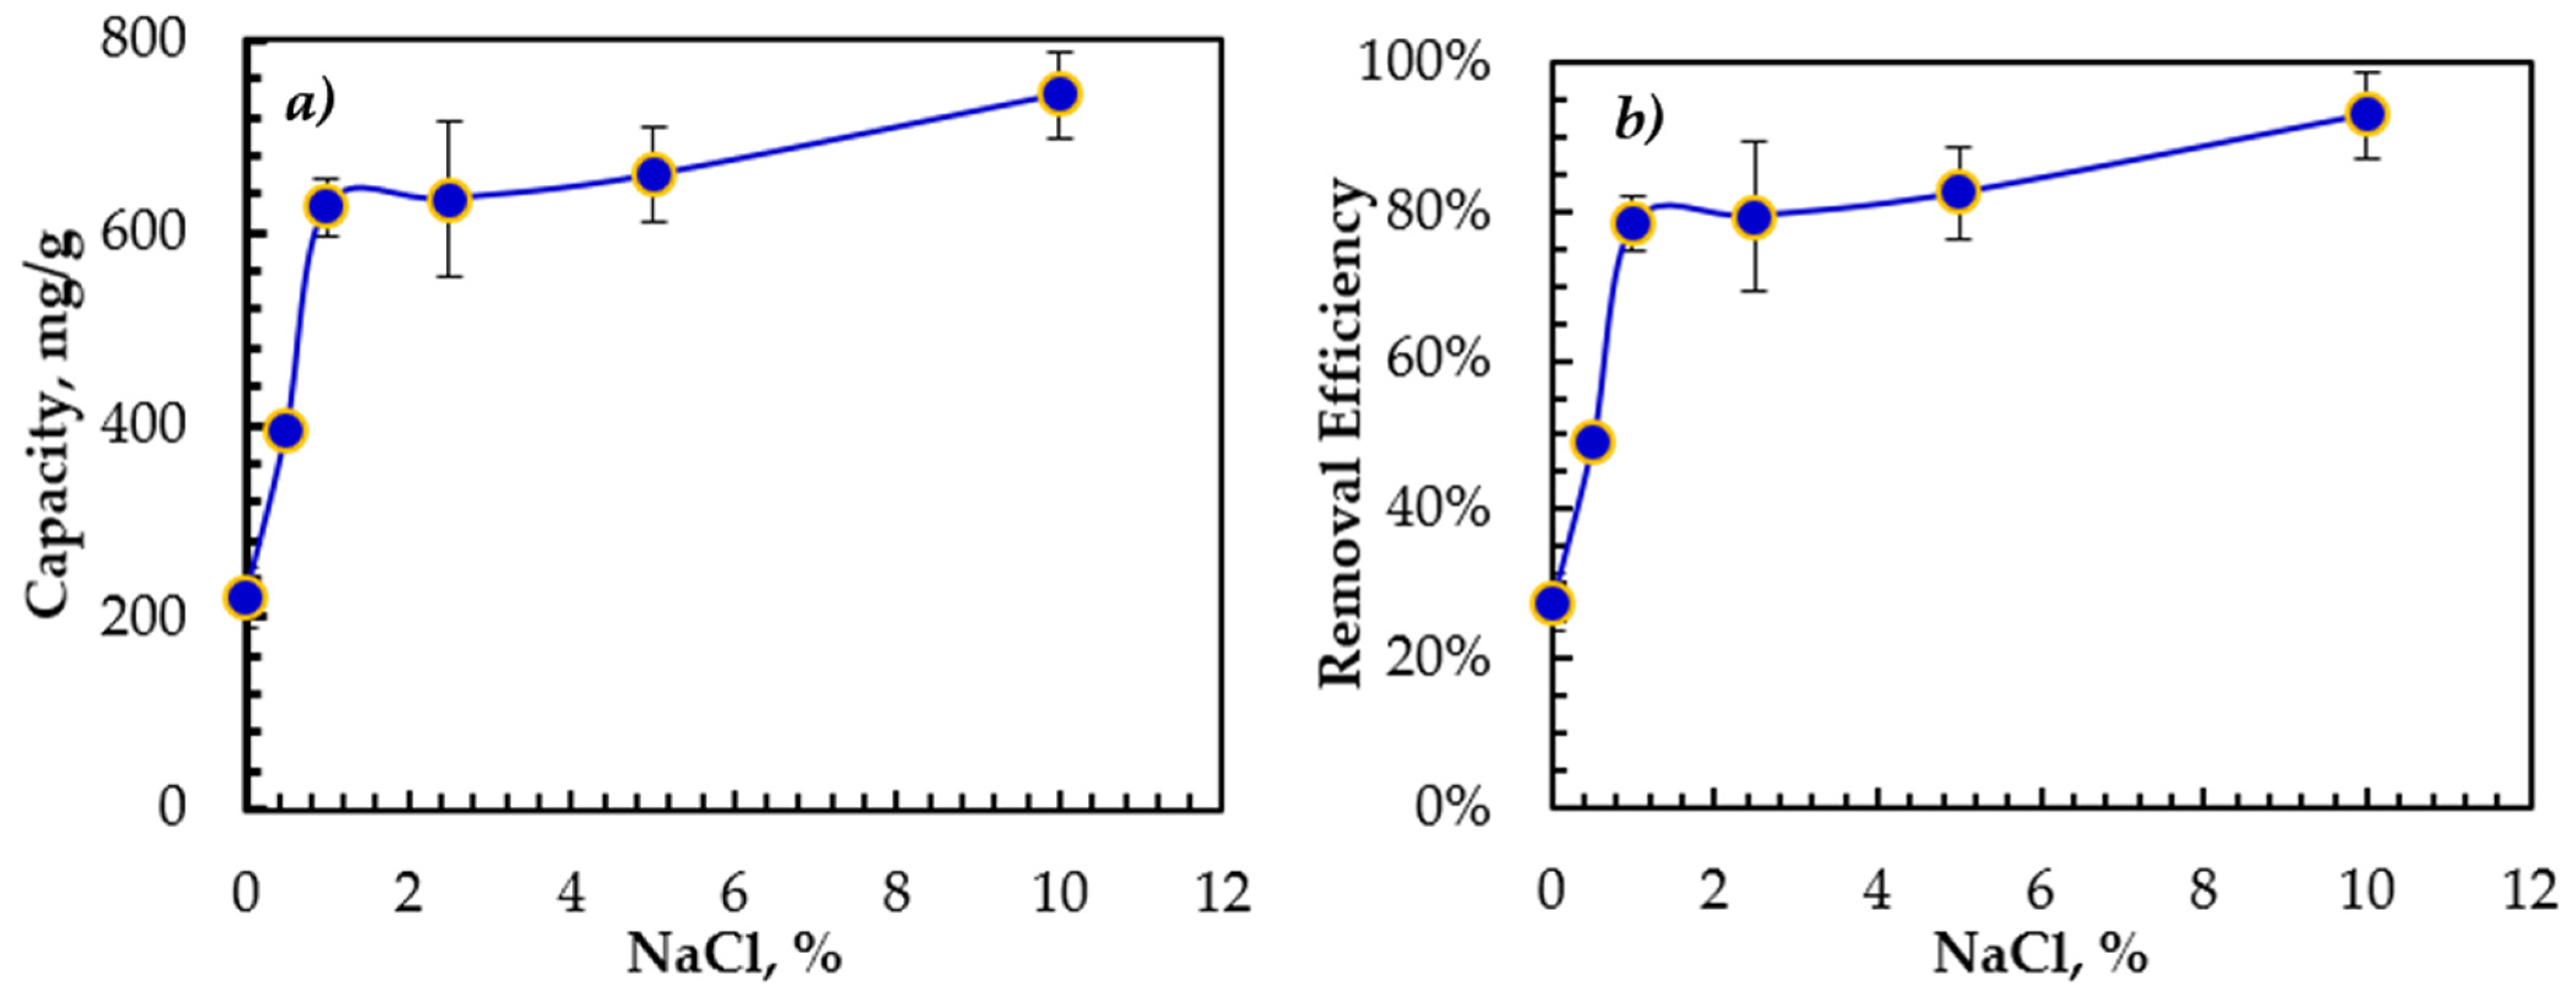
3.4. Effect of Salinity

The influence of the emulsion salinity on the oil adsorption is shown in Figure 3. The rGO-Fe2O3 adsorption capacity and removal efficiency increased with a salinity of up to 15,000 ppm, reaching a plateau at higher salinity. At higher NaCl concentrations, the dissolved oil becomes less stable in the aqueous phase, leading to droplet size expansion as confirmed by zeta potential. Therefore, the dissolved oil adhered more easily to the rGO-Fe2O3 surface, modifying the emulsified oil–water interactions and boosting the oil adsorption onto the surface of rGO-Fe2O3.

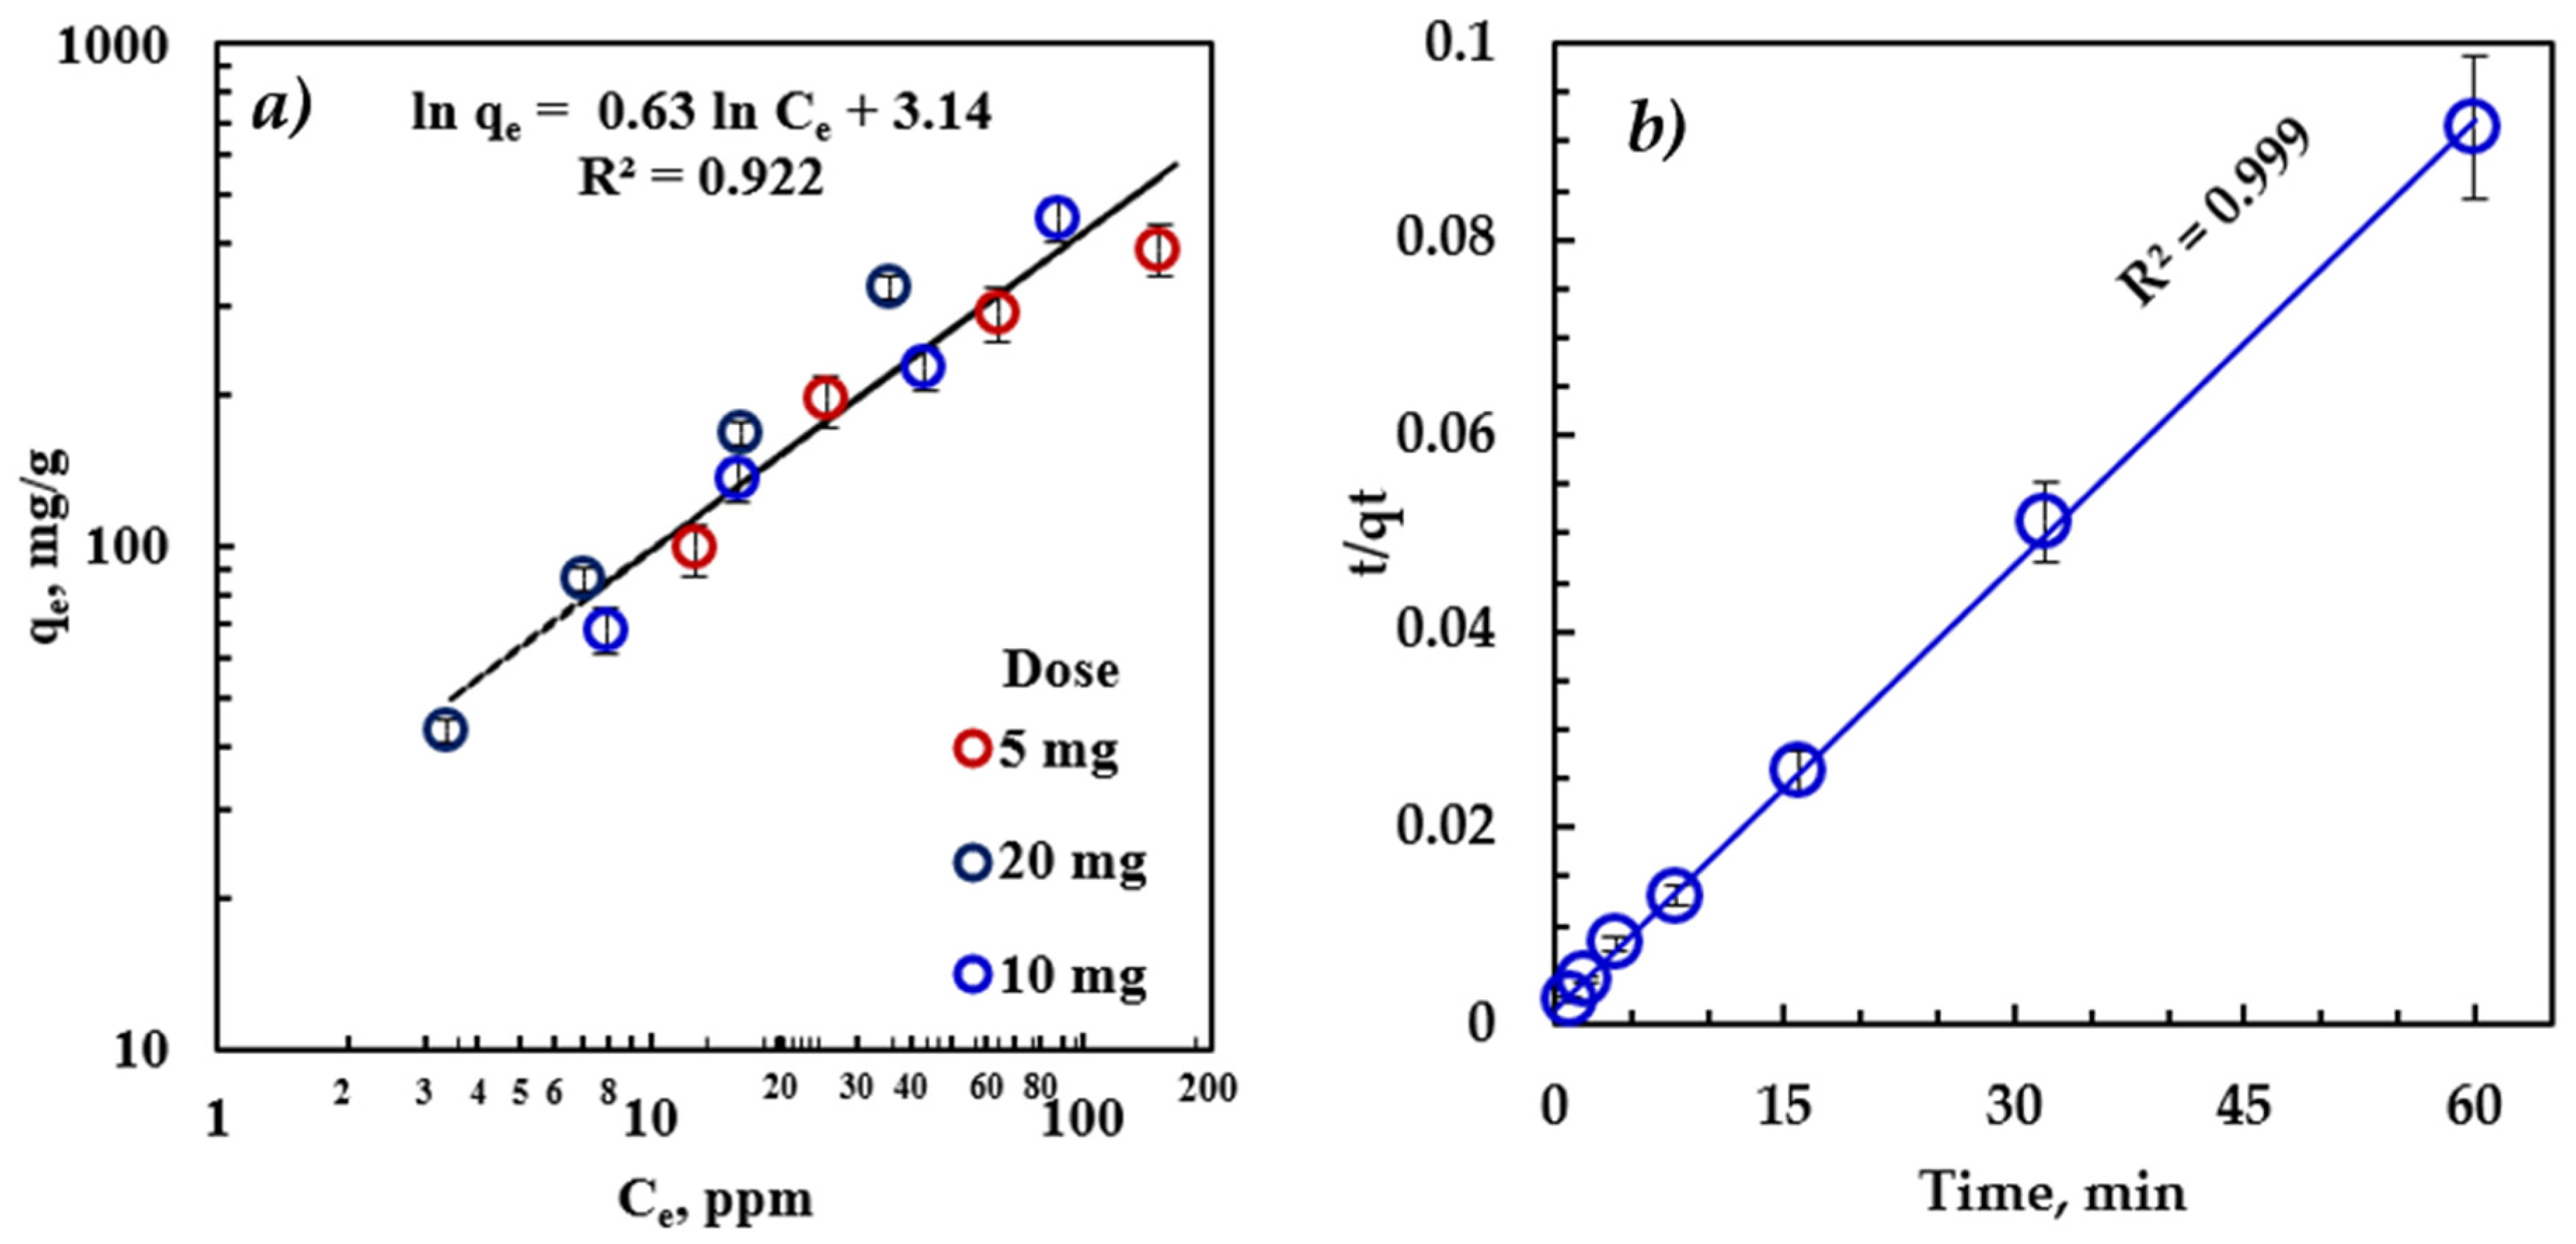
3.5. Adsorption Isotherm and Kinetics

Modeling the adsorption results is essential to reveal the adsorption mechanism and thermodynamics. The equilibrium analysis determines the maximum dissolved oil adsorbed per unit mass of adsorbent. Our results were examined against Langmuir, Freundlich, Temkin, and D-R isotherms. The regression coefficient R2 was found, and an error analysis was carried out. Here, we provide the analysis of the results using the Freundlich model, as it provides the best fit for the experimental results. The details of the analysis of the results using these isotherm models are provided in the Supplementary Information.
The Freundlich isotherm (Figure 4a) provided an excellent fit for the experimental adsorption data, indicating that the adsorption mechanism is not limited to the monolayer structure. Therefore, the amount of oil adsorbed on rGO-Fe2O3 adsorbents was the total of adsorption on all sites, with more substantial energy binding sites at the beginning and exponentially decaying as the adsorption process moved towards completion.
The parameters of the Freundlich isotherm model (Table 3) validate the excellent agreement between the model and the experimental results, indicating that oil adsorption on heterogeneous sites is the adsorption mechanism [6]. The heterogeneous nature of the adsorption process can be attributed to the different sizes of hydrocarbon molecules comprising the diesel oil and the presence of rGO and Fe2O3 sites. The Freundlich parameter, n, was greater than 1, suggesting that the adsorption of emulsified oil onto rGO-Fe2O3-NC is favorable, and the mechanism is physical adsorption. The Freundlich model is the optimal isotherm to describe the physical adsorption mechanisms [50]. Moreover, the measured adsorption capacity was consistent with the model prediction, confirming that Freundlich is the correct isotherm for this process, indicating the multi-layer adsorption characteristic.
Practical applications require understanding the kinetics of the adsorption mechanism. The adsorption kinetic study is essential to evaluate the performance of a batch and continuous flow adsorber. Additionally, it can verify the solute uptake rate to assess the residence time needed to complete adsorption. Numerous mathematical models describe the adsorption kinetics, classified as adsorption reaction and diffusion models. This study employed the most widely used sorption reaction models, pseudo-first-order (Lagergren model) and pseudo-second-order kinetic models, using the accomplished experimental results.
The primary assumption of the pseudo-second-order kinetic model is that the rate-limiting step is potentially chemical adsorption, involving valent forces between the adsorbate and adsorbent [51]. In Figure 4, the R2 > 0.999 indicates that this kinetic model can explain nearly 100% of the difference in the response variable [51,52]. Therefore, the adsorption process of emulsified oil on rGO-Fe2O3 follows pseudo-second-order kinetics. Thus, the adsorption process is hindered by intraparticle diffusion, boundary-layer, or external diffusion. The calculated adsorption rate was 1.5 × 10⁻³  g a d s o r b e n t m i n · m g o i l , and the predicted adsorption capacity was 661.6 mg/g.

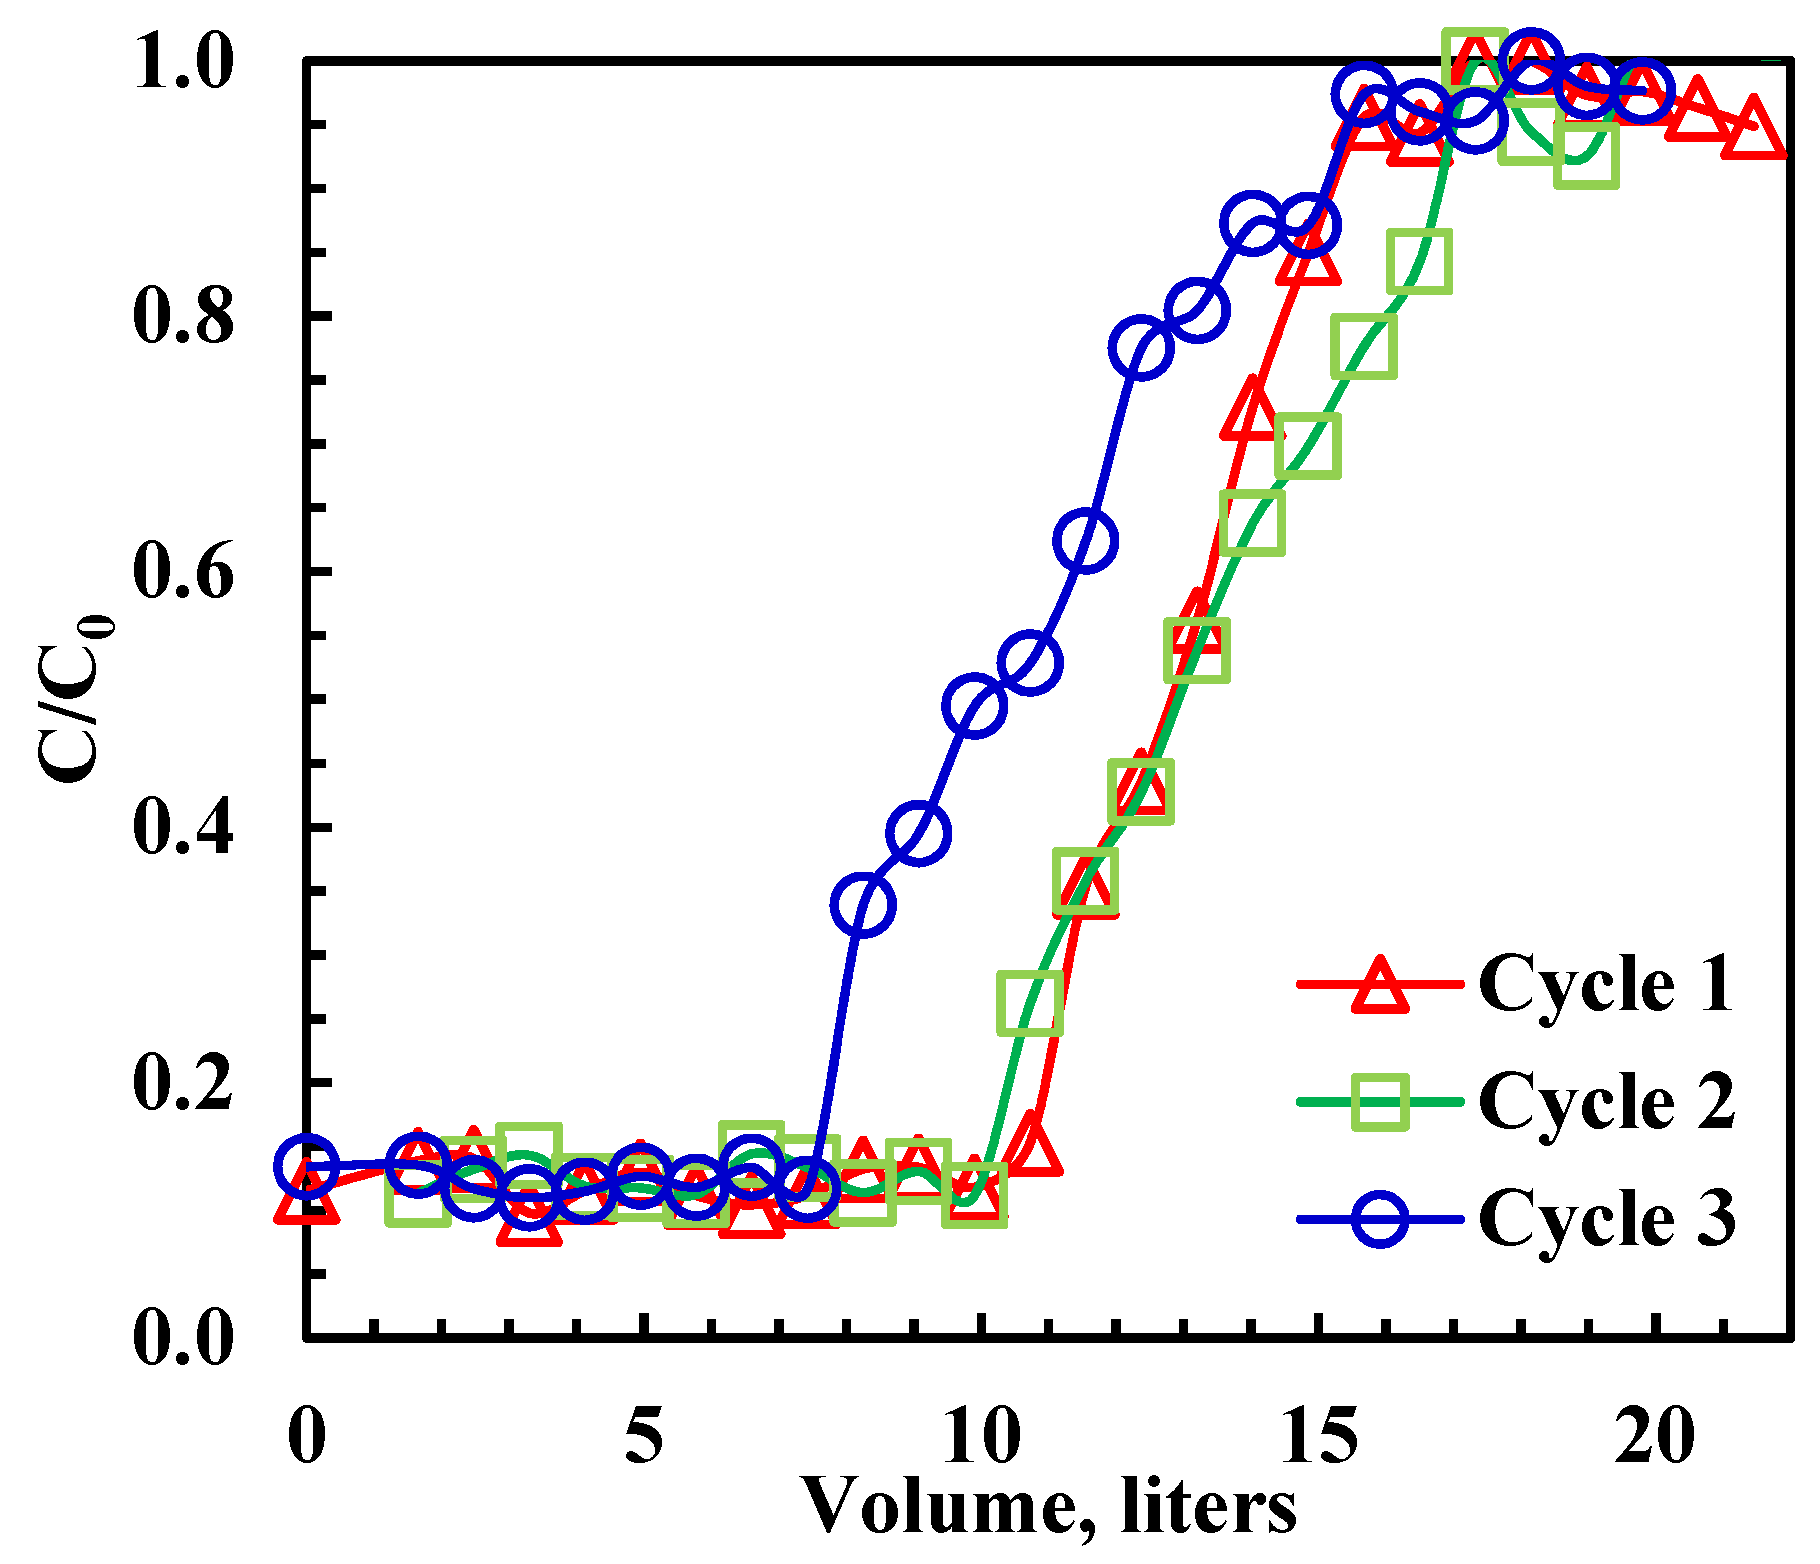
3.6. Column (Breakthrough) Study

The study aimed to verify the recyclability of rGO-Fe2O3 and establish the boundaries necessary to design manufacturing-scale adsorption columns. Several adsorption–regeneration breakthrough cycles were performed at 22 ± 1 °C using a column operating in the adsorption–desorption rhythm. Upon completing the breakthrough experiment, the adsorbed oil was recovered from rGO-Fe2O3 using ethanol. All experiments were conducted at 22 ± 1 °C and a 3.3 mL/min emulsion flow rate. The mass of rGO-Fe2O3 varied between 0.04 and 1 g, and the initial oil concentration was 100 ppm. When the rGO-Fe2O3 adsorption saturated, 30 mL of ethanol was added into the column at 3.3 mL/min, followed by washing using water to eliminate residual ethanol. The emulsion was collected from the exit of the fixed-bed outlet every 10 min, the oil concentration was measured, and the breakthrough curves were generated (Figure 5). The upper area above the breakthrough curve reflects the fixed-bed capacity and is given by [53]:
q e = G x C 0 m 0 t s 1 C t / C 0 d t
where G is the flow rate (L/min),   C 0 and C are the inlet and outlet concentration (mg/L), and t s is the time to complete saturation of the bed.
It is noted that removal efficiency (90%) did not reach 100 at the beginning of each cycle due to the short residence time (<1 min), which was due to the high flow rate. The effect of regeneration on the dynamic adsorption capacity of rGO-Fe2O3 is shown in Table 4. The capacity declined by 5.7% after the second cycle and 17% after the third cycle. Moreover, as shown in Table 4, the adsorption capacity of rGO-Fe2O3-NC was higher than that of GO. Regardless of the cycle number, the final capacity retention after three cycles of rGO-Fe2O3-NC was higher than GO [9]. Although there was a 17% reduction in adsorption capacity, the performance could be optimized by extruding the nanocomposite into porous pellets, a process routinely carried out for adsorbents and catalysts to preserve the mechanical integrity of the adsorbent.

4. Conclusions

The sustainable, eco-friendly, cost-effective, and magnetic responsive nanocomposite was synthesized to remove dissolved oil in wastewater. Hematite (α-Fe2O3) nanoparticles were incorporated into rGO to prepare the magnetic nanohybrid composite. The magnetic nanocomposite (rGO-Fe2O3) was developed using a one-step hydrothermal method with 47 wt.% iron oxides. The batch and column adsorption tests were carried out under different industrial conditions to evaluate the adsorption capacity of the prepared nanocomposite for dissolved oil removal. rGO-Fe2O3 exhibited extremely fast (within 30 min) and 90% removal of dissolved oil from its solution, having 100 mg/L concentrations with 3 mg of rGO-Fe2O3. The nanocomposite showed a maximum Langmuir adsorption capacity of 1301 mg/g using 200 mg/L of dissolved oil solution and 1 mg of rGO-Fe2O3. The adsorption capacity improved substantially when the wastewater salinity was increased compared to the 0 mg of NaCl/L solution. The adsorption kinetics followed the pseudo-second-order model and provided the best mathematical fit to the experimental data, and a good correlation was achieved with the intraparticle diffusion model.
The fixed-bed prototype with 0.2 g of rGO-Fe2O3 was used in a breakthrough experiment that confirmed its ability to treat 12 L of a 100 mg/L emulsion. The removal efficiency was ~90%, which is very promising because the residence time of the 3.3 mL/min emulsion stream was very short (<1 min). The nanocomposite was regenerated with ethanol and went through three cycles of adsorption–regeneration, with more than 80% retention of the adsorption capacity and near 100% retention of the removal efficiency. Overall, this nanocomposite had superior adsorption performance to other graphene nano-adsorbents, making rGO-Fe2O3 an optimum choice for dissolved oil removal from high-salinity wastewater as the cost of large-scale GO production continues to decrease.

Supplementary Materials

The following supporting information can be downloaded at https://www.mdpi.com/article/10.3390/app12199414/s1. Supplementary Information: Analysis of the adsorption data using different isotherm models. References [42,43,45,54] are cited in the supplementary materials.

Author Contributions

A.D. was responsible for data curation, visualization, analysis, and writing the first draft; H.R.M. was responsible for analysis, writing, review, and editing; G.M. was responsible for analysis, writing—review, and editing; A.A. was responsible for conceptualization, methodology, analysis, supervision resources, writing—review and editing. All authors have read and agreed to the published version of the manuscript.

Funding

This research was funded by Qatar National Research Fund (QNRF) through a QRLP postgraduate award granted to Mr. Ahmad Diraki. The APC was funded by Qatar National Library (QNL).

Institutional Review Board Statement

Not applicable.

Informed Consent Statement

Not applicable.

Data Availability Statement

Data can be obtained via a request to the corresponding author (A.A.).

Acknowledgments

The authors acknowledge the financial support of the Qatar National Research Fund (QNRF) for the QRLP postgraduate award granted to Ahmad Diraki. Open access funding provided by Qatar National Library.

Conflicts of Interest

The authors declare no conflict of interest.

References

  1. Kraus, R. Petroleo: Prospección y Perforación; Instituto Nacional de Seguridad e Higiene en el Trabajo: Madrid, Spain, 2012; pp. 1–16. [Google Scholar]
  2. Nasiri, M.; Jafari, I. Produced Water from Oil-Gas Plants: A Short Review on Challenges and Opportunities. Period. Polytech. Chem. Eng. 2017, 61, 73–81. [Google Scholar] [CrossRef]
  3. Veil, J.A.; Puder, M.G.; Elcock, D. A White Paper Describing Produced Water from Production of Crude Oil, Natural Gas, and Coal Bed Methane; Argonne National Laboratory: Chicago, IL, USA, 2004. [Google Scholar]
  4. Arthur, J.D.; Langhus, B.G.; Patel, C. Technical Summary of Oil & Gas Produced Water Treatment Technologies; All Consulting, LLC: Tulsa, OK, USA, 2005. [Google Scholar]
  5. Igunnu, E.T.; Chen, G.Z. Produced water treatment technologies. Int. J. Low-Carbon Technol. 2014, 9, 157–177. [Google Scholar] [CrossRef]
  6. Dąbrowski, A. Adsorption—From theory to practice. Adv. Colloid Interface Sci. 2001, 93, 135–224. [Google Scholar] [CrossRef]
  7. Zhao, Y.; Hu, C.; Hu, Y.; Cheng, H.; Shi, G.; Qu, L. A versatile, ultralight, nitrogen-doped graphene framework. Angew. Chem. Int. Ed. 2012, 51, 11371–11375. [Google Scholar] [CrossRef]
  8. Rickerby, D.; Morrison, M. Nanotechnology and the environment: A European perspective. Sci. Technol. Adv. Mater. 2007, 8, 19. [Google Scholar] [CrossRef]
  9. Diraki, A.; Mackey, H.R.; McKay, G.; Abdala, A. Removal of emulsified and dissolved diesel oil from high salinity wastewater by adsorption onto graphene oxide. J. Environ. Chem. Eng. 2019, 7, 103106. [Google Scholar] [CrossRef]
  10. Diraki, A.; Mackey, H.; McKay, G.; Abdala, A.A. Removal of oil from oil–water emulsions using thermally reduced graphene and graphene nanoplatelets. Chem. Eng. Res. Des. 2018, 137, 47–59. [Google Scholar] [CrossRef]
  11. Theron, J.; Walker, J.A.; Cloete, T. Nanotechnology and Water Treatment: Applications and Emerging Opportunities. Crit. Rev. Microbiol. 2008, 34, 43–69. [Google Scholar] [CrossRef]
  12. Dil, E.A.; Ghaedi, M.; Asfaram, A. The performance of nanorods material as adsorbent for removal of azo dyes and heavy metal ions: Application of ultrasound wave, optimization and modeling. Ultrason. Sonochem. 2017, 34, 792–802. [Google Scholar] [CrossRef]
  13. Wang, S.; Sun, H.; Ang, H.; Tadé, M. Adsorptive remediation of environmental pollutants using novel graphene-based nanomaterials. Chem. Eng. J. 2013, 226, 336–347. [Google Scholar] [CrossRef]
  14. Singh, S.; Barick, K.C.; Bahadur, D. Functional Oxide Nanomaterials and Nanocomposites for the Removal of Heavy Metals and Dyes. Nanomater. Nanotechnol. 2013, 3, 3–20. [Google Scholar] [CrossRef]
  15. Shen, Y.F.; Tang, J.; Nie, Z.H.; Wang, Y.D.; Ren, Y.; Zuo, L. Preparation and application of magnetic Fe3O4 nanoparticles for wastewater purification. Sep. Purif. Technol. 2009, 68, 312–319. [Google Scholar] [CrossRef]
  16. Tuzen, M.; Soylak, M. Multiwalled carbon nanotubes for speciation of chromium in environmental samples. J. Hazard. Mater. 2007, 147, 219–225. [Google Scholar] [CrossRef]
  17. Song, H.; Hao, L.; Tian, Y.; Wan, X.; Zhang, L.; Lv, Y. Stable and Water-Dispersible Graphene Nanosheets: Sustainable Preparation, Functionalization, and High-Performance Adsorbents for Pb2+. ChemPlusChem 2012, 77, 379. [Google Scholar] [CrossRef]
  18. Dhand, V.; Rhee, K.; Kim, H.J.; Jung, D.H. A Comprehensive Review of Graphene Nanocomposites: Research Status and Trends. J. Nanomater. 2013, 2013, 158. [Google Scholar] [CrossRef]
  19. Chandra, V.; Park, J.; Chun, Y.; Lee, J.W.; Hwang, I.-C.; Kim, K.S. Water-Dispersible Magnetite-Reduced Graphene Oxide Composites for Arsenic Removal. ACS Nano 2010, 4, 3979–3986. [Google Scholar] [CrossRef]
  20. Gandhi, M.R.; Vasudevan, S.; Shibayama, A.; Yamada, M. Graphene and Graphene-Based Composites: A Rising Star in Water Purification—A Comprehensive Overview. ChemistrySelect 2016, 1, 4358–4385. [Google Scholar] [CrossRef]
  21. Yao, Y.; Miao, S.; Liu, S.; Ma, L.P.; Sun, H.; Wang, S. Synthesis, characterization, and adsorption properties of magnetic Fe3O4@ graphene nanocomposite. Chem. Eng. J. 2012, 184, 326–332. [Google Scholar] [CrossRef]
  22. Wang, C.; Feng, C.; Gao, Y.; Ma, X.; Wu, Q.; Wang, Z. Preparation of a graphene-based magnetic nanocomposite for the removal of an organic dye from aqueous solution. Chem. Eng. J. 2011, 173, 92–97. [Google Scholar] [CrossRef]
  23. Cong, H.-P.; Ren, X.-C.; Wang, P.; Yu, S.-H. Macroscopic Multifunctional Graphene-Based Hydrogels and Aerogels by a Metal Ion Induced Self-Assembly Process. ACS Nano 2012, 6, 2693–2703. [Google Scholar] [CrossRef]
  24. Gallo-Cordova, A.; Silva-Gordillo, M.D.M.; Muñoz, G.A.; Arboleda-Faini, X.; Streitwieser, D.A. Comparison of the adsorption capacity of organic compounds present in produced water with commercially obtained walnut shell and residual biomass. J. Environ. Chem. Eng. 2017, 5, 4041–4050. [Google Scholar] [CrossRef]
  25. Fathy, M.; El-Sayed, M.; Ramzi, M.; Abdelraheem, O.H. Adsorption separation of condensate oil from produced water using ACTF prepared of oil palm leaves by batch and fixed bed techniques. Egypt. J. Pet. 2018, 27, 319–326. [Google Scholar] [CrossRef]
  26. Lei, G.; Mao, P.; He, M.; Wang, L.; Liu, X.; Zhang, A. Combination of column adsorption and supercritical fluid extraction for recovery of dissolved essential oil from distillation waste water ofYulania liliiflora. J. Chem. Technol. Biotechnol. 2016, 91, 1896–1904. [Google Scholar] [CrossRef]
  27. Meng, L.; Bao, M.; Sun, P. A new perspective of particle adsorption: Dispersed oil and granular materials interactions in simulated coastal environment. Mar. Pollut. Bull. 2017, 122, 100–109. [Google Scholar] [CrossRef]
  28. Cheu, S.C.; Kong, H.; Song, S.T.; Saman, N.; Johari, K.; Mat, H. High removal performance of dissolved oil from aqueous solution by sorption using fatty acid esterified pineapple leaves as novel sorbents. RSC Adv. 2016, 6, 13710–13722. [Google Scholar] [CrossRef]
  29. Xu, Z.; Zhu, Q.; Bian, J. Preparation of a recyclable demulsifier for the treatment of emulsified oil wastewater by chitosan modification and sodium oleate grafting Fe3O4. J. Environ. Chem. Eng. 2021, 9, 105663. [Google Scholar] [CrossRef]
  30. Xu, H.; Jia, W.; Ren, S.; Wang, J. Novel and recyclable demulsifier of expanded perlite grafted by magnetic nanoparticles for oil separation from emulsified oil wastewaters. Chem. Eng. J. 2018, 337, 10–18. [Google Scholar] [CrossRef]
  31. Yu, F.; Ma, J.; Wu, Y. Adsorption of toluene, ethylbenzene and m-xylene on multi-walled carbon nanotubes with different oxygen contents from aqueous solutions. J. Hazard. Mater. 2011, 192, 1370–1379. [Google Scholar] [CrossRef]
  32. Javadian, S.; Khalilifard, M.; Sadrpoor, S.M. Functionalized graphene oxide with core-shell of Fe3O4@oliec acid nanospheres as a recyclable demulsifier for effective removal of emulsified oil from oily wastewater. J. Water Process Eng. 2019, 32, 100961. [Google Scholar] [CrossRef]
  33. Ramezanzadeh, B.; Niroumandrad, S.; Ahmadi, A.; Mahdavian, M.; Moghadam, M.M. Enhancement of barrier and corrosion protection performance of an epoxy coating through wet transfer of amino functionalized graphene oxide. Corros. Sci. 2016, 103, 283–304. [Google Scholar] [CrossRef]
  34. Lin, J.; Huang, Y.; Huang, P. Graphene-based nanomaterials in bioimaging. Biomed. Appl. Funct. Nanomater. 2018, 247–287. [Google Scholar] [CrossRef]
  35. Al-Maas, M.; Minier-Matar, J.; Krupa, I.; Al-Maadeed, M.A.A.; Adham, S. Evaluation of polymeric adsorbents via fixed-bed columns for emulsified oil removal from industrial wastewater. J. Water Process Eng. 2022, 49, 102962. [Google Scholar] [CrossRef]
  36. Okiel, K.; El-Sayed, M.; El-Kady, M.Y. Treatment of oil–water emulsions by adsorption onto activated carbon, bentonite and deposited carbon. Egypt. J. Pet. 2011, 20, 9–15. [Google Scholar] [CrossRef]
  37. Gao, R.; Li, F.; Li, Y.; Wu, T. Effective removal of emulsified oil from oily wastewater using in situ generated metallic hydroxides from leaching solution of white mud. Chem. Eng. J. 2017, 309, 513–521. [Google Scholar] [CrossRef]
  38. Li, Y.; Wang, M.; Sun, D.; Li, Y.; Wu, T. Effective removal of emulsified oil from oily wastewater using surfactant-modified sepiolite. Appl. Clay Sci. 2018, 157, 227–236. [Google Scholar] [CrossRef]
  39. Waisi, B.I.; Arena, J.T.; Benes, N.E.; Nijmeijer, A.; McCutcheon, J.R. Activated carbon nanofiber nonwoven for removal of emulsified oil from water. Microporous Mesoporous Mater. 2020, 296, 109966. [Google Scholar] [CrossRef]
  40. Ma, J.; Fu, X.; Xia, W.; Zhang, R.; Fu, K.; Wu, G.; Jia, B.; Li, S.; Li, J. Removal of emulsified oil from water by using recyclable chitosan based covalently bonded composite magnetic flocculant: Performance and mechanism. J. Hazard. Mater. 2021, 419, 126529. [Google Scholar] [CrossRef]
  41. Yang, S.; Wang, F.; Tang, Q.; Wang, P.; Xu, Z.; Liang, J. Utilization of ultra-light carbon foams for the purification of emulsified oil wastewater and their adsorption kinetics. Chem. Phys. 2019, 516, 139–146. [Google Scholar] [CrossRef]
  42. Yang, M. Measurement of oil in produced water. In Produced Water; Springer: New York, NY, USA, 2011; pp. 57–88. [Google Scholar]
  43. Gulistan, A.S. Oil Removal from Produced Water Using Natural Materials. Ph.D. Thesis, American University of Sharjah, Sharjah, United Arab Emirates, 2014. [Google Scholar]
  44. Ho, Y.S.; McKay, G. Pseudo-second order model for sorption processes. Process Biochem. 1999, 34, 451–465. [Google Scholar] [CrossRef]
  45. Dada, A.; Olalekan, A.P.; Olatunya, A.M.; Dada, O. Langmuir, Freundlich, Temkin and Dubinin–Radushkevich isotherms studies of equilibrium sorption of Zn2+ unto phosphoric acid modified rice husk. IOSR J. Appl. Chem. 2012, 3, 38–45. [Google Scholar]
  46. Al-Meshragi, M.; Ibrahim, H.G.; Aboabboud, M.M. Equilibrium and kinetics of chromium adsorption on cement kiln dust. In Proceedings of the World Congress on Engineering and Computer Science, San Francisco, CA, USA, 22–24 October 2008. [Google Scholar]
  47. Karhu, M.; Leiviskä, T.; Tanskanen, J. Enhanced DAF in breaking up oil-in-water emulsions. Sep. Purif. Technol. 2014, 122, 231–241. [Google Scholar] [CrossRef]
  48. Kyzas, G.Z.; Travlou, N.A.; Kalogirou, O.; Deliyanni, E.A. Magnetic Graphene Oxide: Effect of Preparation Route on Reactive Black 5 Adsorption. Materials 2013, 6, 1360–1376. [Google Scholar] [CrossRef]
  49. Foo, K.Y.; Hameed, B.H. Adsorption characteristics of industrial solid waste derived activated carbon prepared by microwave heating for methylene blue. Fuel Process. Technol. 2012, 99, 103–109. [Google Scholar] [CrossRef]
  50. Chowdhury, Z.Z.; Zain, S.M.; Rashid, A.K.; Khalid, K. Linear regression analysis for kinetics and isotherm studies of sorption of manganese (II) ions onto activated palm ash from wastewater. Orient. J. Chem. 2011, 27, 405–415. [Google Scholar]
  51. Frost, J. Regression Analysis: How Do I Interpret R-Squared and Assess the Goodness-of-Fit; The Minitab Blog: State College, PA, USA, 2013; Volume 30. [Google Scholar]
  52. Muzic, M.; Sertic-Bionda, K.; Gomzi, Z.; Podolski, S.; Telen, S. Study of diesel fuel desulfurization by adsorption. Chem. Eng. Res. Des. 2010, 88, 487–495. [Google Scholar] [CrossRef]
  53. Al-Asheh, S.; Banat, F.; Al-Lagtah, N. Separation of Ethanol–Water Mixtures Using Molecular Sieves and Biobased Adsorbents. Chem. Eng. Res. Des. 2004, 82, 855–864. [Google Scholar] [CrossRef]
  54. Yuh-Shan, H. Citation review of Lagergren kinetic rate equation on adsorption reactions. Scientometrics 2004, 59, 171–177. [Google Scholar] [CrossRef]
Figure 1. (a,b) SEM of images of rGO-Fe2O3-NC, (c) XRD pattern of GO and rGO-Fe2O3-NC, and (d) N2 adsorption–desorption isotherms and the surface area, pore volume, and average pore size.
Applsci 12 09414 g001
Figure 2. Dependence of rGO-Fe2O3-NC adsorption capacity and removal efficiency on (a,b) time and (c,d) initial oil concentration and adsorbent dose.
Applsci 12 09414 g002
Figure 3. Effect of the emulsion salinity on (a) the adsorption capacity and (b) the removal efficiency. Contact time = 30 min, initial concentration = 100 ppm, T = 22 ± 1 °C, trembling speed = 350 rpm.
Applsci 12 09414 g003
Figure 4. (a) Freundlich adsorption isotherm fitting of the equilibrium data (time = 30 min, T = 22 °C) and (b) pseudo-second-order kinetic model fitting of the kinetic data (C0 = 100 ppm, dose = 5 mg, and T = 22 °C).
Applsci 12 09414 g004
Figure 5. Breakthrough curves for oil adsorption on rGO-Fe2O3. Initial concentration = 100 ppm, flowrate = 200 mL/h, bed volume = 10 mL, adsorbent mass = 1 g.
Applsci 12 09414 g005
Table 1. The adsorption capacity of the adsorbent used for removing emulsified oil from wastewater.
AdsorbentOil TypeOil Conc., ppmAdsorption Capacity, mg/gRef.
Chitosan–sodium oleate-grafted Fe3O4Diesel10,00088% removal [29]
expanded perlite-grafted APTES-Fe3O4 Crude oil300090% removal[30]
Multi-wall carbon nanotubesm-xylene8040[31]
GO core–shell Fe3O4@oliec acidCrude oil30,00047[32]
Multi-wall carbon nanotubesToluene11080[31]
Multi-wall carbon nanotubesEthylbenzene8080[31]
Bentonite granulesMotor oil 15,000176[33]
Sepiolite granulesMotor oil 15,000184[33]
Zeolite fine powderMotor oil 15,000192[33]
Activated carbon from corkSunflower oil 150233[34]
Polymeric adsorbent beadsCrude oil30301[35]
Activated carbonOilfield PW165334[36]
Metallic hydroxides from white mud leachingCrude oil1500356[37]
BentoniteOilfield PW55378[36]
Deposited carbonOilfield PW35386[36]
Surfactant-modified sepioliteCrude oil3000455[38]
Graphene aerogelDiesel–water 800745[34]
Graphene nanoplateletsDiesel200805[10]
Activated carbon nanofiber nonwovenCrude oil10,0001250[39]
Graphene oxideDiesel2001335[9]
Thermally reduced grapheneDiesel2001554[10]
Fluorinated grapheneCrude oil10001566[40]
Ultralight carbon foamCrude oil20201627[41]
rGO-Fe2O3Diesel2001280This Study
Table 2. Zeta potential of particle size for various diesel emulsion concentrations.
Emulsion Concentration, ppm
2550100200
Zeta Potential (mV)−29.2−27.4−40.6−34.4
Droplet size, Population 1 (nm)5091142106
Droplet size, Population 2 (nm)1422954800712
Table 3. Freundlich adsorption isotherm parameters of rGO-Fe2O3 for the removal of emulsified oil.
ParameterrGO-Fe2O3
n1.6
kf23
R20.922
qf1301
Table 4. Regeneration effects on adsorption capacity of rGO-Fe2O3-NC in comparison to GO.
Cycle (n)rGO-Fe2O3-NC GO [9]
qe,n (mg/g)qe,n/qe,1 (%)qe,n (mg/g)qe,n/qe,1 (%)
11279100%1140100%
2120894%113899.8%
3100283%90479%
Publisher’s Note: MDPI stays neutral with regard to jurisdictional claims in published maps and institutional affiliations.

