Abstract
In this study, we present a wideband image synthesis technique for day and night object identification. To synthesize the visible and near-infrared images, a base component and a detailed component are first decomposed using a bilateral filter, and the detailed component is synthesized using a local variance map. In addition, considering the difference in the near-infrared image characteristics between daytime and nighttime, the base components are synthesized using a luminance saturation region map and depth and penetration map using a joint bilateral filter. The proposed method overcomes the partial over- or under-exposure caused by sunlight and infrared auxiliary light, which is experienced variously in wideband imaging, and improves the identification of objects in various indoor and outdoor images compared with that achieved by existing methods by emphasizing detailed components.
1. Introduction
When a mobile camera is used for both indoor and outdoor object identification, the capturing conditions may include bright day and dark night outdoors, daylight and dark indoors, tunnels, basements, alleys, and roads with streetlights and vehicle headlights [1]. To ensure the accuracy and usefulness of object identification, it is necessary to secure sufficient image information in this range of spaces and lighting conditions. Because a near-infrared image has a lower scattering effect due to particles than that of a visible-light image, the boundary contrast is large, and more detailed information can be secured in fog, shade, and distant areas. Near-infrared images do not include color information [2]. Therefore, research on improving visibility using visible-light and near-infrared image synthesis is being actively conducted. Figure 1 shows a resulting image synthesized using visible-light and near-infrared input images. The near-infrared image can greatly improve visibility, which is lacking in the visible-light image, by providing information on regions that visible light cannot reach.
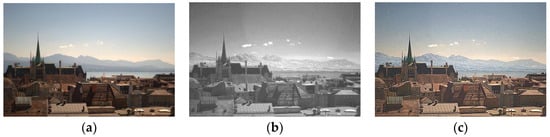
Figure 1.
Visible-light and near-infrared input and result images: (a) visible image, (b) near-infrared image, (c) fused image.
In the case of night image capture, IR LED lighting, which does not have a visual impact, is generally used for image acquisition for security or crime prevention. It can be difficult to adjust the brightness of the LED light according to the environment. Visible and near-infrared image synthesis algorithms proposed by Li and Vanmali et al. synthesized luminance channels using a weight map including local contrast and entropy, and synthesized images through post-processing of sharpening and color compensation [2,3]. However, detailed information of the near-infrared image cannot be reproduced accurately, and the boundary information is not well-defined after color compensation [1].
In this study, we produced an image with excellent color expression and boundary contrast of detailed information through a synthesis method suitable for both day and night environments, and with visible-light and near-infrared images taken temporally separated. At night, multiple images are acquired by repeatedly operating IR illumination at regular unit time intervals, and the synthesis algorithm adaptively adjusts the synthesis ratio. The proposed method can obtain matching of the viewing angles of the visible and near-infrared images and sufficient brightness from time-division image acquisition using IR lighting switching. It has advantages in terms of border contrast. The proposed image processing part consists of the base-detail layer decomposition, the base layer synthesis, the detail layer synthesis, and the color compensation and adjustment. Each part is processed in the LAB color space to preserve the color information of a visible-light image.
The base-detail layer decomposition part decomposes the input image into base and detail layers using the bilateral filter. The bilateral filter smooths the input image while preserving its main edges. The base layer is the bilateral filtered output of the input image, and the detail layer is the difference between the input image and the base layer. The proposed method applies different weight maps to the base image and the detail image to independently synthesize them, then sets the base and detail layers in the luminance channel. The base layer synthesis reduces the local contrast according to the near-infrared distribution characteristics of day and night. The detail layer synthesis acquires detailed information from the near-infrared image that cannot be expressed in the visible-light image. The process is carried out considering detailed information regarding the area where near-infrared rays do not pass depending on the medium. Then the fused luminance image is obtained by adding the synthesized base layer and detail layer. Finally, a resulting image is generated through a color compensation and adjustment step using the ratio of change between the luminance channel of the visible-light image and the fused luminance channel.
Recently, as object detection research using deep learning is actively conducted, the importance of clearly identifying objects in dark areas under the low-light condition is increasing. It is necessary to improve the important information in the images by synthesizing the visible and near-infrared image pairs. The distribution characteristics of infrared light during the day and night are different, and it is necessary to synthesize visible and infrared images adaptive to various environments. Existing methods focus on synthesizing the daytime visible and IR natural light images. However, at night, the multiplexed image synthesis should reflect the light-emitting IR characteristics. Therefore, in this study, we propose a day and night adaptive visible and near-infrared image synthesis method considering near-infrared band characteristics of both daytime and nighttime. The proposed method can be applied to fixed surveillance cameras such as CCTVs and mobile surveillance cameras used in autonomous vehicles.
This paper is organized as follows: Section 2 explains the significance of near-infrared and visible-light image synthesis and previous studies, Section 3 provides a proposed synthesis method. Section 3.1 introduces a visible-light and near-infrared image acquisition camera system, Section 3.2 describes the base-detail layer decomposition process. The base layer and detail layer synthesis processes are addressed in Section 3.3 and 3.4 with a comparison of the daytime and nighttime images. Section 3.5 represents the color compensation step for resolving color distortion and imbalance caused by luminance channel synthesis. Section 4 shows the results of visible-light and near-infrared image synthesis compared to the results of previous studies. Finally, a summary and conclusions are presented in Section 5.
2. Related works
2.1. Synthesis of Visible and Near-Infrared Images
The wavelength band of light that can be visually recognized is 400–800 nm, and the wavelength band of nighttime infrared auxiliary light is approximately 800–1500 nm. Near-infrared rays experience a low degree of scattering effect by particles in the atmosphere; therefore, there is a region with strong object contrast and sharpness. Considering these characteristics, both visible-light and near-infrared images can be captured and the improved images may be fused and reproduced. Visible-light and near-infrared image synthesis measures information visibility primarily through the local contrast of visible and near-infrared images and controls the synthesis ratio so that the boundaries and textures of the entire image are maximally expressed. In particular, it can be used to accurately judge the edge of an object by synthesizing visible and near-infrared images not only at night but also in fog, smoke, or shaded areas during the daytime [1,2,3,4,5].
Representatively, the visible-light and near-infrared image synthesis algorithm using latent low-rank representation (LatRR) decomposes the fusion process into low-rank parts and saliency parts, which presents global and local structure information. After decomposition, both low-rank and saliency parts are fused by weighted-average strategy with different weighting values. Finally, the fused result is obtained by adding fused low-rank and saliency parts [6]. However, the local edge information of the near-infrared image is not well-preserved, and the color expression is not properly presented, especially in nighttime images.
In addition, the synthesis algorithm adopted a multiresolution decomposition method, which uses the Laplacian–Gaussian pyramids to obtain the details of the near-infrared image, and measures local contrast, local entropy, and visibility to create a weight map to synthesize the image, followed by color and sharpness correction to synthesize the resulting image [2]. However, the details of the near-infrared image cannot be conveyed reliably during synthesis, and the color information is unnaturally distorted by excessive color compensation and boundary enhancement filters. A method using principal component analysis (PCA) has been proposed to transfer the details more effectively from the near-infrared image and to preserve better color chrominance. A weight map for the detail layer is created from the PCA analysis of the visible and near-infrared scenes including the PCA-skipping mask filter [7]. In addition, the enhanced fusion method for the base layer synthesis proposed the local background tone compression to emphasize the detail layer [8]. However, for night images, the algorithm fails to resolve the color distortion and block noise problems are caused by excessive tone scaling.
2.2. Joint Bilateral filter
In this study, a joint bilateral filter was used to detect luminance saturation. The bilateral filter, which is a low-pass filter with boundary-preservation characteristics, has excellent performance and is used in many fields. The bilateral filter uses two Gaussian functions for each distance difference and intensity difference from adjacent pixels [9]. The bilateral filter (B) is obtained as follows:
where is the input image, is the kernel size, is a Gaussian function for boundary preservation that adjusts the blur weight by color difference with adjacent pixels, and is a Gaussian function that adjusts the blur weight according to the distance difference from adjacent pixels in the spatial domain. In this case, the widths of the Gaussian functions and are determined by the standard deviations and , respectively. stands for the normalization term.
However, the bilateral filter has limitations in denoising because it uses a single image. Eisemann and Petschnigg et al. used an additional flash image with a strong signal-to-noise ratio (SNR) adjacent to the existing two Gaussian functions. A joint bilateral filter that applies a term to the displacement difference with a pixel has been proposed [10,11,12]. This joint bilateral filter receives two images and applies the filter to the image by adjusting the blurring weight using the boundary information of the remaining image in which the boundary information is relatively well-preserved [13]. The joint bilateral filter was obtained as follows:
where , which adjusts the blur weight according to the color difference between adjacent pixels, uses the intensity difference of image instead of that of image , unlike the bilateral filter. Image is an image in which the boundary information is relatively well-preserved.
3. Proposed method
Figure 2 shows the visible and near-infrared light image synthesis algorithm proposed in this study. The proposed method is composed of an image pair acquisition system, base-detail decomposition, base layer synthesis, detail layer synthesis, and color compensation. Image acquisition describes a method for acquiring visible and near-infrared image pairs, and decomposes each image into a base layer and a detail layer during the base-detail decomposition process. After that, each layer goes through the synthesis process independently, which is conducted in the base layer synthesis and the detail layer synthesis. The base layer is synthesized by adopting a different synthesis method for the day and night images using the joint bilateral filter and the near-infrared light penetration characteristics according to day- and nighttime images. Detail layer is synthesized using weight map generated by the image variance. Then, the fused luminance image is obtained by adding the synthesized base layer and detail layer. Finally, the final result can be derived through a color compensation step according to the luminance channel value changed in the synthesis process. In Figure 2, each subpart of Chapter 3 is separated by blocks of different colors.
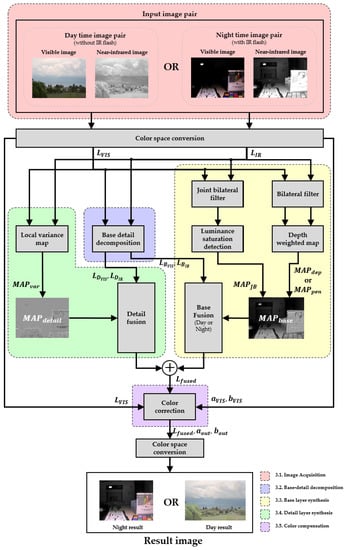
Figure 2.
Flowchart of proposed algorithm.
3.1. Single Camera Module Time-Division Image Acquisition System
In this study, daytime images were obtained by temporally multiplexed capturing using an IR cut filer, and in the case of night images, a separately manufactured imaging device was used. A time-division image acquisition system using a single CMOS broadband camera module was applied to obtain visible and near-infrared images, thereby solving the problem of matching errors due to the optical path difference occurring in a dual camera system. However, if a time-sharing system is used, motion blur may occur because of a time-shifting error. To address this issue, different exposure times were set for the visible-light image and the near-infrared image, and when the amount of light was insufficient owing to a short exposure time, the amount of light was secured by using the IR auxiliary light. The decision to use the IR auxiliary light was made according to the surrounding environment.
The time-shifting error and motion blur both increase if the exposure time is increased to secure sufficient light while acquiring low-light images with minimized exposure time. The increased noise is unfavorable for high-quality image acquisition. Therefore, an image is obtained with minimized time-shifting error, motion blur, and noise by supplying a sufficient amount of light in a short time using the IR auxiliary light. In the case of daytime images, which experience luminance saturation when using IR-assisted light, images are acquired while limiting the use of IR-assisted light [11].
When acquiring visible-light and near-infrared images, it is difficult to adaptively adjust the brightness of the lighting according to environmental changes. Therefore, in this study, we proposed a time-division image acquisition system using a camera trigger signal and a flash-type IR auxiliary light switching signal, as shown in the flowchart in Figure 3. As shown in Figure 4b,c, by repeatedly operating the auxiliary light with the IR auxiliary light switching signal, a sufficient amount of light is first secured in the near-infrared image using a fixed IR flash of sufficient brightness, and the luminance channel visibility is then secured by adjusting the synthesis ratio with the visible-light image for the saturated area.
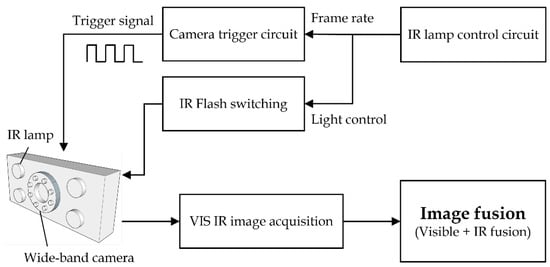
Figure 3.
Image acquisition device operation flowchart.
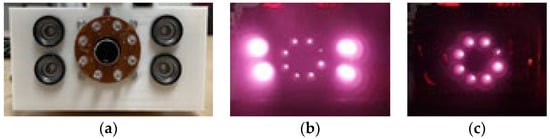
Figure 4.
Implementation of broadband imaging module: (a) camera module, (b) IR flash on, (c) IR flash off.
3.2. Base-Detail Layer Decomposition
For image processing of separate layers for the acquired images, first the luminance component to be synthesized is separated from the two input images through LAB color space conversion. An image in the LAB color space has an advantage in that the color information and luminance information of the image can be independently processed because the color difference and luminance channels are separated. Next, a bilateral filter is applied to decompose the two images into a base layer and a detail layer. The bilateral filter preserves the strong boundary components and blurs the detai to obtain a base layer image. In addition, the detail layer is obtained from the difference between the resulting image and the luminance channel image [13]. The image decomposition using a bilateral filter is shown in Figure 5.
where is a base layer image obtained by applying a bilateral filter to the LAB color space luminance image , and . is a sublayer image obtained from the luminance image and base layer image. The kernel size of the bilateral filter for base-detail decomposition acts as the most critical factor that distinguishes the base and detail in the image. The larger the kernel size, the bigger the details that are included in the detail layer. In this study, the (21, 21) kernel was applied for decomposition.
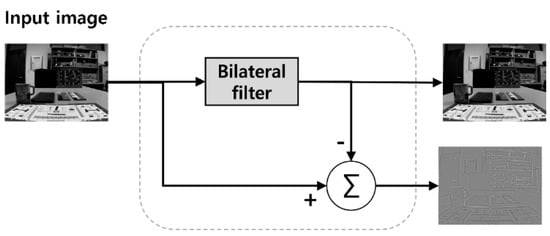
Figure 5.
Image decomposition by the bilateral filter.
3.3. Base Layer Synthesis
The base layers of the separated visible-light and near-infrared images are synthesized by forming different weight maps according to the infrared natural and auxiliary light characteristics. In the case of daytime images, the intensity and diffusion of IR natural light in the near-infrared images are secured compared to visible images in distant, fog, and shade areas. In contrast, at night, IR auxiliary light is used to compensate for the low-light conditions, long-range IR infiltration is weak in the nighttime infrared images, and the near-distance luminance saturation is relatively strong due to the IR flash.
The main purpose of base layer synthesis is local background tone compression through synthetic ratio control of visible-light images and near-infrared images. This compresses the local tone range of the base layer within the limited luminance range of the display, thereby improving the expression performance of the detailed layer and enhancing the clarity. Therefore, in low-light areas, such as backlight and shade, which inhibit visibility, the synthesis ratio of an infrared image with a relatively large luminance value must be increased, and in a high-light area, such as the anterior saturation area caused by night auxiliary lights, the ratio of visible images with a relatively small luminance value should be increased.
As shown in Figure 6a,b, the left-side visible-light luminance image has low-level shading information on average, and the right-side near-infrared luminance image is bright on average and has many saturated regions owing to the extended band component. The image synthesis ratio needs to be adjusted for these regions. A bilateral filter with edge preservation is used to divide local regions according to strong boundary components and compress tones from the synthetic map, from which details are removed. The structural formula of the bilateral filter used in each synthesis map and the VIS-IR joint bilateral filter blurred by the boundary information of the near-infrared image is as follows:
where is a bilateral filter map, which is an image of applying a bilateral filter by substituting visible-light luminance images into the input image I in Equation (1). In addition, in Equation (2), is a joint bilateral filter map obtained by substituting a visible-light luminance image into the input image I and a near-infrared luminance image into the input image to determine the blur weight using boundary information. is a min–max normalization function that normalizes the image to a value between 0 and 1.
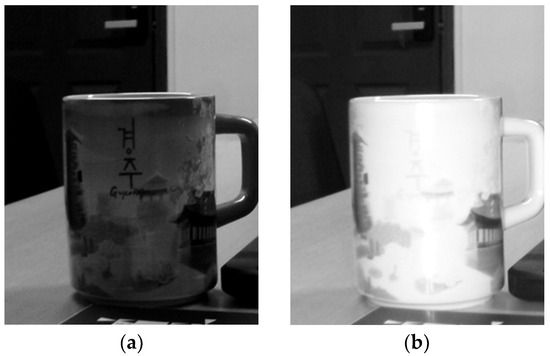
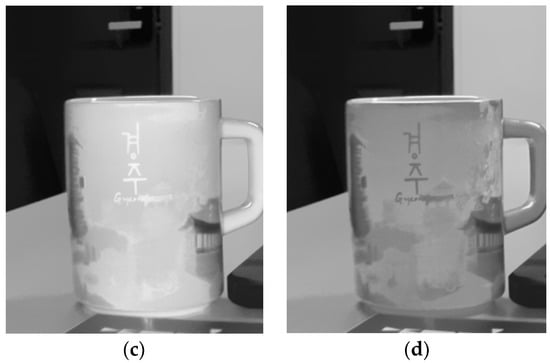
Figure 6.
Comparison of results based on the bilateral filter map and the luminance saturation region map: (a) visible-light image, (b) near-infrared intensity image, (c) base layer synthesis result with the bilateral filter map, (d) base layer synthesis result with the joint bilateral filter map.
However, when the two images are synthesized using a bilateral filter map to preserve the strong boundaries of the object, the results include distorted objects because the object details are reflected in the synthetic map, as shown in Figure 6c. In the low-brightness areas of visible light, the synthetic ratio of near-infrared images is increased, and the high-brightness areas of near-infrared images are excessively synthesized in dark letters. When creating a synthetic map using a joint bilateral filter, the strength of near-infrared images is reflected in the visible-light low-brightness areas, which increases the ratio of near-infrared images. Therefore, the VIS-IR joint bilateral filter, which includes the boundary information of the near-infrared image of Equation (7), was used.
Figure 6d shows the synthesis results using the joint bilateral filter map. It is confirmed that the internal area of the object of the synthetic map is blurred according to the strength of the neighboring pixel image of the near-infrared image, and the details of the information are well-synthesized as the local tone increases in the resulting image. Figure 7 shows the average synthesis results of the visible-light and near-infrared luminance base layer for comparison with the synthesis results of the visible-light and near-infrared image base layer.
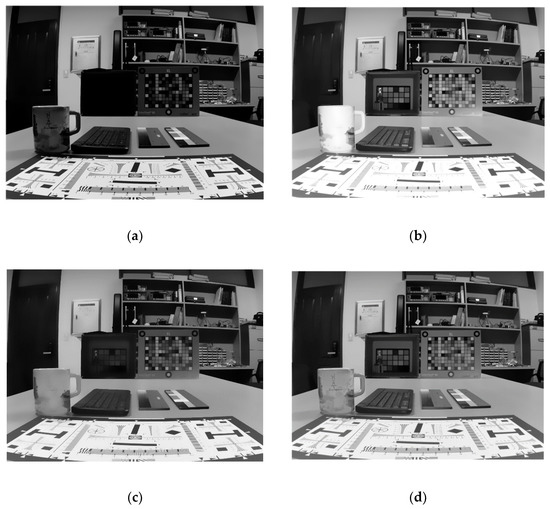
Figure 7.
Base layer synthesis results: (a) visible-light image base layer, (b) near-infrared image base layer, (c) average synthesis result of luminance base layers, (d) proposed base layer synthesis result.
Next, synthetic maps were added to reflect the characteristics of the nearest infrared images that appear differently between day and night, along with the joint bilateral filter. In the daytime visible-light image, a low-brightness area that inhibits visibility due to shade or backlight, such as the center of the tree in Figure 8b, is generated, and the boundary information is not expressed. In contrast, in the daytime near-infrared image, light penetration and diffusion phenomena caused by IR natural light in the tree shade area, as shown in Figure 8c, secures a large amount of light compared to visible light and increases visibility, including boundary information. The characteristics of this daytime near-infrared image are visible through the car image of visible-light and near-infrared rays in Figure 8d, and it can be seen that a large difference occurs in the area where IR penetration occurs.
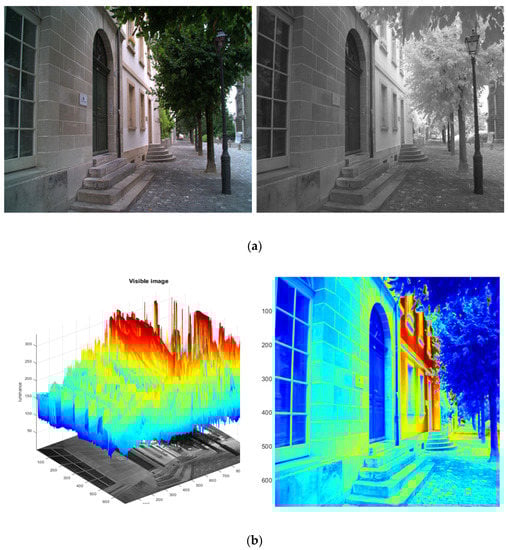
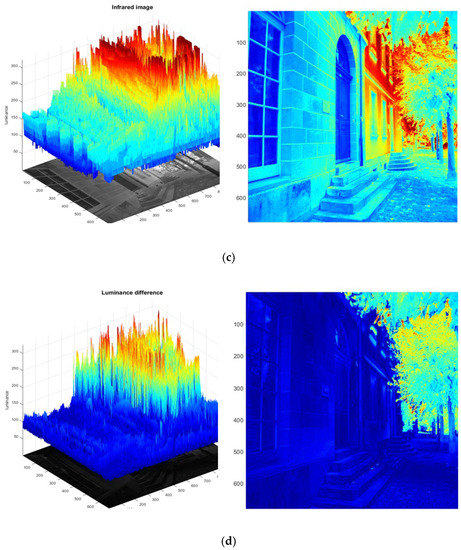
Figure 8.
Color maps of daytime images: (a) daytime visible and near-infrared images (b) daytime visible images, (c) daytime near-infrared images, (d) difference images between daytime visible and near-infrared.
In the nighttime visible-light image, the border information is weak for shaded areas, such as the box in Figure 9b, and has a low luminance value on average. In contrast, in the nighttime near-infrared Figure 9c, IR auxiliary light complements the lack of light in the box and secures the boundary information of the color chart in the box. However, unlike natural light, auxiliary light is weak in long-range IR infiltration and diffusion, and short-range luminance saturation caused by the front filter of the IR flash is relatively strong. This can be confirmed by the characteristics of the night image using the auxiliary light and the change in the luminance in the cup area where saturation occurs when comparing the box and the cup area in Figure 9d. Therefore, brighter daytime visibility and near-infrared car images reflect IR light penetration, and brighter visible-light and near-infrared car images show anterior luminance saturation by IR auxiliary light. To synthesize the characteristics of these day and night images, an IR depth compensation map was applied at night, and a penetration compensation map was applied during the day.
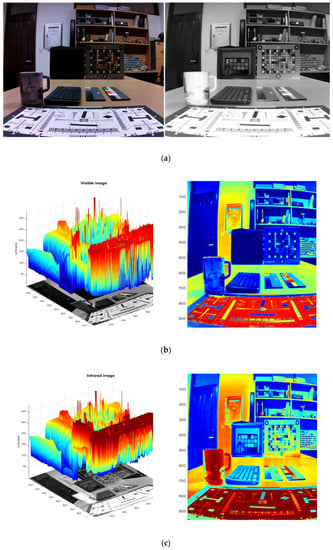
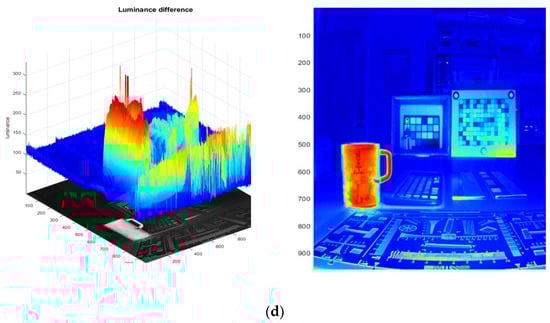
Figure 9.
Color maps of nighttime images: (a) night visible and near-infrared images, (b) night visible images, (c) night near-infrared images, (d) difference images between nighttime visible and near-infrared.
Because the night near-infrared image uses the IR assist light from the front, the difference between the visible-light image and the luminance value is oversaturated in the objects closer to the camera and shows the characteristics of the depth map, where the difference becomes weaker as the distance increases. Therefore, in the near-infrared image, it is necessary to increase the synthesis ratio of the non-saturated visible-light image so that the boundary information is well-preserved in the forward saturation region owing to the auxiliary light projection. In this case, the halo phenomenon that may occur during local tone mapping is minimized by using the difference image of the base layer image to which the bilateral filter is applied. The depth compensation map is obtained as follows:
where, as the value of the depth compensation map increases, it becomes a near-saturation region and increases the ratio of the visible-light base layer. and are the base layer images of the visible and near-infrared images, respectively.
Unlike nighttime images using auxiliary light, light diffusion and penetration by near-infrared natural light occur in daytime images. A visible-light image may have a high brightness level in the distant region, and an absolute value is used for the difference between visible light and near-infrared light. Because the regions with a large difference value are ones in which visibility can be improved by IR light penetration, it is necessary to increase the synthesis weight of the near-infrared image to secure boundary information. However, in the case of the daytime image, because the average luminance of the bright region of the visible-light image is higher than that of the night image, synthesis saturation may occur in the high-luminance region of the visible-light image. Therefore, the daytime base layer synthesis increases the ratio of the near-infrared base layer image as the difference value in the visible-light and near-infrared difference images increases, but this should be limitedly applied to the low-luminance region of the visible light image. The penetration compensation map is obtained as follows:
where, as the penetration compensation map value increases, it becomes a near-infrared penetration compensation region and increases the ratio of the base layer of the near-infrared image. The term indicates the IR light penetration region, and the term is a function that limits the low-luminance region of the visible-light image. Using these two characteristics as an AND condition, the ratio of the near-infrared image was increased.
Using the previously obtained VIS-IR joint bilateral filter and the additional compensation map according to the day and night images, the final base layer synthesis map and synthesized image can be obtained as follows:
where the larger the value of the base layer synthesis map , the higher the visible light base layer synthesis ratio. is the luminance base layer synthesis result image, and the base layers of the day and night images generated above are synthesized using the alpha blending method with the base layer synthesis map as a weight.
3.4. Detail Layer Synthesis
In the synthesis of detail layers, the main goal of synthesizing sublayers is to include and synthesize as much boundary information as possible according to the activity of the visible and near-infrared images. In the visible-light image, boundary information is lost in distant, foggy, or shaded areas. In the near-infrared image, the luminance saturated area due to the auxiliary light, or the boundary information below the water surface through which the near-infrared light does not pass, cannot be expressed. Therefore, for synthesis, the activity of detailed layers of visible-light and near-infrared images is calculated through local variance, and a variance map that can adjust the synthesis ratio according to the difference is used.
In this study, the mean deviated local variance, which has low computational complexity, was used to measure the activity of images. Because the mean deviated local variance uses the difference from the mean values of the pixels around the central pixel without considering each pixel value of the kernel, the distribution of changes in the pixel values in the kernel can be well-represented. The mean deviation local variance is calculated as follows:
where is the mean deviated local variance, and is the local mean. is the size of the kernel, and a value of was used in the proposed method.
The local variance image contains detailed boundary information for each visible-light and near-infrared image. Because the square term of the luminance channel is included in the calculation of the local variance, the variance may have a value of 0 to . In this case, because the range of values is very wide, the min–max normalization method is used, and the case where the variance value is small can be ignored. Therefore, we use a log function to adjust the scale. The difference image between the two dispersed images is then obtained and used as an index for determining which image among the visible-light and near-infrared images contains more detailed information in a specific area. The following equation shows the local variance log-scale difference images of the visible and near-infrared images.
where represents the log-scale local variance difference image. and are the mean deviated local variance images of the visible and near-infrared regions, respectively.
The log-scale difference image including negative values is then converted to a value between 0 and 1 and normalized so that it can be used as a synthesis map. If the local variance difference image () is negative, it indicates an area with a relatively large amount of detail in the near-infrared image, and if it is positive, it indicates an area with a relatively large amount of detailed information in the visible-light image. For this purpose, when the variance difference image is negative, it is normalized to a value between 0 and 0.5, and when it is positive, it is normalized to a value between 0.5 and 1.
where is a distributed map in which has a value between 0 and 1, and the proposed regularization expression is applied.
A final detailed layer composite map is created by applying a blur function to the variance map, as follows:
where the function represents a two-dimensional Gaussian filter and , are the standard deviations in the x and y directions, respectively. is a detailed layer synthesis map that is blurred by applying a Gaussian filter to for natural synthesis. The larger the kernel size of Gaussian function, the more natural detail layer fusion is possible, but a tradeoff occurs due to a decrease in detail contrast and an increase in the amount of computation. Thus, in this study, the kernel size (7, 7) was applied for this Gaussian filter.
Using the generated detailed layer synthesis map (), the synthesis is performed as shown in the following equation:
where is the luminance detailed layer synthesis result, and the detailed layers of the day and night images generated above are synthesized using the alpha blending method using the detailed layer synthesis map as a weight. and are detail layer images of visible and near-infrared images, respectively.
Figure 10 shows the sublayers of the visible and near-infrared images and the results of the synthesis of the sublayers. The details of the cup and box parts are well-preserved.
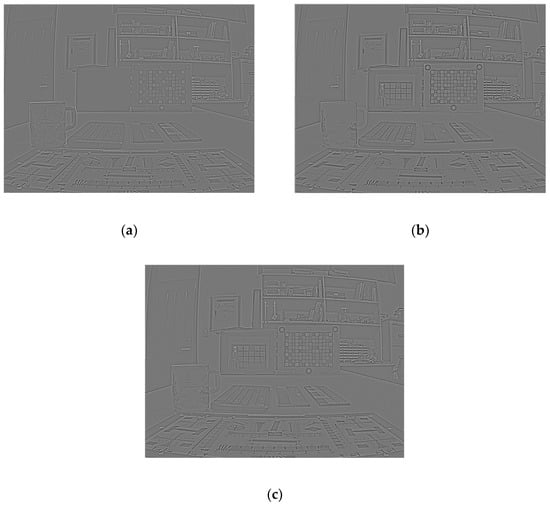
Figure 10.
Result of detail layer synthesis: (a) visible-light image detail layer, (b) near-infrared image detail layer, (c) detail layer synthesis result.
The final synthesized luminance channel is generated as follows by synthesizing the independently synthesized base layer and detailed layer using the above process.
3.5. Color Compensation and Adjustment
In general, color compensation is required to maintain the same color information when the luminance of an image is changed. The color information uses the ab channel of the visible-light image. By synthesizing the luminance channels of the two images, the luminance channel L of the existing visible-light image is changed, resulting in an imbalance with the color channel ab, making the color expression unnatural. Therefore, for the color channels ( of the visible-light image, saturation compensation using the ratio of the luminance channel () of the visible-light image to the luminance () after synthesis is required, and the saturation compensation function is calculated as follows:
where is the chroma compensation ratio, and the chroma compensation is changed according to the change range of the luminance value through the change ratio between the visible-light image and the luminance synthesis result. At this time, 0.001 is added to the denominator to prevent divergence of the compensation gain. In addition, the blending process is performed through the base layer synthesis map to prevent excessive saturation compensation at the boundary of the image. is a constant value that controls the amount of color compensation, and in this study, is used.
In Equation (21), and are color channels for which saturation is compensated, and and are color channels before saturation compensation of a visible-light image. and are multiplied by to perform saturation compensation for luminance modulation. At this time, to make the median of the chroma channel range 0, 128 is subtracted, values are multiplied by , and 128 is added again to obtain a chroma channel with a median of 128 that is uniformly distributed. Using the obtained chroma and and the synthesized luminance , the final synthesized image is acquired through a color-space conversion process.
4. Simulation Results
To evaluate the performance of the proposed algorithm, the synthesis results using various synthesis maps were obtained and compared. In addition, the results obtained using the multilayer resolution synthesis method, which is a representative conventional visible-light near-infrared synthesis method, and a deep-learning-based synthesis method were compared. The daytime images used in the experiment were taken by alternately applying an IR cut filter and a VIS cut filter, and the dataset published by EPFL was used [14]. Therefore, the input images were acquired as visible-light and infrared images.
For the night image, an image captured by switching the IR auxiliary light with the IR cut filter removed using a broadband camera module with the image sensor light receiving band ranging from visible to near-infrared (approximately 1000 nm) was used. In this paper, a multiplex imaging system was fabricated to capture IR and visible-light images at night. The proposed system captures two types of IR images, high-intensity IR and low-intensity IR by alternating the intensity of the IR lamp. The IR lamps are synchronized with the capturing period. In addition to the IR LED array of CCTV at night, four 5W-1000 nm IR LEDs are used for IR flash, and are turned on only when capturing high-intensity images. When the IR flash is on, the luminance channel image is taken, and when the IR flash is off, the RGB 3 channel image is taken.
Figure 11 shows the sequence of NIR and visible image switching capturing at night. The input image was acquired as a visible-light image and a broadband image. A broadband image refers to an image in which visible-light and near-infrared images are combined, and because the color channel of the broadband image is not used in this study, it is used synonymously with the near-infrared image.
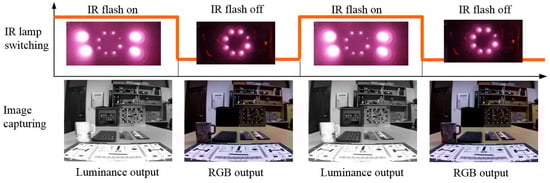
Figure 11.
Sequence of image switching capturing with IR flash.
Figure 12 shows a comparison of the performance of the synthesis results according to the synthesis maps of the various base layers. It shows the resulting image using the bilateral filter map, joint bilateral filter map, and proposed synthesis map. As can be seen from the figure, the resulting image using the proposed base layer synthesis map contains detailed information inside the cup and box.
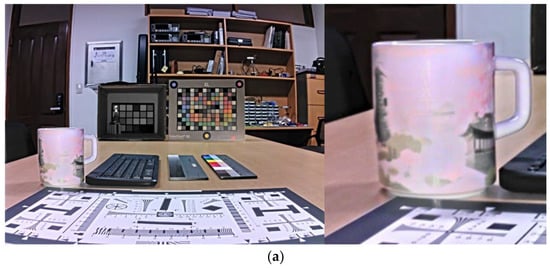
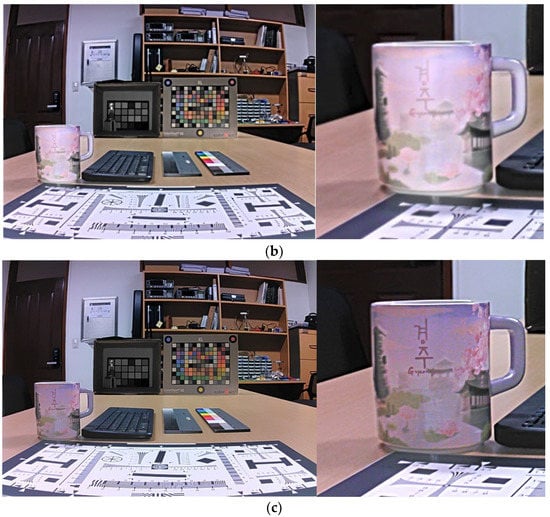
Figure 12.
Comparison of various synthesis results: (a) result with a bilateral filter map, (b) result with an associative bilateral filter map, (c) result with a proposed synthesis map.
Figure 13, Figure 14 and Figure 15 show the synthesis results for the daytime images. Compared with the Densfuse synthesis method, it is confirmed that the proposed method has excellent visibility of detailed information in the area because the luminance range of the base layer is well-compressed in the shaded area of the visible-light image. In addition, in the Vanmali and PCA synthesis method, colors are shown differently than in the original image, such as a strong red color, over-saturation symptoms, and mismatched white balance throughout the image, including buildings and roofs. In contrast, in the proposed method, the original color of the visible-light image is naturally expressed without oversaturation. In addition, it can be confirmed that the proposed method expresses detailed information better than the two existing synthesis methods in the details of the mountain in Figure 13, the boundary information of the leaves in Figure 14, and the details of the wave in Figure 15.
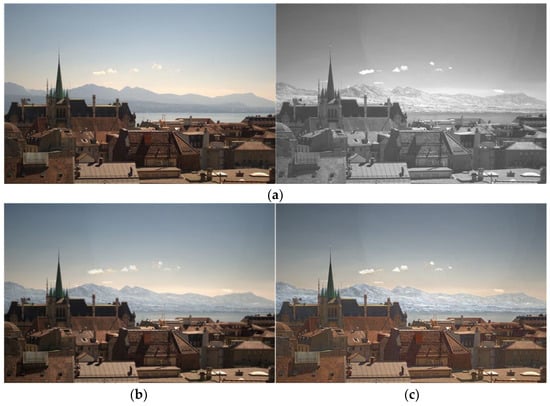
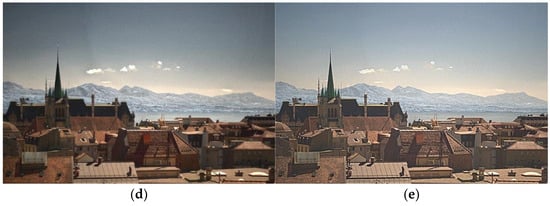
Figure 13.
Daytime input and result images (1): (a) visible-light image and near-infrared image, (b) Densefuse method result, (c) Vanmali method result, (d) PCA method result, (e) proposed method result.
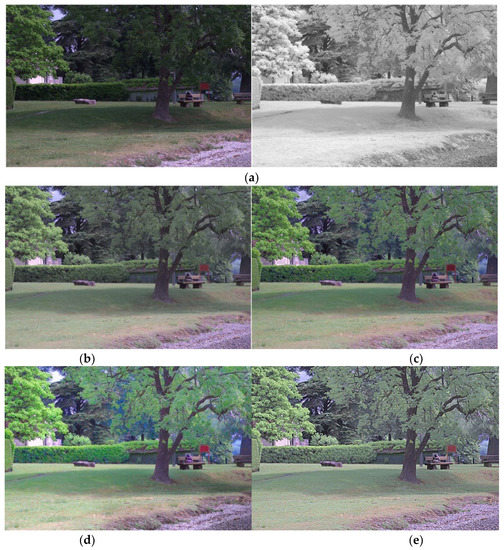
Figure 14.
Daytime input and result images (2): (a) visible-light image and near-infrared image, (b) Densefuse method result, (c) Vanmali method result, (d) PCA method result, (e) proposed method result.
Figure 15.
Daytime input and result images (3): (a) visible-light image and near-infrared image, (b) Densefuse method result, (c) Vanmali method result, (d) PCA method result, (e) proposed method result.
Figure 16, Figure 17 and Figure 18 show a performance comparison for the night images. In the night image, compared to the existing Densfuse synthesis method, the proposed method improves visibility by increasing the brightness in the dark area of the visible-light image, such as the area inside the box in Figure 16 or the area outside the door in Figure 18. It can be confirmed that detailed information is better expressed in the letters on the cup in Figure 16 or in the text in the book in Figure 17 Thus, it can be confirmed that the identification is excellent. In addition, in the Vanmali and PCA synthesis method, block noise is generated by oversaturation compensation in the dark areas of the visible-light image; thus, the identification is reduced throughout the image. However, compared with the previous two methods, the proposed method shows excellent detail expression performance while expressing the natural color by revealing details without oversaturation symptoms and noise.
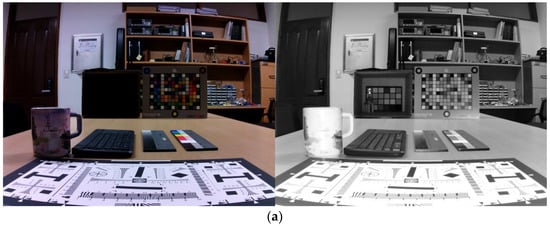
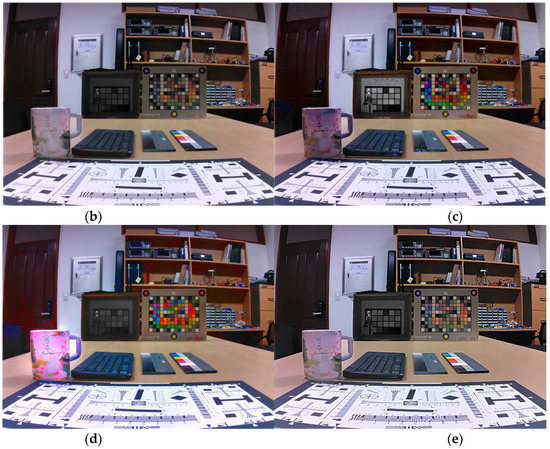
Figure 16.
Nighttime input and result images (1): (a) visible-light image and near-infrared image, (b) Densefuse method result, (c) Vanmali method result, (d) PCA method result, (e) proposed method result.
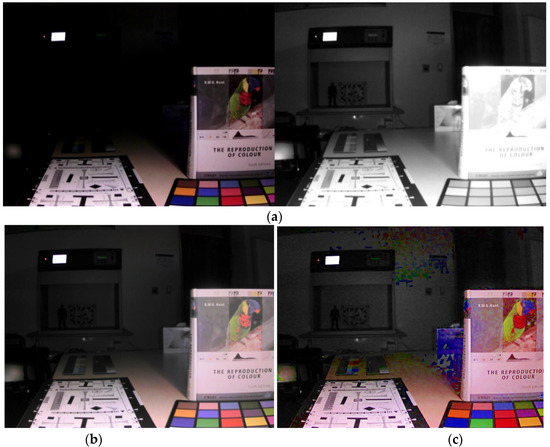
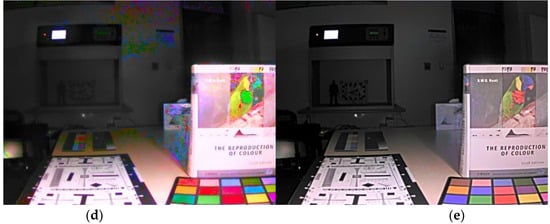
Figure 17.
Nighttime input and result images (2): (a) visible-light image and near-infrared image, (b) Densefuse method result, (c) Vanmali method result, (d) PCA method result, (e) proposed method result.
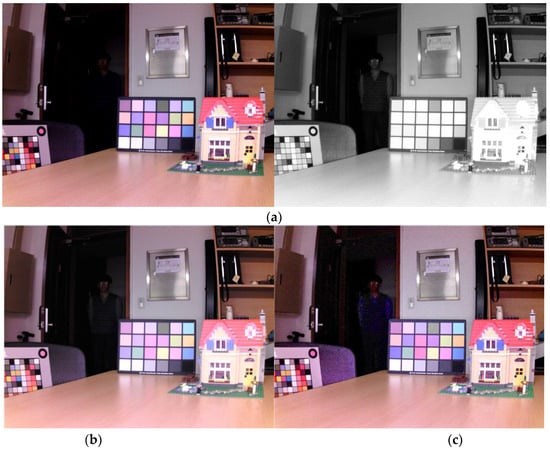
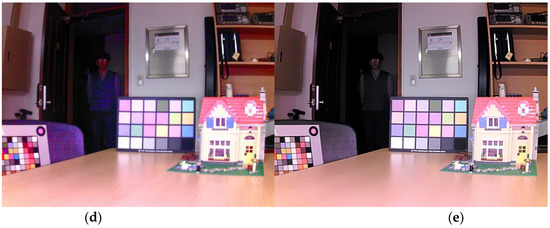
Figure 18.
Nighttime input and result images (3): (a) visible-light image and near-infrared image, (b) Densefuse method result, (c) Vanmali method result, (d) PCA method result, (e) proposed method result.
Figure 19 shows the resulting images according to the synthesis method. Table 1, Table 2, Table 3, Table 4, Table 5 and Table 6 and Figure 20 show the quality and sharpness scores of the resulting images according to the performance indicators. For quantitative evaluation, indices that evaluate the image quality and sharpness S3 (spectral and spatial sharpness), visual information fidelity for fusion (VIFF), spatial frequency (SF), local phase coherence sharpness index (LPC-SI), edge intensity (EI), and average gradient (AG) were used.
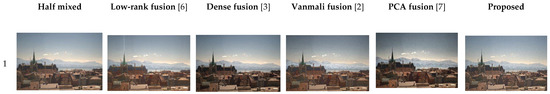
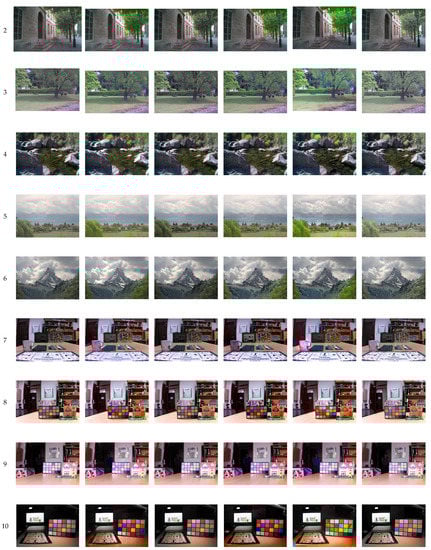
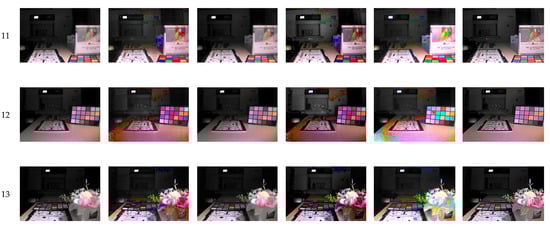
Figure 19.
Comparison of the result images of the fusion methods. Low-rank fusion [6], Dense fusion [3], Vanmali fusion [2], PCA fusion [7].

Table 1.
Comparison of the S3 image quality metrics.
Table 2.
Comparison of the VIFF metrics.
Table 3.
Comparison of the spatial frequency metrics.
Table 4.
Comparison of the LPC SI metrics.
Table 5.
Comparison of the edge intensity metrics.
Table 6.
Comparison of the average gradient metrics.
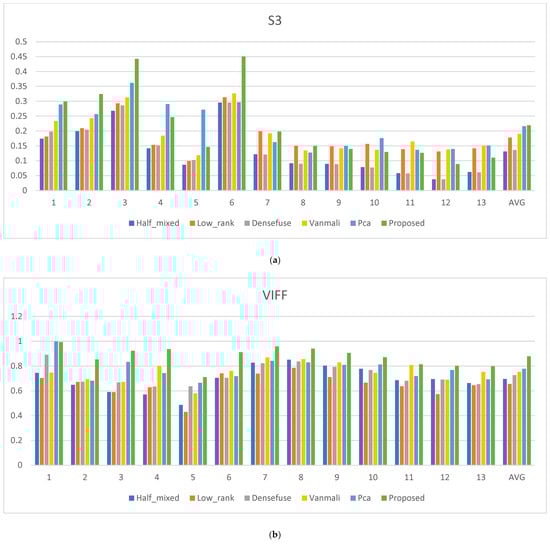
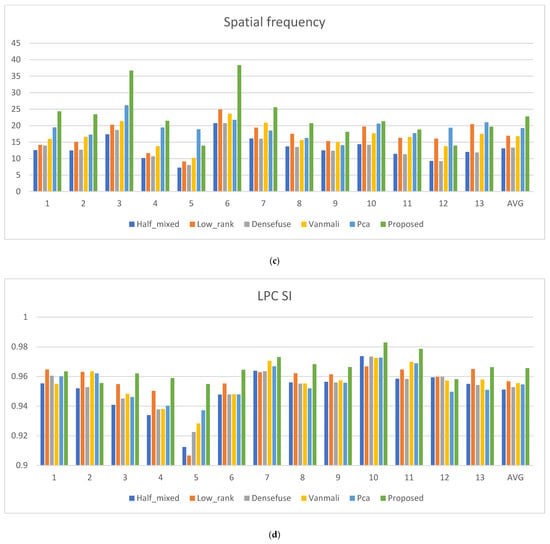
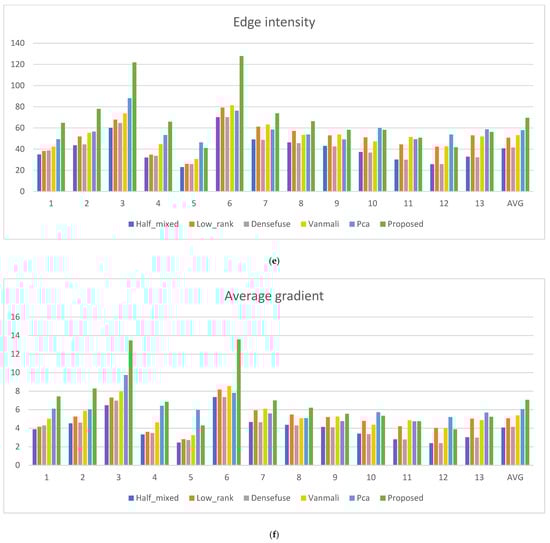
Figure 20.
Metric scores: (a) S3 score; (b) VIFF score; (c) spatial frequency score (d) LPC SI score; (e) edge intensity score; (f) average gradient score.
Spectral and spatial sharpness (S3) generates a sharpness map considering human cognitive characteristics, and a larger local value indicates a visually sharper area. This is used to evaluate the quality and sharpness of the images in general [15]. Visual information fidelity for fusion (VIFF) is a quality metric that measures the effective visual information of fusion in all blocks in each sub-band. This is obtained by using the VIF models to gather visual information from the source and fused image pair [16]. Spatial frequency (SF) is used to observe the distribution of gradients throughout the image by calculating vertical and horizontal gradients and to evaluate the amount of detail and texture that can be perceived by humans [17]. LPC-SI is an image sharpness evaluation index that uses the fact that strong local phase coherence occurs in objects or regions that visually stand out in the complex wavelet transform domain [18]. Edge intensity (EI) is an image evaluation method based on the idea that high edge intensity values are superior in terms of image quality and sharpness [19]. The average gradient (AG) metric quantifies the gradient information in the fused image and reveals the details and textures [20]. Regarding the evaluation indicators S3, VIFF, SF, LPC-SI, EI, and AG used in this evaluation, the higher the performance evaluation value, the better the performance in terms of image quality and sharpness.
The proposed synthesis method shows, on average, fine improvements of 1.48% for S3, 11.47% for VIFF, 15.49% for SF, 0.92% for LPC-SI, 16.77% for EI, and 14.15% for AG, compared to the method with the highest performance among the existing methods.
5. Conclusions
In this study, for effective synthesis of visible and near-infrared images under various ambient light conditions during the day and night, the images were decomposed into a base layer and a sublayer using a two-way filter, and synthesized independently by applying a synthesis map reflecting the light characteristics of day and night, respectively. By dividing the daytime and nighttime images according to the use of an IR assist light, we proposed different base layer synthesis maps reflecting the propagation characteristics of near-infrared rays, thereby synthesizing the base layer for image detail expression and enhancing the detailed information expression performance to secure excellent visibility. Color compensation was performed using the luminance ratio between the luminance synthesized image and the visible-light input image.
Compared with the existing low-rank, Densfuse, Vanmali, and PCA algorithms, the proposed algorithm showed improved sharpness by increasing the local contrast through compressing the luminance range of the base layer for the dark or detailed area in the daytime image synthesis result. In addition, the color of the original image was well-expressed without oversaturation throughout the image. The night composite image showed excellent detail expression performance in color by securing identification through base layer tone mapping in the low-luminance region and solving the block noise problem. To improve robustness of performance in the daytime and also the nighttime, the different weight maps of base layer synthesis are presented to consider the visual properties of near-infrared band. As a result, compared with conventional methods, the proposed method showed better performance, particularly in terms of the sharpness and visibility of the images.
Author Contributions
Conceptualization, S.-H.L.; methodology, S.-H.L. and C.-W.P.; software, C.-W.P.; validation, S.-H.L. and C.-W.P.; formal analysis, S.-H.L. and C.-W.P.; investigation, S.-H.L. and C.-W.P.; resources, S.-H.L., H.-J.K., and C.-W.P.; data curation, S.-H.L., H.-J.K., and C.-W.P.; writing—original draft preparation, C.-W.P.; writing—review and editing, S.-H.L.; visualization, C.-W.P.; supervision, S.-H.L.; project administration, S.-H.L. All authors have read and agreed to the published version of the manuscript.
Funding
This research received no external funding.
Institutional Review Board Statement
Not applicable.
Informed Consent Statement
Not applicable.
Conflicts of Interest
The authors declare no conflict of interest.
References
- Kwon, H.J.; Lee, S.H. Visible and Near-Infrared Image Acquisition and Fusion for Night Surveillance. Chemosensors 2021, 9, 75. [Google Scholar] [CrossRef]
- Vanmali, A.V.; Gadre, V.M. Visible and NIR Image Fusion Using Weight Map Guided Laplacian Gaussian Pyramid for Improving Scene Visibility. Sādhanā 2017, 42, 1063–1082. [Google Scholar] [CrossRef]
- Li, H.; Wu, X.J. DenseFuse: A Fusion Approach to Infrared and Visible Images. IEEE Trans. Image Processing 2018, 28, 2614–2623. [Google Scholar] [CrossRef] [PubMed]
- Kil, T.; Cho, N.I. Image Fusion using RGB and Near Infrared Image. J. Broadcast Eng. 2016, 21, 515–524. [Google Scholar] [CrossRef]
- Sadeghipoor, Z.; Lu, Y.M.; Süsstrunk, S. Correlation-Based Joint Acquisition and Demosaicing of Visible and Near-Infrared Images. In Proceedings of the IEEE International Conference on Image Processing, Brussels, Belgium, 11–14 September 2011; pp. 3165–3168. [Google Scholar]
- Li, H.; Wu, X.J. Infrared and Visible Image Fusion Using Latent Low-Rank Representation. arXiv 2018, arXiv:1804.08992. [Google Scholar]
- Son, D.M.; Kwon, H.J.; Lee, S.H. Visible and Near-Infrared Image Synthesis Using PCA Fusion of Multiscale Layers. Appl. Sci. 2020, 10, 8702. [Google Scholar] [CrossRef]
- Son, D.M.; Kwon, H.J.; Lee, S.H. Visible and Near Infrared Image Fusion Using Base Tone-Compression and Detail Transform Fusion. Chemosensors 2022, 10, 124. [Google Scholar] [CrossRef]
- Paris, S.; Kornprobst, P.; Tumblin, J.; Durand, F. A Gentle Introduction to Bilateral Filtering and its Applications. In ACM SIGGRAPH; ACM Press: New York, NY, USA, 2007; p. 1. [Google Scholar]
- Tomasi, C.; Manduchi, R. Bilateral filtering for gray and color images. In Proceedings of the Sixth International Conference on Computer Vision(IEEE Cat. No. 98CH36271), Bombay, India, 7 January 1998; pp. 836–846. [Google Scholar]
- Petschnigg, G.; Szeliski, R.; Agrawala, M.; Cohen, M.; Hoppe, H.; Toyama, K. Digital Photography with Flash and No-Flash Image Pairs. ACM Trans. Graph. 2004, 23, 664–672. [Google Scholar] [CrossRef]
- Eisemann, E.; Durand, F. Flash Photography Enhancement via Intrinsic Relighting. ACM Trans. Graph. 2004, 23, 673–678. [Google Scholar] [CrossRef]
- Durand, F.; Dorsey, J. Fast bilateral filtering for the display of high dynamic range images. In Proceedings of the 29th Annual Conference on Computer Graphics and Interactive Techniques, San Antonio, TX, USA, 21–26 July 2002; pp. 257–266. [Google Scholar]
- EPFL 2015 EPFL Database. Available online: http://ivrg.epfl.ch/supplementary_material/cvpr11/index.html (accessed on 5 November 2015).
- Vu, C.T.; Chandler, D.M. S3: A spectral and spatial sharpness measure. In Proceedings of the 2009 First International Conference on Advances in Multimedia IEEE, Colmar, France, 20–25 July 2009; pp. 37–43. [Google Scholar]
- Han, Y.; Cai, Y.; Cao, Y.; Xu, X. A new image fusion performance metric based on visual information fidlity. Inf. Fusion 2013, 14, 127–135. [Google Scholar] [CrossRef]
- Eskicioglu, A.M.; Fisher, P.S. Image quality measures and their performance. IEEE Trans. Commun. 1995, 43, 2959–2965. [Google Scholar] [CrossRef]
- Hassen, R.; Wang, Z.; Salama, M.M. Image sharpness assessment based on local phase coherence. IEEE Trans. Image Processing 2013, 22, 2798–2810. [Google Scholar] [CrossRef] [PubMed]
- Fajalingam, B.; Priya, R. Hybrid nultimodality medical image fusion technique for feature enhancement in medical diagnosis. Int. J. Eng. Sci. Invent. 2018, 2, 52–60. [Google Scholar]
- Cui, G.; Feng, H.; Xu, Z.; Li, Q.; Chen, Y. Detail preserved fusion of visible and infrared images using regional saliency extraction and multi-scale image decomposition. Opt. Commun. 2015, 341, 199–209. [Google Scholar] [CrossRef]


Publisher’s Note: MDPI stays neutral with regard to jurisdictional claims in published maps and institutional affiliations. |
© 2022 by the authors. Licensee MDPI, Basel, Switzerland. This article is an open access article distributed under the terms and conditions of the Creative Commons Attribution (CC BY) license (https://creativecommons.org/licenses/by/4.0/).