Article

Spatial Distribution Characteristics and Source Appointment of Heavy Metals in Soil in the Areas Affected by Non-Ferrous Metal Slag Field in the Dry-Hot Valley

School of Environment and Resource, Southwest University of Science and Technology, Mianyang 621010, China
*
Author to whom correspondence should be addressed.
These authors contributed equally to this work.
Appl. Sci. 2022, 12(19), 9475; https://doi.org/10.3390/app12199475
Submission received: 25 August 2022 / Revised: 17 September 2022 / Accepted: 19 September 2022 / Published: 21 September 2022

Abstract

:
In this study, the contents and associated soil properties of 6 metal elements (Pb, As, Cu, Zn, Ni, Cr) were measured in 63 topsoil samples in the affected areas of a typical non-ferrous metal slag field in Huili City, Sichuan Province, China. The associated soil properties of the 6 metals include Ammonium Nitrogen ( NH 4 + -N), Nitrate ( NO 3 -N), Available Phosphorus (AP), Available Potassium (AK), Electrical Conductivity (EC), Cation Exchange Capacity (CEC), Soil Water Content (SWC), and pH. Multivariate statistics-spatial analysis-soil pollution comprehensive evaluation method was used to quantify the environmental pollution degree of heavy metals in the topsoil and divided (zone) the slag field based on the degree of pollution. Pearson correlation analysis and positive matrix factorization (PMF) were used to identify and quantitatively analyze pollution sources and their contributions. The results show that the average contents of Pb, As, Cu, Zn, Ni, and Cr were 13.27, 19.87, 6.91, 50.55, 25.06, and 77.71 mg·kg−1, respectively. Nemerow comprehensive evaluation results showed that the sites with Slight Pollution and Mild Pollution accounted for 26.98% and 3.17% of the total sampling sites, respectively. Approximately 70% of the sampling sites in the study area had no heavy metal pollution in the soil. Sites with No Pollution or Slight Pollution were mainly distributed in the forest areas with vegetation coverage, while sites with Moderate Pollution or Heavy Pollution were mainly distributed in crop planting areas and areas near slag fields. PMF model revealed four pollution sources: natural sources, mixed industrial and transportation sources, agricultural sources, and industrial river water. These results will provide theoretical references for the utilization and treatment of heavy metal-contaminated soil around the slag field in the dry-hot valley.

1. Introduction

Prevention of soil pollution is an important part of ecological civilization. Compared with other pollutants, heavy metals remain in soil for a long time, transform slowly, accumulate easily, and can diffuse with runoff [1]. The accumulation of heavy metals in soil may inhibit soil function, cause toxicity to plants, contaminate the food chain, and promote the transfer of heavy metals to humans [2,3]. The dry-hot valley is a partially arid valley-type region in southwestern China. It is one of the ecologically fragile areas characterized by high temperature, low humidity, dry climate and little rainfall, prominent water and heat contradictions, extreme lack of soil moisture and nutrients, serious soil erosion, and low vegetation coverage. The high contents of heavy metals in the dry-hot valley are attributable to the unique physical geography and farming system of the region. Under the unique dry-heat soil-forming environment, the background concentration of heavy metals in high-temperature soil is higher than that in other soil types [4]. Earlier studies have investigated the pollution status of heavy metals in dry-hot valley soils [5], but there is a lack of systematic studies on the pollution degree, spatial distribution patterns and sources of soil heavy metal pollution in dry-hot valleys. For the evaluation of soil heavy metal pollution, previous studies have proposed a variety of methods including Fuzzy Comprehensive Evaluation (FCE), Improved Weighted Index (IWI) [6], Geographical Accumulation Index (Igeo), and potential ecological risk index [7], and pollution load index [8]. There are multivariate statistical methods, GIS mapping method, isotope tracer method, positive matrix factorization (PMF), and absolute principal component score-multiple linear regression method (APCS-MLR) for the source appointment of soil heavy metals [9]. Lv et al. [10] quantitatively analyze the sources of soil heavy metals in Guangrao, Shandong, using PMF and APCS/MLR. Guan et al. [11] used PMF to conduct source appointment of soil heavy metals in typical areas of the Hexi Corridor. Luo et al. [12] used APCS/MLR and analyzed the contribution rate of heavy metal sources in Xiamen urban soil.
The slag field is the main source of soil heavy metal pollution in this study area. Different pollution sources contribute differently to the pollution characteristics of surrounding farmland soil and crops and ecological risks. The slag yard studied in this paper is currently stockpiled acid leaching nickel slag and gypsum slag. Therefore, clarification of the pollution source and contribution rate of soil heavy metals, objective and accurate evaluation of pollution status is of great significance for the control and restoration of soil heavy metal pollution in the affected area of slag field. In this study, the heavy metals were analyzed in the soil of the typical non-ferrous metal slag field in a dry-hot valley in Huili City, Sichuan Province, China. The contents of six heavy metals (Pb, As, Cu, Zn, Ni, Cr) and their associated soil properties were determined in the topsoil samples. Multivariate statistics-spatial analysis-soil pollution comprehensive evaluation and integrated research methods were used to obtain the visualized information of its spatial distribution characteristics and pollution degree. We expect to reveal spatial distribution of heavy metal from a single point to a larger area and from discrete to continuous quantitative description. Pearson correlation coefficient, canonical correspondence analysis (CCA), and PMF were used to qualitatively identify the sources of heavy metals in soil. The source contribution rate was quantitatively analyzed in order to provide a theoretical basis for the rational utilization of farmland soil and regional management and control of soil heavy metal pollution in the dry-hot valley.

2. Materials and Methods

2.1. Study Area

The study area is located in the southwest of Huili City (Figure 1), which is on the east side of National Highway 108 with convenient transportation. It belongs to a dry and hot valley area, with a subtropical humid monsoon climate, an annual average temperature of 15.1 °C, rainfall of 1130.9 mm, wind speed of 1.6 m/s, and the dominant northern direction wind. The area has a typical mountain valley landform, which belongs to the middle and low mountains eroded by flowing water. There are no other industrial and mining pollution sources within 1 km of the surrounding area. The slag field is located in the middle of the study area and is a valley-type tailing facility with a total storage capacity of approximately 2.62 million m3. At present, there are 34,000 m3 of acid leached nickel slag and 64,000 m3 of gypsum slag. There are agricultural land (paddy fields, dry land, grassland, garden land) and forest land between the main roads in the affected area of the slag field. Paddy field is mainly for rice cultivation, dry land is mainly for corn and sweet potato, and the garden land is mainly for pomegranate and walnut. Based on results from the drilling investigation, the foundation of the auxiliary dam area is mainly composed of the Quaternary Holocene slope deposits (Q4dl) and the lower section of the Upper Triassic Baiguowan (T3bg 1). The parent material is mainly composed of sandstone, metamorphic sandstone, and granite. The study area belongs to the middle and high mountain area with large terrain slope and optimal surface runoff conditions. Part of the atmospheric precipitation infiltrates the groundwater system, and part of the surface runoff flows into the Lima River, the lowest drainage base level in the area.

2.2. Sample Collection and Treatment

A total of 63 topsoil samples (0–30 cm) were collected in the study area in October 2020 using the grid distribution method. Sampling sites were geolocated by GPS. Soil samples were crushed, sorted, and air-dried. Wearing polyethylene gloves, the air-dried soil samples were picked up, stone and plant at the same time, using mortar grinding, 200 mesh sieve, and all samples were placed into a polyethylene plastic bag. The ground soil samples were digested with HClO4-HNO3-HF, and the contents of Pb, As, Cu, Zn, Ni, and Cr were measured by inductively coupled plasma optical emission spectrometer (ICP-OES). The contents of NH 4 + -N, NO 3 -N, AP, and AK were measured by high precision soil nutrient detector. The soil pH was measured at a water–soil ratio of 2.5:1 and the electrical conductivity (EC) was measured at a water–soil ratio of 1:5. The cation exchange capacity (CEC) was measured according to the Chinese National Environmental Protection Standard (HJ 889-2017). Soil water content (SWC) was determined by gravimetric method (HJ613-2011).

2.3. Data Evaluation

2.3.1. Evaluation of Soil Heavy Metal Pollution

In order to compare the pollution degree of heavy metals in different soil layers of each sampling site, we used single-factor pollution index and Nemerow comprehensive index to calculate the heavy metal pollution degree at each sampling site with the following formulas.
P i = C i B i
P N = P ¯ i 2 + P imax 2 2
In the Formulas (1) and (2), P i is the single-factor pollution index, C i   is the measured concentration of pollutant i, and B i is the reference value of pollutant i in the “GB15168-2018 Soil Environmental Quality Agricultural Land Pollution Risk Control Standard (Trial)”. P N is the Nemerow comprehensive index at a particular sampling site, Pi is the average value of the single-factor pollution index, and P i m a x is the maximum value of the single-factor pollution index.

2.3.2. Soil heavy Metal Inverse Distance Weighting (IDW) and Comprehensive Evaluation

Previous degrees of heavy metal pollution were based on a single sampling site, which cannot reflect the spatial proximity effect and spatial distribution characteristics of heavy metal indicators at each sampling site. Therefore, this study adopted IDW method to reveal the degree of heavy metal pollution from scattered sampling sites to continuous description and provides a theoretical basis for the pollution zoning of heavy metals. According to the soil quality standards of each functional area, a comprehensive evaluation was carried out. In order to eliminate the influence of the dimension of each heavy metal index, the minimum-maximum normalization method was used to normalize each heavy metal to [0, 1] before the comprehensive evaluation. The Raster Calculator tool in ArcGIS was used to comprehensively evaluate the pollution of heavy metals in each layer. In Formula (3), x m a x   represents the maximum value of the data for the samples, x m i n represents the minimum value of data for the samples, x is the sample data, x’ is the normalized sample data.
x = x x m i n x m a x x m i n

2.3.3. Correlation Analysis

Pearson correlation analysis was used to determine the relationship among the contents of different heavy metals as well as their relationship with soil physicochemical properties.

2.3.4. Positive Matrix Factorization Model (PMF)

PMF modeling was performed using the US EPA PMF 5.0 program. As first proposed by Paatero et al. [13] in 1994, the least iterative squares algorithm decomposes the original matrix E i k into two factor matrices A i j and B j k and a residual matrix C i k with the following formula.
E i k = j = 1 p A i j B j k + C i k       i = 1 , 2 , m ; k = 1 , 2 , n
In Formula (4), E i k represents the concentration of the kth heavy metal in the ith sample, A i j represents the concentration (ng mg−1) of the ith sample from the kth source; B j k represents the concentration of material from the jth source contributing to the kth sample, and C i k represents the random error. PMF decomposes the original matrix through multiple calculations to obtain the optimal matrices A and B, so that the objective function Q reaches the minimum value.
Q = i = 1 m k = 1 n C i k σ i k 2
In the Formula (5): σ i k represents the uncertainty of E i k . During the calculation, both concentration data and the uncertainty data need to be loaded.
When the heavy metal concentration is less than or equal to the corresponding method detection limit (MDL), the uncertainty is calculated with the following Formula (6).
U n c = 5 / 6 × M D L
When the heavy metal concentration is larger than the corresponding MDL, the uncertainty is calculated with the following Formula (7).
U n c = = σ × c 2 + M D L 2
In Formulas (6) and (7), Unc is uncertainty. σ is the relative standard deviation, and c is the element concentration.

3. Results and Discussion

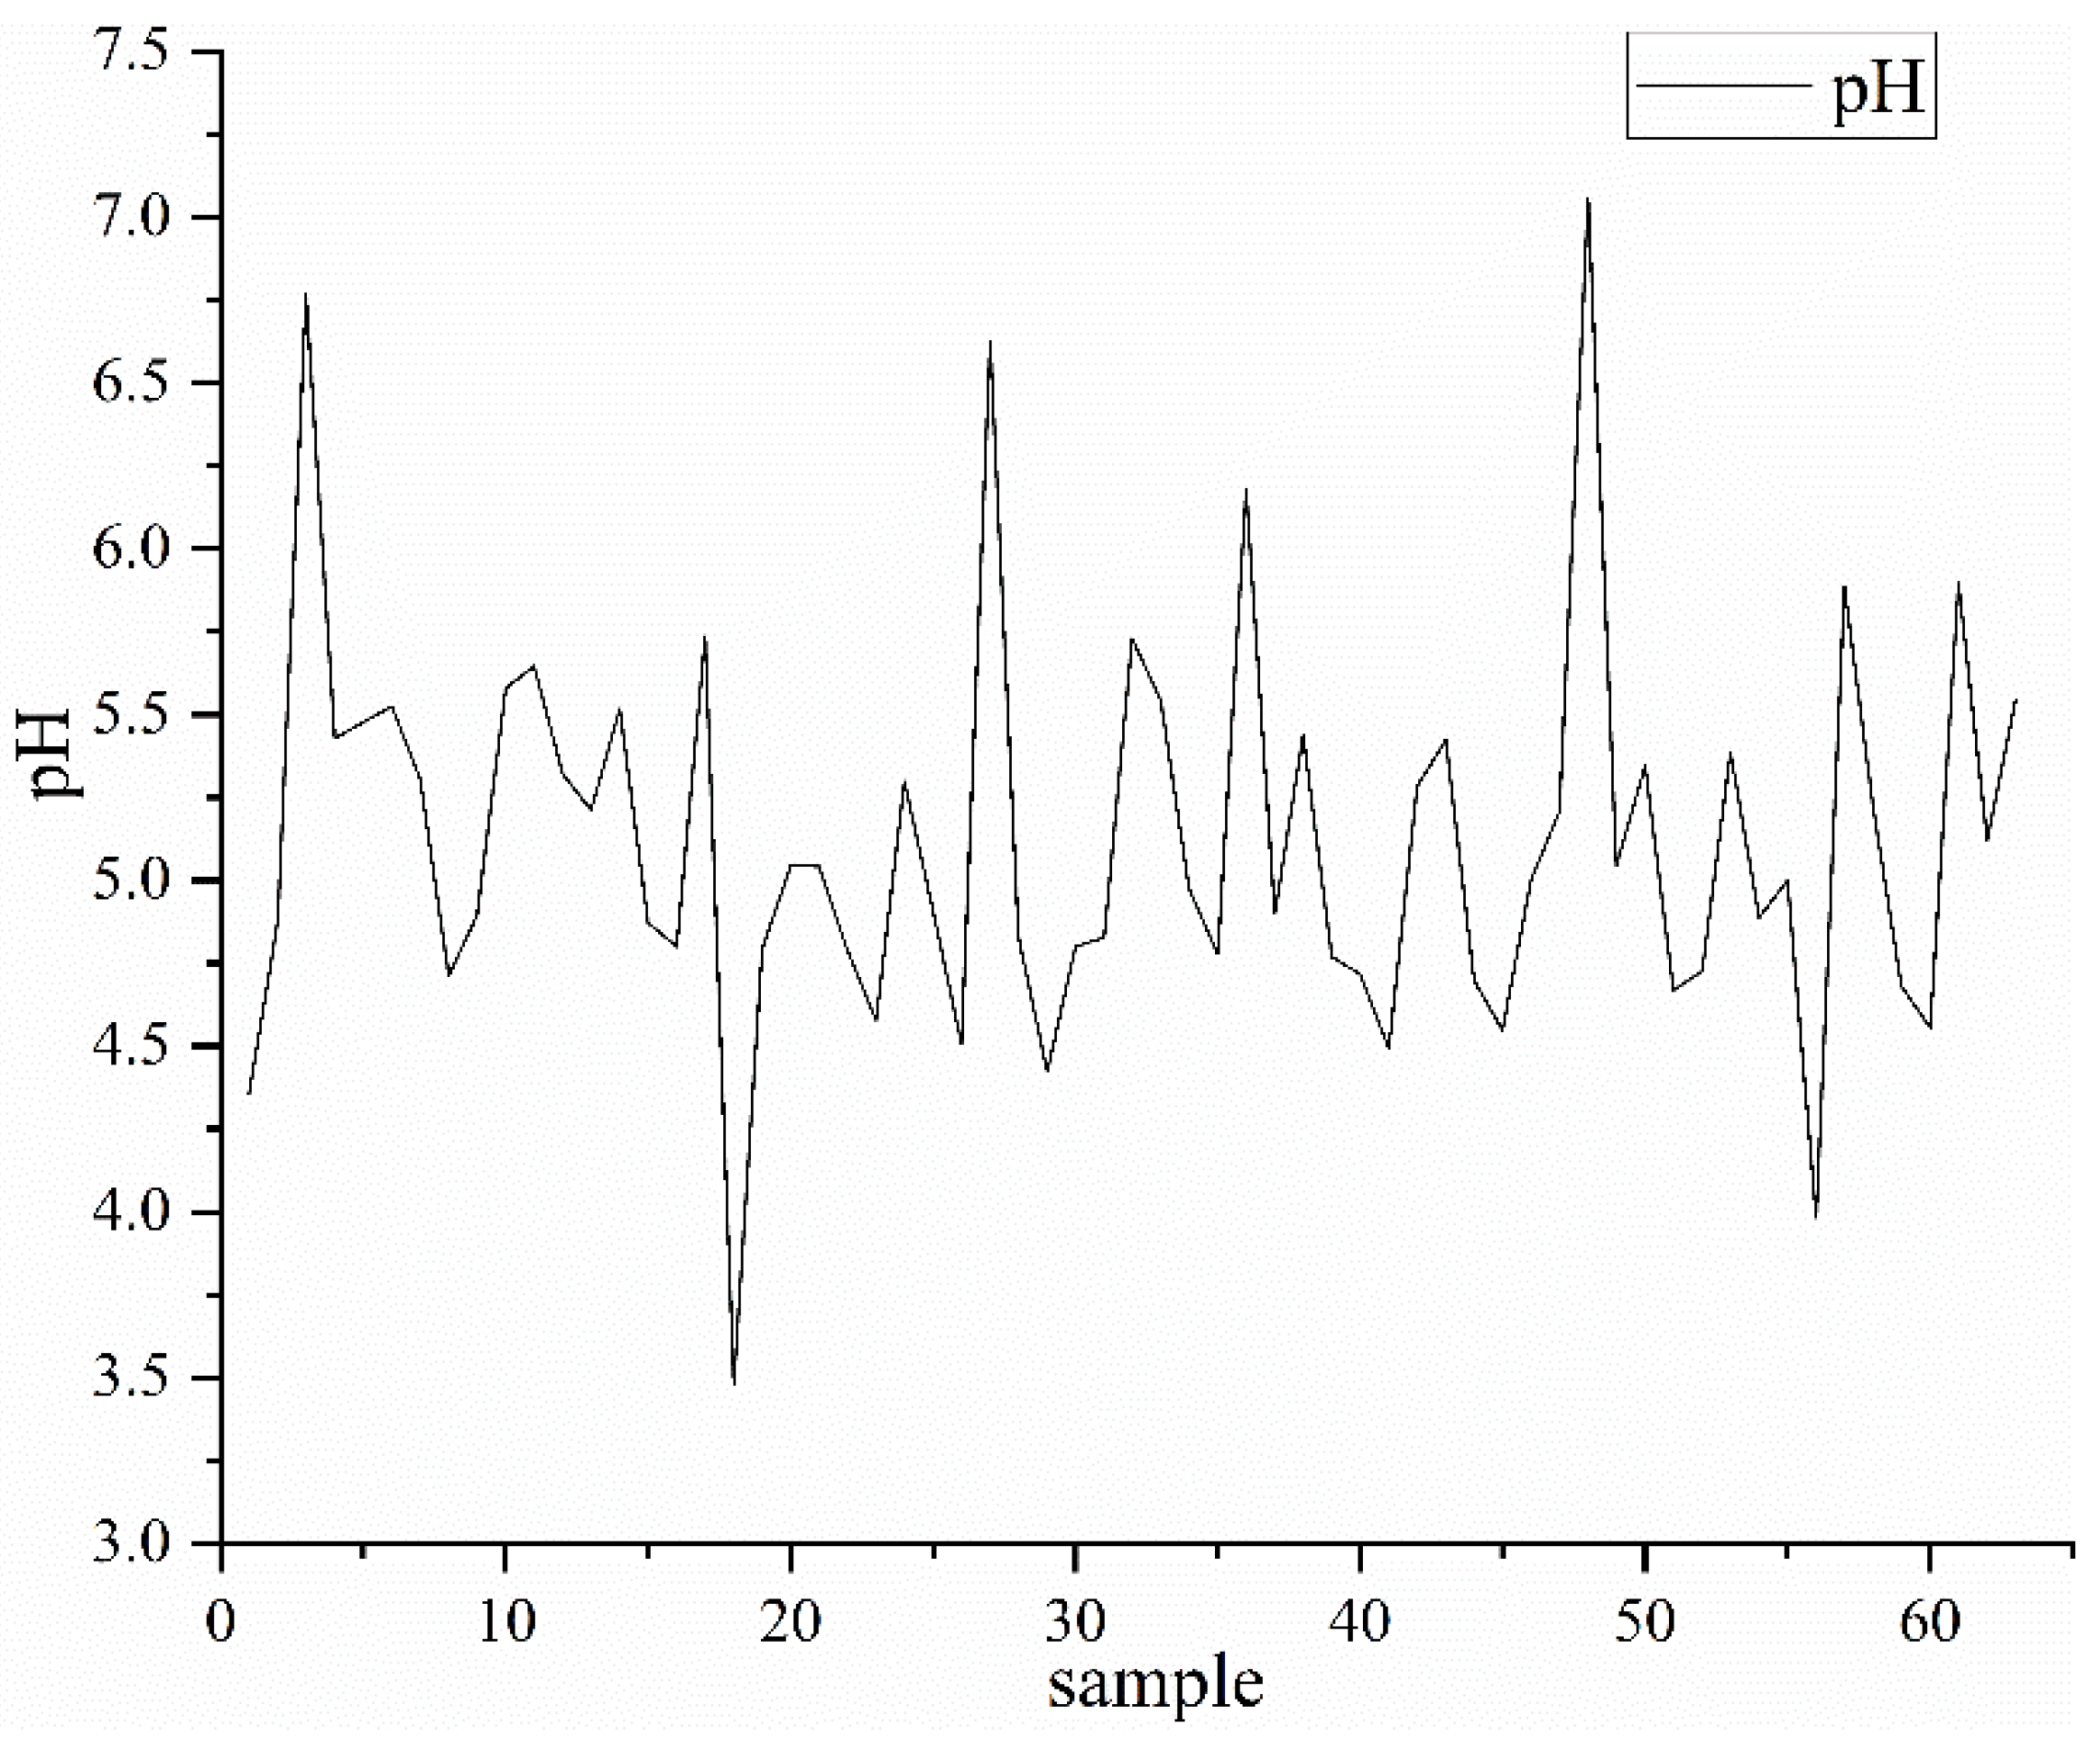
3.1. Descriptive Statistics of Soil Heavy Metals and Physicochemical Properties

The soil heavy metal content and related properties in the study area are shown in Table 1. The content of different heavy metals in the topsoil was quite different. Compared with the background level of soil heavy metals in Sichuan Province, the ratio between the level of 6 heavy metals in the study area and their background level in Sichuan Province was As (61.90%) > Cr (36.51%) > Ni (28.57%) > Zn (11.11%) > Pb (6.35%) > Cu (0.00%), indicating that these heavy metals (particularly As element) were accumulated with varying degrees in the study area. The highest contents of Pb, As, Cu, Zn, Ni, and Cr were 1.18, 5.29, 0.91, 1.34, 1.90, and 2.91 times of the background level, respectively. The contents of NH 4 + -N, NO 3 -N, AP, AK, EC, CEC, and SWC in the topsoil of the study area were 5.56–118.10 mg kg−1, 28.16–381.60 mg kg−1, 4.92–281.20 mg kg−1, 30.28–867.50 mg kg−1, 1.43–25.04 mS m−1, 0.10–12.90 cmol+ kg−1, and 4.47–47.49%, respectively. The pH of soil samples in this area ranged from 3.48 to 7.06, with an average value of 5.12. In addition, the samples with pH value less than 7.0 accounted for 98.41% of the total samples, indicating that the soil is generally weakly acidic, and the soil heavy metal activity is relatively strong. Soil pH controls nearly all aspects of physical, chemical, and biological processes in soils. These processes can alter metal availability, including dissolution and precipitation of solid phases of metals, complexation of metal species, and acid-based reactions [14,15] Since lower pH generally reduces the adsorption of metal ions on soil particles, the competition between free metal ions and other cations in solution increases, thereby increasing the metal concentration in soil solution [16].
The coefficient of variation (CV) is an important measure to characterize the degree of sample variation, and can reflect the degree of artificial influences on the sample. CV < 0.10 represents weak variation, 0.10 ≤ CV ≤ 0.50 represents moderate variation, and CV > 0.50 represents high variation [17]. The degree of variation for the six heavy metals (from high to low) was As > Pb > Cu > Zn > Cr > Ni. Except for Ni with moderate variation, the content of other heavy metals had high level of variation, indicating that As, Pb, Cu, Zn, and Cr in the soil of the study area are significantly affected by external factors. This could be due to human activities, e.g., industry, transportation, and chemical fertilizer application, which have a great impact on the health of local residents and the ecological environment.

3.2. Risk Evaluation

3.2.1. Risk Assessment of Heavy Metal Pollution in Soil

In order to reveal the degree of heavy metal pollution from local soil sampling sites or individual soil heavy metal indicators, we conducted pollution assessments on 63 soil sampling sites based on the single pollution index and the Nemerow comprehensive index (Table 2). The soil heavy metals (Pb, As, Cu, Zn, Ni, and Cr) had various degrees of pollution in the study area. The single-factor pollution index of the soil area was less than 1 for the 6 heavy metals except for As and Cr. The single-factor pollution index of As and Cr indicated that 17.46% and 4.76% of the sample sites were classified as having Mild Pollution for As and Cr, respectively. Nemerow comprehensive pollution index showed that sites with Slight Pollution and Mild Pollution accounted for 26.98% and 3.17% of all the sampling sites, respectively, indicating that nearly 70% of the sampling sites in the study area had no heavy metal pollution in the soil.

3.2.2. Comprehensive Evaluation of Soil Heavy Metal Pollution

The single pollution index and Nemerow comprehensive index described above can only evaluate the degree of heavy metal pollution in each individual sampling site. Such analyses do not integrate experimental data with multivariate statistics, spatial analysis and geostatistical analysis. They do not reveal the interaction between the distribution differences of heavy metals and driving factors, the spatial proximity effect and spatial distribution characteristics of heavy metals at each sampling site. It is also not possible to achieve the division (zoning) of soil heavy metal pollution in the study area. In order to further describe its spatial variation characteristics in the entire study area, we adopted inverse distance weighted (IDW) and the spatial superposition methods to conduct spatial interpolation and comprehensive evaluation of soil heavy metal pollution.
The vertical distribution pattern of heavy metals (Pb, As, Cu, Zn, Ni, Cr) in affected area of slag field was shown in Figure 2. The six heavy metals in the study area had an island-like (Pb), strip-like (Cu), and spot-like (As, Zn, Ni, Cr) distribution. Sites with the highest content of Pb was mainly distributed in the areas around the National Highway 108 (site #3, 22, 23, 24, 27, 28, 32, 38, 40, 44, 45, 50, 54, 55, 57, 60–63 points, Figure 2) and around the slag field (site #34, 35, Figure 2). Pb are mainly distributed in the upper reaches and southeastern parts of the Lima River. The high As content areas (site #29, 31, 47, 49, 51, 58 points, Figure 2) are distributed in dry land and forest land in the northeast of the study area and the whole south. It is possible that these areas are located at the bottom of the slope, with serious soil erosion and low vegetation coverage. Under the influence of the dry and hot valley, heavy metals are accumulated by rainwater. Sites with low content of the overall Cu content was 0.94–27.27 mg·kg−1, and the pollution level was relatively low. The areas with high content of Cu (site #1, 3, 25, 34, 35 points, Figure 2) were distributed in strip-like form near the National Highway 108. Except for the lower reaches of Lima River with serious Zn pollution (site #14, 43 points, Figure 2), the remaining study areas had uniform distribution of Zn. The sites with low content of Ni were in the west of the study area, and the sites with high content of Ni (site #6, 16, 34, 43, 59, 61 points, Figure 2) was in the east of the study area, especially in the lower reaches of the Lima River. The areas with high content of Cr (site #30, 59, 60 points, Figure 2) showed a spot-like distribution in the northern woodland, garden land, dry land, and the lower reaches of the Lima River. The contents of As, Cu, Zn, Ni, and Cr were relatively high not only in the surrounding areas of the slag field, but also in the garden and dry land, indicating that As, Cu, Zn, Ni, and Cr in the garden and dry land are affected by other factors in addition to the slag field. It is hypothesized that this could be due to the differences in land use types, fertilization, and agricultural production methods since there are no other industrial and mining pollution sources in the affected area [18]. Agricultural irrigation using surface water can affect the content of heavy metals in the topsoil of the region.
According to the comprehensive pollution evaluation on the spatial distribution of soil heavy metals, the pollution degree was divided into 5 grades (Figure 3). The comprehensive pollution index of spatial distribution was consistent with the results of spatial interpolation distribution of soil heavy metals (Figure 2). The topsoil in the majority of northeast and southwest of the study area showed the grade of No Pollution or Slight Pollution. The pollution index near the central and northern part of the slag field, the National Highway 108 and the lower reaches of the Lima River was relatively high. The central part of the study area showed Slight Pollution and the degree of pollution showed a trend of gradually increasing from the center of the study area to the surrounding areas. From the center to the northeast or southwest, the degree of pollution was lighter, and from the center to the northwest or southeast, the degree of pollution was more serious. This is related to the distance from the slag field, soil physical and chemical properties, regional ecological climate, land use types, etc. The accumulation of heavy metals in the soil threatens the environmental quality and requires further vigilance. Overall, the comprehensive pollution index of heavy metals in the topsoil of the study area was between 0.59 and 3.69, and the heavily polluted sites were distributed in the northwest (site #3, 27, 28, 30, 34, 46, 50, 61, 62 points, Figure 2) and southeast (site #59 points, Figure 2) of the study area. Sites with No Pollution or Slight Pollution were mainly distributed in forest and areas with vegetation coverage, while sites with Moderate Pollution or Heavy Pollution were mainly distributed in crop planting areas and areas near the slag fields. The zoning of soil heavy metal pollution in the affected areas of slag field can facilitate risk assessment and regional management, and control of heavy metal pollution in soils.

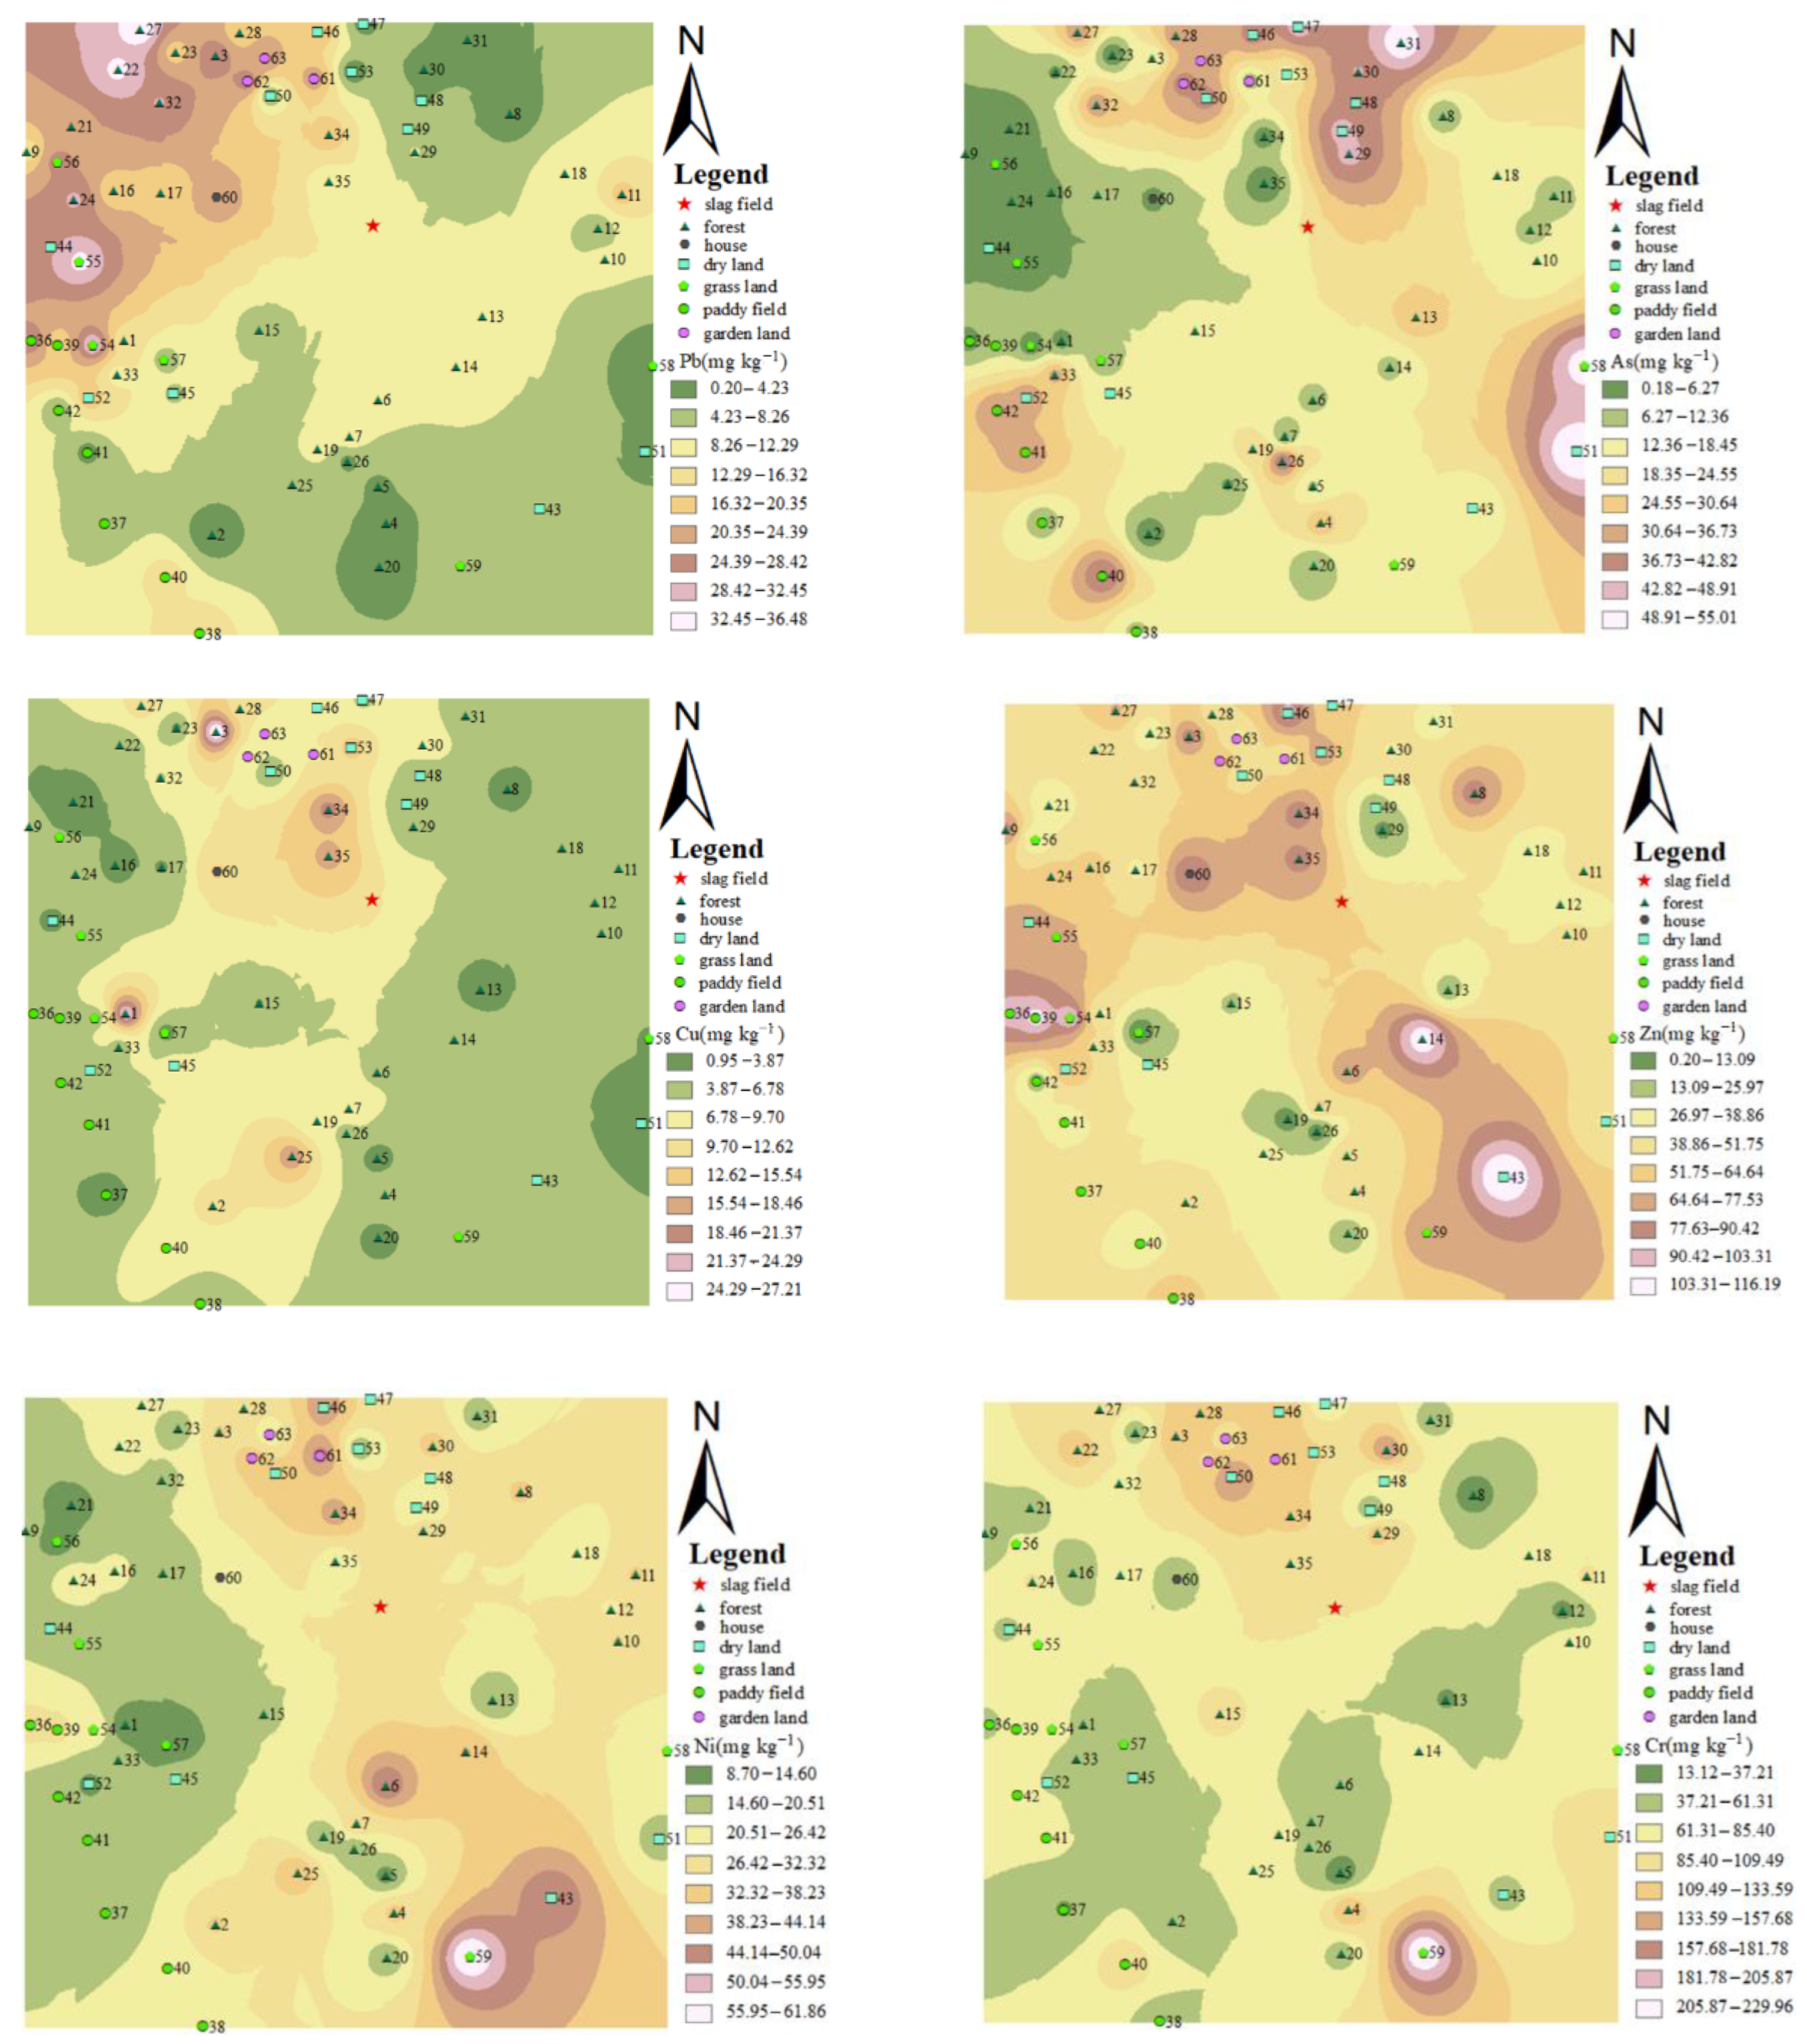
3.3. Source and Pollution Degree of Heavy Metals in Soil

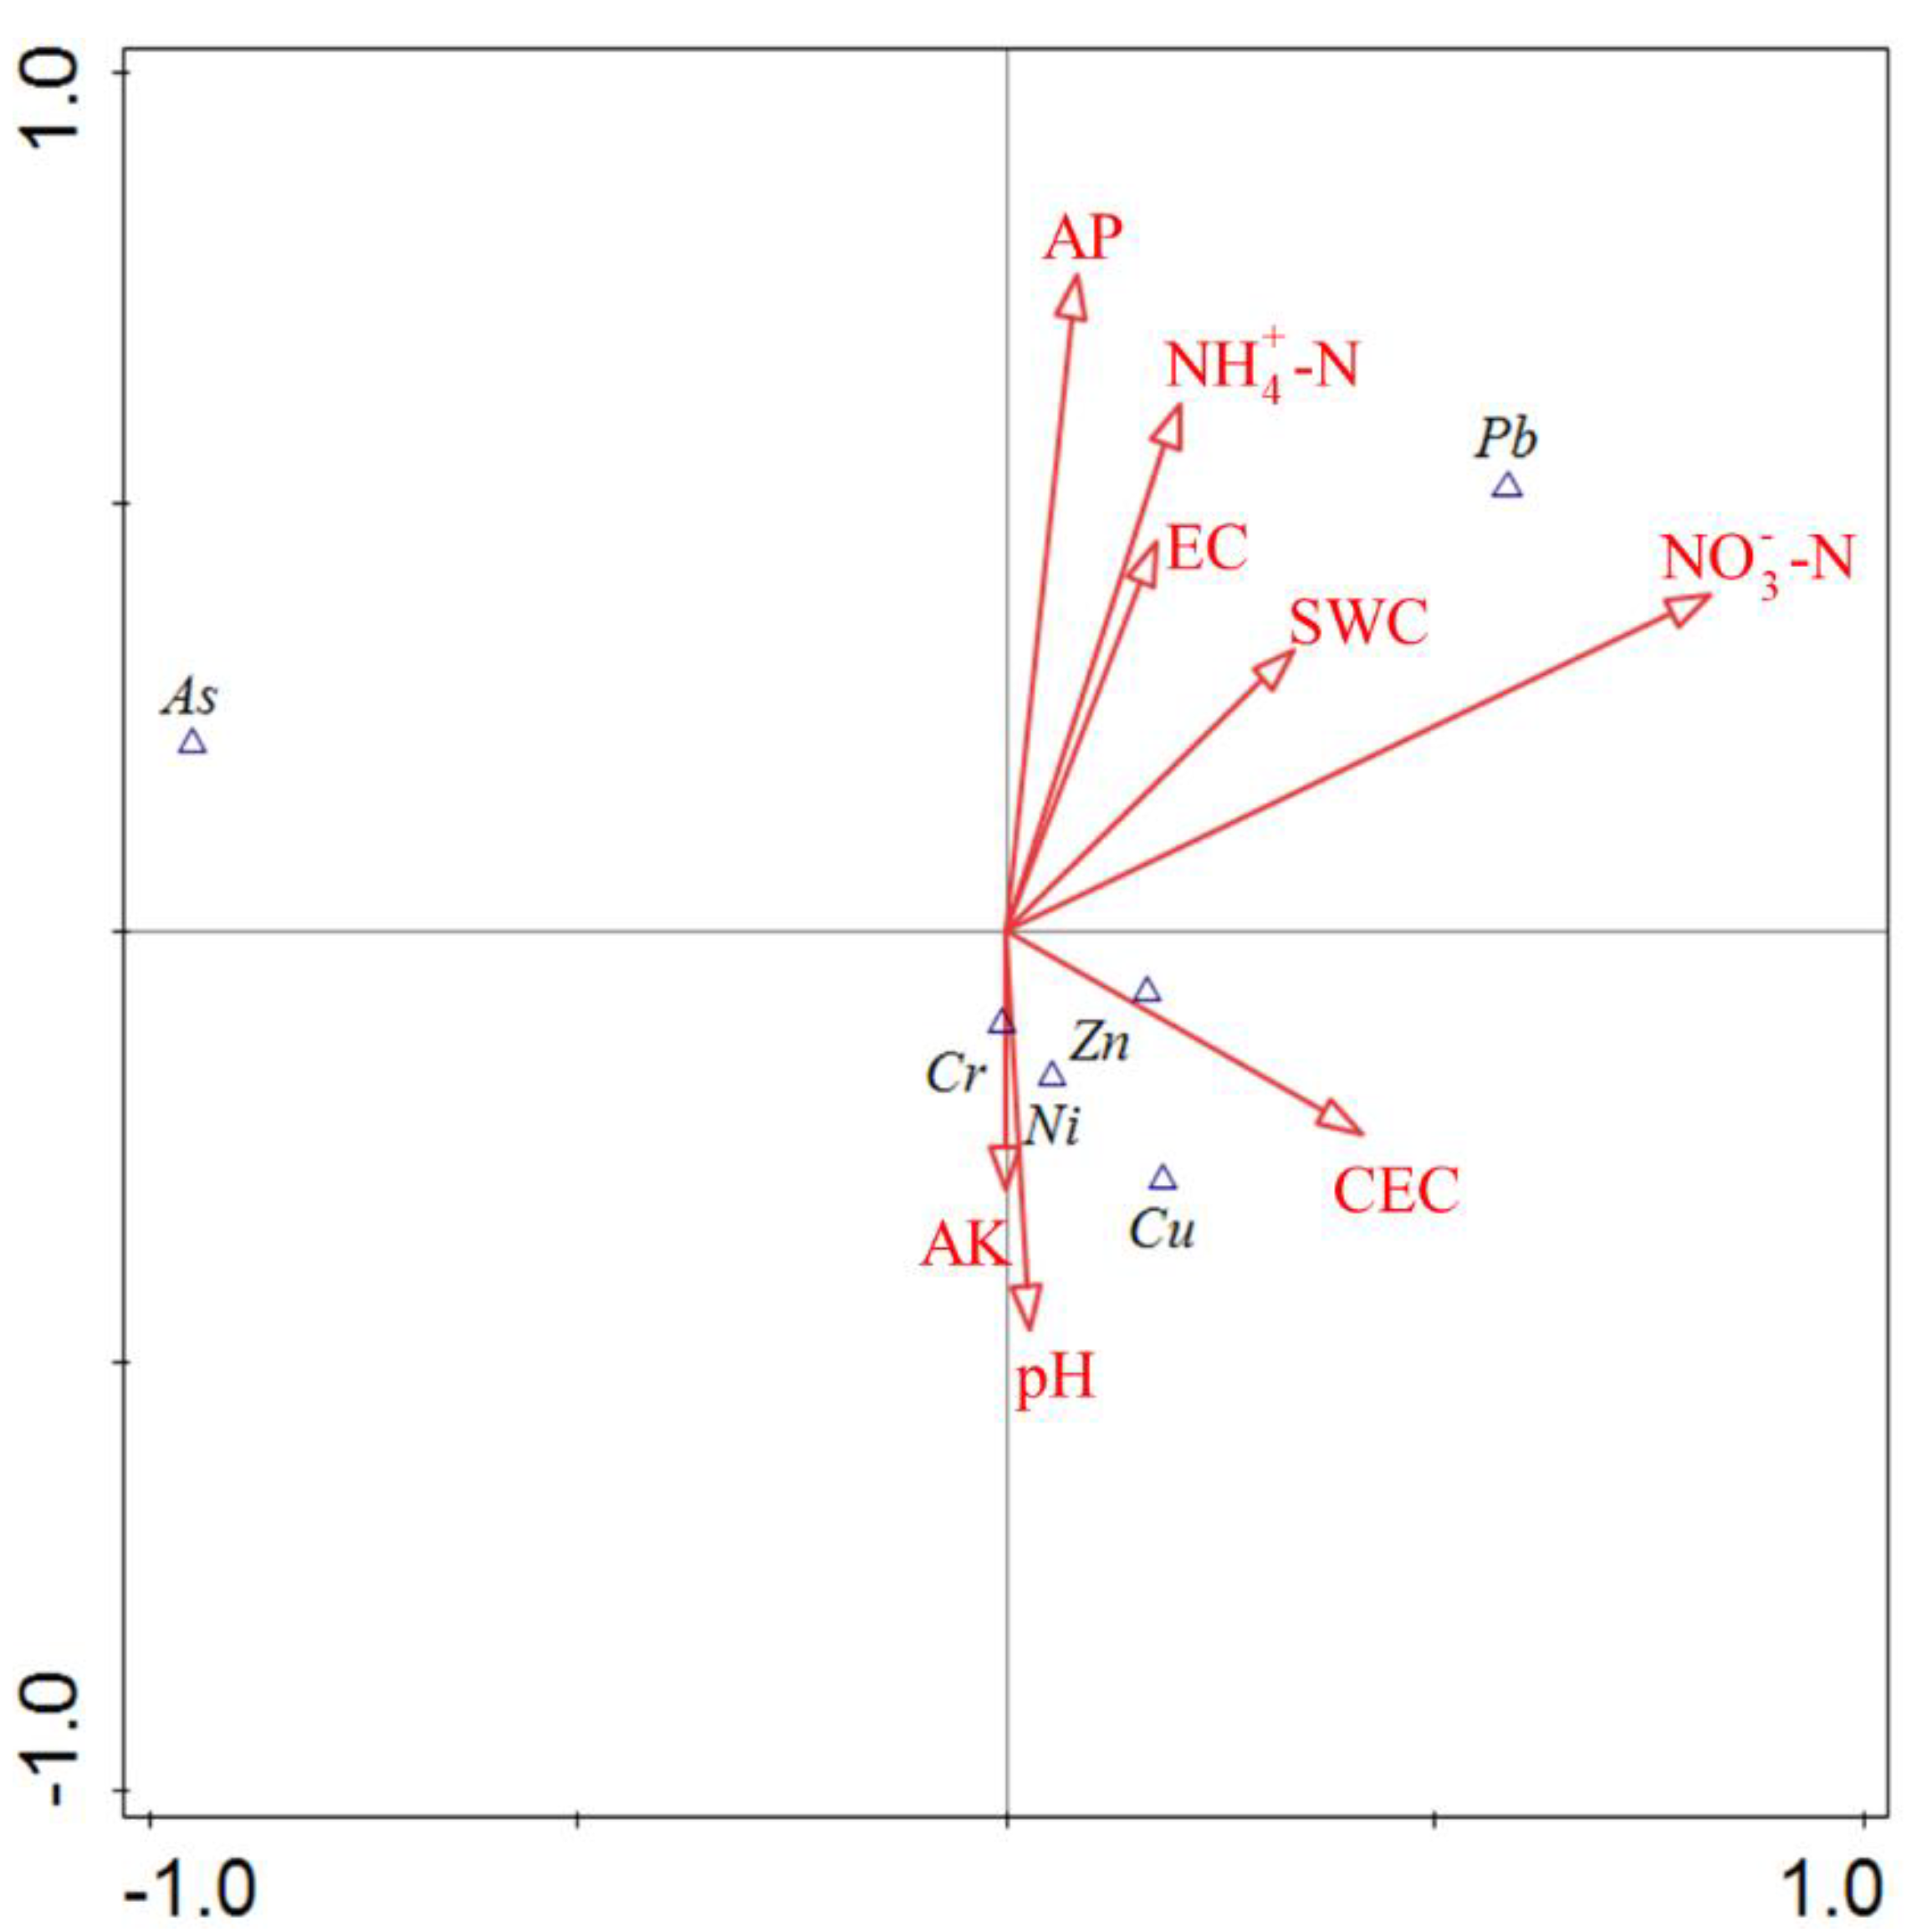
3.3.1. Relationships between Environmental Factors and Heavy Metals

Statistical analysis showed that there were significant correlations among the contents of heavy metals (Table 3). The content of Pb was negatively correlated with that of As and positively correlated with that of Zn. The content Pb had no significant correlations with that of Cu, Ni, and Cr. As has a negative correlation with Zn, and a positive correlation with Cr. The Pearson correlation coefficients for Zn-Ni and Ni-Cr were close to 0.5, and the correlation was significant. The relationship between soil heavy metals and soil physicochemical properties is the result of the interaction between soil solid matter and various elements under certain environmental conditions. The pH value of the soil samples in the study area varied from 3.48 to 7.06 (Table 1, Figure 4). The overall pH is weakly acidic. The contents of Pb and As were negatively correlated with pH. Reduction of soil pH usually leads to an increase in the availability of heavy metals in the soil, which is consistent with previous studies [19]. The complexation reaction (e.g., Cu NH 3 4 2 + of Cu and Zn may reduce the availability of Cu and Zn in soil. Thus, their availability is correlated with the status of ammonium nitrogen. The content of Pb was positively correlated with that of AP. Studies have shown [20] that the application of phosphorus fertilizers may also promote the accumulation of heavy metals in agricultural soils. There is a positive correlation between Pb and EC. Soil EC reflects the concentration of solutes in soil water and can affect the migration of heavy metals. Higher EC values are usually accompanied by higher metal release capacity [21]. Cr was positively correlated with CEC, indicating that the content of Cr decreased with the increase of CEC, because with the increase of CEC, the negative surface charge in the soil gradually increased, thus providing more adsorption sites to fix heavy metal ions. Soil water content and volume mass are closely related to soil texture, which is one of the important factors affecting content of soil heavy metals. Therefore, soil water content and volume mass indirectly affect the content of heavy metals [22]. There was a positive correlation between Pb and soil water content. Highly effective heavy metals pose a greater risk of migration and pose a greater threat to the surrounding environment and human health [23,24].
Pearson correlation analysis can reveal the relationship between the two pollutants. In order to further explore the influence of various physical and chemical factors on heavy metals, CCA analysis was carried out on soil physical and chemical properties (Figure 5). NH 4 + -N, NO 3 -N, AP, EC, and SWC were the main factors that affect the content of Pb. As was positively correlated with AP, but was not correlated with NH 4 + -N. As was negatively correlated with NO 3 -N, AK, EC, CEC, SWC, and pH. The contents of Cu and Ni had no significant correlation with NO 3 -N, AK, CEC, pH, and SWC, but had negative correlation with NH 4 + -N, AP, and EC. The content of Zn in the topsoil was mainly affected by and had positive correlation with NO 3 -N, AK, CEC, SWC, and pH. The content of Zn was negatively correlated with NH 4 + -N, AP, and EC. The content of Cr was positively correlated with AK, CEC, and pH, and was negatively correlated with NH 4 + -N, NO 3 -N, AP, EC, and SWC.

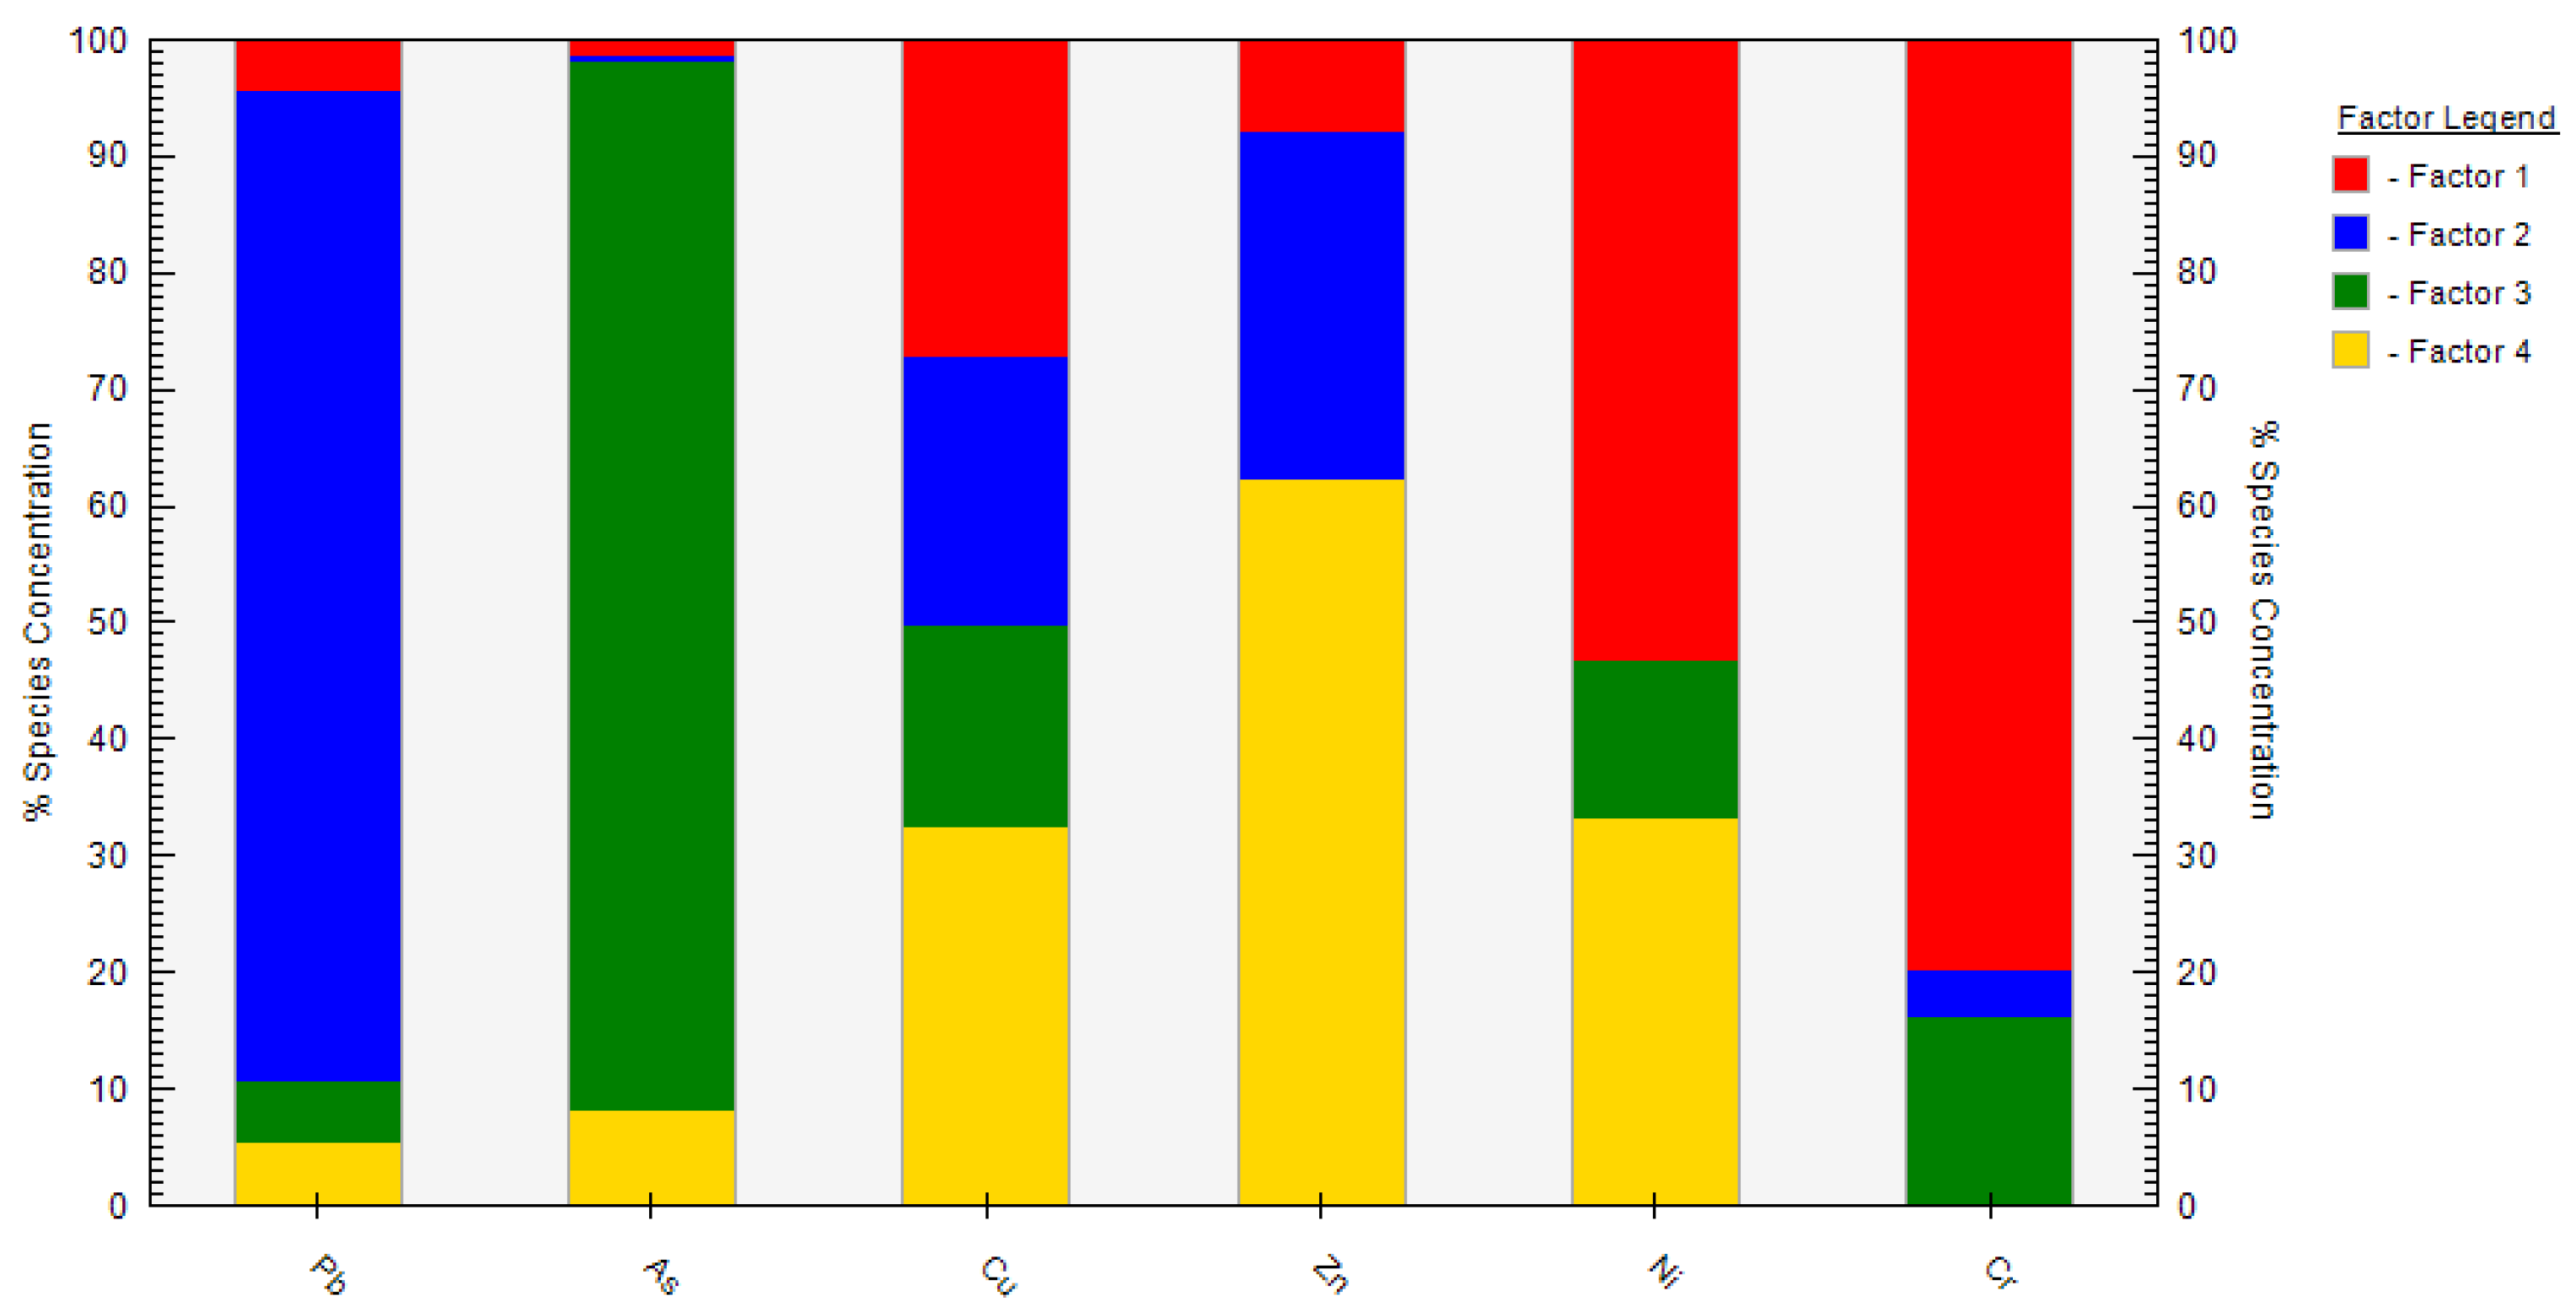
3.3.2. Source Analysis of PMF Model

By using constraints, PMF can obtain results that no sample can have significantly negative source contributions. The uncertainty caused by modeling error, random error, and rotational ambiguity can be avoided by the bootstrap (BS), displacement (DISP), and the BS-DISP [25]. The data was processed through 100 iterations to identify the smallest and most stable Q (robust). After multiple attempts, it was finally determined that the Q (robust) was the smallest when factor 4 was used. Most of the residuals were in the [−3, 3] interval, indicating an ideal modeling. Results from PMF analysis were shown in Figure 6. Factor 1 was dominated by Cr (79.9%) and Ni (53.3%), followed by Cu (27.2%), Zn (7.9%), Pb (4.4%), and As (1.4%). Studies have shown that the Cr and Ni in the topsoil are mainly affected by the natural background [26,27]. There is a positive correlation between Cr and Ni (Table 3), indicating that they have similar origins. The CV of Cr and Ni was 0.51 and 0.44 (Table 1), respectively, indicating that their variation is relatively small and was less affected by human activities. Therefore, Cr and Ni mainly come from natural sources and are affected by soil-forming parental materials. In contrast, Cu, Zn, Pb, and As are partly from natural sources. Factor 1 can be interpreted as a natural source.
The contribution rate of factor 2 was 85%, 29.9%, 23.1%, 3.8%, and 0.5% for Pb, Zn, Cu, Cr, and As, respectively. Pb mainly contributed by factor 1 constituted the most significant potential ecological risk in the soils of the study area. Pb is usually present in natural soils, and the content of Pb increases significantly with the continuous industrial modernization (e.g., mining, steel processing, coal combustion, and lead-acid battery production) [28]. Pb and Zn in the soil were enriched in the non-ferrous metal slag field in the study area through rainwater erosion and atmospheric deposition [29,30,31,32]. Transportations are also an important source of soil Pb and Zn. National Highway 108 traverses the entire study area from north to south. Brake pad wear, lubricating oil loss, tire wear, and corrosion of automobile parts can result in the enrichment of Pb and Zn in soil [33]. Therefore, factor 2 can be used as a mixed source for industry and transportation.
Factor 3 had high contribution to the As (90.0%), while its contribution to Cu (17.2%), Cr (16.3%), Ni (13.6%), and Pb (5.2%) was relatively low. The main anthropogenic sources of As include mining activities, metal smelting, pesticides, and fertilizers. In particular, the use of As-containing pesticides, As-containing feed additives in pig and poultry farming, and manure from poultry for land fertilization may lead to soil contamination in large areas of agricultural land [34,35]. High As pollution was located in the north of the study area (Figure 2), which is far from the slag field. The land use types were mainly forest land (sites# 29–31), dry land (sites# 46–49), and garden land (sites# 61–63). The vegetation coverage in this study area is low, and the application of As-containing pesticides and fertilizers in dryland and garden land leads to an increase in As content. Thus, factor 3 can be defined as an agricultural source.
The main loading elements of factor 4 were Zn, Ni, and Cu. The contribution rates of factor 4 for Zn, Ni, and Cu were 62.2%, 33.1%, and 32.5%, respectively, followed by 8.1% for As and 5.4% for Pb. Lima River flows through the study area from north to south (Figure 1). A large amount of wastewater containing Zn, Ni, Cu, As, and Pb was produced near the non-ferrous metal slag field and discharged into the Lima River. Under the influence of the dry-hot valley, soil erosion is serious, and soil heavy metals are easily accumulated in the lower reaches of the Lima River. Field investigation showed that the farmland near the Lima River has been irrigated with sewage from the Lima River for many years. The areas with high pollution of Zn, Ni, Cr, and As are close to the Lima River (Figure 2), particularly in the lower reaches of Lima River. Therefore, it is speculated that the significant enrichment of heavy metals could be due to the river alluvial fan. The trace heavy metal elements carried by the river sediment are deposited with the sediment, resulting in the accumulation of these trace elements in the alluvial fan soil. Numerous studies have shown that agricultural soils are seriously contaminated by Zn due to long-term sewage irrigation or sludge application. Therefore, factor 4 can be defined as an industrial river water [36,37].

4. Conclusions

The average contents of Pb, As, Cu, Zn, Ni, and Cr are 13.27, 19.87, 6.91, 50.55, 25.06, and 77.71 mg·kg−1, respectively. The ratio between the level of 6 heavy metals in the study area and their background level in Sichuan Province was As (61.90%) > Cr (36.51%) > Ni (28.57%) > Zn (11.11%) > Pb (6.35%) > Cu (0.00%). The highest contents of Pb, As, Cu, Zn, Ni, and Cr were 1.18, 5.29, 0.91, 1.34, 1.90, and 2.91 times of the background level in Sichuan Province, respectively.
Nemerow comprehensive pollution index showed that sites with Slight Pollution and Mild Pollution accounted for 26.98% and 3.17% of all the sampling sites, and nearly 70% of the sites in the study area have no heavy metal pollution in the soil. Spatial interpolation and comprehensive evaluation showed that No Pollution and Slight Pollution are mainly distributed in forest and vegetation coverage areas, while Moderate and Heavy Pollution are mainly distributed in crop planting areas and areas near slag fields.
On the basis of correlation analysis and canonical correspondence analysis, the PMF model was used to analyze the sources of heavy metals in soil. The results show that the sources of heavy metals in the topsoil of the slag field are mainly from natural sources, mixed sources of industry and transportation, agricultural sources, and industrial river water.

Author Contributions

L.J., H.L. and S.C. were responsible for the conception and design of the research. L.J., H.L. and M.F. were the main experimenters of the study, and were the main writers of the manuscript. Z.W. and S.G. contributed to the discussion and revisions. Meanwhile, S.C. interpreted the results. M.F. and Z.W. reviewed and supervised the manuscript. All authors have read and agreed to the published version of the manuscript.

Funding

This work was supported by the National Key R&D Program of China, grant number 2019YFC1803500.

Informed Consent Statement

Not applicable.

Data Availability Statement

The datasets used and analyzed during the current study are available from the corresponding author upon reasonable request.

Conflicts of Interest

The authors declare no competing interests.

References

  1. Broda, J.; Franitza, P.; Herrmann, U.; Helbig, R.; Grosse, A.; Grzybowska-Pietras, J.; Rom, M. Reclamation of abandoned open mines with innovative meandrically arranged geotextiles. Geotext. Geomembr. 2020, 48, 236–242. [Google Scholar] [CrossRef]
  2. Gujre, N.; Mitra, S.; Soni, A.; Agnihotri, R.; Rangan, L.; Rene, E.R.; Sharma, M.P. Speciation, contamination, ecological and human health risks assessment of heavy metals in soils dumped with municipal solid wastes. Chemosphere 2020, 262, 128013. [Google Scholar] [CrossRef] [PubMed]
  3. Adimalla, N.; Chen, J.; Qian, H. Spatial characteristics of heavy metal contamination and potential human health risk assessment of urban soils: A case study from an urban region of south India. Ecotox. Environ. Saf. 2020, 194, 110406. [Google Scholar] [CrossRef] [PubMed]
  4. Duan, X.W.; Zhang, G.L.; Rong, L.; Fang, H.Y.; He, D.N.; Feng, D.T. Spatial distribution and environmental factors of catchment-scale soil heavy metal contamination in the dry-hot valley of Upper Red River in southwestern China. Catena 2015, 135, 59–69. [Google Scholar] [CrossRef]
  5. Liu, X.; Wang, X.; Wang, D.Y. Spatial distribution trends and influencing factors of typical heavy metals in subtropical alpine forest soils: A case study from Ailao mountain in Yunnan province. Environ. Sci. 2021, 42, 3507–3517. [Google Scholar]
  6. Hai, X.Z.; Ang, Z.C.; Xiao, J.W.; Li, T.W.; Qing, W.; Xiao, Q.W.; Ying, Q.M. Risk Assessment and Source Apportionment of Heavy Metals in Soils from Handan City. Appl. Sci. 2021, 11, 9615. [Google Scholar]
  7. Yang, H.R.; Wang, F.E.; Yu, J.; Huang, K.; Zhang, H.C.; Fu, Z.H. An improved weighted index for the assessment of heavy metal pollution in soils in Zhejiang, China. Environ. Res. 2021, 192, 110246. [Google Scholar] [CrossRef]
  8. Ahn, J.M.; Kim, S.; Kim, Y.S. Selection of priority management of rivers by assessing heavy metal pollution and ecological risk of surface sediments. Environ. Geochem. Health 2020, 42, 1657–1669. [Google Scholar] [CrossRef] [PubMed]
  9. Li, K.J.; Gu, Y.S.; Li, M.Z.; Zhao, L.; Ding, J.J.; Lun, Z.J.; Tian, W. Spatial analysis, source identification and risk assessment of heavy metals in a coal mining area in Henan Central China. Int. Biodeter. Biodegr. 2018, 128, 148–154. [Google Scholar] [CrossRef]
  10. Lv, J.S. Multivariate receptor models and robust geostatistics to estimate source apportionment of heavy metals in soils. Environ. Pollut. 2019, 244, 72–83. [Google Scholar] [CrossRef]
  11. Guan, Q.Y.; Wang, F.F.; Xu, C.Q.; Pan, N.H.; Lin, J.K.; Zhao, R.; Yang, Y.Y.; Luo, H.P. Source apportionment of heavy metals in agricultural soil based on PMF: A case study in Hexi Corridor, Northwest China. Chemosphere 2018, 193, 189–197. [Google Scholar] [CrossRef] [PubMed]
  12. Luo, X.S.; Xue, Y.; Wang, Y.L.; Cang, L.; Xu, B.; Ding, J. Source identification and apportionment of heavy metals in urban soil profiles. Chemosphere 2015, 127, 152–157. [Google Scholar] [CrossRef]
  13. Paatero, P.; Tapper, U. Positive matrix factorization: A non-negative factor model with optimal utilization of error estimates of data values. Environmetrics 1994, 5, 111–126. [Google Scholar] [CrossRef]
  14. Fairbrother, A.; Wenstel, R.; Sappington, K.; Wood, W. Framework for metals risk assessment. Ecotox. Environ. Saf. 2007, 68, 145–227. [Google Scholar] [CrossRef] [PubMed]
  15. Martin, M.; Bonifacio, E.; Hossain, K.M.J.; Huq, S.M.I.; Barberis, E. Arsenic fixation and mobilization in the soils of the Ganges and Meghna floodplains. Impact of pedoenvironmental properties. Geoderma 2014, 228, 132–141. [Google Scholar]
  16. Johanne, N.; Hodson, M.E.; Stuart, B. A review of studies performed to assess metal uptake by earthworms. Environ. Pollut. 2007, 145, 402–424. [Google Scholar]
  17. Wei, J.; Zheng, X.G.; Liu, J.T.; Zhang, G.W.; Zhang, Y.X.; Wang, C.L.; Liu, Y.C. The Levels, Sources, and Spatial Distribution of Heavy Metals in Soils from the Drinking Water Sources of Beijing, China. Sustainability 2021, 13, 3719. [Google Scholar] [CrossRef]
  18. Ma, J.; Liu, P.; Liu, J.Z.; Guo, C.H.; Zhang, X.; Wang, L.H. Pollution Evaluation and Quantitative Traceability Analysis of Heavy Metals in Farmland Soils around the Gangue Heap of Coal Mine, Chongqing. Environ. Sci. 2022. [Google Scholar] [CrossRef]
  19. Zhong, X.; Chen, Z.W.; Li, Y.Y.; Ding, K.B.; Liu, W.S.; Liu, Y.; Yuan, Y.Q.; Zhang, M.Y.; Baker, A.J.M.; Yang, W.J.; et al. Factors influencing heavy metal availability and risk assessment of soils at typical metal mines in Eastern China. J. Hazard. Mater. 2020, 400, 123289. [Google Scholar] [CrossRef]
  20. Zhang, Y.M.; Li, S.; Chen, Z.; Wang, F.; Chen, J.; Wang, L.Q. A systemic ecological risk assessment based on spatial distribution and source apportionment in the abandoned lead acid battery plant zone, China. J. Hazard. Mater. 2018, 354, 170–179. [Google Scholar] [CrossRef] [PubMed]
  21. Friedman, S.P. Soil properties influencing apparent electrical conductivity: A review. Comput. Electron. Agric. 2005, 46, 45–70. [Google Scholar] [CrossRef]
  22. Yang, Q.Q.; Li, Z.Y.; Lu, X.N.; Duan, Q.N.; Huang, L.; Bi, J. A review of soil heavy metal pollution from industrial and agricultural regions in China, Pollution and risk assessment. Sci. Total Environ. 2018, 642, 690–700. [Google Scholar] [CrossRef]
  23. Zhang, X.; Yang, H.H.; Cui, Z.J. Migration and speciation of heavy metal in salinized mine tailings affected by iron mining. Water Sci. Technol. 2017, 76, 1867–1874. [Google Scholar] [CrossRef] [PubMed]
  24. Sun, J.W.; Yu, R.L.; Hu, G.R.; Jiang, S.H.; Zhang, Y.F.; Wang, X.M. Bioavailability of heavy metals in soil of the Tieguanyin tea garden, southeastern China. Acta Geochim. 2017, 36, 519–524. [Google Scholar] [CrossRef]
  25. Paatero, P.; Eberly, S.; Brown, S.G.; Norris, G.A. Methods for estimating uncertainty in factor analytic solutions. Atmos. Meas. Technol. 2014, 7, 781–797. [Google Scholar] [CrossRef]
  26. Hu, Y.A.; Cheng, H.F. Application of stochastic models in identification and apportionment of heavy metal pollution sources in the surface soils of a large-scale region. Environ. Sci. Technol. 2013, 47, 3752–3760. [Google Scholar] [CrossRef]
  27. Hu, Y.A.; Liu, X.P.; Bai, J.M.; Shih, K.M.; Zeng, E.Y.; Cheng, H.F. Assessing heavy metal pollution in the surface soils of a region that had undergone three decades of intense industrialization and urbanization. Environ. Sci. Pollut. R. 2013, 20, 6150–6159. [Google Scholar] [CrossRef]
  28. Cheng, H.F.; Hu, Y.N. Lead (Pb) isotopic fingerprinting and its applications in lead pollution studies in China: A review. Environ. Pollut. 2010, 158, 1134–1146. [Google Scholar] [CrossRef]
  29. Dong, B.; Zhang, R.Z.; Gan, Y.D.; Cai, L.Q.; Freidenreich, A.; Wang, K.P.; Guo, T.W.; Wang, H.B. Multiple methods for the identification of heavy metal sources in cropland soils from a resource-based region. Sci. Total Environ. 2019, 651, 3127–3138. [Google Scholar] [CrossRef]
  30. Xiao, R.; Guo, D.; Ali, A.; Mi, S.S.; Liu, T.; Ren, C.Y.; Li, R.H.; Zhang, Z.Q. Accumulation, ecological- health risks assessment, and source apportionment of heavy metals in paddy soils: A case study in Hanzhong, Shaanxi, China. Environ. Pollut. 2019, 248, 349–357. [Google Scholar] [CrossRef]
  31. Lv, J.S.; Liu, Y. An integrated approach to identify quantitative sources and hazardous areas of heavy metals in soils. Sci. Total Environ. 2019, 646, 19–28. [Google Scholar] [CrossRef] [PubMed]
  32. Hu, Y.N.; He, K.L.; Sun, Z.H.; Chen, G.; Cheng, H.F. Quantitative source apportionment of heavy metal(loid)s in the agricultural soils of an industrializing region and associated model uncertainty. J. Hazard. Mater. 2020, 391, 122244. [Google Scholar]
  33. Yang, S.Y.; He, M.J.; Zhi, Y.Y.; Chang, S.X.; Gu, B.J.; Liu, X.M.; Xu, J.M. An integrated analysis on source-exposure risk of heavy metals in agricultural soils near intense electronic waste recycling activities. Environ. Int. 2019, 133, 105239. [Google Scholar] [CrossRef] [PubMed]
  34. Hu, Y.A.; Cheng, H.F.; Tao, S.; Schnoor, J.L. China’s ban on phenylarsonic feed additives, a major step toward reducing the human and ecosystem health risk from arsenic. Environ. Sci. Technol. 2019, 53, 12177–12187. [Google Scholar] [CrossRef] [PubMed]
  35. Zhao, W.; Cheng, H.F.; Tao, S. Structure-reactivity relationships in the adsorption and degradation of substituted phenylarsonic acids on birnessite (δ-MnO2). Environ. Sci. Technol. 2020, 54, 1475–1483. [Google Scholar] [CrossRef] [PubMed]
  36. Zeng, X.F.; Wang, Z.W.; Wang, J.; Guo, J.T.; Chen, X.J.; Zhuang, J. Health risk assessment of heavy metals via dietary intake of wheat grown in Tianjin sewage irrigation area. Ecotoxicology 2015, 24, 2115–2124. [Google Scholar] [CrossRef]
  37. Meng, W.Q.; Wang, Z.W.; Hu, B.B.; Wang, Z.L.; Li, H.Y.; Goodman, R.C. Heavy metals in soil and plants after long-term sewage irrigation at Tianjin China: A case study assessment. Agric. Water Manag. 2016, 171, 153–161. [Google Scholar] [CrossRef]
Figure 1. The distribution of sampling sites.
Applsci 12 09475 g001
Figure 2. Spatial distribution of heavy metals in soil.
Applsci 12 09475 g002
Figure 3. Spatial distribution layer of comprehensive pollution evaluation of soil heavy metals.
Applsci 12 09475 g003
Figure 4. Soil pH map.
Applsci 12 09475 g004
Figure 5. Two-dimensional ordination of CCA of soil heavy metal contents and soil physicochemical properties.
Applsci 12 09475 g005
Figure 6. Contribution of each factor to different soil heavy metals.
Applsci 12 09475 g006
Table 1. Descriptive statistics for heavy metal concentrations and basic parameters in soils.
IndexUnitMinMaxMeanSDCVBackground Value
Pbmg·kg−10.2036.5013.3710.030.7530.90
Asmg·kg−10.1755.0219.8716.810.8510.40
Cumg·kg−10.9427.276.915.040.7330.10
Znmg·kg−10.11116.2050.5527.700.5586.50
Nimg·kg−18.6861.8725.0610.970.4432.60
Crmg·kg−112.96230.0577.7139.310.5179.00
NH 4 + -Nmg·kg−15.56118.1047.2319.910.42-
NO 3 -Nmg·kg−128.66381.60157.2184.970.54-
APmg·kg−14.92281.2049.6054.931.11-
AKmg·kg−130.28867.50220.50172.100.78-
ECmS m−11.4325.046.925.330.77-
CECcmol+ kg−10.1012.902.782.721.00-
SWC%4.4747.4920.356.700.32-
pH-3.487.065.120.610.12-
Table 2. Statistics of the proportion of soil heavy metal element pollution grade evaluation samples in the study area.
EvaluationIndexFirst-OrderSecond-OrderTertiaryFour PoleFive Grades
Single-factor pollution indexPiPi ≤ 11 < Pi ≤ 22 < Pi ≤ 3Pi > 3
Degree of pollutionNo pollutionMild pollutionModerately pollutedSevere pollution
Pb1000.000.000.00
As82.5417.460.000.00
Cu1000.000.000.00
Zn1000.000.000.00
Ni1000.000000.00
Cr95.244.760.000.00
Nemerow integrated pollution indexPNPN ≤ 0.70.7 < PN ≤ 11 < PN ≤ 22 < PN ≤ 3PN > 3
Degree of pollutionCleanSlight pollutionMild pollutionModerate pollutionHeavy pollution
PN69.8426.983.170.000.00
Table 3. Correlation analysis between soil heavy metals and soil physical and chemical properties.
IndexPbAsCuZnNiCr NH 4 + -N NO 3 -NAPAKECCECSWCpH
Pb1−0.321 *0.1510.310 *−0.0270.1350.332 **0.317 *0.350 **0.0750.251 *0.0950.256 *−0.106
As 1−0.146−0.300 *−0.0390.275 *0.115−0.373 **0.1310.158−0.015−0.199−0.032−0.044
Cu 10.2270.1900.243−0.0330.0340.0260.377 **0.1840.2010.0120.161
Zn 10.496 **0.0940.1130.1790.0830.215−0.0520.1050.0730.246
Ni 10.498 **0.108−0.077−0.1940.002−0.2150.0800.0680.306 *
Cr 10.146−0.1710.0210.246−0.0140.255 *0.0270.154
* p < 0.05; ** p < 0.01.
Publisher’s Note: MDPI stays neutral with regard to jurisdictional claims in published maps and institutional affiliations.

