1. Introduction
Nanopore detection technology is a single molecule detection technology with rapid detection, no PCR amplification, and low cost [
1,
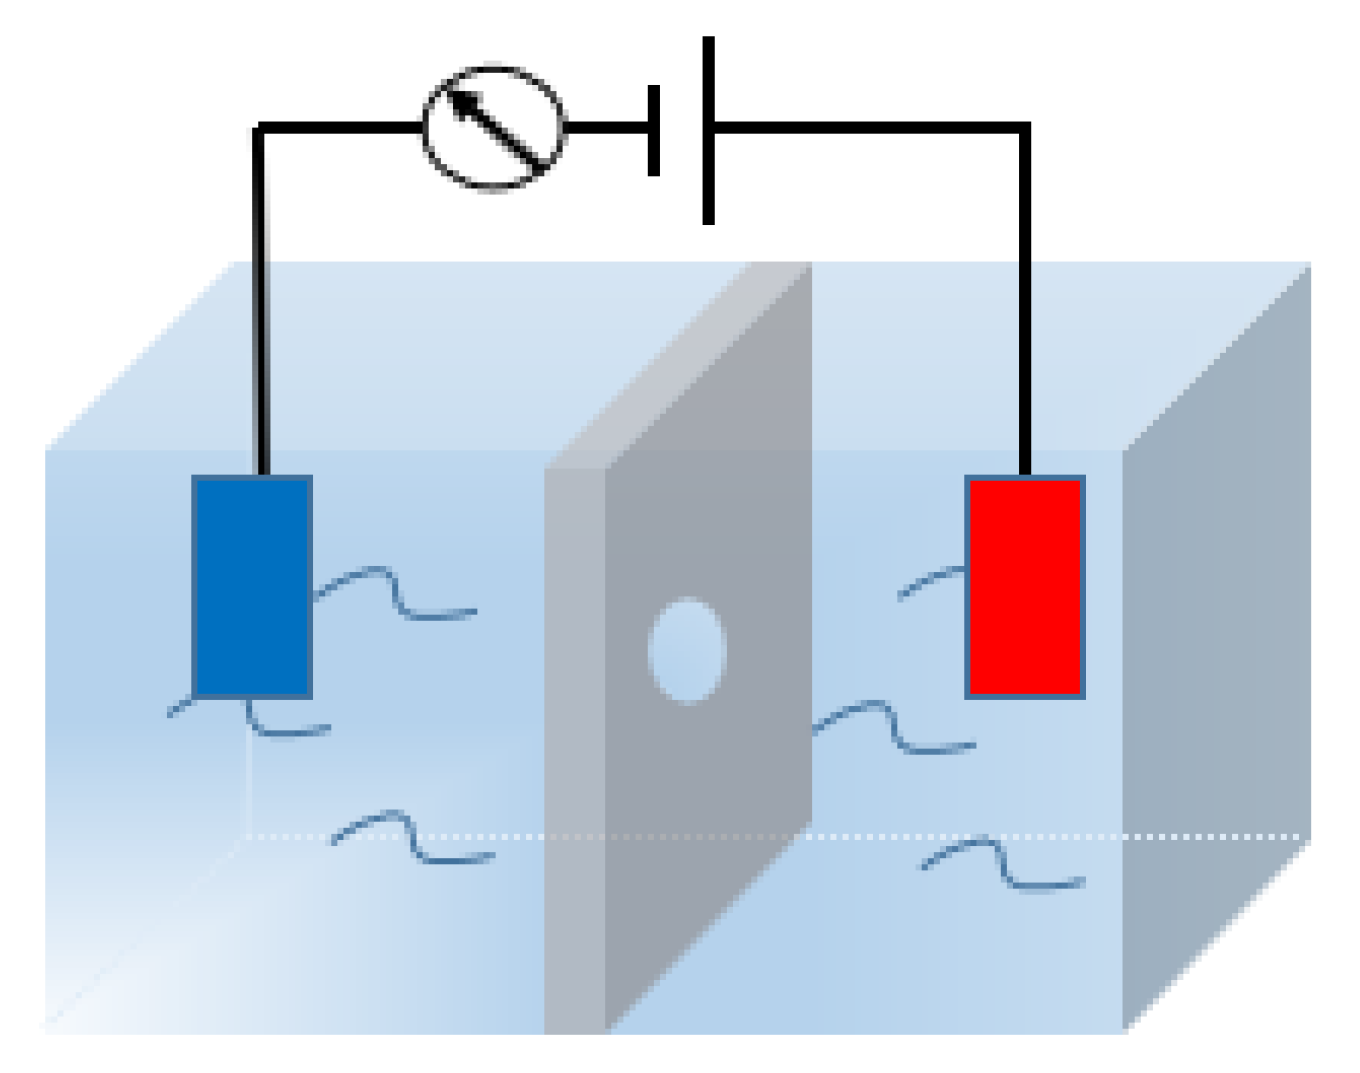
2]. In the chamber filled with electrolytes, an insulating impermeable membrane with nanoscale pores divides the chamber into two small chambers. When voltage is applied to the electrolyte chamber, ions pass through the pores under the electric field, forming a stable detectable ion current, as shown in
Figure 1. When biomolecules to be tested are added to the electrolyte, the biomolecules pass through the nanopore under the electric field, thus blocking the passage of ions and forming a pulse of ion current that can be detected. Therefore, the size and surface properties of the nanopore, the applied voltage strength, and the solution conditions can be mastered to detect different types of biomolecules.
However, there is more background noise in the nanopore current signal, which greatly affects the data analysis. It has been studied that the noise in the nanopore detection system consists of Gaussian white noise, low-frequency noise, and high-frequency noise [
3]. Gaussian white noise is one of the main noises of solid-state nanopores, it is especially necessary to explore the methods to reduce Gaussian white noise. Gaussian white noise is the noise caused by the electron Brownian motion in the nanopore channel and the interaction of ions with the nanofilm surface. The spectral density of its noise voltage is
, and the corresponding mean square value of the noise voltage
(
is the bandwidth of the noise voltage), which shows that the thermal noise is related to temperature, resistance, and bandwidth. Gaussian white noise across the entire spectrum, reducing the physical temperature of the detection system, system resistance, selecting the appropriate operating band, and using low-noise electronic components is a more direct way to reduce thermal noise. The low-frequency noise of the nanopore detection system mainly refers to 1/f noise, and the high-frequency noise is closely related to the capacitance of the nanopore system, so the nanopore signal noise fills the whole frequency domain. Most of the current researchers reduce the noise by improving the device conditions. Balan et al. [
4] proposed a high-frequency noise reduction structure to reduce the capacitance of silicon nitride film. Pitchford et al. [
5] used the same scheme and replaced the covering layer of silicon nitride film with a polymer material to reduce the noise. Demonstrated that limiting the contact area between the silicon nitride film and the electrolyte solution through a cover layer to reduce the nanofilm capacitance is an effective solution for reducing high-frequency noise. However, when a solid-state nanopore device is selected based on the biomolecule to be measured, the measurement temperature, nanopore resistance, detection equipment, and experimental parameters of the system have been determined, and it is difficult to perform noise reduction by the above means. Therefore, a noise reduction method based on wavelet transform and Kalman filter is proposed to perform multi-scale decomposition and optimal estimation of the nanopore current signal to achieve the purpose of noise reduction.
The nanopore current signal proposed in this paper is an IgG antibody signal, as shown in
Figure 2. IgG is the most abundant natural antibody component of plasma proteins (10–20%) and provides protection primarily against bacterial and viral infections. IgG not only allows intercellular signaling and cell activation, but because it is a soluble adhesion molecule, it can bind and neutralize antigens alone, making it useful for localizing the immune system and assessing related diseases [
6,
7,
8,
9]. For example, the working principle of HIV 3rd generation ELISA reagents and various rapid detection reagents is to detect IgG antibodies in infected patients. Currently, a series of immunological methods and techniques based on serological changes in IgG antibodies play an important role in virus antibody detection and macroscopic decision-making, so the study of IgG antibody nanopore signals is particularly important.
As seen from the above figure, the molecular perforation signal carries more background noise, and in the data analysis, the amplitude of the molecular perforation current signal needs to be calculated qualitatively and categorized for analysis, so noise reduction of the signal is required considering the accuracy of data processing.
2. The wavelet Method
2.1. Method Introduction
Compared with Fourier transform [
10], the wavelet transform can provide more accurate localization not only in the time domain but also in the frequency domain. Namely, it can perform multi-scale analysis of the signal in the time–frequency domain. The wavelet transform solves many difficult problems that cannot be solved by the Fourier transform, especially for non-stationary signal processing, and has “zoom” characteristics, which can be used in the low-frequency band with high-frequency resolution and low time resolution (wide analysis window); in the high-frequency band with low-frequency resolution and high time resolution (narrow analysis window). Given this advantage, the abrupt change points of the signal can be clearly distinguished by the wavelet transform.
2.2. Method Classification
Based on the characteristics of wavelet transform, it can be applied to nanopore signal noise reduction. The commonly used noise reduction methods include wavelet decomposition and reconstruction method, nonlinear wavelet transform threshold method [
11,
12], wavelet mode maxima method, etc. [
13].
Mallat proposed a multi-resolution analysis method of the signal [
14], which decomposes the signal into two parts, low and high frequencies, with the following equation.
is the low-frequency scale coefficient obtained as a function of the signal through low-pass filtering [
15]. Similarly,
is the high-frequency scale coefficient obtained as a function of the signal through band-pass filtering, and the wavelet decomposition principle is shown in
Figure 3. The decomposed signal is reconstructed by recurring the approximate discrete signal at higher resolution through the conjugate quadrature filter of both and inserting a zero between every two values of
and
, respectively, and convolving the sum with the corresponding conjugate filter so that the reconstruction of the wavelet signal is completed.
Equations (1) and (2) are the process of decomposing the original signal into low- and high-frequency coefficients by passing it through different filtering functions. In Equation (3), the reconstruction of the signal is completed by sieving the high-frequency coefficients.
Donoho proposed the wavelet threshold method [
16], which recovers the sampled data from the original signal into a smoothing function, sets an adaptive threshold, and reduces the noise by setting the coefficient threshold [
17]. A property of white noise in wavelet transform is used: the transformation of white noise on any orthogonal basis is still white noise. Therefore, a finite length signal superimposed with Gaussian white noise is assumed in the method, part of which is a Gaussian white noise sequence, and the wavelet transform is performed on the noise-containing signal, and the absolute value of the wavelet coefficients after wavelet decomposition is quantized by setting the threshold value as a threshold function, and those smaller than the threshold value are set to zero. The threshold method is divided into two methods: hard threshold method and soft threshold method [
18,
19].
is the threshold value set according to the signal. Wavelet coefficient reconstruction by (4) hard threshold method and (5) soft threshold method to approximate the original signal. Since the amplitude of white noise is invariant in the wavelet transform orthogonal basis, it makes the wavelet coefficients of those noises with smaller amplitude easily discarded by the set threshold, which makes the reconstructed original signal with higher signal-to-noise ratio and better asymptotic properties [
20].
The wavelet transform can clearly see the abrupt change point of the signal in the time–frequency domain, and it can describe the characteristics of the local signal. The signal mutation point is the extreme value point of wavelet transform coefficient mode, and the singular value of the signal is related to the change in wavelet coefficient scale, and the wavelet transform has the ability to determine the location and size of the singularity of the signal, so it can reduce the noise by comparing the extreme value.
According to the Lipschitz exponent [
21], the signal has a singular value at a point in time and its wavelet transform has an extreme value at this point [
22]. Then, the corresponding extreme values can be found within the wavelet function at different scales. This property can also be used to remove the noise to retain the useful signal. However, the modal maxima of the signal mutation points become larger as the function scale becomes larger, while the modal maxima of the noise mutation points become smaller as the function scale becomes larger. Because of this difference, the noise can be easily removed, and the effective signal retained.
2.3. Experimental Results
Design the experiment to obtain the current signals of IgG nanopore: process a solid-state nanopore with a diameter of 13.5 nm on a silicon nitride film with a thickness of 20 nm to construct a direct antibody detection system; secondly, add a certain concentration of IgG antibody (e.g., 0.01875 mg/mL) buffer solution, and apply a bias voltage of 100 mV at both poles of the electrode to induce the IgG antibody to pass through the solid-state nanopore under the action of electrophoretic force. Finally, the patch clamp detection system Axon 200B with high sampling rate (>5 kHz) is used to sample and record the IgG antibody signal.
According to the smooth discontinuity of nanopore signal, Haar wavelet is selected in this paper, and according to the effect of IgG signal reconstruction, the number of wavelet decomposition layers is 5. Haar wavelet is the simplest one in the family of Dobesian wavelets, which has the advantages of tight support in time domain, orthogonal symmetry, and simple calculation. Haar wavelet is also the only discontinuous Dobessie wavelet, so among all orthogonal wavelet transformations, the Haar wavelet can well resolve and reconstruct the nanopore detection signal in multiple ways by scale transformation and displacement transformation, effectively reducing the noise interference of nanopore detection signal. The IgG antibody nanopore current signal was processed by wavelet decomposition and reconstruction method, hard threshold method, soft threshold method, and modulus maximum method, as shown in
Figure 4.
The above four methods are applied to the nanopore current signal and conclude that since Gaussian white noise exists on the wavelet coefficients of each layer, although the wavelet decomposition and reconstruction method can roughly recover the waveform of the signal, it cannot remove the part of white noise that overlaps with the useful signal, so the noise reduction is not very satisfactory. The Gaussian white noise can be well eliminated by using the hard and soft thresholding methods and the mode maxima method. According to the signal-to-noise ratio (SNR) and root mean square error (RMSE) of the wavelet transform mentioned above [
23], as shown in
Table 1, the superior performance of the wavelet mode maxima method for noise reduction of nanopore signals is demonstrated. Where
refers to the original signal, and
refers to the estimated signal after noise reduction through wavelet transform.
Due to the huge amount of nanopore signal data, it is necessary to process the IgG antibody signal by segmentation. Based on the above simulation results, the wavelet mode maxima method is selected for noise reduction, as shown in
Figure 5.
3. The Kalman Filter Method
Kalman filtering is a kind of sequential data assimilation, using the minimum mean square error as the best estimation criterion, using the state space model of signal and noise, using the estimated value of the previous moment and the observed value of the current moment to update the estimation of the state variables, and finding the estimated value of the current moment, the algorithm makes an estimate of the signal to be processed that satisfies the minimum mean square error according to the established system equation and the observed equation [
24]. The following is the Kalman filter correlation equation:
Equation (8) is the system state model update equation, and X(k) is the predicted value of the system, and P is the system covariance. Based on the predicted value and the measured value Z(k), the optimal estimation of the current state is carried out, where Kg(k) is the Kalman gain, and the covariance of the current state needs to be updated at the same time, and the optimal estimation of the signal can be completed through continuous recursion.
It can be known from (10) that the measured value
Z(
k) has an effect on the Kalman filter estimated value
X(
k|
k), and the
Kg(
k) represents the magnitude of this effect. The noise in the current signal will make the gain smaller and smaller, which affects the estimation accuracy of the Kalman filter [
25,
26,
27,
28]. According to the four wavelet transform processing results in the previous section, it is known that the wavelet mode maxima method is a better method for noise reduction of nanopore signal, so the mode maxima method is chosen to process the nanopore current signal first, enhance the Kalman filter gain through noise reduction, improve the estimation accuracy of Kalman filter, and optimize the signal processing results [
29,
30,
31].
Due to the large amount of data, part of the IgG nanopore current signal was intercepted for testing, as shown in
Figure 6.
4. Results and Discussion
Through the above analysis of the Kalman filter algorithm, wavelet mode maxima method effectively improves the estimation accuracy of Kalman filter, so this paper combines both wavelet mode maximization method and Kalman filter algorithm to apply in the noise reduction processing of nanopore current signal, and the comparison of processing effect with traditional Kalman filter algorithm is shown in
Figure 7a,b, and it is found that the combined algorithm not only improves the accuracy of Kalman filter algorithm, but also improves the noise reduction effect significantly. The red area is the processing result of the current signal after the noise reduction processing (c). Applying the above two methods to the whole segment of IgG current signal, it is found that the traditional Kalman filter process brings a false peak of noise P0, and the Kalman filter process based on the wavelet mode maxima method proposed in this paper eliminates this peak better, which makes the characteristic peak PI of IgG antibody current signal stand out, which is significant for analyzing the characteristics of IgG antibody. Additionally, by comparing the standard deviation (RMS) of this method with the traditional Kalman filter processing method, as shown in
Table 2, the measured data shows that the method proposed in this paper reduces the standard deviation of the background noise by 17.8%, which is better than the traditional Kalman filter.
The experimental results show that the noise reduction treatment of the nanopore current signal is completed by using the method based on wavelet transform and Kalman filter, which is better than traditional Kalman filter in terms of estimation accuracy and noise reduction, and the traditional Kalman filter algorithm may misclassify the noise signal as valid signal, which has a great impact on the analysis of biomolecular properties. which is based on the traditional Kalman filter, combined with the characteristics of multi-scale analysis of wavelet transform, and the noise reduction effect is better in the low and high frequencies are estimated separately. The noise reduction effect is good and has high reference significance for the noise reduction of molecular perforation signal of nanopore detection system.


