Abstract
In a construction project, construction cost estimation is very important, but construction costs are affected by various factors, so they are difficult to predict accurately. However, with the recent development of ANN technology, it has become possible to predict construction costs with consideration of various influencing factors. Unlike previous research cases, this study aimed to predict the total construction cost by predicting seven sub-construction costs using a multioutput regression model, not by predicting a single total construction cost. In addition, analysis of the change in construction cost prediction performance was conducted by scaling and regularization. We estimated the error rate of predicting construction costs through sub-construction cost prediction to be 16.80%, a level similar to that of the total construction cost prediction error rate of 17.67%. This study shows that the construction cost can be calculated by predicting detailed cost factors at once, and it is expected that various types of construction costs or partial construction costs can be predicted using the predicted detailed cost elements. As a result of predicting several sub-construction costs using multioutput-based ANN, it was found that the prediction error rate varies depending on the type of construction. To improve accuracy, it is necessary to supplement influencing factors suitable for the construction features.
1. Introduction
Cost estimation is an important factor in planning among management functions and should be as accurate as possible. Accuracy, accountability, transparency, and efficiency should be considered when calculating cost estimation. This is because all of these factors directly affect the performance of the project [1]. However, construction costs are affected by a wide variety of factors such as the environment, conditions, and configurations, and there is a limit to predicting construction costs by considering all these factors in cost estimation. Although various studies have been conducted to predict construction costs, the most used criterion for estimating construction costs is the unit price per unit area.
In the cost estimation of building construction, regression analysis has traditionally been used, but the ANN method has been widely used in recent years, and it has been found that the predictive performance of ANN is better than that of regression [2,3,4,5]. Even with ANN techniques, project cost prediction performance can vary widely depending on what influencing factors are used to predict construction costs, how ANN models are constructed to predict construction costs, and what hyper parameters are used to perform machine learning.
The project may be contracted in several packages from the initial stage, and the contract method may vary depending on the cost of packages. In this case, it may be necessary to predict sub-construction costs for these packages in the initial stage. With ANN, it is possible to predict not only a single output value but also multiple output values, so these sub-construction costs can be predicted at once, which can be useful when sub-construction cost prediction is required. This study proposes a method to predict sub-construction costs by using the ANN model based on a multioutput regression model and to predict the total construction cost by summing these sub-construction costs. In addition, it was determined how the predictive performance of construction costs is affected when pre-processing methods such as MinMax and Z-score Scaling and L1 and L2 Regulation that can prevent overfitting are used.
2. Related Works
Recently, research on predicting construction costs using the ANN method has been steadily increasing. Most of these studies focus on predicting the total construction cost according to the ANN model and influencing factors.
Lee et al. [6] found that the ensemble model can be utilized in ANN-based conceptual cost estimation models to improve prediction accuracy and stability when the amount of project data is not large. Pham et al. [7] attempted to develop a fast and accurate machine learning (ML) and optimization framework. They reviewed 13 ML regression algorithms and suggested that using artificial neural networks (ANNs), gradient boosting, and XGBoost models, construction costs can be predicted with the best accuracy with minimal time.
Yuanyuan Tian et al. [8] developed a genetic algorithm-backpropagation neural network (GA-BPNN) model to quantitatively predict project portfolio benefit (PPB). The model developed in the study showed higher prediction accuracy than conventional BPNNs. Kim et al. [9], proposed a hybrid ARIMA-ANN model to predict construction costs and city-level construction cost indicators (CCIs), which could provide more accurate predictions than ARIMA or ANN.
Mattel et al. [10] stated that the ANN method was inspired by the process in which the human brain works. Polat [11] said that ANN finds the correlation weight of the hidden layer in the relationship between the input layer and the output layer and predicts the result value through the calculated weight. ANN algorithms are of great help in solving problems involving variables with dynamic properties. Through the learning process, the pattern of variables can be found, and this can also be confirmed in the form of a learning curve.
An approximate estimate is to predict construction costs for uncompleted plans. Construction cost is calculated through the experience of the estimator, and is calculated based on data from previously completed projects. The error range of the approximate estimate is approximately 10 to 25% [11]. Although there are various methods for cost estimation, ANN is an accurate and widely known method for cost estimation. Previously, various studies have been conducted to solve the cost estimation problem, and these studies confirm that ANN’s performance is better than that of a simple regression method and has a great effect on accuracy depending on the composition of neural networks in cost estimation [1].
In a study using ANN for the scope of cost estimation or cost analysis, the trend of highway construction costs was analyzed in Louisiana, USA, and future cost trends were predicted [12]. In Australia, the total life cycle cost of construction work was calculated using the concept of major cost factors [13]. In Egypt, on-site indirect costs were predicted for a dam project [14], and in Turkey, ANN was applied to the cost estimation of a building structure system [15].
Squeira [16] proposed an automated cost estimation system for low-rise steel structures based on ANN, where design variables such as area, perimeter length, height, and load were mainly used. The mean absolute error cost estimation using these variables in ANN and regression were 11% and 15%, respectively. As can be seen in various research cases, ANN presents fairly good results in predicting construction costs.
Most of the existing research cases involved various ANN analysis methods that could more accurately predict total construction costs. Research on how to predict multiple construction costs at the same time, such as subconstruction costs, is still lacking. The method of predicting multiple construction costs at the same time can be used in various cases for predicting detailed construction cost factors that cannot be directly calculated, in addition to predicting multiple sub-construction costs.
3. Cost Estimation Methodology by Multioutput Regression
3.1. Multioutput Regression
Multioutput regression is a method of predicting two or more result values using given input data, and is used to predict x and y coordinate values or predict result values for various future points of time. Most machine learning algorithms are designed to predict a single number. However, the model can be modified and used to support multiple output values as shown in Equation (1). Predicting multiple output values using the given input data is called multioutput regression.
In multioutput regression, all output values must be correlated with the input value. If there are output values that do not correlate with the input data, they should be predicted together with other output values, or individually using different models.
The cost function for multivariate regression analysis is almost similar to the cost function for univariate regression analysis. To derive the least squares cost function, the error at the i-th point can be written as . To square this error, the square l2 vector normal must be used. Therefore, in this case, the least square cost function can be viewed as the average of the square Norm for the error at each point as shown in Equation (2)
In Equation (2), if c = 0, it becomes the least squares cost function of multiple univariate regression
Previous construction cost prediction studies mainly dealt with the total construction cost prediction method with various cost influencing factors. Total construction cost is divided into sub construction cost such as architecture, civil engineering, electricity, mechanic, telecommunications, and fire safe construction costs, and these sub construction costs may be required in the initial construction cost prediction.
Since they are often carried out in the form of separate bids in the construction stage, there are cases where each construction cost must be predicted separately. In this study, it is intended to predict these detailed construction costs at once by using a single learning model using a multioutput regression method.
First, 10 factors influencing construction costs were selected for input data, and 8 factors including total construction costs were selected as the output data, including building structure, mechanical, civil, landscape, electricity, telecommunication, and fire safe construction cost as shown in Figure 1.
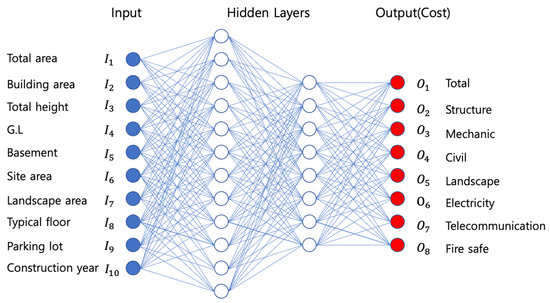
Figure 1.
Multioutput regression model for building construction cost estimation.
The analysis procedure in this study for predicting construction costs through multioutput regression is shown in Figure 2. First, the input/output data structure and input/output data to be used for machine learning are determined, and six cases are defined for analyzing the methodology and predictive performance for machine learning, then the ANN model required for machine learning is defined, and the predictive performance of ANN model is analyzed using K-fold. Finally, a prediction model is created for the model with the best performance, and a construction cost prediction test is conducted using this. Tensorflow, Keras library and Visual Studio Code were used for machine learning of construction cost prediction.
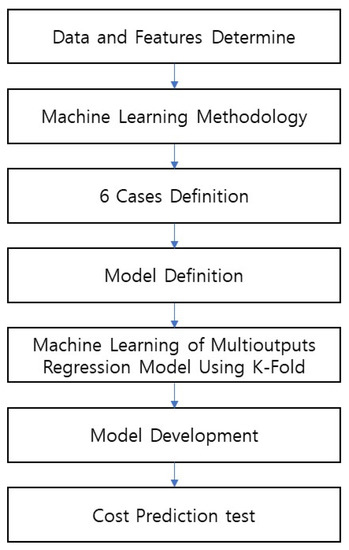
Figure 2.
Multioutput Regression Machine Learning Analysis Procedure.
3.2. ANN Model for Construction Cost Estimation by Multioutput Regression
A total of 908 cases of data from the Public Production Service (PPS) in Korea were collected as machine learning data for predicting construction costs from 2018 to 2021, and 608 cases of construction cost data of less than 30 billion won were selected except for special construction projects.
In this study, a multioutput regression model consisting of 10 input values (construction cost influencing factors) and eight output values (sub construction cost) was designed to predict the construction cost. In predicting construction cost, analysis of the performance of predicting construction cost according to whether the input data is scaled or regulated in learning was considered. Then, six cases were defined to analyze their construction cost prediction performance.
In the case of construction costs, the deviation of results may increase depending on various environments and conditions, so if these data are learned as is, machine learning performance may decrease, and prediction errors may increase. To compensate for this, this research aimed to reduce data deviation by applying scaling to input/output data, and to ensure stability in the learning process and improve prediction performance through a regularization technique as shown in Table 1. In this study, six cases were defined to analyze the method of improving learning performance of factors influencing construction costs with large data deviation. Case 1 used the original data as is, Case 2 applied scaling only to input data, Case 3 applied min-max scaling to both data, Case 4 applied Z-score scaling to both data, Case 5 applied L1 regulation to the learning process, and Case 6 applied L2 regulation.

Table 1.
Model Configuration of Six Cases.
To analyze the difference in learning performance of six cases, an ANN basic model that can be applied equally to these cases was defined, as shown in Figure 3. The basic model consisted of an input layer, an output layer, and two hidden layers, which consisted of 100 and 64 nodes, respectively.
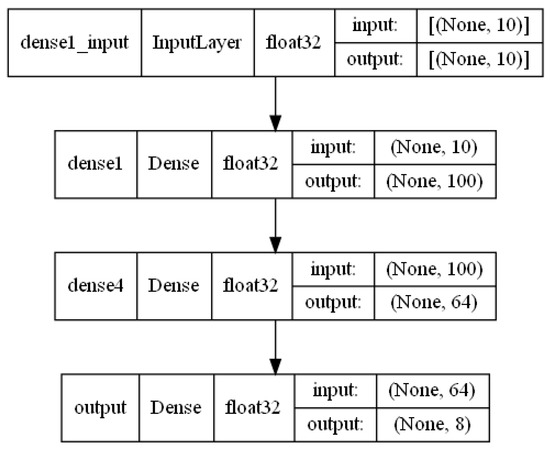
Figure 3.
ANN model for six cases.
In the six cases, the same ANN model was used, except for the composition of scaling and regularization for the stability of predictions. The model consisted of an input layer, an output layer, and two hidden layers. The hidden layers were composed of 100 and 64 nodes, respectively, in consideration of the number of input and output data.
3.3. Influence Factors of ANN for Construction Cost Estimation
To construct a prediction model for cost estimation, independent variables must be determined. Research cases typically use variables such as usage area of the building, average period, average inter-floor height, building height, number of floors, roof area, bathroom area, ground slab, open space, types of roofs, and types of floor structure [17]. In a study of 129 sports field construction projects, the total construction cost, sports field operation area, facility location, sports function number, sports field floor type, quality standard, sports field total area, fence length, and green area were used as factors influencing construction cost [18]. Günaydnn [15] used the total area of the building, the ratio of the reference floor area to the total area, the number of floors, the direction of the building, the foundation system of the building, the floor type of the building, the core location of the building, and the construction cost per unit area as input variables.
Various construction cost prediction studies define factors influencing construction costs. The factors influencing construction costs used in these studies are as shown in Table 2. Since these influencing factors can vary widely depending on the type and characteristics of buildings, construction characteristics, and conditions, it is necessary to define them individually according to the case where predicting the influencing factors for the construction project is required.
Table 2.
Influence factors of building cost estimation in research cases.
As can be seen from the above research cases, the factors influencing construction costs are greatly influenced by the environment, characteristics, and use of the project to be predicted, so it is not possible to define all-around factors for predicting construction costs. For the practicality of machine learning and prediction for construction cost prediction, the influencing factors for construction cost prediction should be intuitive and easily defined. Considering these points, this study attempted to define the most general characteristics of the project as influencing factors that can be easily identified in the construction outline.
In this study, 10 basic influencing factors affecting the construction cost of a building were selected, which were determined by review of existing research cases related to the prediction of construction costs. The factors affecting the construction cost selected in this way are shown in Table 3.
Table 3.
Factors influencing construction costs selected.
3.4. K-Fold Cross Validation
When executing machine learning for ANN models, the data are generally divided into training sets and test sets, the model is trained with a training set, and the model is tested with a test set. However, if the process of verifying and modifying performance with only a fixed test set is repeated, the model can one that works well only with the test set. That is, the test set may be overfitted. cross-validation can be used to solve this problem.
In cross validation, data are not divided into training, test, and validation, but the entire data are divided into a training set and a validation set to be verified and corrected. Using this method, data bias can be prevented, and accuracy can be improved with less data. However, a long time is required to train and evaluate due to the large number of repetitions.
In K-fold cross-validation, the entire dataset is divided into several subsets and the evaluation is performed alternately, which can be performed by changing the test set without duplication. Equation (3) shows how to measure accuracy in K-Fold cross validation. K-fold divides the data into n groups and uses one of them as a test set and the rest as a training set, which is repeated n times to perform machine learning. Total accuracy is calculated as the average of the accuracy calculated for each learning cycle.
In this study, a K-Fold model consisting of five folders was used, and the basic K-Fold was repeated three times using repeated K-Fold to increase the number of lessons.
3.5. Scaling and Regularization
A machine learning model learns through feature data and the output data to be predicted. In this case, if the deviation of the data used in the model increases, the data learning process is not constant, and thus the accuracy of the output value may decrease. The problem of increasing the deviation of the data may be improved by scaling of the learning data. Scaling is a method of making data used in machine learning models uniform, typically with methods such as minimum-max normalization and Z-score.
In this study, there was a very large deviation in input/output data used to predict construction costs, and construction cost prediction is common. For example, the number of floors in a building has a value of about 10, but the output data has a value of up to 30,000,000 won. Deviations inside these data are also very large, so when machine learning is performed on these data, the learning process or results can be very unstable. To solve this problem, by performing the scaling preprocessing on input/output data, the data deviation can be reduced as much as possible and stable machine learning can be performed.
Min-Max Normalization is a method of adjusting input data to a value between 0 and 1 according to the ratio based on the smallest and largest values of all data used in the model; the value x is scaled as in Equation (4). The input data modified by min-max normalization has a value between 0 and 1, thereby reducing the input deviation of the input data and improving the learning performance.
In Z-score normalization, the value x can be converted to a Z-score using Equation (5). It can be seen that some data converts to a standard normal distribution (Gaussian distribution). If the data x is equal to the average value, it is scaled to 0, but if it is less than the average value, it is negative, and if it is greater than the average, it is positive. At this time, the size of the negative and positive numbers calculated is determined by the standard deviation of the data. As the standard deviation of the input data increases, the scaled value approaches zero. Z-score and min-max normalization are the same in that they improve learning performance by reducing the deviation of input data, but there is a difference in the distribution of the converted values of input data, which can lead to a difference in learning performance.
where x represents the original data, μ represents the mean value, and σ represents the standard deviation.
When performing machine learning on a particular dataset, poor predictive performance for general data, which is only suitable for learning data, is called overfitting. Conversely, underfitting is a case in which even a given dataset is not properly learned. Although a model with good performance is important, a model that is overfitted may have poor versatility. Regularization is a technique that partially modifies the learning algorithm so that the model becomes more generalized.
Even if scaling of input/output data is performed through preprocessing for predictive stability of construction costs, there might be a problem that predictive performance could be degraded due to deviation in the machine learning process. In particular, if it is difficult to sufficiently secure construction cost data and the risk of overfitting is expected, a normalization process is necessary to solve this problem. In addition, L1 and L2 Regularization can be used depending on whether they are overfitted by outliers. L1 and L2 are the most common types of regularization. They are calculated by adding the regularization value to the general cost function. Cost function decreases the weight value due to the addition of the regularization term. At this time, due to the decrease in the weight value, the neural network becomes a simpler model, which also reduces the overfitting.
L2 normalization is also called weight decay because it forces the weight to collapse to zero. In L1 normalization, a penalty of an absolute value of the weight is applied, and unlike L2, the weight may be reduced to 0. Therefore, it is very useful when compressing the model, otherwise L2 is used. L1 and L2 are calculated as in Equation (6) and (7).
L2 loss is more influenced by the outlier because it intuitively adds the square of error. It is recommended to use L1 loss if the outlier is ignored, and L2 loss if the outlier is involved.
4. Cost Prediction Performance Analysis
4.1. Correlation of Features
In the study, the correlation between 10 selected features was analyzed to confirm their mutual independence. The influencing factors used to predict construction costs should not overlap with each other.
Figure 4 shows a heatmap of the correlation between each influencing factor. When the correlation is close to 1, the correlation is high, and when it is close to 0, the correlation is low. As shown in the figure, the 10 selected influencing factors show values close to 0, showing that these influencing factors have high independence.
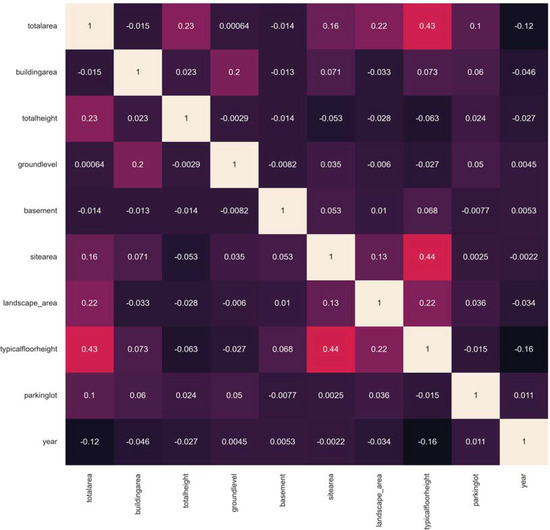
Figure 4.
Correlation of Features.
Along with data correlation analysis, feature importance for the final construction cost was analyzed using Random Forest analysis. The results of feature importance analysis are as shown in Figure 5.
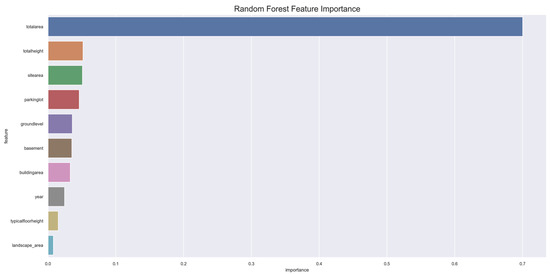
Figure 5.
Feature Importance.
As shown in Figure 5, the total area is the most important feature, followed by the total height, site area, parking lot, ground floor, underground, and building area. Since initial construction costs are generally predicted based on the total area, the total area is the factor that has the greatest influence on the construction cost. Factors other than the total area can be seen as factors that can predict detailed fluctuations in construction costs that can be predicted by the total area. Factors related to the vertical direction of a building are factors that can change the construction cost even in the same area, and as shown in the figure. The factor in the vertical direction is the second most important construction cost influencing factor.
4.2. Accuracy by R-Squared Analysis
The coefficient of determination is calculated as the square of the correlation coefficient. Unlike the correlation coefficient, the coefficient of determination is a value expressed by quantifying the degree of influence between variables or the degree of causal relationship. The coefficient of determination is a number used in regression analysis, not correlation analysis, and is an evaluation index showing the performance of the regression model.
R-square is generally denoted by . It is an indicator of how well the independent variable explains the dependent variable in a regression model. The higher the coefficient of determination, the better the independent variable explains the dependent variable, and its increases as the number of independent variables increases. Therefore, it may be inappropriate to evaluate the regression model by relying only on the coefficient of determination. Adjusted R-squared is sometimes used to compensate for this. The R-squared, score has a range between 0 and 1, and the closer it is to 1, the higher the regression model is associated with the data. The score can be calculated as in Equation (8).
Here, SST represents the sum of total squares, and SSE represents the sum of regression squares, which is the difference between the average of the estimated and observed values of the regression equation, and SSR represents the sum of whole squares. These SST, SSE, and SSR can be calculated as in Equations (9)–(11).
Here, is the observed value, is the average of the observed value, and is the predicted value from regression.
4.3. Predictive Performance of Cases
Case 1 is the result of machine learning using the collected construction cost data as it is. As expected, it can be seen that the data deviations were severe, making the machine learning process very unstable, and the result also had very poor accuracy.
The construction cost was predicted in two ways: Total Cost and Sum Cost, which combines the predictions of seven sub-construction costs. The error rate was analyzed compared to the Actual Total Cost. The average value of the R-square score of Case 1 was negative, which means that the Case 1 model cannot be used to predict construction costs. Figure 6 shows the machine learning process of Case 1, which shows that the machine learning executed was very unstable.
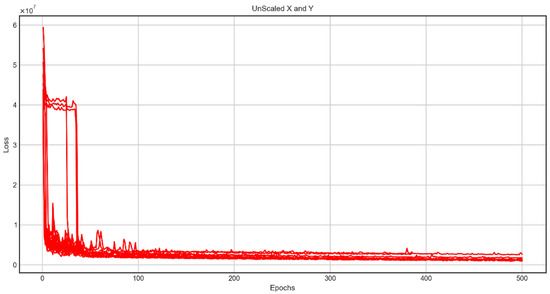
Figure 6.
Loss of unscaled features (Case 1).
In case 2, scaling was applied only to the input data, and the output data was used as it was. Even if scaling was applied only to input data in this way, it was found that machine learning performance was greatly improved compared to case 1.
The R2 scores for the prediction results of Sum Cost, which were predicted by summing the sub-construction costs, and Total Cost, which directly predicted the total construction cost, were 0.80 and 0.65, respectively. The process of changed loss value in the machine learning process of case 2 is shown in Figure 7.
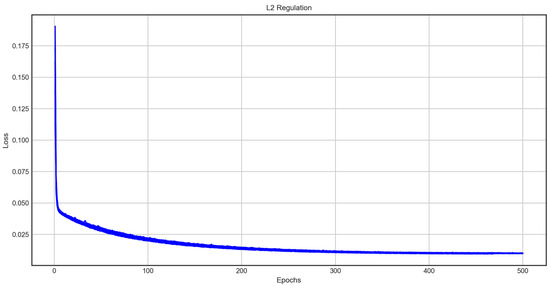
Figure 7.
L2 Regulation Result (Case 2).
In Case 3 and Case 4, input and output data wee preprocessed using Min-Max scaling and Z-Score, respectively. Figure 8 shows each machine learning process. As can be seen from the results of Case 3 and Case 4, it was found that Min-Max Scaling performed machine learning much more stably and the machine learning time was fast.
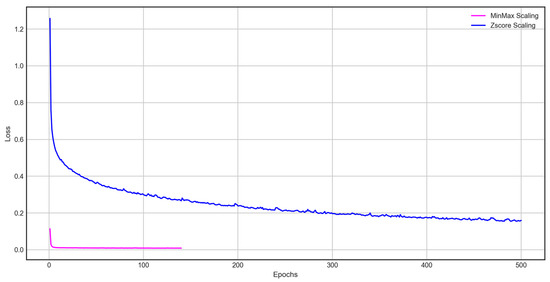
Figure 8.
MinMax and Z-Score scaling (Case 3 and 4).
In Case 5 and Case 6, L1 and L2 normalization were used in the learning process to avoid overfitting. Figure 9 shows the two machine learning processes. In both cases, it can be seen that the machine learning process was very stable, but Case 6 with L2 regularization was much faster and more stable.
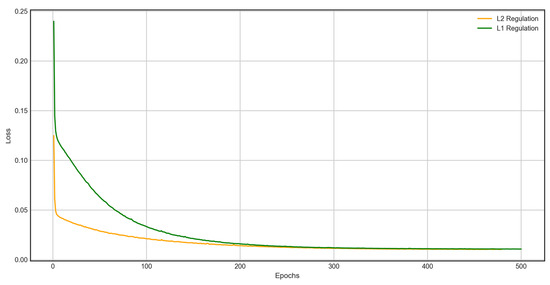
Figure 9.
L1, L2 Regulation (Case 5 and 6).
4.4. Prediction Performance of Cases
The R-squared values for each case were measured to analyze the predictive performance of six cases. The R-squared values for each case are as shown in Table 4. As a result of comparing the case of predicting the total cost with the case of predicting the sub-construction cost using multioutput regression and predicting the total construction cost, the overall prediction performance of the total cost was excellent, with an error within 5%. The result of applying Min-Max scaling showed better prediction performance than the result of applying Z-Score scaling, and in the case of regularization, the result of applying L2 Regularization was better than that of applying L1.
Table 4.
R2 average of Cost Sum and Total Cost.
In Table 5, the R-square of each case can be compared in more detail. As illustrated in Table 4, when both scaling and normalization are applied, the R-square value became higher, the standard deviation decreased, and thus the prediction error range decreased.
Table 5.
Mean and Standard deviation of R-square.
4.5. Cost Prediction Test
Previously, the predictive performance of construction costs for six cases was compared using K-fold. Two final models were determined by combining models that have shown relatively good performance in previous case analyses. Min-Max and Z-Score scaling were applied, respectively, and L2 regularization was applied equally. Then, construction cost prediction models were generated through the Train-Test-Validation process for these models, and their construction cost prediction performance was analyzed.This time, 500 out of the total 608 data were defined as training data and 108 data were defined as validation data, 15% of the training data was set as test data, and Epoch was set to 1000 to ensure enough machine learning. Min-Max scaling and L2 regularization were applied to Case 1, and Z-Score scaling and L2 regularization were applied to Case 2. The machine learning results of the two cases set in this way are shown in Figure 10.
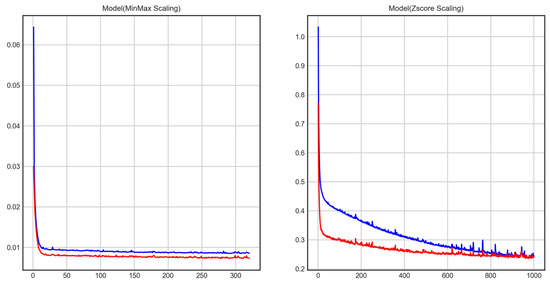
Figure 10.
Feature scaling of Min-max and Z-score.
For validation data, the result of comparing the difference between the Actual Cost, Total Cost, and the sum of the sub-construction costs is shown in Figure 11.
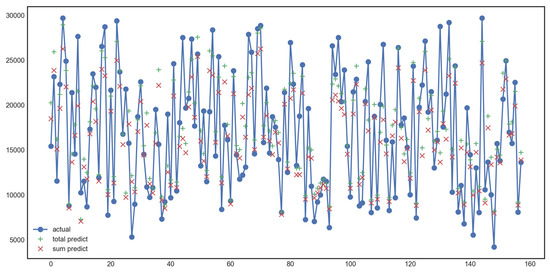
Figure 11.
Cost prediction from total cost and cost sum.
As shown in Table 6, in the case of predicting the construction cost by the total cost or sum of the sub-construction costs, an error of 10% to 20% occurs, but these errors can be reduced by securing sufficient data and optimizing the parameters.
Table 6.
R-square score of cases.
The accuracy of cost estimation can be defined as the difference value between the actual cost and the estimated cost, and the error rate can be calculated as in Equation (12) [27,28].
General construction cost accuracy was evaluated with the above error rate rather than R squared score, and the result value of the case evaluated with the error rate is as shown in Table 7. Error rate tends to be measured with higher accuracy than R squared. In the case of Z-Score scaling, it can be found that the prediction of lower costs is more accurate than the total cost prediction.
Table 7.
Error Rate of cost estimation.
Table 8 shows the results of calculating the predicted error rate of the sub-construction cost using multioutput as R-square. The accuracy of the construction cost, which accounts for the largest proportion, is the highest, and the error rate of the landscaping and civil engineering construction costs is relatively high. Since these construction projects may have a slightly lower correlation with the characteristics of the building, such as the area of the building, it is expected that the error rate can be reduced by adjusting and applying the influencing factors.
Table 8.
R-Square of sub cost prediction.
5. Discussion
Previously, there have been many cases of predicting construction costs based on general influencing factors using machine learning. However, the total construction cost consists of sub-cost, and sub-cost is often required along with the total construction cost. Using ANN, it becomes possible to predict the values of several variables at once through multioutput regression.
In this study, after predicting sub-construction costs using multioutput regression, the method of predicting construction costs and the predictive performance were analyzed through the sum thereof. In case analyses, the deviation of input and output data was minimized through Min-Max and Z-Score scaling to improve the predictive performance of construction costs, and the L1 and L2 regularization methods were applied to prevent overfitting in the machine learning process. To analyze their performance, six test cases were defined by combining them with each other, and their performance was compared and analyzed. In Case 1, in which scaling was not applied, the R-square value was negative, making it difficult to use it to predict construction cost. Case 3 with Min-Max scaling showed better performance than Case 4 with Z-Score scaling. In the prediction of the Total Cost, the R-square value for using L1 regularization was 0.81, and the R-square value for using L2 regularization was 0.82, indicating that the performance of L2 regularization was slightly better. In the case of total cost prediction and construction cost prediction by the sum of the sub-construction costs, the R-square values in Case 6 were 0.82 and 0.75, respectively, indicating that the prediction performance of the total cost was slightly better.
In the case of construction costs, there was a problem that many data could not be secured due to limitations in data collection. If data can be continuously secured in the future, it is expected that further improvement in construction cost prediction will be possible through multioutput registration. In addition, when using a method such as Ensemble, which uses a combination of various prediction models, the prediction performance of construction costs can be improved.
6. Conclusions
Construction cost prediction is a very important function in construction projects. However, it is still not easy to accurately predict construction costs. This is because construction costs are affected by a wide variety of influencing factors, and it is difficult to accurately predict construction costs by considering all of them. In addition to objective influencing factors, construction costs are also affected by the subjective judgment of the promoter. Traditionally, construction costs have been predicted based on unit construction costs, and regression analysis was used through factors affecting the construction cost.
Recently, with the development of machine learning technology, various methods for predicting construction costs through ANN methods have been developed. Since the method of predicting construction costs may vary depending on various factors such as the use, purpose, and country of the facility, various construction cost prediction models are needed. In addition, depending on the type and number of data collected, the settings and hyperparameters of the ANN model may be vary, and the prediction accuracy may be different accordingly. Construction cost may consist of several sub-factors, and it may be necessary to predict these sub-construction costs from the initial stage. In particular, when a contract is not made as a single construction, but is ordered separately into several sub-construction types, it is necessary to predict such sub-construction costs.
In this study, a method of predicting the sub construction cost constituting the total construction cost using a multioutput ANN model was proposed, and a more accurate method of predicting the multi-output construction cost was proposed by analyzing the prediction performance of multi-output machine learning according to scaling and regularization. This method can predict various elements of construction cost at once, enabling prediction of construction cost for various purposes, and it is expected that models for various purposes based on research results can be developed and applied.
Funding
This work was supported by the Korea Agency for Infrastructure Technology Advancement (KAIA) grant funded by the Ministry of Land, Infrastructure and Transport (Grant 22AATD-C163269-02).
Institutional Review Board Statement
Not applicable.
Informed Consent Statement
Not applicable.
Data Availability Statement
Not applicable.
Conflicts of Interest
The authors declare that there were no known competing financial interest or personal relationships that could have influenced the work reported in this study.
References
- Fachrurrazi; Saiful, H.; Mubarak, T. Neural network for the standard unit price of the building area. Sustain. Civ. Eng. Struct. Constr. Mater. 2016, 171, 282–293. [Google Scholar]
- Garza, J.; Rouhana, K. Neural network versus based application. Cost Eng. 1995, 37, 14–18. [Google Scholar]
- Bode, J. Neural networks for cost estimating: Simulation and pilot application. Int. J. Prod. 2000, 38, 123–154. [Google Scholar] [CrossRef]
- Park, W.Y.; Cha, J.H.; Kang, K.I. A Neural Network Cost Model Apartment Housing Projects in the Initial Stage. J. Archit. Inst. Korea 2002, 18, 155–162. [Google Scholar]
- Kim, G.H.; An, S.H.; Cho, H.K. Comparison of the Accuracy between Cost Prediction Models based on Neural Network and Genetic Algorithm/Focused on Apartment Housing Project Cost. J. Archit. Inst. Korea 2006, 23, 111–118. [Google Scholar]
- Lee, J.G.; Lee, H.S.; Park, M.; Seo, J.O. Early-stage cost estimation model for power generation project with limited historical data, Engineering. Constr. Archit. Manag. 2021, 29, 2599–2614. [Google Scholar] [CrossRef]
- Pham, T.Q.D.; Le-Hong, T.; Tran, X.V. Efficient estimation and optimization of building costs using machine learning. Int. J. Constr. Manag. 2021, 21, 1–13. [Google Scholar] [CrossRef]
- Yuanyuan, T.; Libiao, B. Modeling for project portfolio benefit prediction via a GA-BP neural network. Technol. Forecast. Soc. Chang. 2022, 183, 121939. [Google Scholar]
- Kim, S.; Choi, C.Y.; Shahandashti, M.; Ryu, K.R. Improving Accuracy in Predicting City-Level Construction Cost Indices by Combining Linear ARIMA and Nonlinear ANNs. J. Manag. Eng. 2022, 38. [Google Scholar] [CrossRef]
- Matel, E.; Vahdatikhaki, F.; Hosseinyalamdary, S.; Evers, T.; Voordijk, H. An Artificial Neural Network approach for cost estimation of engineering services. Int. J. Constr. Manag. 2019, 22, 1274–1287. [Google Scholar] [CrossRef]
- Polat, G. ANN approach to determine cost contingency in international construction project. J. Appl. Manag. Investig. 2012, 1, 195–201. [Google Scholar]
- Wilmot, C.G.; Mei, B. Neural network modeling of highway construction costs. J. Constr. Eng. Manag. 2005, 131, 765–771. [Google Scholar] [CrossRef]
- Alqahtani, A.; Whyte, A. Artificial neural networks incorporating cost significant items towards enhancing estimation for (life-cycle) costing of construction projects. Australas J. Constr. Econ. Build. 2013, 313, 51–64. [Google Scholar] [CrossRef]
- Elsawy, I.; Hosny, H.; Razek, M.A. A neural network model for construction projects site overhead cost estimating in Egypt. Int. J. Comput. Sci. Issues 2011, 8, 273–283. [Google Scholar]
- Günaydin, H.M.; Dogan, S.Z. A neural network approach for early cost estimation of structural systems of buildings. Int. J. Proj. Manag. 2022, 22, 595–602. [Google Scholar] [CrossRef]
- Squeira, I. Neural Network-Based Cost Estimating. Master’s Thesis, Department of Building, Civil and Environmental Engineering, Concordia University, Montreal, QC, Canada, 1999. [Google Scholar]
- Sitthikorn, S.; Damrongsak, R.; Chinnapat, B.; Eakasit, P. Construction Cost Estimation for Government Building Using Artificial Neural Network Technique. Int. Trans. J. Eng. Manag. Appl. Sci. Technol. 2021, 12, 1–12. [Google Scholar]
- Michal, J.; Agnieszka, L.; Krzysztof, Z. ANN Based Approach for Estimation of Construction Costs of Sports Fields. Hindawi Complex. 2018, 2018, 7952434. [Google Scholar]
- Chandanshive, V.; Kambekar, A.R. Estimation of building construction cost using artificial neural networks. J. Soft Comput. Civ. Eng. 2019, 3, 91–107. [Google Scholar]
- Jiang, Q. Estimation of construction project building cost by back-propagation neural network. J. Eng. Des. Technol. 2019, 18, 601–609. [Google Scholar] [CrossRef]
- El-Sawalhi, N.I.; Shehatto, O. A neural network model for building construction projects cost estimating. KICEM J. Const. Eng. Proj. Manag. 2014, 4, 9–16. [Google Scholar] [CrossRef]
- Roxas, C.L.C.; Ongpeng, J.M.C. An artificial neural network approach to structural cost estimation of building projects in the Philippines. DLSU Res. Congr. 2014, 2, 1–8. [Google Scholar]
- Bala, K.; Ahmad, B.; Shehu, W.B. A computer-based cost prediction model for institutional building projects in Nigeria: An artificial neural network approach. J. Eng. Des. Technol. 2014, 12, 519–530. [Google Scholar] [CrossRef]
- Feng, G.L.; Li, L. Application of genetic algorithm and neural network in construction cost estimate. Adv. Mater. Res. 2013, 756, 3194–3198. [Google Scholar] [CrossRef]
- Arafa, M.; Alqedra, M. Early stage cost estimation of buildings construction projects using artificial neural networks. J. Artif. Intell. 2011, 4, 63–75. [Google Scholar] [CrossRef]
- Kim, G.H.; An, S.H.; Kang, K.I. Comparison of construction cost estimating models based on regression analysis, neural networks, and case-based reasoning. Build. Environ. 2004, 39, 1235–1242. [Google Scholar] [CrossRef]
- An, S.H.; Cho, H.H.; Lee, U.K. Reliability assessment of conceptual cost estimates for building construction projects. Int. J. Civ. Eng. 2011, 9, 9–16. [Google Scholar]
- Serpell, A.F. Towards a knowledge-based assessment of conceptual cost estimates. Build. Res. Inf. 2004, 32, 157–164. [Google Scholar] [CrossRef]


Publisher’s Note: MDPI stays neutral with regard to jurisdictional claims in published maps and institutional affiliations. |
© 2022 by the author. Licensee MDPI, Basel, Switzerland. This article is an open access article distributed under the terms and conditions of the Creative Commons Attribution (CC BY) license (https://creativecommons.org/licenses/by/4.0/).