Article

The Accumulation Characteristics of Different Heavy Metals in Sea Rice

1
Key Laboratory of Agro-Environment in the Tropics, College of Natural Resources and Environment, South China Agricultural University, Ministry of Agriculture of China, Guangzhou 510642, China
2
Guangdong Provincial Key Laboratory of Eco-Circular Agriculture, Guangdong Engineering Research Center for Modern Eco-Agriculture and Circular Agriculture, Guangzhou 510642, China
3
Guangdong Laboratory for Lingnan Modern Agriculture, Guangzhou 510642, China
*
Authors to whom correspondence should be addressed.
Appl. Sci. 2022, 12(19), 9718; https://doi.org/10.3390/app12199718
Submission received: 23 August 2022 / Revised: 21 September 2022 / Accepted: 23 September 2022 / Published: 27 September 2022
(This article belongs to the Special Issue Ecology Impact of Heavy Metals)

Abstract

:
Here heavy metal (Cd, Zn, and Cu) accumulation features of sea rice (a salt-tolerant rice cultivar) were explored to provide a reference for preventing and controlling of heavy metals, screen new plant remediation resources, and offer the basis for safe sea rice production. The sea rice variety Hai Hong 12 (HH12) was used as the research object in the soil culture experiments conducted to investigate the effects of the addition of Cd (0, 1, 2, 4, 8 mg/kg), Zn (0, 100, 200, 300, 400 mg/kg), and Cu (0, 100, 200, 300, 400 mg/kg) on the growth and accumulation of heavy metals in different HH12 parts. At different Cd and Zn concentrations, the root biomass of HH12 decreased significantly and the shoot biomass showed no marked difference; however, Cu stress inhibited the rice biomass. The Cd content in different parts of sea rice increased with an increase in Cd levels. At 8 mg/kg, shoot and spike had the highest Cd content, which was 89.02 and 45.37 mg/kg, respectively. At 1 mg/kg Cd concentration, the Cd transport coefficient of sea rice was the highest (1.36). The Zn content was the highest in sea rice at 400 mg/kg Zn. Zn concentrations in the shoot and spike were 440.95 and 175.51 mg/kg. However, the Zn transport coefficients of all parts were <1 at different Zn concentrations. Sea rice growth was severely hampered by high Cu stress (400 mg/kg). After 200 mg/kg Cu treatment, the highest Cu content was 82.85 mg/kg in shoot and 46.97 mg/kg in spike. The Cu transport coefficients of all parts were also <1 under Cu stress and decreased with an increase in the Cu concentration. In summary, HH12 exhibited a high risk of Cd accumulation, and Cd was more likely to be transported to the grains. Zn accumulation in sea rice had no obvious toxicity to its shoot growth, but its shoot had a slight risk of Zn accumulation. Cu was mostly built up in the HH12 roots, but its ability to move around was low. However, high Cu concentrations slowed the growth of sea rice.

1. Introduction

In China, grain production has recently begun to change from “quantity growth” to “nutrition security” [1], with more attention being focused on the development of high-quality grain, green and healthy products, and the ecological environment of the cultivated land. Rice, which is among the main crops, occupies a large proportion of the agricultural industrial structure of China. However, most rice-cultivating farmland in China is distributed in the basin and plain area, which is easily restricted by non-biological factors such as climate and soil and thus hinders food security. Sea rice is a type of wild rice variety with salt and alkali tolerance; it is therefore also known as salt- and alkali-tolerant rice [2]. Sea rice exhibits excellent resistance to stresses, such as salt alkali and lodging, and a stronger growth ability than ordinary rice. Thus, it can normally grow in saline-alkali farmland with some salinity. Sea rice can be used as a food crop to solve the food shortage problem and as a restorative plant to improve saline-alkali land, and therefore, it has great economic and social value [3].
The saline-alkali land area in China is currently as large as 90 million hm². It is mainly distributed in arid areas such as North China and Northwest China, as well as in coastal new areas, where <20% of saline-alkali land is cultivated [4]. Salinization can directly harm crops, destroy the soil physiochemical properties, reduce soil productivity, and severely affect the sustainable development of agriculture, economy, and society. So far, some cases of saline soil improvement technology are successful, however, additional studies should be conducted to investigate improvement and utilization due to different natural and human factors. Saline soil remediation technologies include physical measures, such as water conservancy technology and agricultural cultivation technology, chemical measures, and biological measures [5]. Among them, harnessing saline-alkali land with sea rice is also a recent research hotspot. For example, some studies have documented that cultivating rice is also an efficient method of improving saline-alkali soils, as rice plants can increase the soil nutrient content and diversify soil microorganisms [6]. Xu et al. found that rice can be feasibly used to repair saline-alkali soil [7].
However, many salinization areas are affected not only by salinization but also by heavy metal pollution. This severely endangers the plant growth and development and the stability of the local ecosystem and aggravates the food security problem. In recent years, one of the primary reasons for heavy metal pollution is the irrational application of organic fertilizers to soil [8]. Continuous application of organic fertilizers such as livestock manure and municipal sludge in farmland increased the accumulation of heavy metals such as Cu and Zn in soil [9]. Moreover, human activities in coastal areas become more common, when a marine development strategy is implemented, thereby making the potential environmental problems of coastal beaches more prominent. Cao et al. [10] found that, compared with the geochemical background value in the 1980s, tidal flat reclamation in Jiangsu Province has led to mild-to-moderate metal pollution risks due to human activities; the pollution was mainly attributable to Cd, As, and Ni. Li et al. [11] found that Cr, Cu, Pb, and Zn concentrations in the mangrove wetland of Shenzhen Bay were mostly higher than their respective background values, particularly Cd. Cd was the major heavy metal pollutant in surface sediments. This heavy metal pollution was mainly due to human activities such as ship pollution and aquaculture activities.
To improve different saline-alkali soil types, comprehensive treatment must be adopted according to local conditions. In particular, saline land polluted by various heavy metals should be continuously enhanced and developed through ecological methods such as “water and salt control” and “production while repairing.” Therefore, suitable plants that can grow on saline-alkali soil and repair heavy metal pollution must be selected. Salt tolerance and heavy metal detoxification mechanisms of sea rice have some common characteristics [12,13,14,15], which are mainly reflected through the following aspects: (1) The root osmotic potential of sea rice is low under salt stress, which promotes rice to synthesize numerous organic solutes, such as proline, betaine, and soluble sugar. These organic solvents bind more water by binding with protein and can also form complex stable chelates with heavy metals to reduce heavy metal effectiveness in plants, which is a heavy metal detoxification mechanism in plants. (2) Endogenous hormones also play a vital regulatory role during salt stress. For example, the increased abscisic acid content can regulate sodium ion absorption and transportation; and the closure of stomata can reduce water loss in plants. In plants, these plant hormones also directly or indirectly promote the operation of the antioxidant system and reduce the oxidative toxicity of heavy metals to plants. (3) Activities of superoxide dismutase (SOD), peroxidase (POD), and other antioxidant enzymes in sea rice were positively correlated with the degree of salt stress, thereby reducing the damage caused by numerous reactive oxygen species. The antioxidant system composed of these antioxidant enzymes is also a type of heavy metal detoxification mechanism in plants. Therefore, the ability of sea rice to adsorb heavy metals may be stronger than that of ordinary rice. The application of this characteristic can provide a new theoretical basis and ideas for “production while repairing” in saline-alkali areas with heavy metal pollution. The sea rice industry will concentrate not only on its economic benefits but also on its good ecological benefits.
In addition, the uptake and transport of heavy metals by rice are often through the channels of iron, manganese, phosphorus, and other essential elements into the plant roots and then gradually to the grain [16,17,18,19]. Because of the long-term evolution of sea rice that lea to its adaption to a saline-alkali environment, the expression of physiological transport channels and regulatory genes may be different from that in common rice. It is of theoretical significance and application potential to explore the mechanisms of sea rice on heavy metals. Therefore, this study analyzed the growth and heavy metal absorption of sea rice under different Cd, Zn, and Cu concentrations, providing a reference for preventing and controlling heavy metal pollution screening for phytoremediation resources and offering the basis for safe sea rice production.

2. Materials and Methods

2.1. Plant Materials

The experiment was conducted at South China Agricultural University in April 2019. The experimental material was the sea rice variety [named Hai Hong Xiangmi; Hai Hong 12 (HH12)] and was provided by the salt-tolerant rice research team of Guangdong Ocean University. This variety exhibited salt tolerance, was of high quality, and generate a high yield [2].

2.2. Design and Treatments

2.2.1. Seedling Preparation

Approximately 50 full-grain sea rice seeds were selected, soaked with 30% H2O2 solution for 15–20 min, and washed 5-6 times with deionized water. Then the seeds were immersed in a culture dish and placed in a constant temperature box at 28 °C for 12 h. The seeds were set in quartz sand for seedling cultivation. The quartz sand was first moistened with deionized water until the seeds sprouted and then kept moist with 1/4 rice nutrient solution [20]. Uniform and healthy seedlings (height: ~15 cm) with good growth were selected for the experiment.

2.2.2. Soil Preparation with Different Heavy Metal Levels

The Cd concentration was set at five levels: 0 (CK), 1, 2, 4, and 8 mg/kg. The experiment was conducted during soil cultivation. Cd was added to 4 kg paddy soil with CdCl2·5/2H2O in a plastic pot and aged for 1 month. Each process was repeated three times. After 3 weeks of soil cultivation, two sea rice seedlings were planted in each pot. The soil was flooded with water up to approximately 1–2 cm during the whole growth period. During the experiment, fertilization and spraying were performed regularly to prevent diseases and insect pests and to ensure normal plant growth. The organic matter content of the soil was 19.60 g/kg, and the available N, P, and K contents were 0.09, 0.17, and 0.12 g/kg, respectively [21].
The Zn concentration was set at five levels: 0 (CK), 100, 200, 300, and 400 mg/kg. The test method was the same as that mentioned above, and Zn was added to the soil in the form of exogenous ZnCl2.
The Cu concentration was set at five levels: 0 (CK), 100, 200, 300, and 400 mg/kg. The test method was the same as that mentioned above, and Cu was added to the soil in the form of exogenous CuCl2.

2.3. Plant Harvest and Plant Digestion

2.3.1. Biological Yield of Sea Rice at the Mature Stage

In the mature stage, the whole plant was washed with tap water until no soil was left in the root system. After washing the plant twice with deionized water, the roots, shoots, spikes, and grains were separated and packed into envelope bags. After drying these parts in an oven at 80 °C to constant weight, the different parts of each treatment were weighed to determine the dry weight.

2.3.2. Cd, Zn, and Cu Contents in Sea Rice

The dried sea rice sample was crushed and ground. Then, 10 mL nitric acid was added to 0.1000–0.2000 g of the ground sample. Simultaneously, the blank reagent (ultrapure water) and national standard reference plant sample material GBW07410 (GSV-1) were prepared. The sample was digested in a microwave digestion oven (CEM MARS6, USA) and filtered, and the final volume was fixed at 25 mL. Meanwhile, the quality control (CDHK-GBW(E)100349, certified reference material for the chemical composition of rice flour) and blank samples were generated. Finally, Cd, Zn, and Cu contents in the sea rice samples were determined through flame/graphite furnace atomic absorption spectrometry (Z700P, Jena company in Jena, Germany) [22]. The Cd recovery rate of the reference material detected using AAS was 99.03 ± 4.18%. The reagents used in the experiments were of analytical grade.

2.4. Statistical Analysis

The transfer factor (TF) was calculated as follows:
TF = Ctissue1/Ctissue2,
where Ctissue1 and Ctissue2 refer to Cd contents (mg/kg) in the different parts of the rice plant [23].
Excel 2019, SPSS 26.0, and Origin 2022b software were used for statistically analyzing the experimental data. The significance of Hai Hong 12 under different concentrations of heavy metals was analyzed through one-way ANOVA, and the results were examined using SPSS 26.0.

3. Results and Analysis

3.1. Cd Accumulation Characteristics of HH12

3.1.1. Biomass of Different HH12 Parts

The shoot biomass of HH12 decreased with an increase in Cd stress (Figure 1a). The shoot biomass was the highest under the 1 mg/kg treatment, which showed no significant difference from that under the CK, treatment and was significantly higher than that under other Cd concentration treatments (p < 0.05). Compared with the control group, the shoot biomass of HH12 was the highest, increasing by 14.02%. The spike biomass of HH12 at 1 mg/kg Cd was significantly lower than that in the control group. With an increase in the Cd concentration, the spike biomass of HH12 gradually increased, which was significantly higher than that in the control group at 8 mg/kg Cd, which increased by 79.14%.

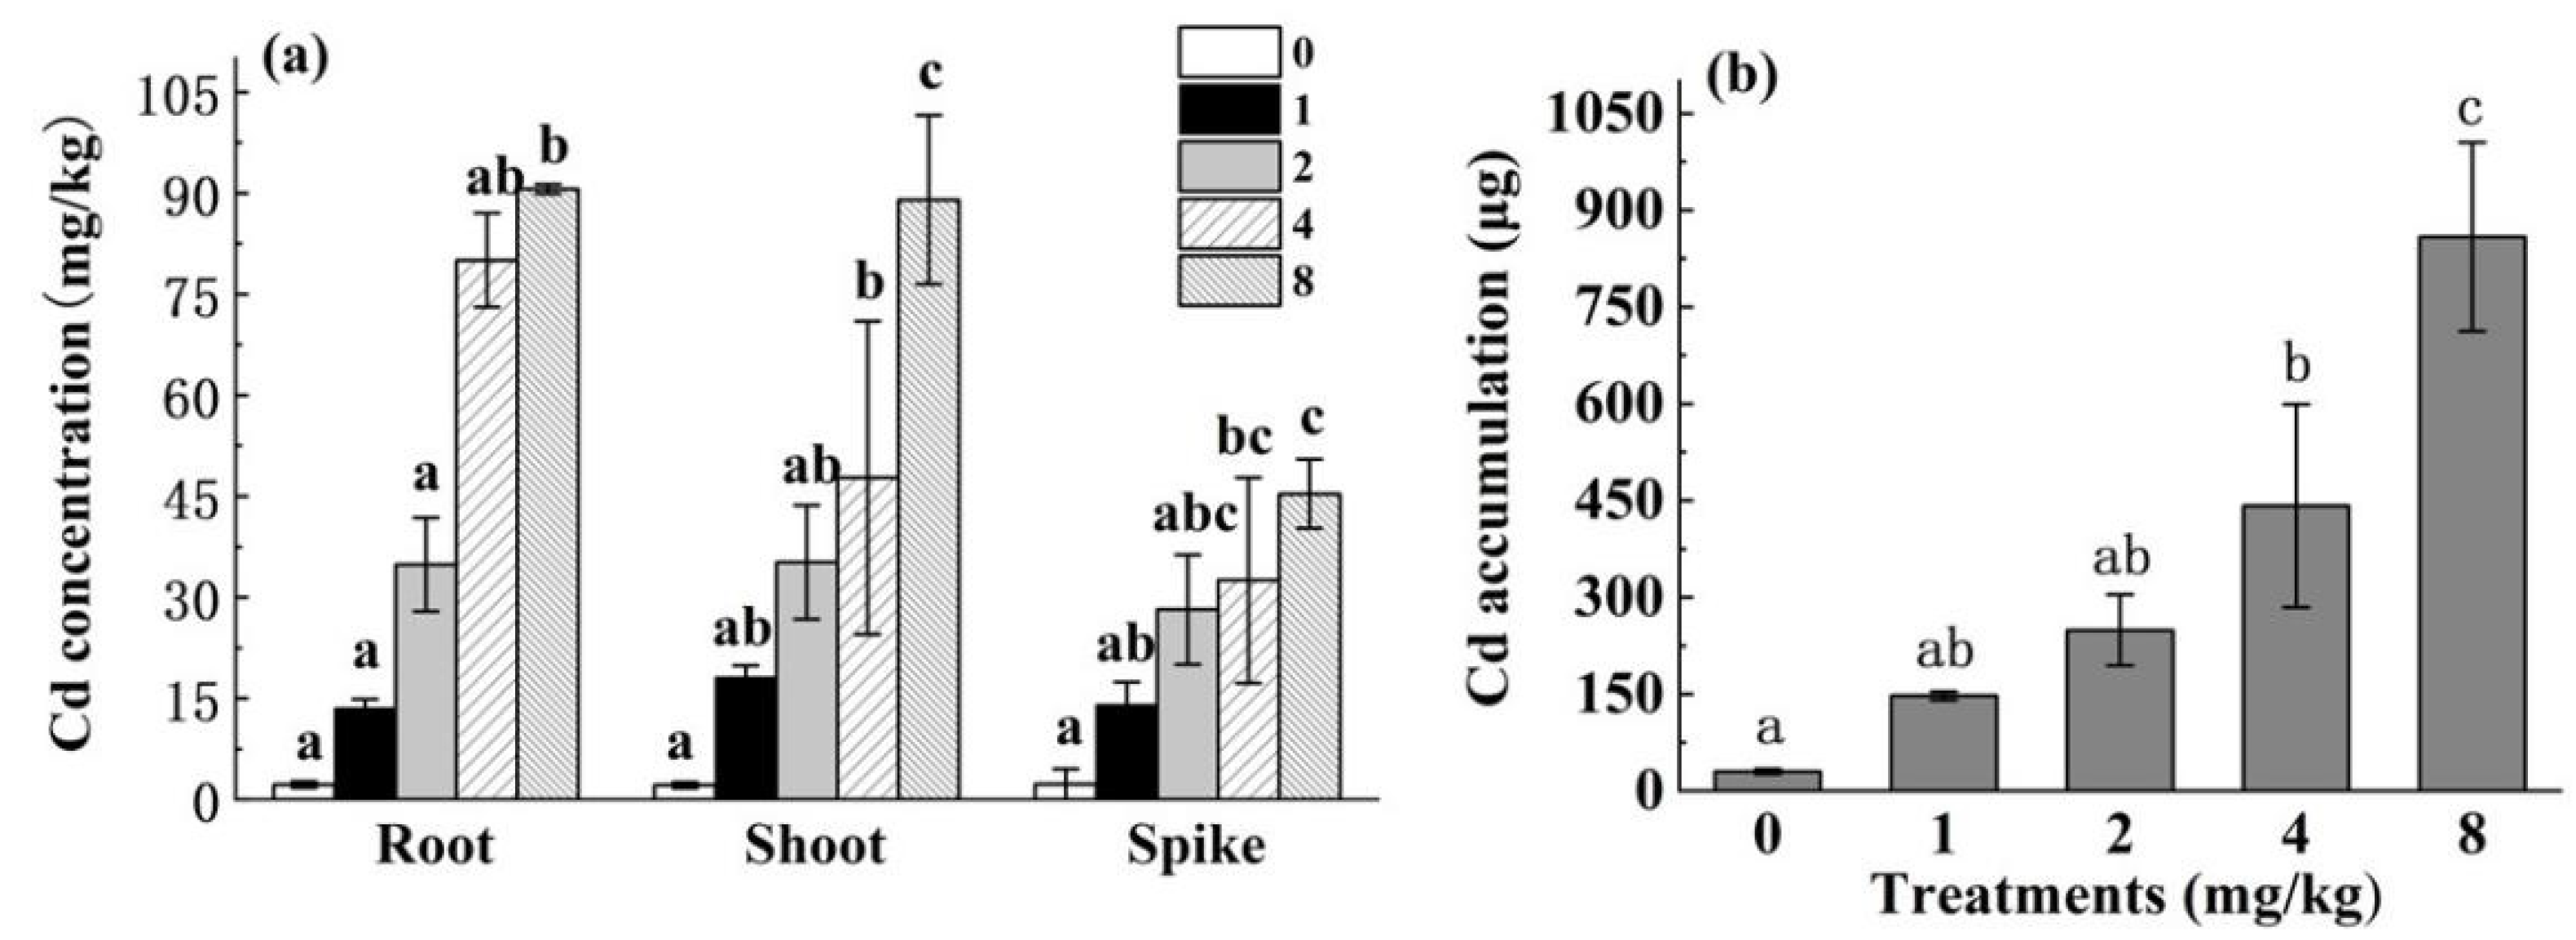
3.1.2. Cd Content and Cd Accumulation in Different HH12 Parts

Figure 2a indicated that the Cd concentrations in all HH12 parts were higher than those in the control group at different Cd levels. With an increase in the soil Cd concentration, the Cd content in the root, shoot, and spike exhibited a significant increasing trend. When the Cd concentration was 8 mg/kg, and the Cd contents in the root, shoot, and spike were 90.61, 89.02, and 45.37 mg/kg, respectively, which increased by 39.63, 40.79, and 19.07% compared with the control group. However, the Cd content in the shoot did not exceed the critical content standard of the Cd hyperaccumulator (100 mg/kg). Figure 2b illustrated that the Cd accumulation of HH12 increased significantly with an increase in the Cd concentration (p < 0.05). At 8 mg/kg Cd, the maximum amount of Cd in the treatment was 858.82 μg, which was 27 times of that in the control group.

3.1.3. Cd Transport Coefficients of Different HH12 Parts

Table 1 indicates that the transport coefficient of the shoot to Cd of sea rice was >1, and that of the shoot of HH12 was as high as 1.361 at a Cd concentration of 1 mg/kg. With an increase in treatment concentration, the transport coefficient showed a downward trend. Compared with the blank control group, the transport coefficients of the spike of HH12 were smaller and <1 at different Cd concentrations. At the Cd concentration of 8 mg/kg, the transport coefficient was only 0.519. No significant difference was observed in the transfer coefficient of HH12 at different Cd concentrations (p > 0.05).

3.2. Cu Accumulation Characteristics of HH12

3.2.1. Biomass of Different HH12 Parts

Figure 1b indicated that the shoot biomass of HH12 was the highest at 100 mg/kg Cu, which was not significantly different from that in the control group, but significantly higher than that at the other concentrations (p < 0.05). When the Cu concentration was 200 mg/kg, the shoot biomass of HH12 was the smallest, which decreased by 62.1% compared with that in the blank control group. As the Cu concentration increased, the shoot biomass of HH12 showed a downward trend, and the difference was significant (p < 0.05). The biomass of HH12 was the smallest at 300 mg/kg Cu, which decreased by 38.51% compared with that in the control group. As the Cu concentration increased, the biomass of the spike of HH12 showed no significant difference from that in the control group (p < 0.05).

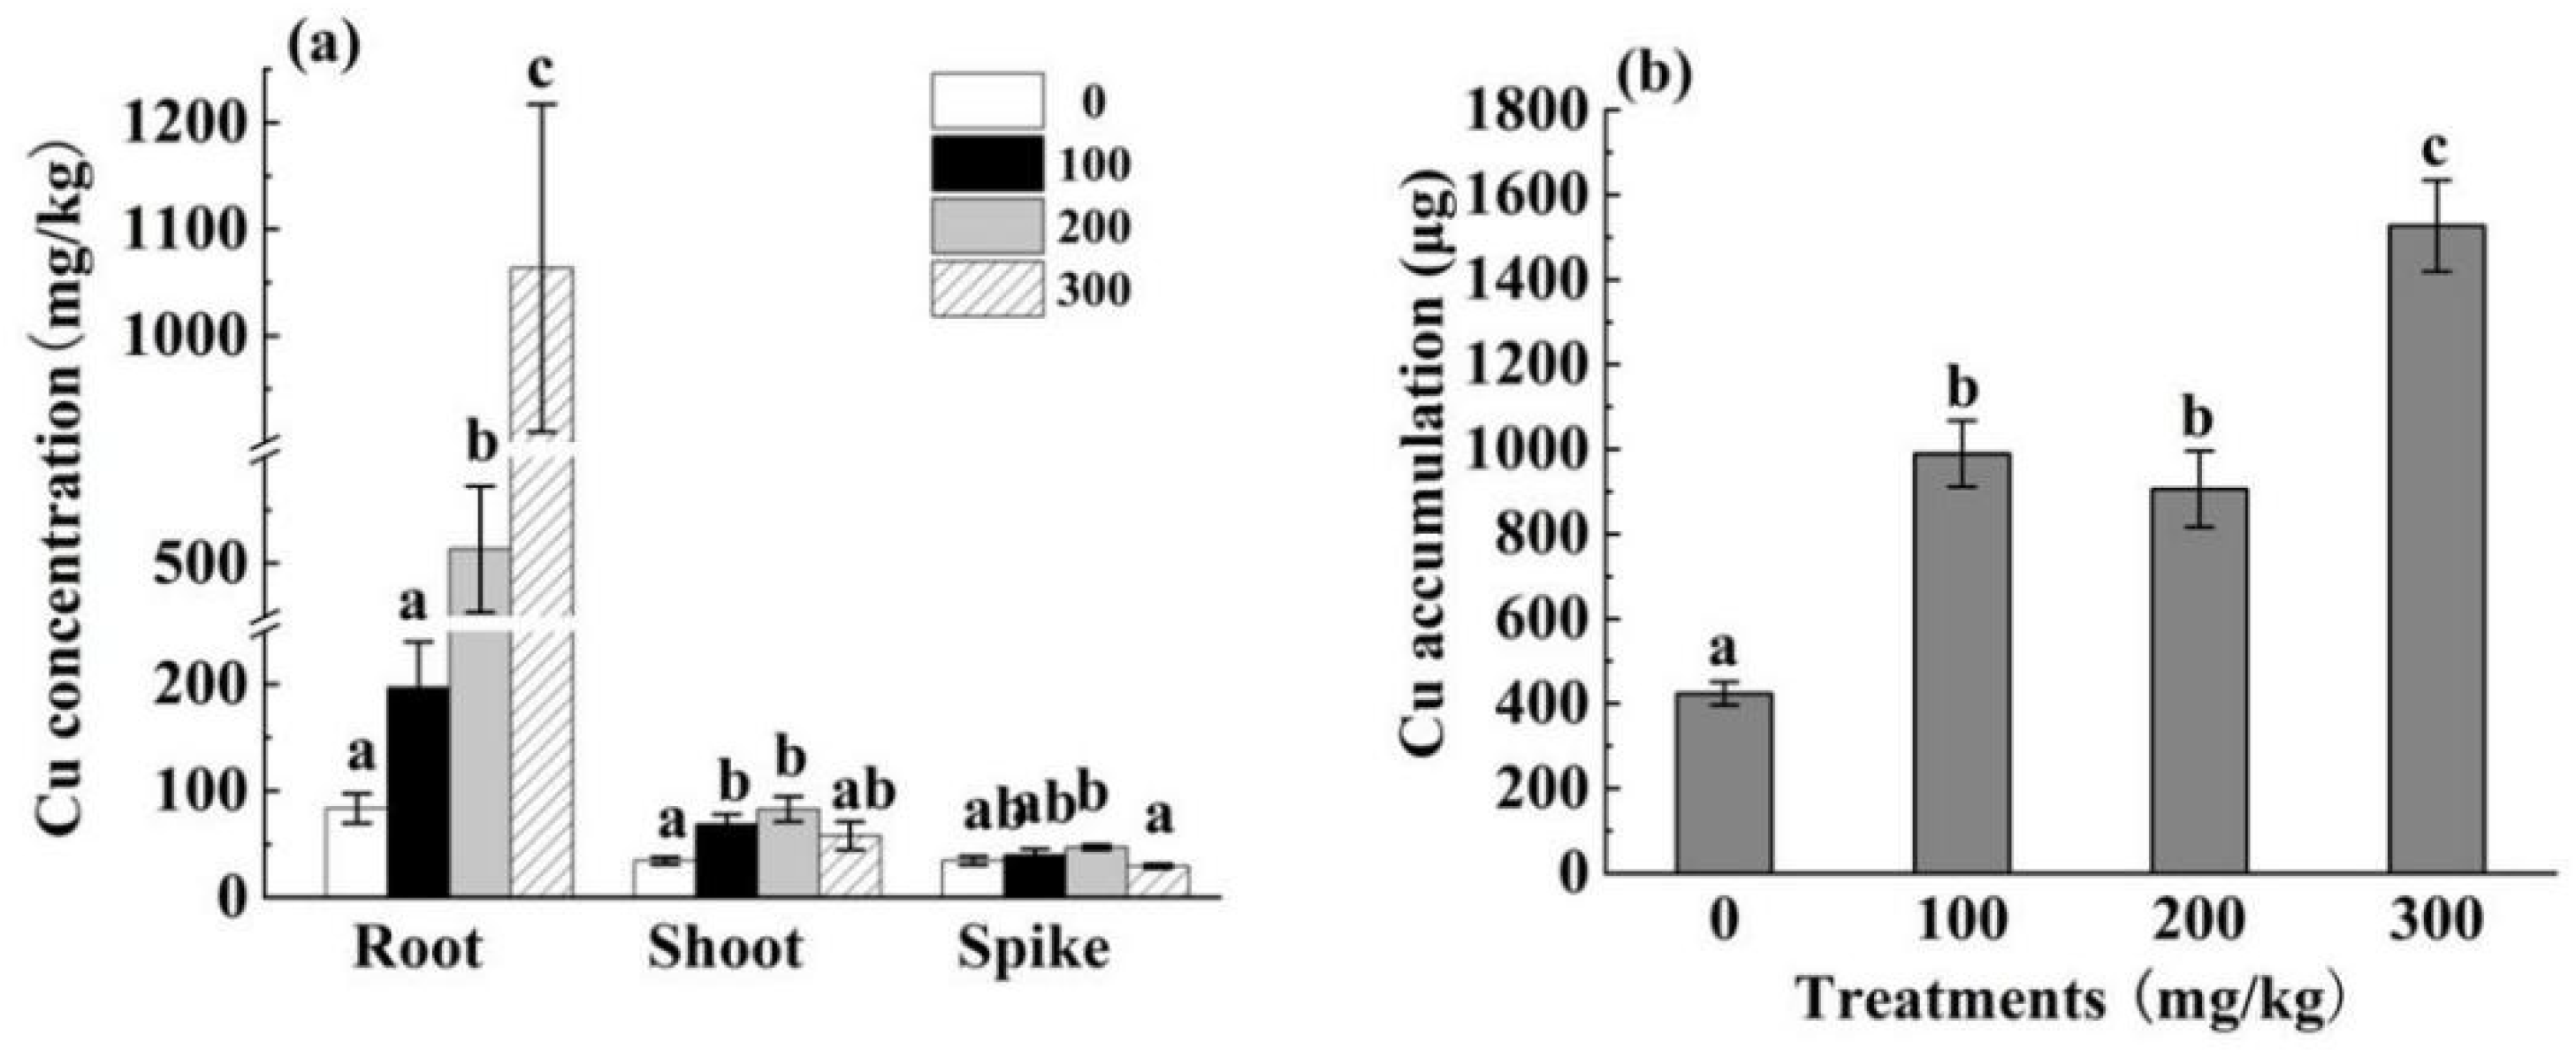
3.2.2. Cu Content and Cu Accumulation in Different HH12 Parts

With an increase in Cu concentration, the root Cu content of HH12 increased significantly (Figure 3a), and a significant difference was observed at different Cu concentrations (p < 0.01). At 300 mg/kg Cu, the root Cu content was 1063.47 mg/kg, which was 1100% higher than that in the control group. Compared with the control group, the Cu content in the shoots of Cu-treated HH12 was significantly higher (p < 0.05). When the Cu concentration was <200 mg/kg, the spike of HH12 showed no significant difference in Cu content compared with that in the control group (p > 0.05). However, the Cu content of the spike under the 300 mg/kg Cu concentration treatment was significantly lower than that under the 200 mg/kg Cu concentration treatment. The Cu content in the shoot and spike of HH12 were 82.86 and 46.97 mg/kg, respectively, which increased by 140.06 and 36.51%, respectively, compared with that in the control group. The Cu content in the shoot did not exceed the critical content standard of the Cu hyperaccumulator (1000 mg/kg) for Cu. HH12 treated with Cu experienced a significant rise (p < 0.05) in Cu accumulation relative to the blank control (Figure 3b). Cu accumulation was 1526.41 μg at 300 mg/kg Cu, which was significantly higher than that with the other treatments, and it increased by 260.29% compared with that in the control group.

3.2.3. Cu Transport Coefficient of Different HH12 Parts

Table 2 indicates that the Cu transport coefficient of HH12 gradually decreased with an increase in soil Cu content, which was <0.5. Compared with the control group, the transfer coefficient of Cu-treated HH12 spikes was significantly smaller (p < 0.05). However, no significant difference was observed among different Cu concentrations (p > 0.05). and all were <1. When the soil Cu content was 300 mg/kg, transport coefficients of the shoot and spike of HH12 were the lowest (0.057 and 0.562, respectively) and decreased by 86.74% and 43.46%, respectively, compared with those in the blank control group.

3.3. Zn Accumulation Characteristics of HH12

3.3.1. Biomass of Different HH12 Parts

The root biomass of HH12 after Zn treatment was significantly lower than that in the control group (p < 0.05), and no significant difference was observed in the shoot biomass at different Zn concentrations (p > 0.05) (Figure 1c). Compared with the control group, the shoot biomass of HH12 was slightly increased (p > 0.05). The highest shoot biomass was observed after the 200 mg/kg treatment, which was significantly higher than that in the blank control group (p < 0.05), with an increase of 43.46%. No significant difference was observed among different Zn concentrations (p > 0.05). Compared with the control group, the biomass of HH12 spikes increased significantly (p < 0.05) after Zn treatment, and the highest biomass increased by 180.91% at 100 mg/kg Zn.

3.3.2. Zn Content and Accumulation in Different HH12 Parts

Figure 4a presents that the Zn content in the root of HH12 gradually increased with increasing Zn levels. When the Zn concentration was 200–400 mg/kg, the root Zn content was significantly higher than that in the control group (p < 0.05). However, no significant difference was observed among the different treatments (p > 0.05). At the Zn concentration of 300 mg/kg, the root Zn content was 512.11 mg/kg, which was 178.92% higher than that in the control group. The Zn content in the shoots and spikes of HH12 showed no significant difference (p > 0.05) at 100–300 mg/kg Zn, but an upward trend was noted. At 400 mg/kg Zn, the Zn contents in shoots and spikes were significantly higher than those in the control group (p < 0.05) (440.95 and 175.51 mg/kg, respectively) and increased by 124.45% and 139.11%, respectively. Figure 4b indicates that Zn accumulation in HH12 showed an upward trend with the increased Zn levels. At 300–400 mg/kg Zn, Zn accumulation was significantly higher than that in the control group (p < 0.05), and the total Zn accumulation was 3755.08 μg at 400 mg/kg, which was twice as much as that in the control group.

3.3.3. Zn Transport Coefficients in Different HH12 Parts

Table 3 indicates that at the Zn concentration of 100–400 mg/kg, no significant difference (p > 0.05) was observed between the aboveground parts of sea rice and the control group (p > 0.05), and the transport coefficients were all <1 and >0.5. The Zn transport coefficient of Zn-treated HH12 was lower than that in the control group (all <0.5) and was significantly lower than that in the control group (p < 0.05) at 200–300 mg/kg Zn. With 300 mg/kg Zn, transport coefficients of the shoot and spike of HH12 were the lowest (i.e., 0.815 and 0.170, respectively) and were 23.83 and 65.45% lower, respectively, than those in the control group.

4. Discussion

Plant phytoremediation can be categorized as plant extraction, plant volatilization, plant stabilization, and root filtration [24]. Plant extraction is based on the concept of hyperaccumulator plants, which transfer and store heavy metals from soil in the shoot parts of plants, and allows remediation of heavy metal-contaminated soil. The general criteria for hyperaccumulator plants are as follows [25]: (1) Zn content ≥ 10,000 mg/kg; Pb, Cu, and As content, ≥1000 mg/kg; and Cd content ≥100 mg/kg; (2) the content of heavy metals in the upper part of the plant is higher than that in the shoot part; and (3) the transport coefficient is >1, and the enrichment coefficient is >1.
Heavy metal uptake and accumulation in rice were mainly affected by rice varieties and field environmental conditions (heavy metal bioavailability was affected by agronomic management measures such as water, fertilizer, and conditioner). The root growth of HH12 was inhibited under single Cd, Zn, and Cu stress. The root biomass decreased significantly with an increase in stress, which was due to the toxic effect of heavy metals on the root tip mitosis index and root length [22,26]. However, the growth of shoots and spikes of HH12 was slightly inhibited by the stress of 1–2 mg/kg Cd but promoted at a high concentration of 8 mg/kg. Zhou et al. [27] reported that the rice cultivar Xiangwanxian 12 experienced an inhibitory effect when planted in the soil with 3.7 mg/kg Cd. Peng [28] demonstrated that Cd stress of 0.2–1 mg/kg inhibits the growth of Zhongjiazao 17 and Taiyou 390. A possible reason for different experimental results is the variation in the Cd tolerance of rice varieties. Sea rice HH12 may be more tolerant than the aforementioned three rice varieties. Chen [29] showed that 100–300 mg/kg Zn treatment could significantly promote rice growth, which was consistent with the present study results. Studies by Zhao [30] and Xu [31] have shown that Cu stress of 400–1000 mg/kg significantly inhibits rice growth. In this study, the growth of HH12 was severely inhibited or even HH12 died with the 400 mg/kg Cu treatment.
According to heavy metal absorption of HH12, a positive correlation was observed between the Cd content in different HH12 parts and the soil Cd content. The Cd contents of shoot and spikes of HH12 were the highest at 8 mg/kg Cd, which were 89.02 and 45.37 mg/kg, respectively. These content levels did not meet the content standard of Cd-enriched plants. However, when the Cd concentration was ≤2 mg/kg, Cd distribution in the plant body was in the order of shoot > root > spike. This means the transport coefficient of Cd in the shoot was >1. At the 1 mg/kg concentration, the transport coefficient of Cd in the shoot was as high as 1.36. This was possibly because of the high cumulative risk of HH12 under low Cd pollution. According to Yang’s [22] comparative analysis of Cd subcellular distribution between low and high Cd accumulation rice varieties and HH12, sea rice exhibited higher Cd accumulation characteristics than the other two rice varieties. However, Cu distribution in HH12 was in the order of root > shoot > spike. At 200 mg/kg Cu, the Cu contents of shoot and spike were 82.85 and 46.97 mg/kg, respectively, which did not meet the content standard of Cu-enriched plants. The Cu transport capacity of HH12 was in the order of spike > shoot. Under the Cu stress of 100–300 mg/kg, the Cu transport coefficients of shoots were all <0.5 and decreased as the Cu concentration increased. This may be explained by the stronger Cu fixation ability of the root cell wall and increased with an increase in stress to inhibit Cu migration to protoplasts [32]. Zn distribution in HH12 was in the order of shoot root > shoot > spike. The Zn contents in the shoot (440.95 mg/kg) and spike (175.51 mg/kg) were the highest at 400 mg/kg. The results showed that the Zn transport capacity of HH12 was in the order of shoot > spike. At different Zn concentrations, the transport coefficient of the shoot was >0.5 and close to 1, whereas that of the spike was <0.5. This may be due to the mutation of the Oszip4 gene in sea rice, which led to a decrease in Zn distribution in spike [33].

5. Conclusions

(1) The root growth of HH12 was inhibited by high Cd stress. Most Cd taken up by HH12 was retained in the root system. However, HH12 had a high Cd accumulation risk at a low Cd level.
(2) High Cu stress severely inhibited HH12 growth. As the Cu concentration increased, the phenomenon of Cu retention in HH12 roots became more obvious. HH12 exhibited a strong ability to limit the upward transport of Cu, and the Cu transport coefficient was low.
(3) Zn stress inhibited the growth of HH12 roots but promoted the growth of its spike. A certain Zn accumulation risk was noted in HH12 shoots, but the transport capacity of Zn from the shoot to spike was nonsignificant.

Author Contributions

Data curation, J.L. and L.T.; Formal analysis, Y.Z. and Z.L.; Investigation, N.L.; Methodology, Z.L.; Project administration, H.L.; Resources, L.T.; Software, Y.Z.; Supervision, X.Y. and H.L.; Validation, N.L.; Writing—original draft, J.L.; Writing—review & editing, X.Y. All authors have read and agreed to the published version of the manuscript.

Funding

This work was supported by the National Key Research and Development Program of China (2020YFC1807805), the Natural Science Foundation of Guangdong Province (2022A1515010662), the China Postdoctoral Science Foundation (2021M693665), Teaching Reform & Educational Quality Project of South China Agricultural University (JG19091, zlgc19072) & Guangdong Provincial Department of Education (2019-91).

Institutional Review Board Statement

Not applicable.

Informed Consent Statement

Not applicable.

Data Availability Statement

Data is contained within the article.

Conflicts of Interest

The authors declare no conflict of interest.

References

  1. Liu, Y.; Zhou, Y. Reflections on China’s food security and land use policy under rapid urbanization. Land Use Policy 2021, 109, 105699. [Google Scholar] [CrossRef]
  2. Guo, F. Research on the Development Countermeasures of Sea Rice Industry in Zhanjiang. Master Thesis, Guangdong Ocean University, Zhanjiang, China, 2019. (In Chinese). [Google Scholar]
  3. Yang, X.; Qin, J.; Li, J.; Lai, Z.; Li, H. Upland rice intercropping with Solanum nigrum inoculated with arbuscular mycorrhizal fungi reduces grain Cd while promoting phytoremediation of Cd-contaminated soil. J. Hazard. Mater. 2020, 406, 124325. [Google Scholar] [CrossRef] [PubMed]
  4. Wu, M.; Luo, Q.; Liu, S.; Zhao, Y.; Long, Y.; Pan, Y. Screening ornamental plants to identify potential Cd hyperaccumulators for bioremediation. Ecotoxicol. Environ. Saf. 2018, 162, 35–41. [Google Scholar] [CrossRef]
  5. Ji, P.; Sun, T.; Song, Y.; Ackland, M.L.; Liu, Y. Strategies for enhancing the phytoremediation of cadmium-contaminated agricultural soils by Solanum nigrum L. Environ. Pollut. 2011, 159, 762–768. [Google Scholar] [CrossRef] [PubMed]
  6. Xu, Y.; Feng, J.; Li, H. How intercropping and mixed systems reduce cadmium concentration in rice grains and improve grain yields. J. Hazard. Mater. 2021, 402, 123762. [Google Scholar] [CrossRef] [PubMed]
  7. Xu, Z.; Shao, T.; Lv, Z.; Yue, Y.; Liu, A.; Long, X.; Zhou, Z.; Gao, X.; Rengel, Z. The mechanisms of improving coastal saline soils by planting rice. Sci. Total Environ. 2020, 703, 135529. [Google Scholar] [CrossRef] [PubMed]
  8. Qin, G.; Niu, Z.; Yu, J.; Li, Z.; Ma, J.; Xiang, P. Soil heavy metal pollution and food safety in China: Effects, sources and removing technology. Chemosphere 2021, 267, 129205. [Google Scholar] [CrossRef]
  9. Wan, Y.; Huang, Q.; Wang, Q.; Ma, Y.; Su, D.; Qiao, Y.; Jiang, R.; Li, H. Ecological risk of copper and zinc and their different bioavailability change in soil-rice system as affected by biowaste application. Ecotoxicol. Environ. Saf. 2020, 192, 110301. [Google Scholar] [CrossRef]
  10. Cao, Z.; Wang, L.; Yang, L.; Yu, J.; Lv, J.; Meng, M.; Li, G. Heavy metal pollution and the risk from tidal flat reclamation in coastal areas of Jiangsu, China. Mar. Pollut. Bull. 2020, 158, 111427. [Google Scholar] [CrossRef]
  11. Li, R.; Li, R.; Chai, M.; Shen, X.; Xu, H.; Qiu, G. Heavy metal contamination and ecological risk in Futian mangrove forest sediment in Shenzhen Bay, South China. Mar. Pollut. Bull. 2015, 101, 448–456. [Google Scholar] [CrossRef]
  12. Zheng, S.; Liu, S.; Feng, J.; Wang, W.; Wang, Y.; Yu, Q.; Liao, Y.; Mo, Y.; Xu, Z.; Li, L.; et al. Overexpression of a stress response membrane protein gene OsSMP1 enhances rice tolerance to salt, cold and heavy metal stress. Environ. Exp. Bot. 2021, 182, 104327. [Google Scholar] [CrossRef]
  13. Yaashikaa, P.R.; Kumar, P.S.; Jeevanantham, S.; Saravanan, R. A review on bioremediation approach for heavy metal detoxification and accumulation in plants. Environ. Pollut. 2022, 301, 119035. [Google Scholar] [CrossRef] [PubMed]
  14. Long, X.; Chi, J.; Liu, L.; Li, Q.; Liu, Z. Effect of Seawater Stress on Physiological and Biochemical Responses of Five Jerusalem Artichoke Ecotypes. Pedosphere 2009, 19, 208–216. [Google Scholar] [CrossRef]
  15. Huang, L.; Li, W.C.; Tam, N.F.Y.; Ye, Z. Effects of root morphology and anatomy on cadmium uptake and translocation in rice (Oryza sativa L.). J. Environ. Sci. 2019, 75, 296–306. [Google Scholar] [CrossRef] [PubMed]
  16. Kalembasa, S.; Malinowska, E.; Kalembasa, D.; Pakula, K.; Symanowicz, B.; Becher, M.; Jaremko, D. Impact of foliar application of Tytanit on Zn, Li, Ni, Cr, Pb, and Cd contents in celery leaves. Pol. J. Environ. Stud. 2015, 24, 1621–1631. [Google Scholar]
  17. Feng, R.; Wei, C.; Tu, S.; Ding, Y.; Song, Z. A Dual Role of Se on Cd Toxicity: Evidences from the Uptake of Cd and Some Essential Elements and the Growth Responses in Paddy Rice. Biol. Trace Elem. Res. 2013, 151, 113–121. [Google Scholar] [CrossRef]
  18. Liao, G.; Wu, Q.; Feng, R.; Guo, J.; Wang, R.; Xu, Y.; Ding, Y.; Fan, Z.; Mo, L. Efficiency evaluation for remediating paddy soil contaminated with cadmium and arsenic using water management, variety screening and foliage dressing technologies. J. Environ. Manag. 2016, 170, 116–122. [Google Scholar] [CrossRef]
  19. Shao, G.; Chen, M.; Wang, D.; Xu, C.; Mou, R.; Cao, Z.; Zhang, X. Using iron fertilizer to control Cd accumulation in rice plants: A new promising technology. Sci. China Life Sci. 2008, 51, 245–253. [Google Scholar] [CrossRef]
  20. Yoshida, S.; Fomo, D.A.; Cock, J.H.; Gomez, K.A. Routine procedures for growing rice plants in culture solution. Lab. Man. Physiol. Stud. Rice 1976, 61–66. [Google Scholar]
  21. Bao, S. Soil and Agricultural Chemistry Analysis; China Agricultural Press: Beijing, China, 2000. [Google Scholar]
  22. Yang, X.; Lin, R.; Zhang, W.; Xu, Y.; Wei, X.; Zhuo, C.; Qin, J.; Li, H. Comparison of Cd subcellular distribution and Cd detoxification between low/high Cd-accumulative rice cultivars and sea rice. Ecotoxicol. Environ. Saf. 2019, 185, 109698.1–109698.8. [Google Scholar] [CrossRef]
  23. Zeng, L.; Lin, X.; Zhou, F.; Qin, J.; Li, H. Biochar and crushed straw additions affect cadmium absorption in cassava-peanut intercropping system. Ecotoxicol. Environ. Saf. 2019, 167, 520–530. [Google Scholar] [CrossRef]
  24. Shah, V.; Daverey, A. Phytoremediation: A multidisciplinary approach to clean up heavy metal contaminated soil. Environ. Technol. Innov. 2020, 18, 100774. [Google Scholar] [CrossRef]
  25. McGrath, S.P.; Zhao, F. Phytoextraction of metals and metalloids from contaminated soils. Curr. Opin. Biotechnol. 2003, 14, 277–282. [Google Scholar] [CrossRef]
  26. He, J.; Ren, Y.; Pan, X.; Yan, Y.; Cheng, Z.; Jiang, D. Salicylic acid alleviates the toxicity effect of cadmium on germination, seedling growth, and amylase activity of rice. J. Plant Nutr. Soil Sci. 2010, 173, 300–305. [Google Scholar] [CrossRef]
  27. Zhou, H.; Zhu, W.; Yang, W.; Gu, J.; Gao, Z.; Chen, L.; Du, W.; Zhang, P.; Peng, P.; Liao, B. Cadmium uptake, accumulation, and remobilization in iron plaque and rice tissues at different growth stages. Ecotoxicol. Environ. Saf. 2018, 152, 91–97. [Google Scholar] [CrossRef] [PubMed]
  28. Peng, O. Effects of Cadmium Stress on Rice Growth and Development and Study on the Key Period of Cadmium Accumulation in Rice Grain. Master Thesis, Hunan Agriculture University, Changsha, China, 2017. (In Chinese). [Google Scholar]
  29. Chen, Y. Study on the Toxic Effects of Soil Zinc on Crops and the Toxicity Thresholds of Zn for the Soil. Master Thesis, Fujian Agriculture and Forestry University, Fuzhou, China, 2011. (In Chinese). [Google Scholar]
  30. Zhao, J. Effect of Soil Copper Contamination on Growth and Development of Rice. Master Thesis, Yangzhou University, Yangzhou, China, 2008. (In Chinese). [Google Scholar]
  31. Xu, J.; Yang, L.; Wang, Z.; Dong, G.; Huang, J.; Wang, Y. Effects of Soil Copper Concentration on Growth, Development and Yield Formation of Rice (Oryza sativa). Rice Sci. 2005, 12, 125–132. [Google Scholar]
  32. Krzeslowska, The cell wall in plant cell response to trace metals:polysaccharide remodeling and its role in defense strategy. Acta Physiol Plant 2011, 33, 35–51. [CrossRef]
  33. Mu, S.; Yamaji, N.; Sasaki, A.; Luo, L.; Du, B.; Che, J.; Shi, H.; Zhao, H.; Huang, S.; Deng, F. A transporter for delivering zinc to the developing tiller bud and panicle in rice. Plant J. 2020, 105, 786–799. [Google Scholar] [CrossRef]
Figure 1. Biomass of all parts of sea rice in different Cd (a), Cu (b), and Zn levels (c). Lowercase letters on the bar chart indicate significant differences among different treatments (p < 0.05). Data were presented as mean ± standard error (n = 3).
Applsci 12 09718 g001
Figure 2. Cd concentrations of all parts of the sea rice (a) and its Cd accumulation (b). Lowercase letters on the bar chart indicate significant differences among different treatments (p < 0.05). Data were presented as mean ± standard error (n = 3).
Applsci 12 09718 g002
Figure 3. Cu concentrations of all parts of the sea rice (a) and its Cu accumulation (b). Lowercase letters on the bar chart indicate significant differences among different treatments (p < 0.05). Data were presented as mean ± standard error (n = 3).
Applsci 12 09718 g003
Figure 4. Zn concentrations of all parts of the sea rice (a) and its Zn accumulation (b). Lowercase letters on the bar chart indicate significant differences among different treatments (p < 0.05). Data were presented as mean ± standard error (n = 3).
Applsci 12 09718 g004
Table 1. Cd transport coefficients of sea rice.
Treatments (mg/kg)Root-ShootShoot-Spike
01.098 ± 0.348 a1.103 ± 0.806 a
11.361 ± 0.161 a0.8 ± 0.206 a
21.109 ± 0.361 a0.773 ± 0.088 a
40.643 ± 0.345 a0.835 ± 0.048 a
80.981 ± 0.109 a0.519 ± 0.153 a
Lowercase letters on each line indicate the significant differences of HH12 between different Cd concentrations, respectively (p < 0.05).
Table 2. Cu transport coefficients of sea rice.
Treatments (mg/kg)Root-ShootShoot-Spike
00.43 ± 0.065 b0.994 ± 0.026 b
1000.368 ± 0.041 b0.579 ± 0.046 a
2000.169 ± 0.035 a0.603 ± 0.129 a
3000.057 ± 0.014 a0.562 ± 0.116 a
Lowercase letters on each line indicate the significant differences of HH12 between different Cu concentrations, respectively (p < 0.05).
Table 3. Zn transport coefficients of all parts of sea rice.
Treatments (mg/kg)Root-ShootShoot-Spike
01.070 ± 0.007 a0.492 ± 0.002 b
1000.835 ± 0.195 a0.374 ± 0.051 b
2000.853 ± 0.133 a0.228 ± 0.041 a
3000.815 ± 0.192a0.170 ± 0.035 a
4000.953 ± 0.210 a0.420 ± 0.061 b
Lowercase letters on each line indicate the significant differences of HH12 between different Zn concentrations, respectively (p <0.05).
Publisher’s Note: MDPI stays neutral with regard to jurisdictional claims in published maps and institutional affiliations.

