1. Introduction
The urban expressway is an important segment of the urban roadway system. The diverging behavior of vehicles often occurs in the exit area of the urban expressway. Comparing the traffic behavior of the mainline, acceleration or deceleration, and lane-changing behaviors are frequent in the exit area, which will result in a higher risk of traffic crashes.
It is stated by the National Highway Traffic Safety Administration that 27% of accidents were caused by vehicle lane-changing [
1]. Traffic safety data in recent years also shows that 23.91% of traffic accidents are caused by lane-changing [
2]. Therefore, if the intentions of surrounding vehicles can be recognized in advance, traffic accidents could be avoided to some extent. The urban expressway exits have more short off-ramps than the freeway and large volumes of vehicles make the situation even worse. It is very important to accurately recognize the lane-changing behavior of vehicles to reduce the incidence of road traffic accidents.
Based on the vehicle trajectory data collected in the urban expressway diversion area, this paper extracts the characteristics that represent the driver’s style and vehicle driving intention and establishes a machine learning model to identify the vehicle lane-changing intention in time, which can improve driving safety and feasibility to a certain extent.
1.1. Literature Review
Lane-changing is a common operation for drivers. It has been proposed for many years to study traffic safety by recognizing lane-changing behaviors; many studies focus on this field to test new theories, enhance the accuracy of lane-changing recognition, and reduce traffic crashes. Gipps connected the decisions made before lane-changing when analyzing the decisions made in the process of lane-changing, which makes the overall logic of the model more complete, and established one of the most classic vehicle lane-changing decision models [
3]. However, the model is too idealistic to be applied in practice. The relevant scholars have optimized and improved the classical model from various angles and proposed new models, such as the MITSIM model, SITRAS model, CORISM model, etc. [
4,
5,
6].
With the development of science and technology, researchers have applied new methods to lane-changing behavior analysis, including SVM, the LSTM model, the hidden Markov model, etc. Zyner and Worrall et al., proposed a long short-term memory (LSTM) network model to identify the driver’s intention when the vehicle enters the intersection. The model inputs the vehicle position, heading angle, speed, and other parameters for learning and training to achieve a good recognition effect [
7]. Phillips et al., collected traffic data at intersections and built an intention recognition model based on the LSTM network to predict a left turn, right turn, and straight ahead intentions [
8]. Kim et al., proposed a new preprocessing algorithm for the advanced driver assistance system to improve the accuracy of identifying the driver’s intention to change lanes [
9]. The verification results on the driving simulator show that the recognition accuracy can be improved by combining the neural network model with the support vector machine model. Guo used the bi-directional long and short-term memory network based on the attention mechanism (AT-BiLSTM) to establish a lane-changing intention model, which improved the prediction accuracy [
10]. Song Xiaoling et al., constructed the revenue function to reflect the interaction between vehicles and introduced the attention mechanism and conditional random field to build an LSTM model to identify the vehicle lane-changing intention [
11]. Through comparison, it is found that the performance of this model is better than that of the SVM and hidden Markov model.
At the same time, some researchers have developed various methods to improve the effect of identifying vehicle lane-changing behavior. Zhang Mingfang et al., established a combined HMM and Bayesian model to identify the discrete behavior of intersections, including common lane-changing, emergency lane-changing, and turning [
12]. The training model parameters include the steering angle, angular velocity, and point cloud data. Li Keqiang et al., proposed another new algorithm, which combines HMM and Bayesian filtering to identify the changed behavior of the left and right lanes [
13]. Yi et al., used a Bayesian classifier and decision tree theory to predict vehicle lane-changing probability based on NGSIM data [
14].
Deep learning technology has an excellent performance in many research applications [
15,
16]; some studies on lane-changing behavior also use deep learning technology for analysis and research [
17]. Based on the real vehicle data (NGSIM) from the next-generation simulation data, Dou Yangliu et al., proposed a vehicle lane-changing prediction model by using the characteristics of speed difference, vehicle spacing, and position, combined with SVM and the artificial neural network (ANN) [
18]. Peng Jinshuan et al., developed a back propagation neural network (BPNN) model for predicting vehicle lane-changing intention [
19]. The model accurately predicted vehicle lane-changing behavior at least 1.5 s in advance by analyzing the drivers’ visual data, operation data, vehicle motion data, and traffic environment. Xu Ting et al., established a two-layer convolutional neural network model (CNN) to identify the drivers’ lane-changing behavior [
20]. Mammer et al., only used a small number of manually labeled samples to train the convolutional neural network (CNN) for identifying lane-changing intention [
21].
Although various machine learning models are widely used in lane-changing recognition, there are still some shortcomings. For example, due to the correlation between input variables, the Bayesian network model has a great impact on lane-changing recognition results [
22]; the artificial neural network has many parameters and a slow operation speed; the decision tree is prone to overfitting; and the support vector machine algorithm is better than the above machine learning algorithm, but it is not easy to determine the optimal penalty factor and kernel function parameters that affect the model [
14]. Therefore, how to find the optimal support vector machine parameters to improve the accuracy of model recognition is a research hotspot. The traditional support vector machine uses the grid search algorithm to determine the appropriate support vector machine parameters, but the algorithm has the problems of complex calculation and being time consuming [
23]. Salvucci et al., proposed a driver model for detecting vehicle lane-changing behavior by comparing simulated driving behavior with actual driving behavior [
24]. Although many studies have classified specific lane-changing behaviors and extracted the characterization parameters, these works are mainly focused on the research of traffic flow and are mostly used for microscopic traffic simulation rather than vehicle lane-changing recognition [
25].
1.2. Problem Description and Formulation
During the actual lane-changing, the driver may wait to change lanes when approaching the lane line, or give up the lane-changing operation according to the surrounding traffic conditions. Driving style has a direct impact on the intention of changing lanes; drivers with different styles often have different driving habits. Most of the previously mentioned studies did not comprehensively consider the relationship between driver style and lane-changing intention recognition but instead studied the impact of one of them on traffic safety alone. In light of this, it is interesting and necessary to use the data-driven method and introduce the consideration of the driver’s style in lane-changing recognition research.
At present, the rise of automatic driving technology has driven the research of vehicle lane-changing behavior. The recognition of autonomous vehicle lane-changing behavior is mainly realized by machine vision technology and radar. Road image algorithms can help autonomous vehicles to recognize and judge. The most reliable way to train an automatic driving algorithm is to carry out a road test, but the road environment is single, so it is difficult to train the CNN network of the system comprehensively [
26,
27].
However, the image techniques make it available for data-driven methods. In this paper, the UAV is used to collect the vehicle trajectory data at the exit of the urban expressway and vehicle lane-changing segments are extracted by the lane-changing rules. On this basis, the driving styles are clustered, and a model is established to predict and recognize driver styles. In the end, a machine learning model is established to recognize the intention of vehicle lane-changing. This can be applied to automatic driving vehicles to identify dangerous lane-changing and promote the development and maturity of the advanced driving assistance system (ADAS). In this way, a lane-changing collision risk can be identified by vehicles and the driving track of autonomous vehicles can be optimized to improve driving safety.
Driving style directly affects the driver’s lane-changing behavior, but traditional lane-changing recognition research does not consider this factor. This paper makes some assumptions as driving style is introduced in the research, which can effectively improve the accuracy and integrity of lane-changing recognition strategies, but we also make several new contributions. The recognition of lane-changing behavior at the exit of the urban expressway perfects the research in this field and improves driving safety. Three machine learning models are established to recognize the intention of vehicle lane-changing in time by mining the effective information of vehicle trajectory data and comparing the results of a single time point and different time windows, which improves the accuracy and feasibility of the research.
The remainder of the paper is organized as follows: the details of the data and methods are presented in
Section 2, including the data collection and the trajectory data extraction. Driving style clustering and its classification are explained in
Section 3, including the clustering characteristics, method, and classification model features. The lane-changing recognition model application and a discussion of the modeling results are presented in
Section 4. The last is the conclusion section which summarizes the study and recommends future research directions.
2. Materials and Methods
This study mainly focuses on the exit diversion area of the urban expressway. To collect more natural driving track data within the effective time, the exit of the urban expressway at the South Third Ring Road of Xi’an was selected in this study. It is a two-way six-lane expressway; the lane width is 3.75 m and the design speed is 100 km/h.
2.1. Data Collection
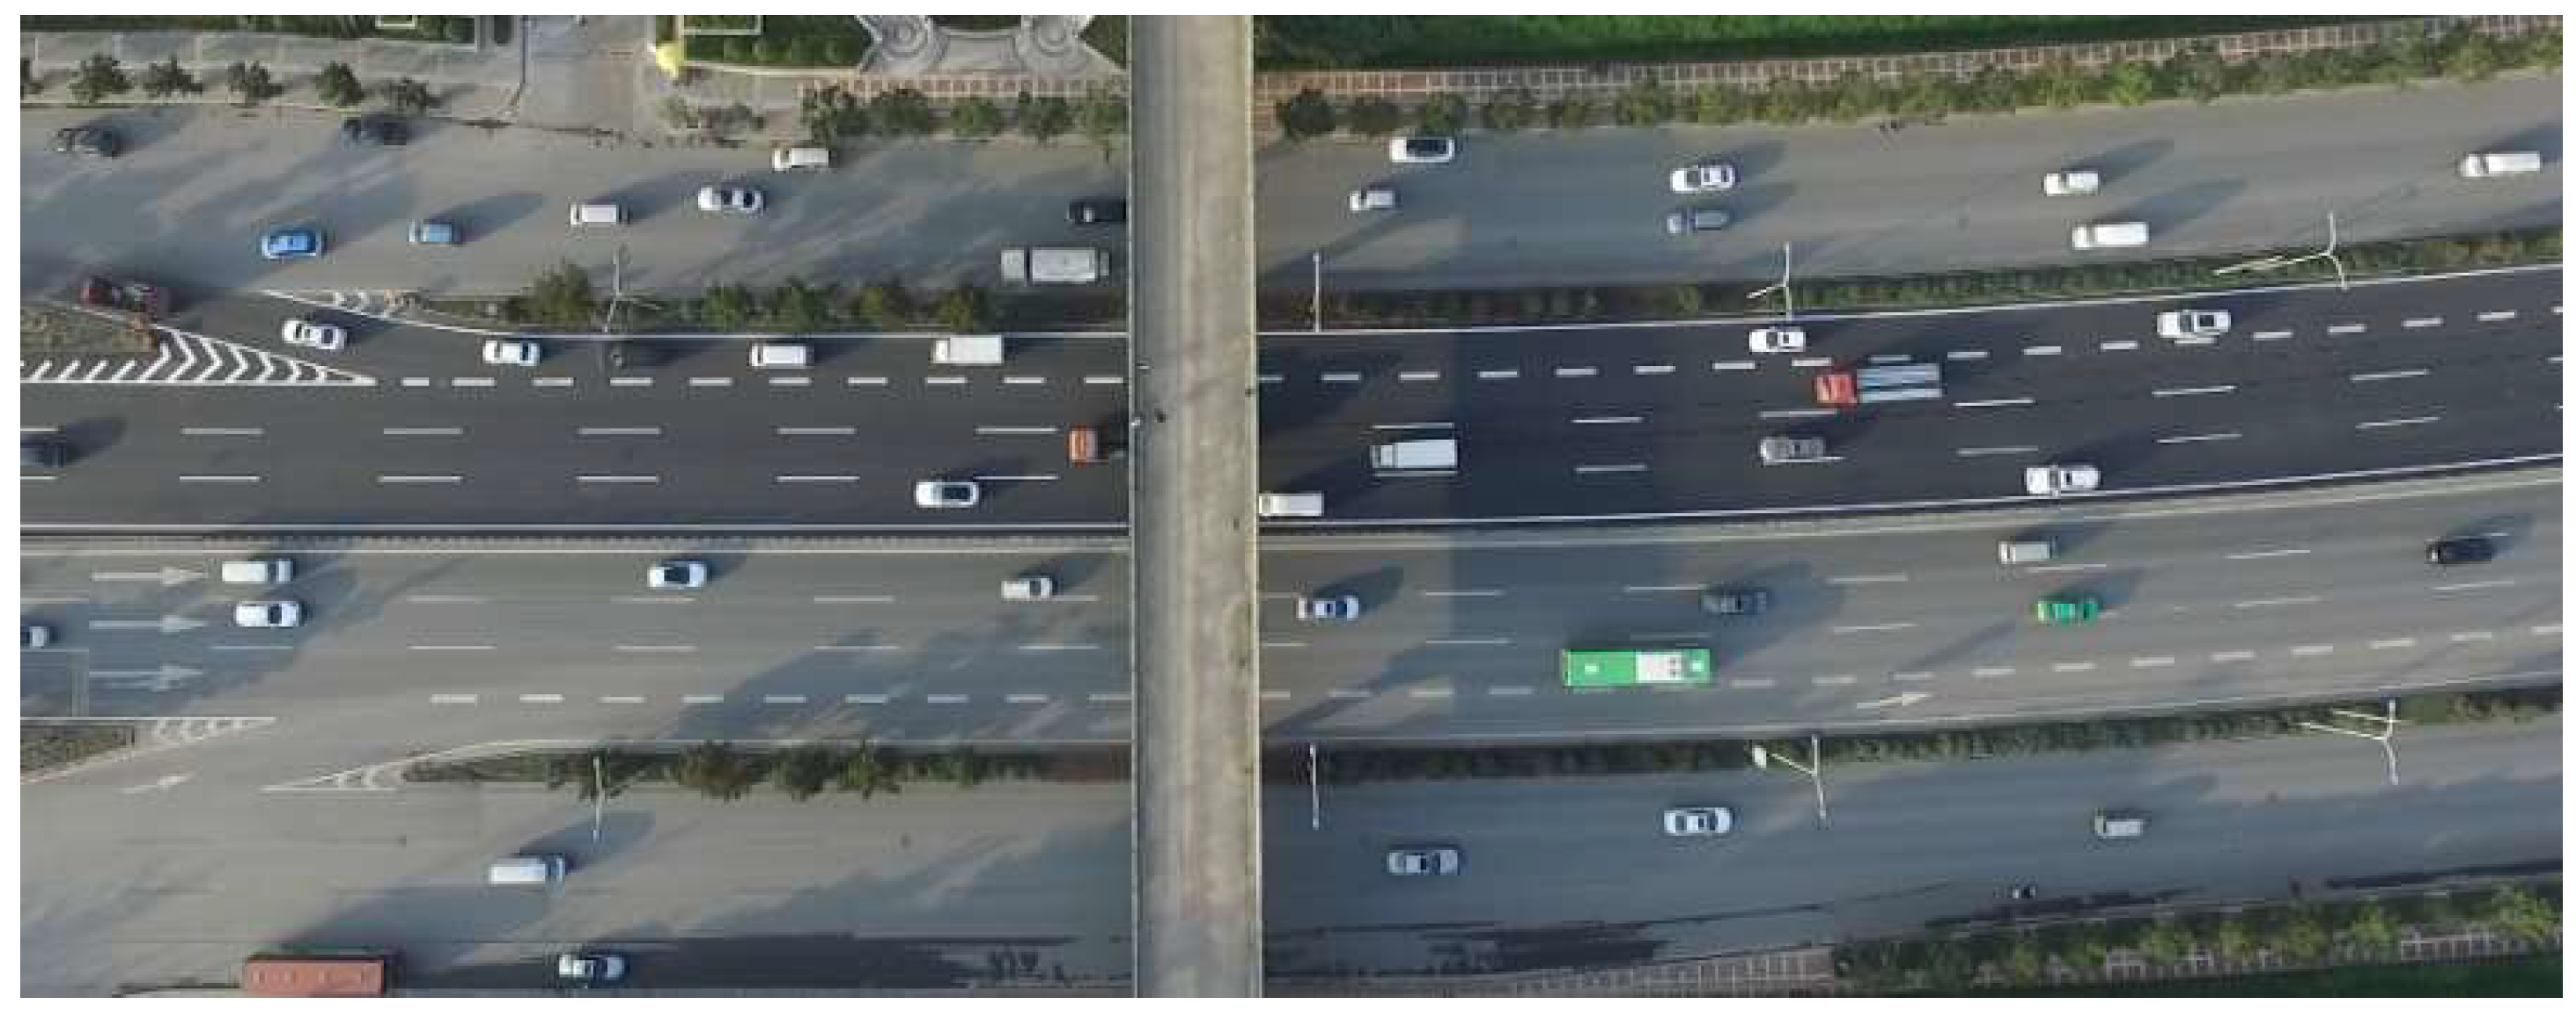
For the exit, the traffic conditions during the morning peak hours (8:30–9:30 am) and afternoon peak hours (5:30–6:30 pm) on a weekday were collected by the UAV and were stabilized at about 200 m to ensure an adequate viewing height to cover the whole functional area (as shown in
Figure 1). To meet the requirements of needed for the UAV, the weather is sunny with a high visibility and no wind, which ensures that the UAV can capture the video in a stable state.
2.2. Trajectory Data Extraction
As a video analysis software, Tracker was first widely used in the physical field. In recent years, with its advantages of its simple operation, high accuracy, and powerful functions, Tracker has been widely known by the public and has also been widely used in the transportation field. The tracker software is used to extract the vehicle trajectory data. By marking the coordinate system and tracking the target automatically or manually, the coordinates, speed, and other information of each vehicle at any time can be obtained. The steps to extract the natural driving trajectory data based on the tracker are as follows.
First, the coordinate system and reference distance calibration were determined. In this study, the location of the overpass in the video is used as the coordinate origin to establish a two-dimensional coordinate system, in which the
X-axis coincides with the lane line in the diversion area, and the
Y-axis is perpendicular to the lane line direction. In addition, to obtain accurate data, it is necessary to take the fixed length and static target in the video as the reference. The lane width of the survey site was 3.75 m. Therefore, the distance value in the coordinate system is calibrated with the lane width as the reference. The calibration diagram is shown in
Figure 2. For the convenience of the following description, the lanes are numbered uniformly. From the deceleration lane inward, the lanes are numbered as 1, 2, 3, and 4.
Second, target tracking and trajectory extraction were carried out. Each vehicle was numbered, a tracking point at the front of the vehicle was created, and the vehicle was tracked in real-time through the automatic tracking function of Tracker software, as shown in the red circle in
Figure 2. The red diamond point in the figure indicates the position of the vehicle at each moment. Because of the large error caused by inaccurate identification in automatic tracking, the speed and acceleration change curve trend of each vehicle will be checked after the automatic tracking is completed, and the vehicle with a large error will be manually marked for tracking to reduce the error and finally obtain complete natural driving track data.
Finally, 1482 pieces of complete natural driving track data were obtained, which contained 322 tracks of heavy vehicles and 1160 tracks of cars. At the same time, the position and other information of each vehicle at any time can be obtained. The relationship between each index value is shown in
Figure 3. On this basis, the vehicle speed, acceleration, and other related indicators can be calculated, mainly including the frame number (time frame), vehicle ID, vehicle type class, vehicle lane number (lane id), vehicle
X-axis speed
vx, vehicle
Y-axis speed
vy, vehicle
X-axis acceleration
ax, vehicle
Y-axis acceleration
ay, vehicle
X-axis coordinate value
X, and the
Y-axis coordinate value
Y.
Table 1 is the extracted track data of a certain part of the vehicle.
2.2.1. Lane-Changing Segment Extraction Criteria
Lane-changing refers to the behavior of the driver driving to the adjacent lane to meet the needs during the driving process. The complete lane-changing process is shown in
Figure 4, which can be divided into discretionary lane-changing and compulsive lane-changing.
Compulsive lane-changing mostly occurs in the ramp junction area, construction area, and when an accident occurs in front of the current lane. This paper does not distinguish between discretionary lane-changing and compulsive lane-changing, but mainly studies the driver’s discretionary lane-changing behavior.
Before extracting the lane-changing segment, the time when the vehicle crosses the lane marking is taken as the key frame, and the starting and ending points of lane-changing are found forward and backward, respectively. In this paper, the longitudinal moving distance of the vehicle within 10 frames is less than 0.1 m, which is the basis for the start and the end of lane-changing, and lane-changing segments are extracted based on this logic. Some lane-changing results and the extracted partial lane-changing data are shown in
Figure 5 below.
2.2.2. Fragment Extraction Results and Analysis
The lane-changing segment extraction was realized based on python. In this process, 374 lane-changing segments were obtained, and the duration of all lane-change segments is 1959 s. The statistical results of the lane-changing segments are shown in
Table 2. It can be seen that Lane 2 has the most lane-changing segments, and the lane-changing segments of trucks are mainly concentrated in Lane 2 and 3.
2.2.3. Characteristic Analysis of Lane-Changing Segment
According to the analysis of the lane-changing characteristics, the density of lane-changing duration and distance are shown in
Figure 6. It can be seen that the duration of the lane-changing segments reaches a peak near 4.5 s, and the duration of most lane-changing segments is between 4 s and 6 s; the lane-changing distance is mainly distributed between 70 m and 100 m, which reaches a peak near 90 m.
2.3. Driving Style Clustering
To cluster the driving style, it is first necessary to obtain the features that can represent the driving style. In this paper, the main extracted features include the distance headway (DHW), time headway (THW), time to collision (TTC), and the inverse of TTC (ITTC). The DHW represents the distance between the front and rear vehicles. The THW represents the time difference between the front and rear vehicles passing through the same place; it can be calculated by dividing the DHW by the following vehicle speed. The TTC indicates the time required for the collision if two vehicles continue to collide at the current speed and on the same path; it can be calculated by dividing the DHW by the speed difference between two vehicles. The minimum, maximum, average, and standard deviation of these indicators can be calculated as features and 12 features were obtained, as shown in
Table 3.
Through analysis of the above indicators, it was found that some indicators are highly correlated, as shown in
Figure 7, which will increase the training time and affect the performance of the model to a certain extent. Therefore, it is necessary to reduce the dimension of the primal data.
This paper normalizes the features and reduces the dimension by PCA. Feature normalization and PCA dimensionality reduction based on Python can obtain the cumulative contribution rate of the principal components, as shown in
Figure 8. It can be seen that the first four principal components have been able to represent more than 85% of the information of the original features. Therefore, this paper selects the first four principal components for subsequent analysis.
The K-means algorithm is the most commonly used unsupervised clustering algorithm, which divides a group of samples into several clusters without intersections [
28]. An important step in K-means is to place the initial centroid. Theoretically, K-means must converge after a long time of operation, but the sum of squares in the cluster may converge to the local minimum. Whether it can converge to the real minimum depends largely on the initialization of the centroid. If the initial centroid is placed at different positions, the clustering results are likely to be inconsistent. A good centroid selection can make K-means avoid more calculations and make the algorithm converge stably and faster. The traditional K-means algorithm uses a random method to extract the samples from the sample points as the initial centroid, which has certain limitations. The improved k-means++ algorithm based on the traditional K-means algorithm can make the initial centroids far away from each other, to guide more reliable results than random initialization. When the k-means++ algorithm selects K cluster centers, it selects the first cluster center by a random method [
29]. When selecting the next cluster center, it will give priority to the samples farther away from the selected cluster center. This cycle will continue until all cluster centers are selected. Although the improved principle of the k-means++ algorithm is simple, it is more effective than the traditional K-means algorithm.
In this paper, the k-means++ algorithm is used for driving styles cluster analysis. The data involved in clustering is the vehicle driving data after the dimension reduction (DHW, THW, TTC, ITTC) when the number of clusters is two, three, four, and five, respectively, which can obtain the silhouette coefficient results, as shown in
Figure 9. The red line in each figure represents the average silhouette coefficient of the current cluster. In the clustering results, the silhouette coefficients of the samples on the right side of the red line are higher than the average silhouette coefficient, which plays a positive role in the average silhouette coefficient of the model. It can be seen that negative values of the silhouette coefficient occur under different clustering results, but the proportion of negative values of the silhouette coefficient is smaller when the cluster number is three.
The silhouette coefficients (SC) and Calinski–Harabasz (CH) scores of the different clustering results are shown in
Figure 10, it can be seen that the average SC are 0.340, 0.451, 0.389, and 0.371 and the CH score is 143.5, 573.3, 594.3, and 537.7 when the cluster number is two, three, four, and five clusters, respectively. Although the CH score is higher when the cluster number is four, the SC score is relatively low at this time, while the SC and CH scores are high when the cluster number is three, so it is more reasonable to set the number of clusters to three.
On this basis, the index values of each cluster of driving behavior are analyzed and the density map of lane-changing time is shown in
Figure 11. It can be seen that the three types of driving behaviors obtained from the k-means++ clustering have significant differences, cluster 1, cluster 2, and cluster 3 can represent the “conservative”, “ordinary”, and “aggressive” driver styles. The average time required for lane-changing under the various driving styles is 4.88 s, 6.65 s, and 8.41 s, respectively. Conservative drivers are the most cautious. They will change lanes when the traffic environment risks are extremely low. The operation of lane-changing is relatively stable and smooth, so the lane-changing time is the longest; on the contrary, the operation of aggressive drivers is slightly aggressive, so the lane change time is the shortest. There are obvious differences in the safety of various driving behaviors. The three types of driving styles will be used as features for the following research on vehicle lane change intention recognition.
2.4. Driving Style Classification
The premise of establishing the model to predict the driver style is to extract the driving characteristics of the target vehicle and the surrounding vehicles, including the speed, acceleration, distance, and other indicators. The specific indicators are shown in
Table 4. The surrounding vehicles mainly refer to the front vehicle (FV) and the rear vehicle (RV).
It will cause “overfitting” or “underfitting” when the model has too many or too few features. Appropriate features can reduce the complexity of the model and improve training accuracy. The optimization method (RFECV) based on recursive feature elimination (REF) is adopted to screen important features in this paper. First, all features are modeled and sorted according to their importance. After deleting one or several features with the lowest importance, the modeling and analysis are conducted again. The cycle is repeated until the importance of all the features is sorted. The final feature importance ranking is shown in
Table 5.
The random forest algorithm can complete the task of classification and regression, and the default parameters have a well performance on most data sets. The random forest algorithm is adopted to classify and predict the results after the k-means++ clustering in this paper; 70% of the data is divided into the training set and 30% into the test set. The final prediction results of the trained model are shown in
Table 6. Cluster 1, cluster 2, and cluster 3 can represent the “conservative”, “ordinary”, and “aggressive” driver styles, of which the corresponding labels in the classification model are class 0, class 1, and class 2. The model has the highest prediction accuracy and recall for the aggressive driving style. That is, the model can identify the aggressive driving style well. The main reason is that the aggressive sample data is more recognizable than the other two types of feature distribution. It is also more practical to accurately identify the aggressive style in practical applications.
The ROC and PR curves of the random forest model are shown in
Figure 12. It can be seen that the area under the ROC and PR curves is greater than 0.9, almost approaching 1, which indicates that the model can distinguish three types of samples well.
3. Lane-Changing Recognition Model
Machine-learning models including XGBoost (extreme gradient boosting), LightGBM (light gradient boosting machine), and the Stacking fusion model are often used by scholars for recognition and prediction research. Compared with the traditional gradient lifting algorithm (GBDT), XGBoost is faster. At present, the algorithm has an excellent performance in classification and regression analysis. LightGBM avoids some shortcomings of XGBoost, such as the high requirements for computing devices and the large consumption of hardware facilities, and the training speed of the LightGBM model is faster, consumes less memory, and has a higher accuracy. As the best method to improve the effectiveness of the machine learning model, the Stacking fusion model can further improve the prediction accuracy based on the traditional integrated model which uses multi-fold cross-validation, so the results of the model are more stable, but the process of stacking generally takes a long time. This paper uses three different methods to identify lane-changing behavior and selects a suitable model for the exit of the urban expressway.
To improve the accuracy of the lane-changing intention recognition model, lane-changing recognition is analyzed from two aspects: a single time point in the lane-changing window and the whole historical segment of the lane-changing window.
The former mainly considers the characteristics of a time in the lane-changing window, and the latter considers the characteristics of each period in the whole lane-changing window. For each moment, the extracted features mainly include the horizontal and vertical speed and acceleration of the target vehicle, the distance from the self-vehicle to the left and right lane lines, the relative speed, relative acceleration, and relative distance of the target vehicle and the surrounding vehicles, as well as the type of self-vehicle and the surrounding vehicles and the driver’s driving style. For any vehicle at each time, it must belong to the set {TV, FV, RV, LFV, LPV, LRV, RFV, RPV, RRV}. TV represents the target vehicle, FV represents the vehicle in front of the target vehicle, RV represents the vehicle behind the target vehicle, LFV represents the vehicle in front of the target vehicle on the left, LPV represents the vehicle adjacent to the target vehicle on the left, LRV represents the vehicle behind the target vehicle on the left, RFV represents the vehicle in front of the target vehicle on the right, RPV represents the vehicle adjacent to the target vehicle on the right, and RRV represents the vehicle behind the target vehicle on the right.
The relative positions of the target vehicle and the surrounding vehicles are shown in
Figure 13. If the vehicle at a corresponding position does not exist, its corresponding characteristics are set to null. Finally, the characteristic meanings and symbols of the features extracted at each time point are the same as those in
Table 4. In addition, the driver styles of the target vehicle and surrounding vehicles are added. This value is the label of the driving style cluster. The new features are shown in
Table 7. Zero, one, and two represent “conservative”, “ordinary”, and “aggressive” driving styles, respectively.
3.1. Lane-Changing Intention Recognition Model Considering Single-Time Point Characteristics
To analyze the effect of the three models on lane-changing recognition, the starting point time of lane-changing is taken as the modeling time, and the instantaneous characteristic values of left lane-changing and right lane-changing track segments are extracted at this time. All sample data were divided into the training set and test set, in which the training set accounts for 70% and the test set accounts for 30%. On this basis, XGBoost, LightGBM, and the Stacking fusion model were trained and tested respectively.
The final prediction results of the three models are shown in
Table 8, respectively. It can be seen that XGBoost and LightGBM have the same accuracy in lane-changing intention recognition. However, the XGBoost algorithm has a longer training time and better fitting effect on various data. The Stacking fusion model also has a good performance in lane-changing intention recognition, the recognition accuracy of lane-changing to the right is even close to 100%, but the comprehensive realization of the fusion model is less improved than that of a single model. On the one hand, it may be that the two integrated algorithm models of XGBoost and LightGBM have a strong enough prediction ability, so it is difficult to improve the accuracy to a new level by modeling skills alone. At the same time, the amount of sample data is too small, so the model cannot learn a lot of effective information, which limits the upper limit of the model to a certain extent.
It can be seen that the Stacking fusion model can well recognize the driving intention. The model has a high recognition accuracy for the driving behavior of left lane-changing and right lane-changing; the classifications of the latter are correct basically, but the recognition accuracy of left lane-changing is lower than the right. On the one hand, the difference between the two kinds of characteristic information is not very obvious. On the other hand, this kind of sample accounts for the least proportion in the original sample, which results in insufficient learning of this behavior.
To study the accuracy of the model for lane-changing intention recognition at different single time points, the lane-changing intention time window is set to a fixed length, which is set to 3 s in this paper. The prediction accuracy, model training duration, and other information of each time point model are recorded respectively. The final statistics of some modeling results are shown in
Table 9.
It can be seen that the prediction accuracy of the three models has been able to maintain an accuracy above 80% in the first two seconds of the lane-changing. However, 2 s before the start of the lane-changing, the prediction accuracy decreased significantly and the accuracy is basically below 80%. The prediction results of the three models are similar, but the training time of LightGBM is less than XGBoost, which is also an important reason why LightGBM has been widely used in the engineering field in recent years.
The curves of the lane-changing intention recognition accuracy of the three models at different times within 3 s before and after the start of the lane-changing are shown in
Figure 14; the XGB_score, LGB_score, and Stacking_score, respectively, represent the accuracy of the three models. The negative timestamp indicates the time before lane-changing, which means how much time is left before the lane-changing occurs.
The result shows that the second before the starting time point of lane-changing is an important dividing point. The prediction accuracy of each model before this point drops to a low level, and they fluctuate greatly. This is because as the modeling time is too early, the vehicle may not show obvious behavior characteristics that can represent the intention of the lane-changing, so the recognition accuracy decreases. After the start of the lane-changing, the three model bases tend to be stable, and the prediction accuracy reaches the maximum value. In general, the difference between the recognition results is small, but the recognition accuracy of the Stacking fusion model is better than a single machine learning model, and the performance of the overall model is better considering the single-time point characteristics.
3.2. Lane-Changing Intention Recognition Model Considering Historical Time Window Characteristics
The above models only consider the characteristics of a certain time point in the lane-changing window. However, the process of the vehicle during the whole lane-changing stage, from the generation of the lane-changing intention to the end of the lane-changing, has a certain memory effect, and the vehicle state at the current moment will affect the state at the next moment. Thus, it is not comprehensive to consider the characteristics of a certain time point alone. Inspired by this, considering the characteristics of each time, the lane-changing window is set to different time thresholds. For each lane-changing window with a fixed length of time, all the characteristics in the whole lane-changing window are extracted.
The maximum time length of the lane-changing window was set as 3 s and decreased in steps of 0.12 s to get a total of 24 lane-changing window lengths. Three models were built separately and tested at different lane-changing window lengths. The curves of the accuracy of the three models are drawn in
Figure 15 to intuitively show the impact of different lane-changing window lengths on the accuracy of lane-changing recognition models. It can be seen that there is little difference in the prediction accuracy of different lane-changing window lengths. However, the accuracy of the three models is at a high level when the lane-changing window length is about 2.2 s, and the LightGBM model and Stacking fusion model are higher than XGBoost. Whether the length of the lane-changing window is too long or too short, the prediction accuracy is reduced. Therefore, the length of the lane-changing window is determined as 2.2 s for subsequent research and analysis.
Models were established to recognize the lane-changing intention at each time point within 2.2 s before the starting time point of the lane-changing. The step size was taken as 0.12 s and the prediction results of 18 different time points were obtained. The specific results of each model are shown in
Table 10. It can be seen that the accuracy of the three models has less difference, the Stacking fusion model has the best comprehensive effect. With the regression of the prediction time, the accuracy of the three models decreases to a certain extent.
The curve of the prediction accuracy of the three models is drawn as shown in
Figure 16. The result shows that the accuracy decreases continuously with the regression of the prediction time, especially from 1.5 s before the start time point of lane-changing, where the decline speed increases. This is because as the prediction time moves back, the characteristics of the lane-changing behavior are not obvious, so the learning effect of the model on lane-changing is poor.
4. Evaluation and Discussion Section
The accuracy of the traditional lane-changing recognition methods (SVM, LSTM) is maintained at about 93% [
7,
8,
11]. To compare with the model in this paper, the confusion matrix is drawn as shown in
Figure 17. XGB_ history, LGB_ history, and Stacking_ history, respectively, represent the accuracy of the three models of considering the historical time window, which means for each lane-changing window with a fixed length of time, all the characteristics in the whole lane-changing window are extracted. XGB_ moment, LGB_ moment, and Stacking_ moment, respectively, represent the accuracy of the three models of considering single-time point characteristics, which means the model only considers the characteristics of a certain time point in the lane-changing window.
It can be seen that the Stacking fusion model can well identify the driving intention, whether considering a single-time point or the historical time window; the accuracy of the XGBoost and LightGBM models for the lane-changing intention recognition is similar. The recognition accuracy of the model for changing lanes to the right is at a high level, which can identify most samples correctly, but the recognition accuracy of the model for changing lanes to the left is lower. This may be because the left lane-changing sample accounts for the least proportion in the original sample, which results in the model’s insufficient learning of this kind of driving behavior.
By comparing the lane-changing intention recognition models that only consider the single time point feature and consider the historical time window feature, it can be found that the three models have good effects. In general, the prediction accuracy of the Stacking fusion model is the highest and the training speed of the LightGBM model is the fastest. The accuracy of all models under the two types is drawn in
Figure 18. The curve with the suffix “history” represents the model considering the characteristics of the historical time window, and the curve with the suffix “moment” is the model considering only the characteristics of a single time point. It can be found that the difference between the prediction results based on the two feature information is small when it is close to the start time of lane-changing, but the difference increases significantly with the regression of the prediction time.
In addition, it can be seen that the prediction accuracy of the lane-changing intention recognition model considering the characteristics of the historical time window is higher, which can guarantee an accuracy of more than 90% after 1.6 s before the start time point of lane-changing, while the accuracy of more than 90% can be guaranteed after 0.6 s before the start time point of lane-changing for the model considering only the characteristics of a single time point. At the same time, the model considering the historical time window feature can still ensure an accuracy of more than 82% at 2.2 s before the lane-changing time point, but the accuracy of the model considering only the feature of a single time point is about 78%, which indicates that the model considering the historical time window feature has a better comprehensive performance in lane-changing intention recognition. In addition, the prediction accuracy of the model that only considers the characteristics at a single time point has a sudden change at 2 s before the time point of lane-changing, which is likely caused by the instability of the characteristic information at this time.
5. Conclusions
The main conclusions of this study are as follows:
1. In this paper, the safety evaluation indexes including TTC, ITTC, THW, and DHW were calculated by lane-changing data. When k-means++ is used to group the driving style into three clusters, the silhouette coefficient of the evaluation index of the model reaches its height. The clustering result is selected as the driving style label value of the track segment, and the features are further extracted to establish the random forest models to identify the driving style. The results show that the accuracy of the random forest model is 93%, thus it is able to identify driving style well. Because different driving styles directly affect the driving characteristic information before the lane-changing, compared with the traditional lane-changing recognition model, this paper adds the driving style variable to the parameters of the lane-changing recognition model to improve the recognition accuracy of the model.
2. XBGoost, LightGBM, and the Stacking fusion model are established to recognize the lane-changing intention. At present, most models only consider the characteristics of a single time point. This study compares the lane-changing intention recognition models that only consider the characteristics of a single time point with those that consider the characteristics of the historical time window. The results show that the model which considers the characteristics of the historical time window can still achieve a recognition rate of more than 85% at 2 s before the starting time point, and the accuracy is higher than that of the model which only considers the characteristics of a single time point. At the same time, all three models can better identify the lane-changing intention, but the Stacking fusion model has the highest comprehensive accuracy, and the training speed of LightGBM is much faster than XGBoost, so it should be gradually applied more and more widely in the practical engineering field.
This paper only analyzes and studies the vehicle driving track in the urban expressway diversion area. The data source is relatively simple, but the vehicle driving area will involve various types of roads and traffic environments. In the future, it is necessary to conduct a comprehensive study on the driver’s style, vehicle lane-changing intention recognition, and driving track prediction in different traffic environments.


