
Parametric Analysis on the Effect of Dynamic Interaction between Nonlinear Soil and Reinforced Concrete Frame

Abstract
:1. Introduction
2. Numerical Method and Its Validation
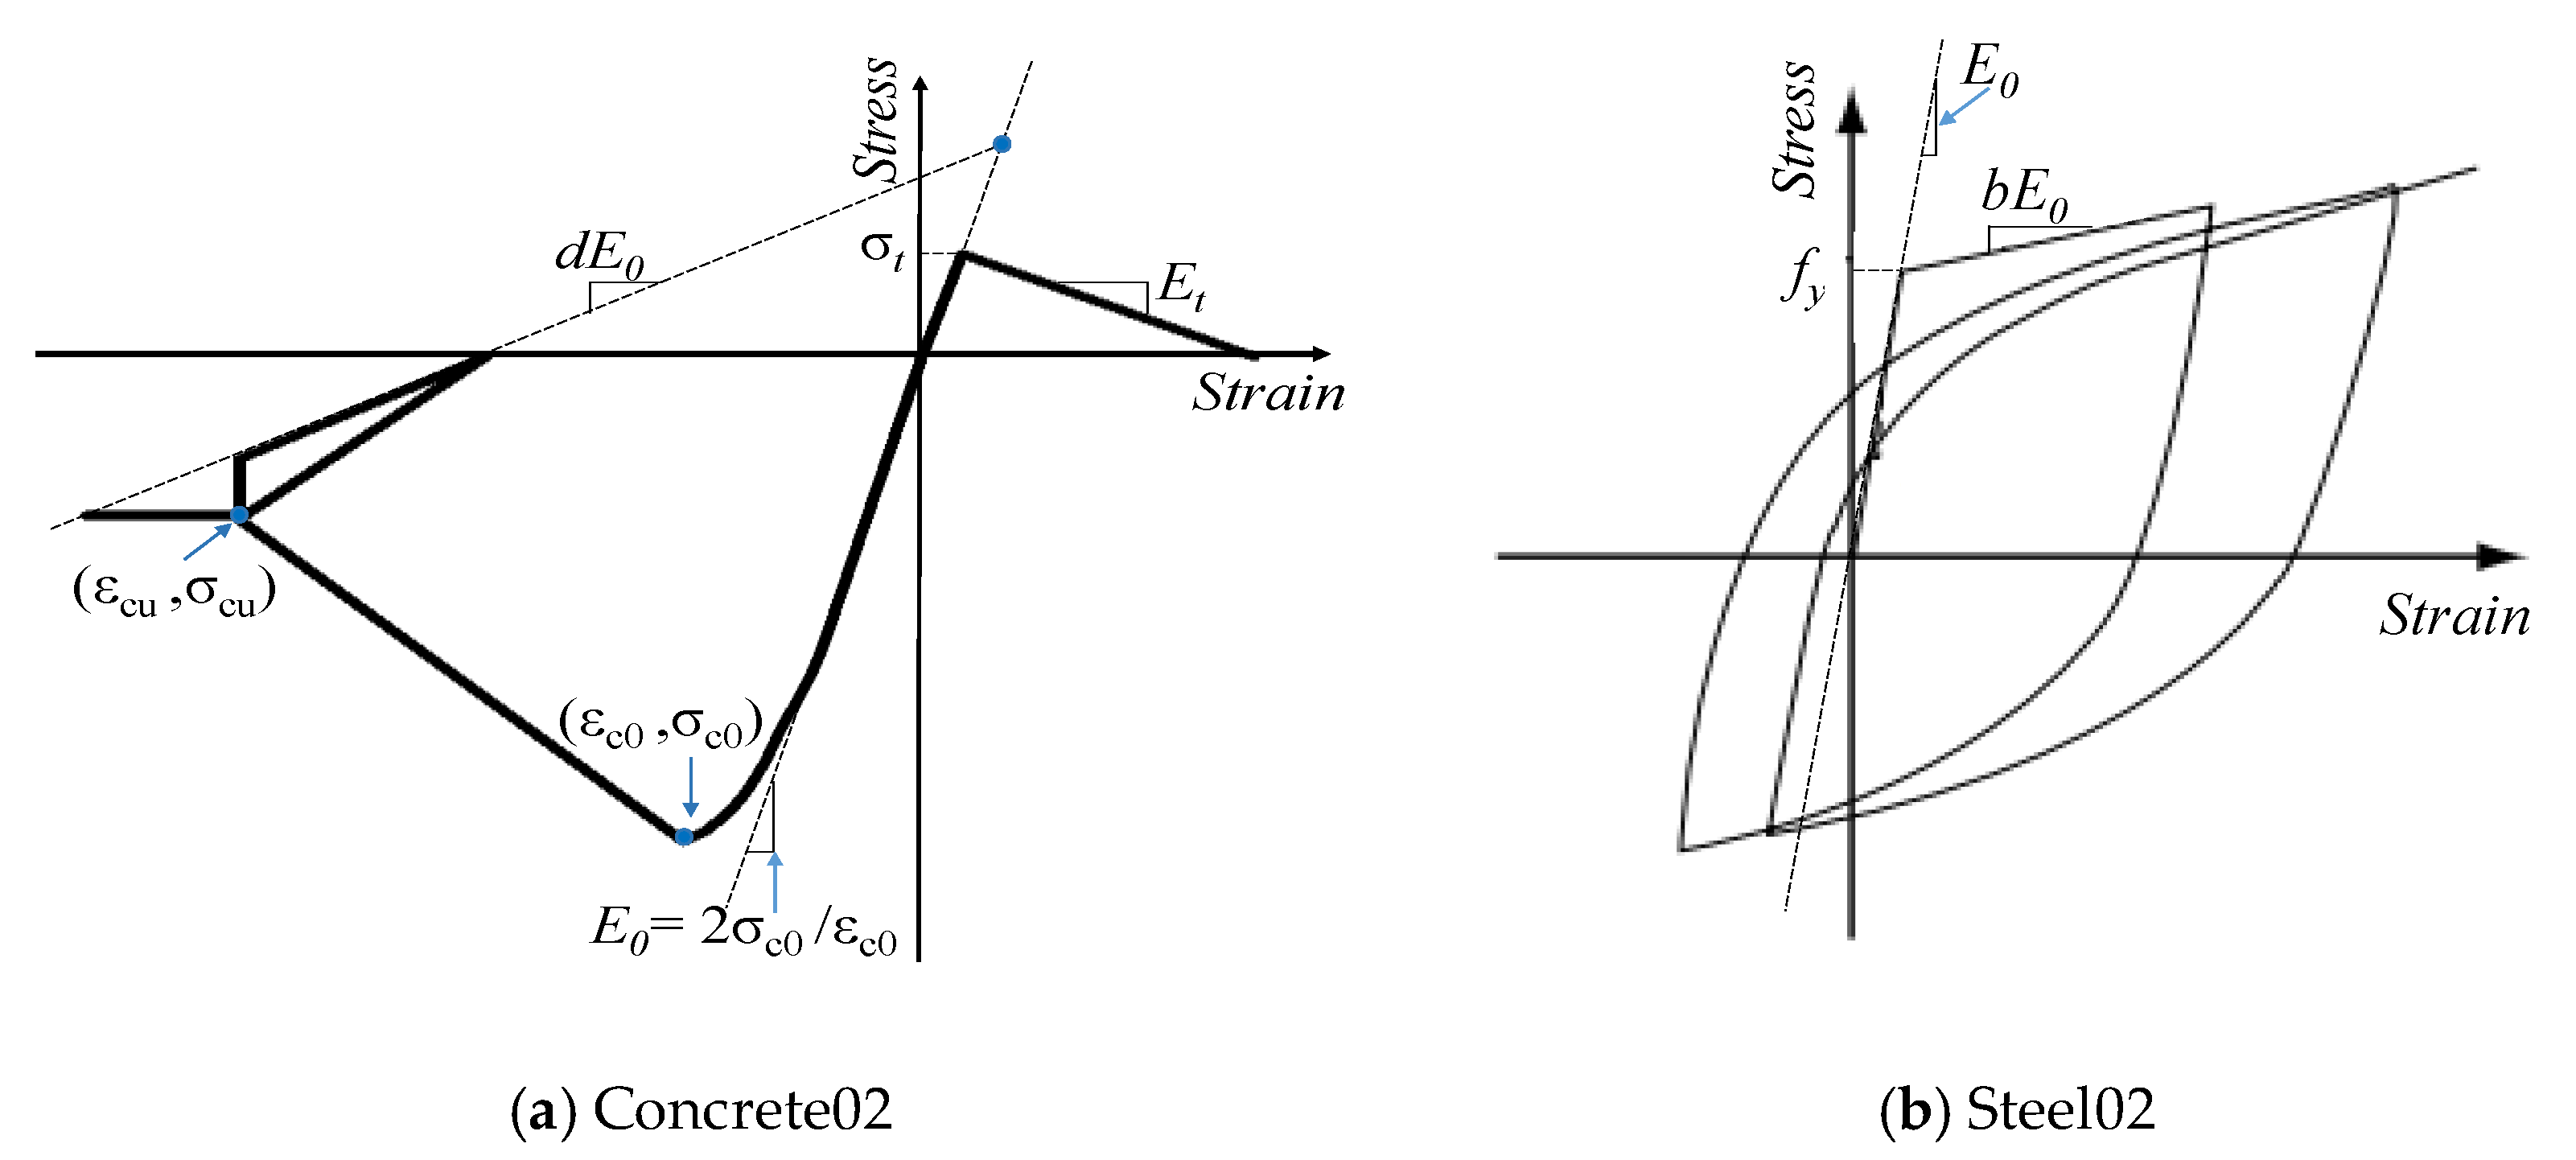
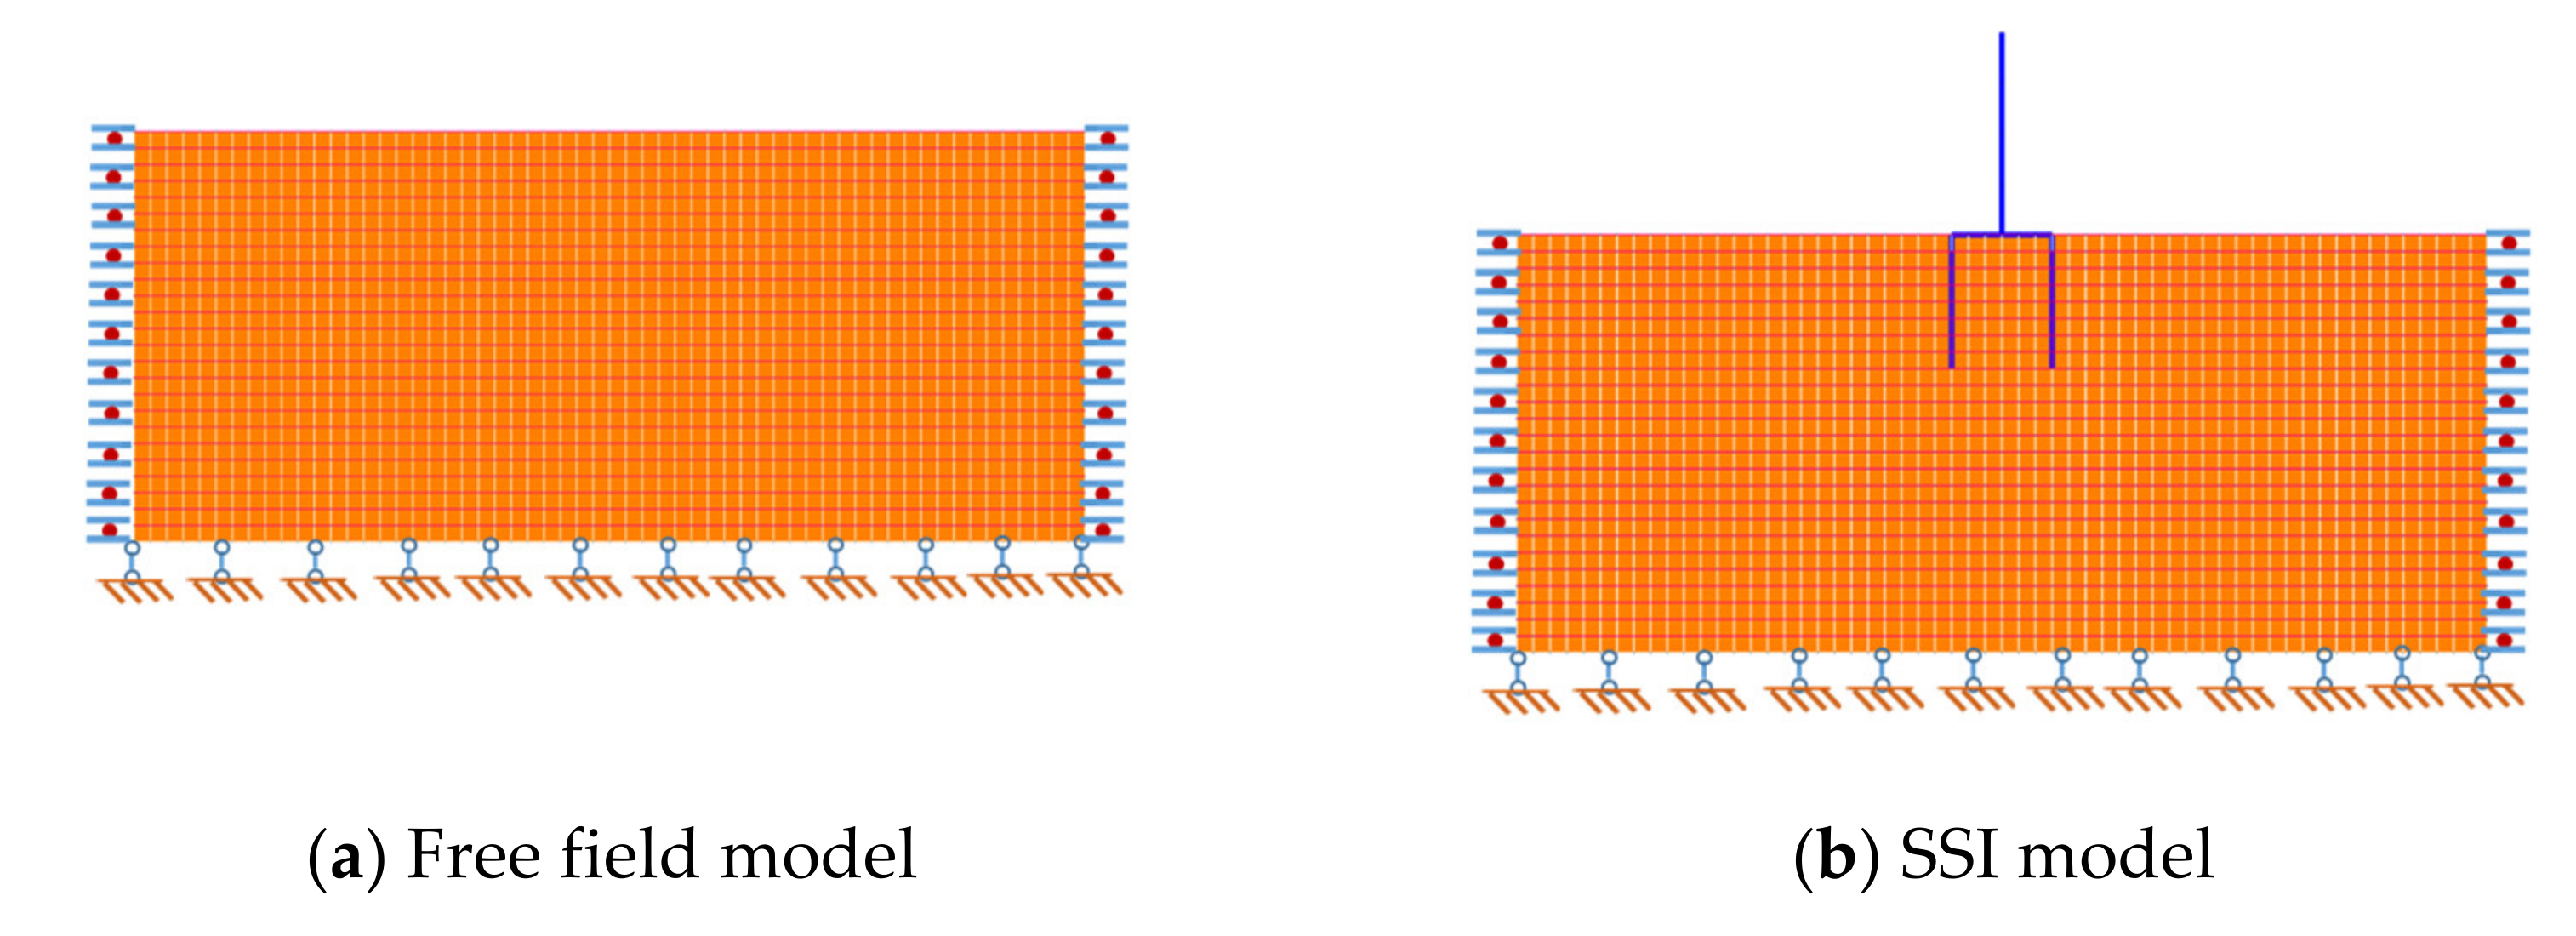
2.1. Numerical Model
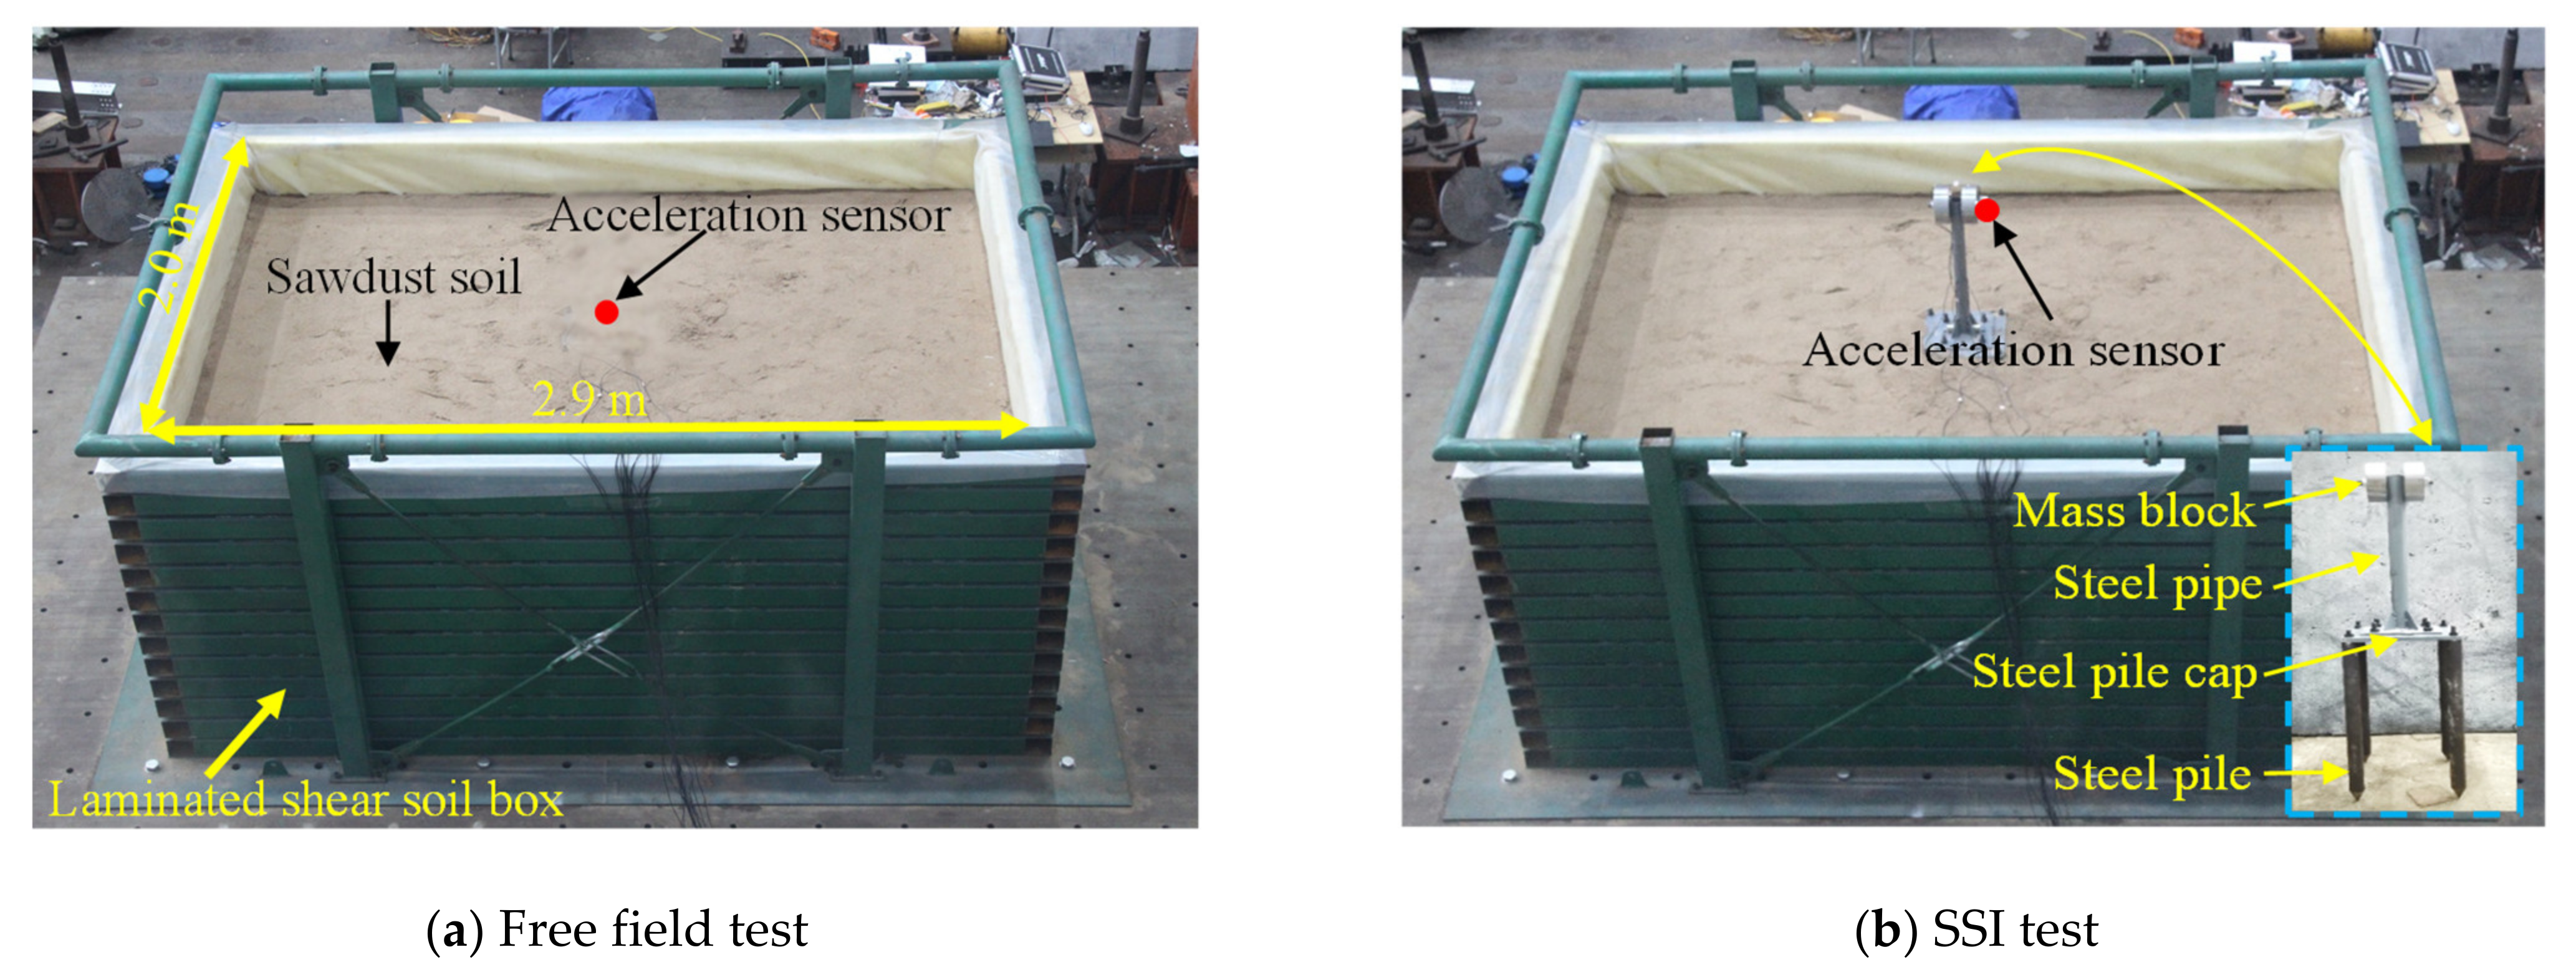
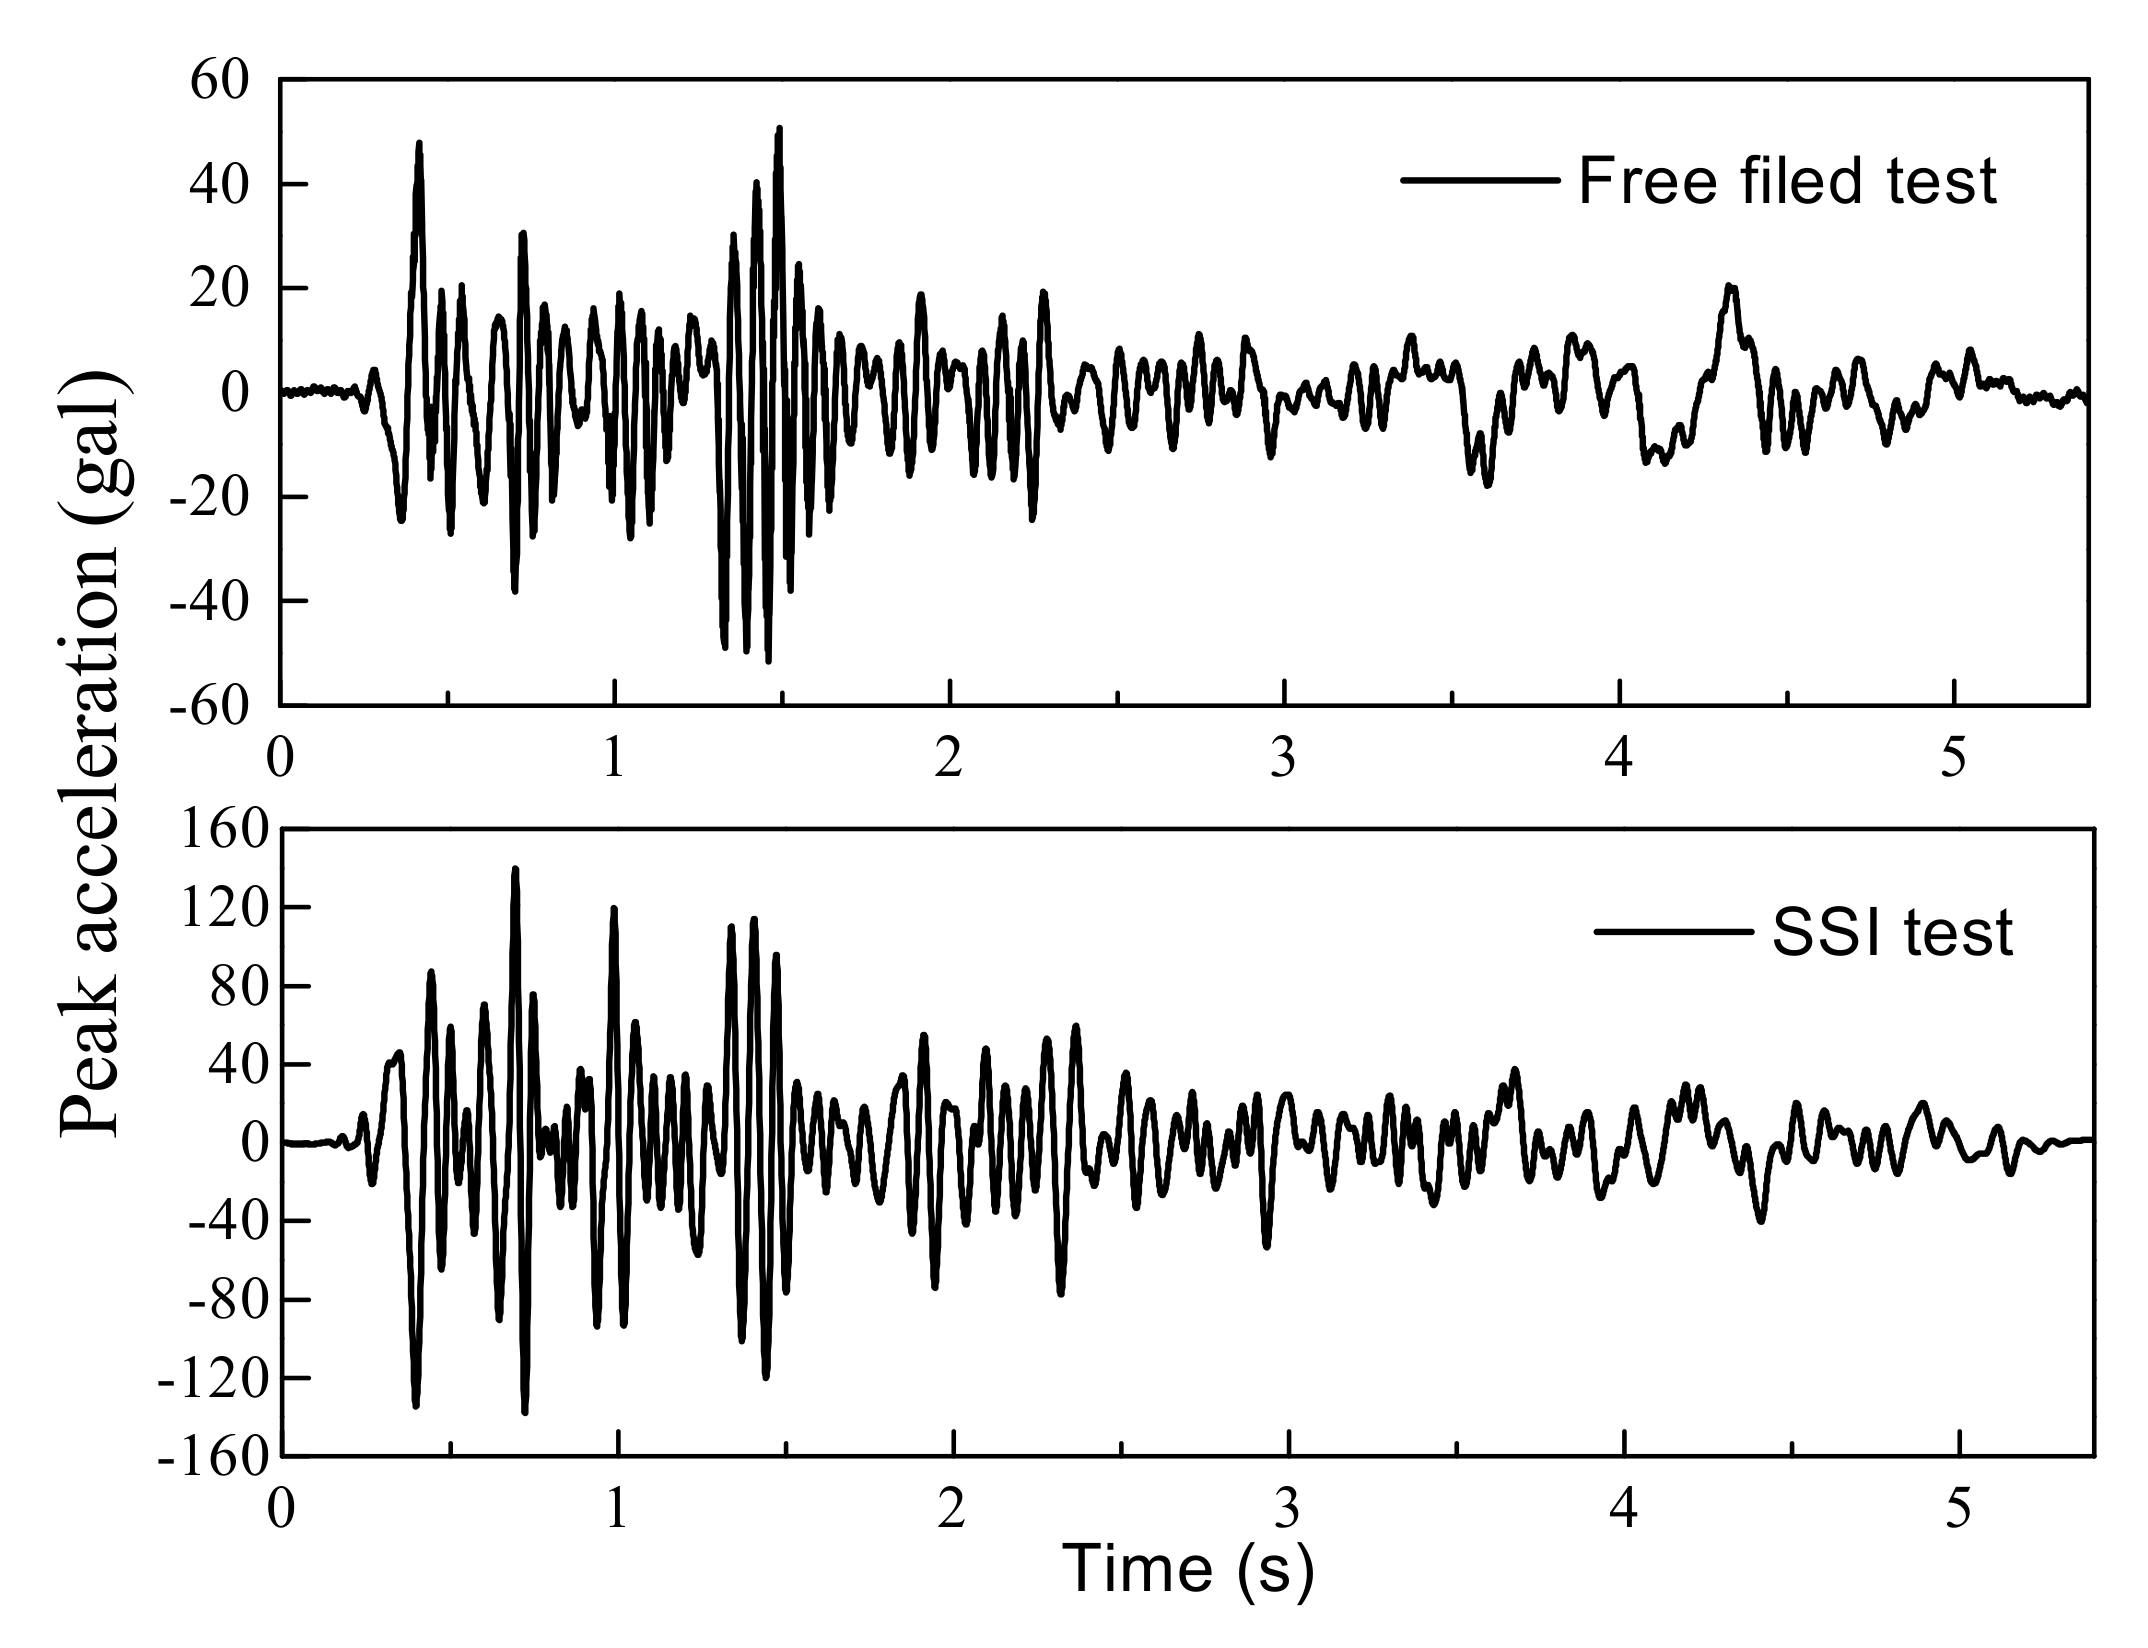
2.2. Validation of Numerical Model
3. Influence of the Structure Frequency, Soil Shear Wave Velocity, and Spectral Characteristic of the Seismic Record
3.1. Definition of Evaluation Metrics
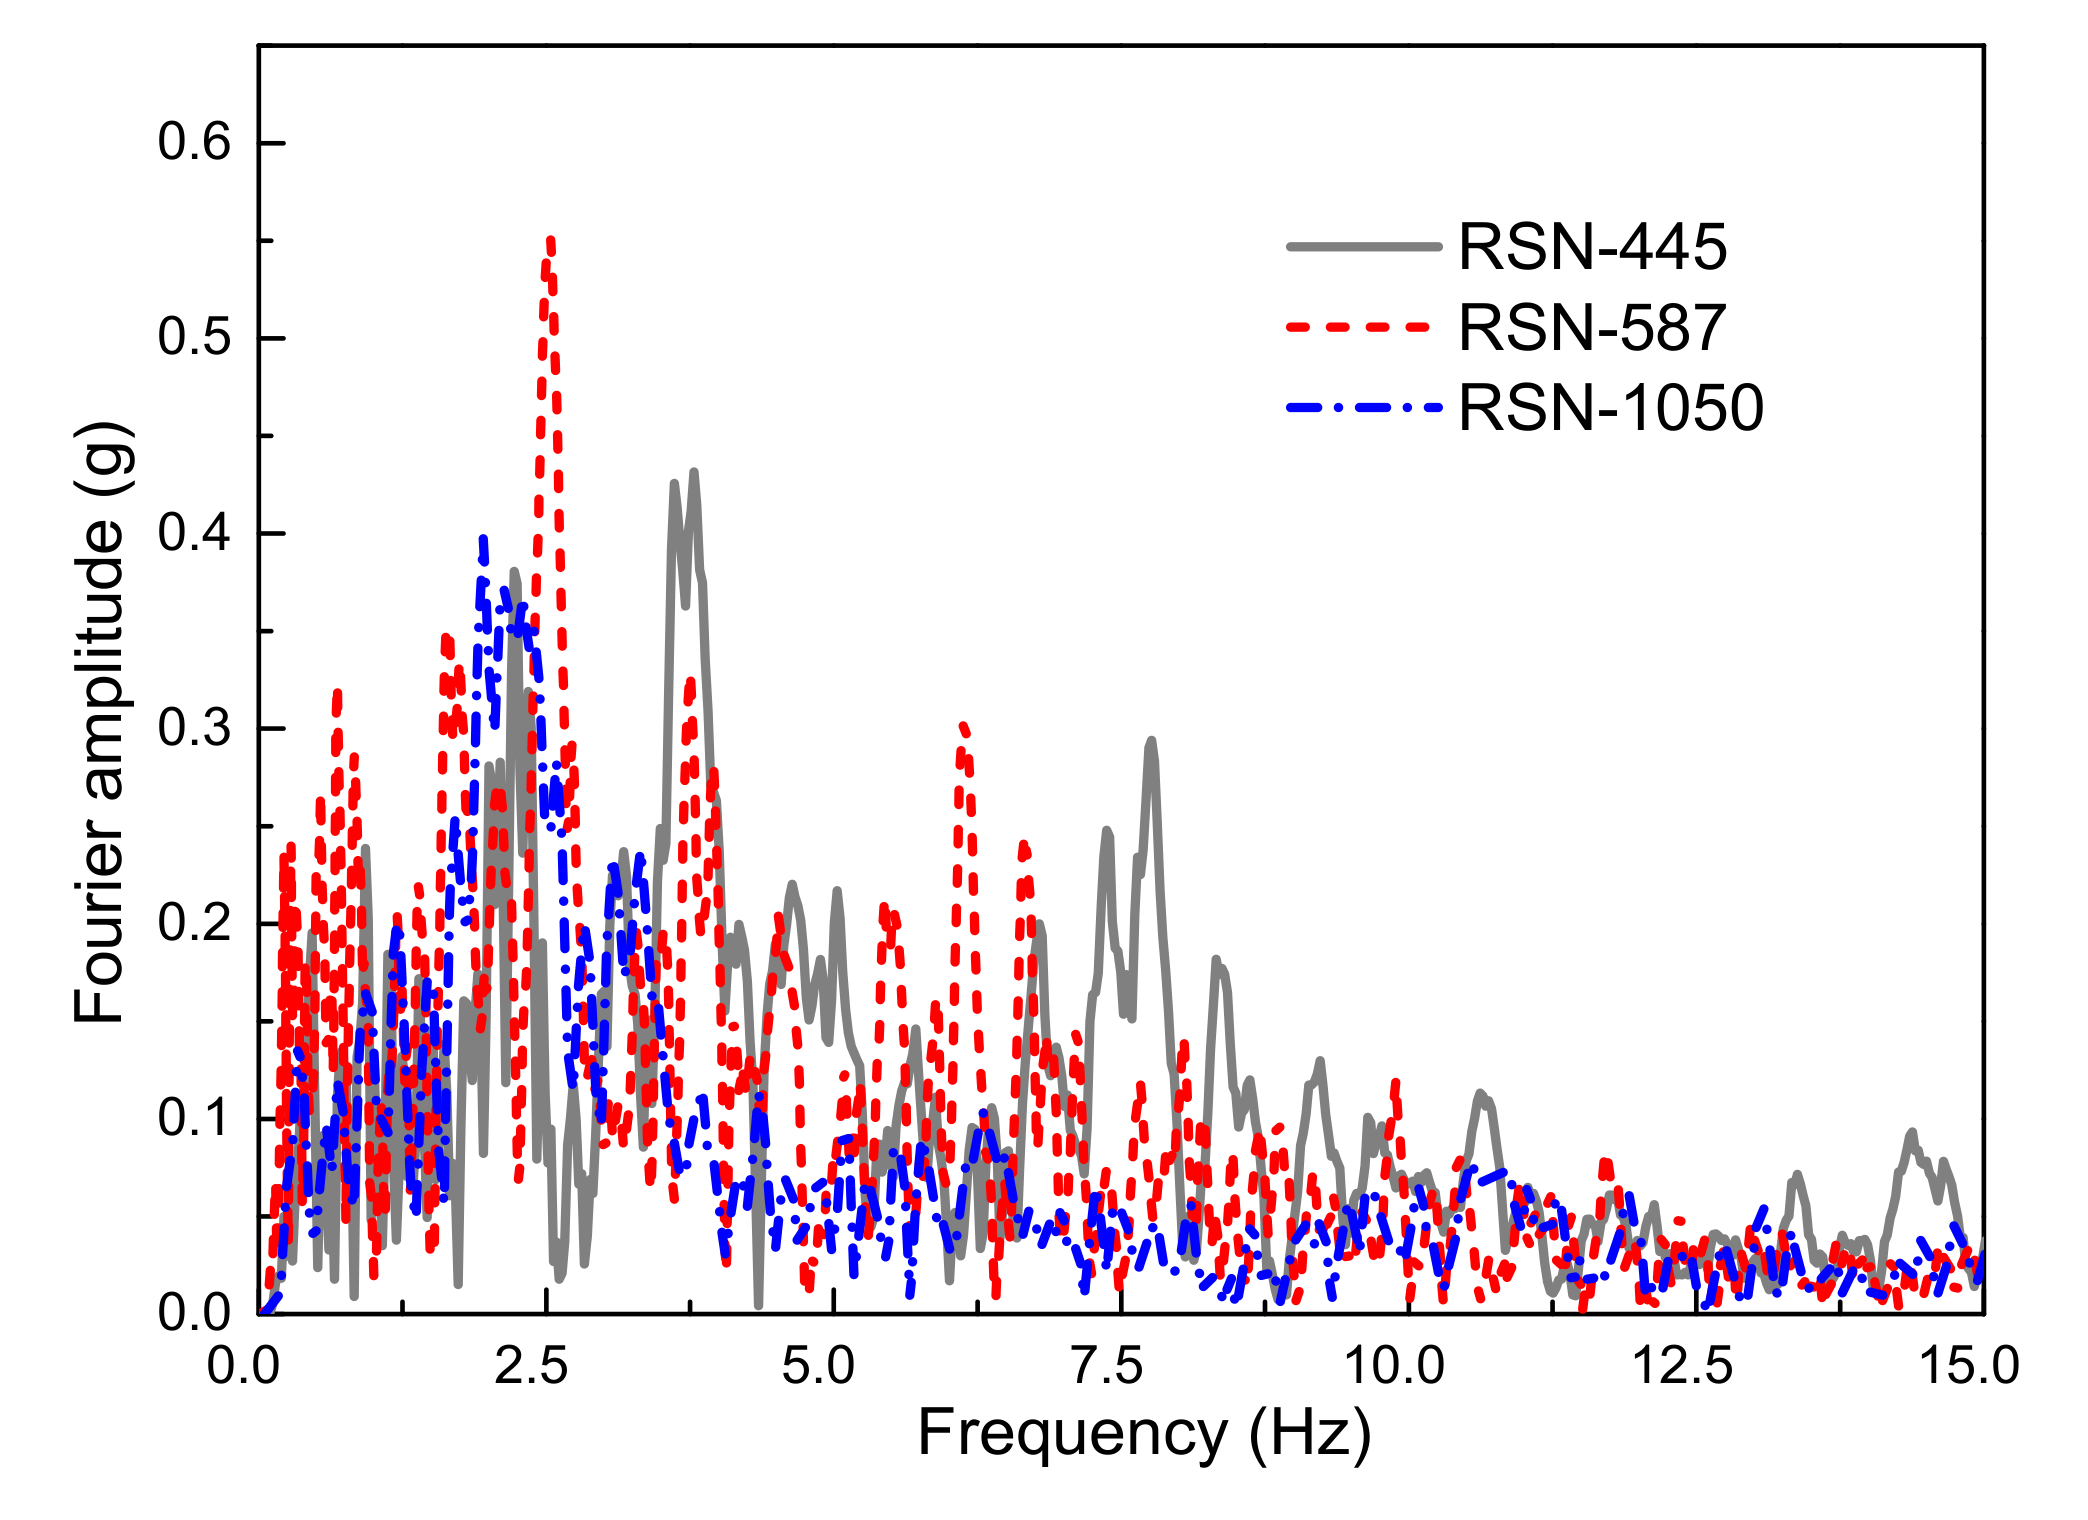
3.2. Parameter Setup
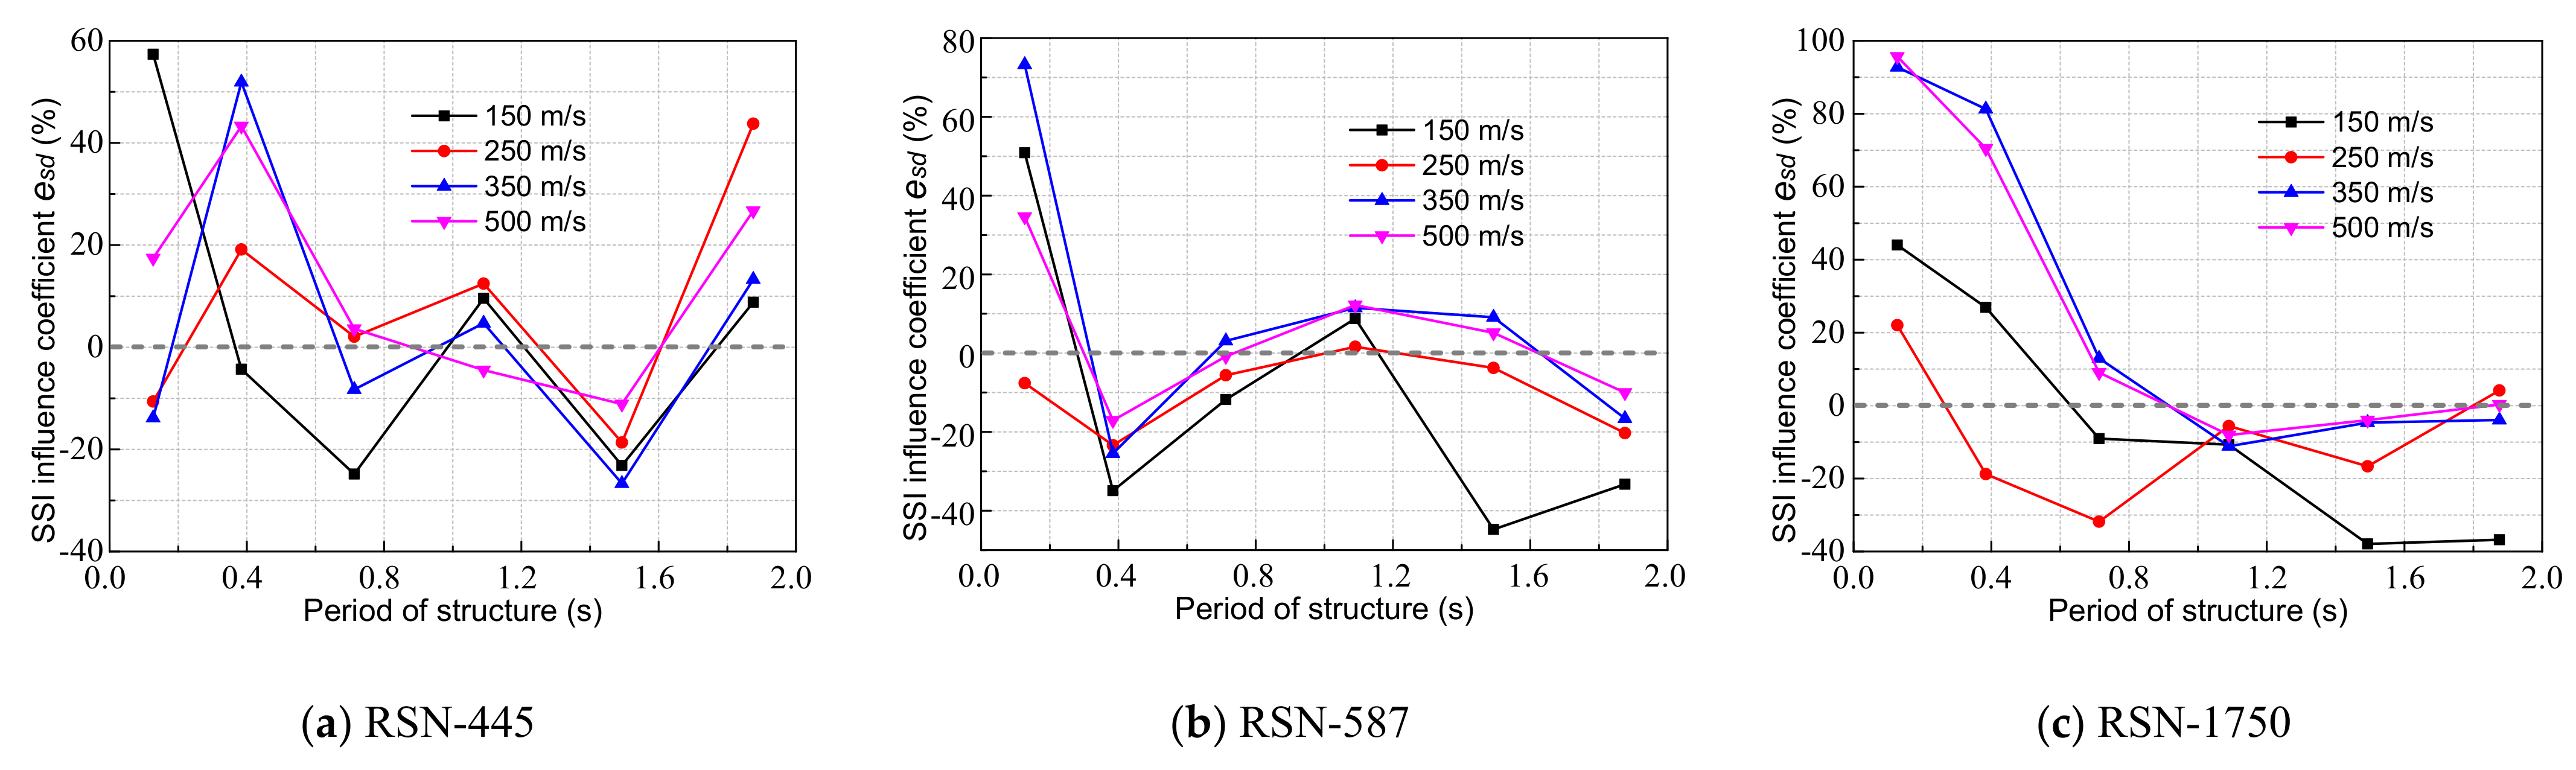
3.3. Result Analysis
4. Influence of Pile Length and Pile Diameter
4.1. Pile Length
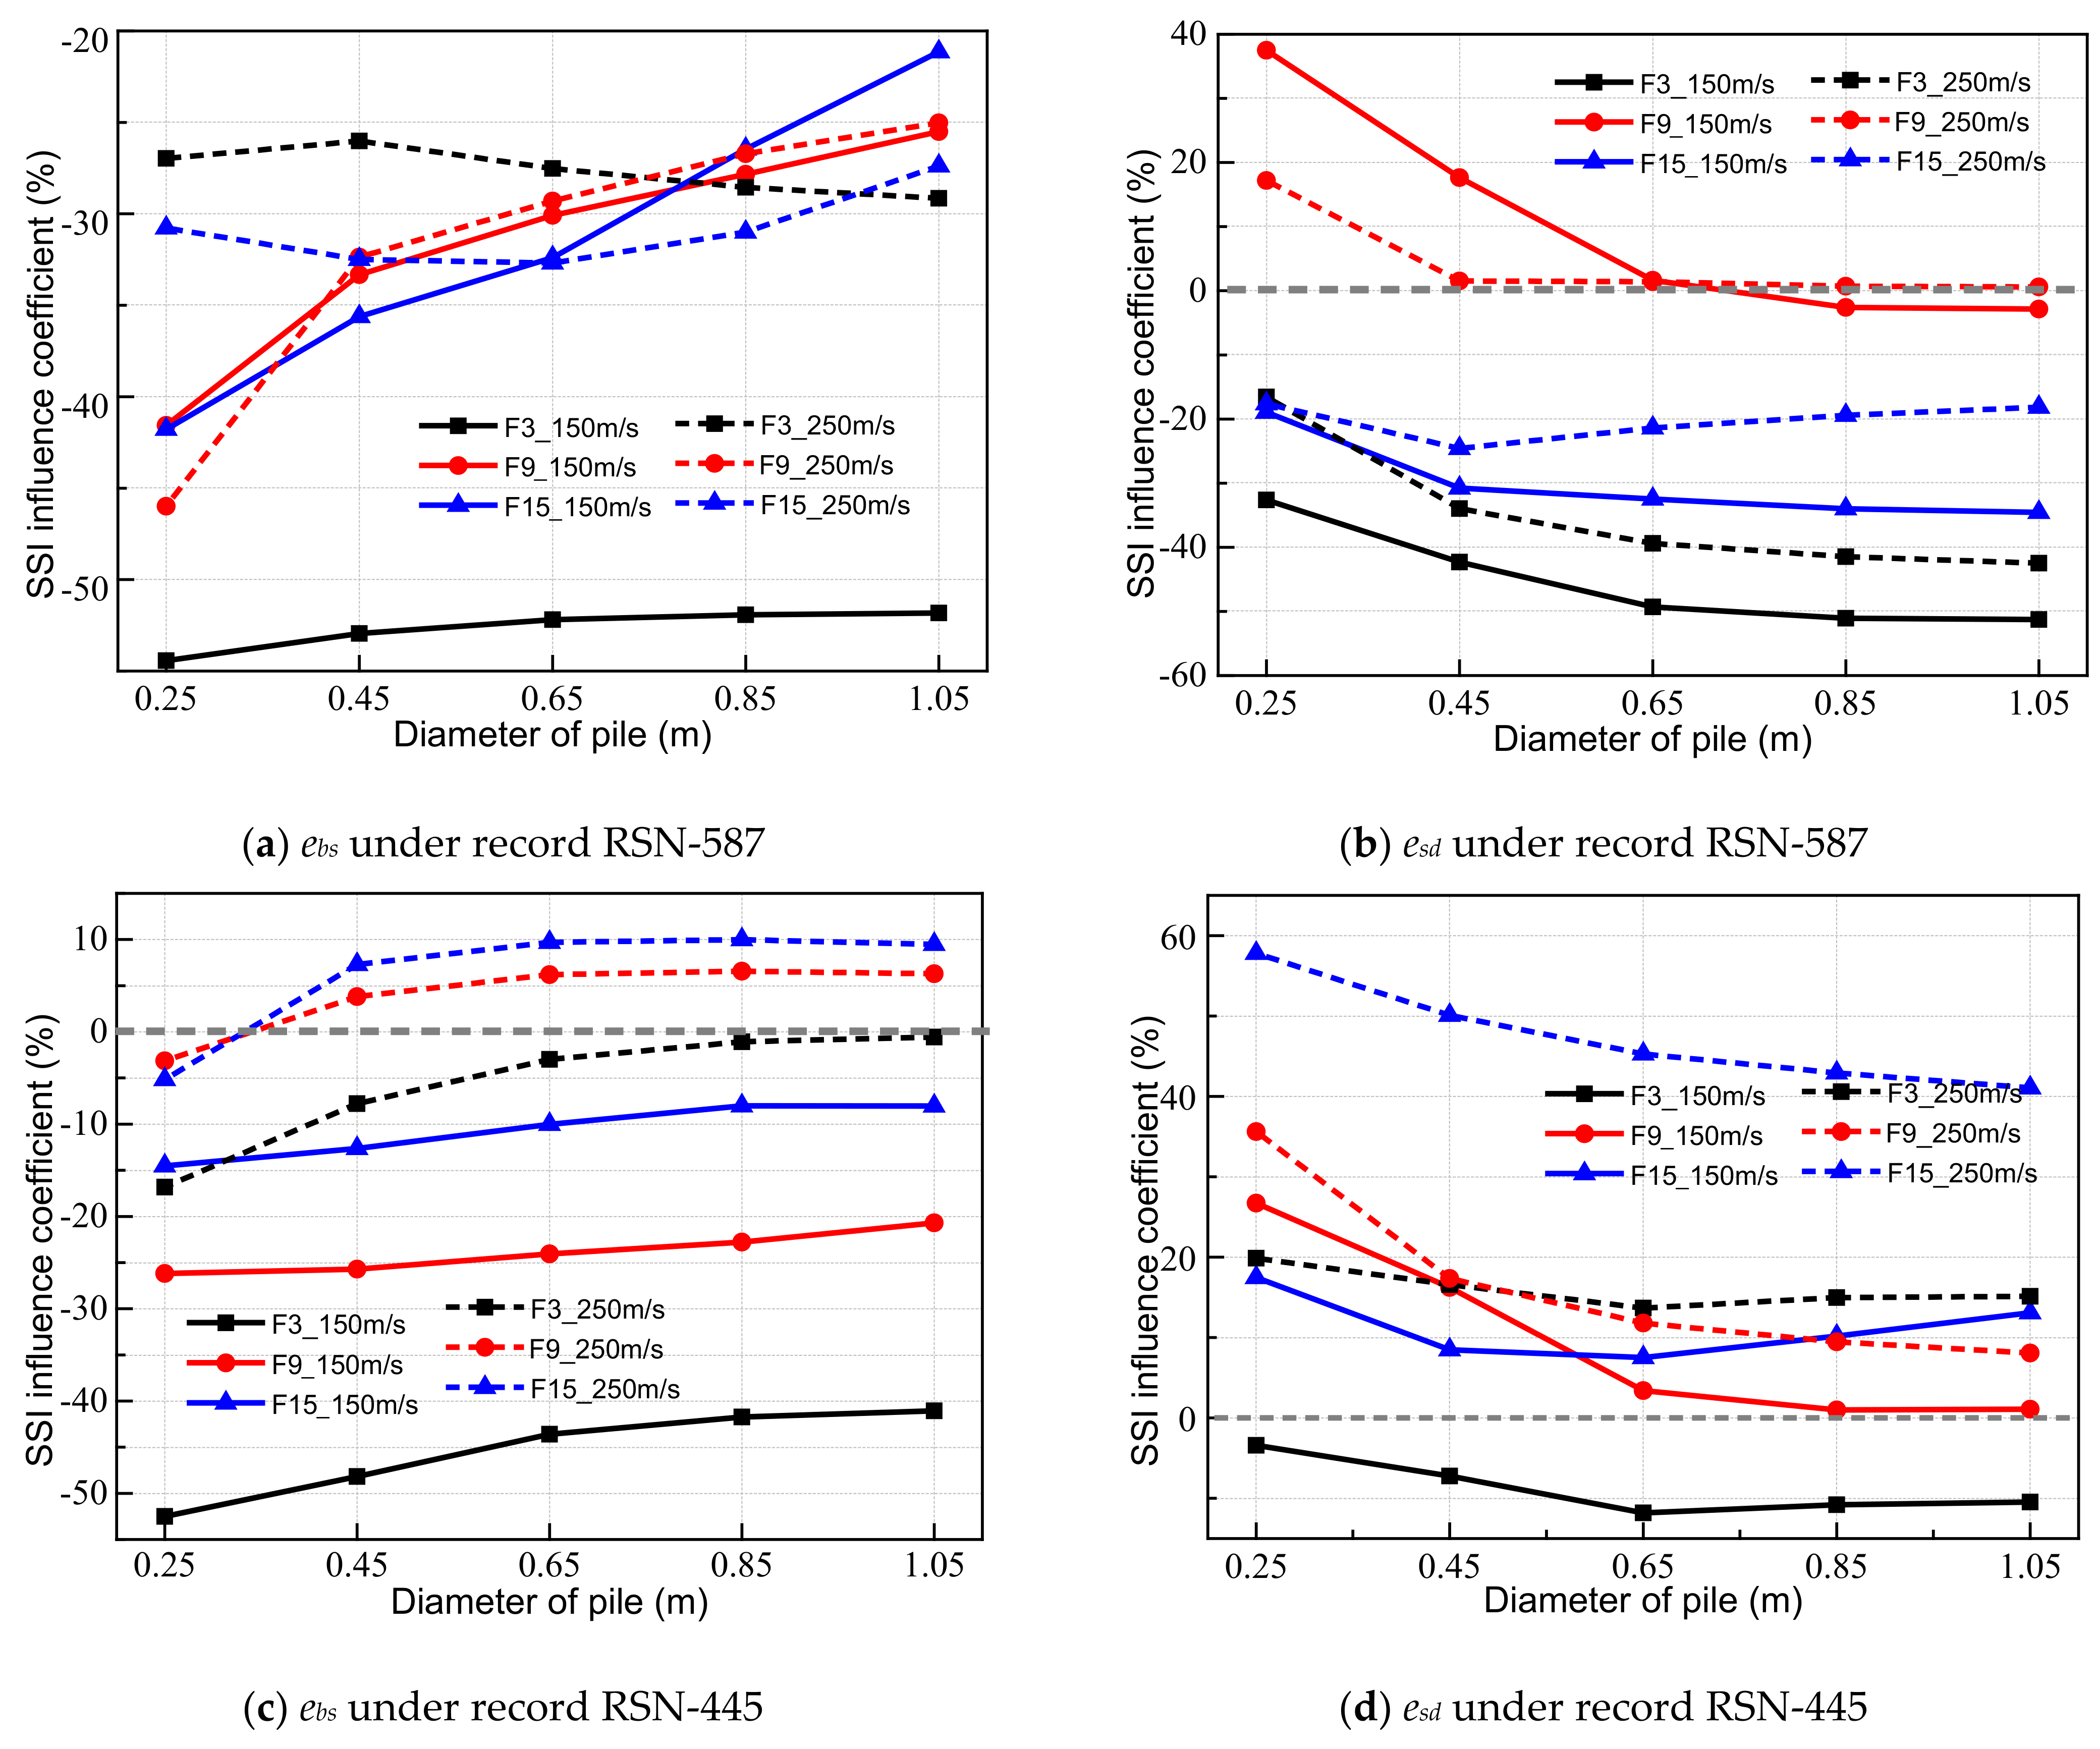
4.2. Pile Diameter
5. Influence of the Seismic Intensity and Structural Span Number
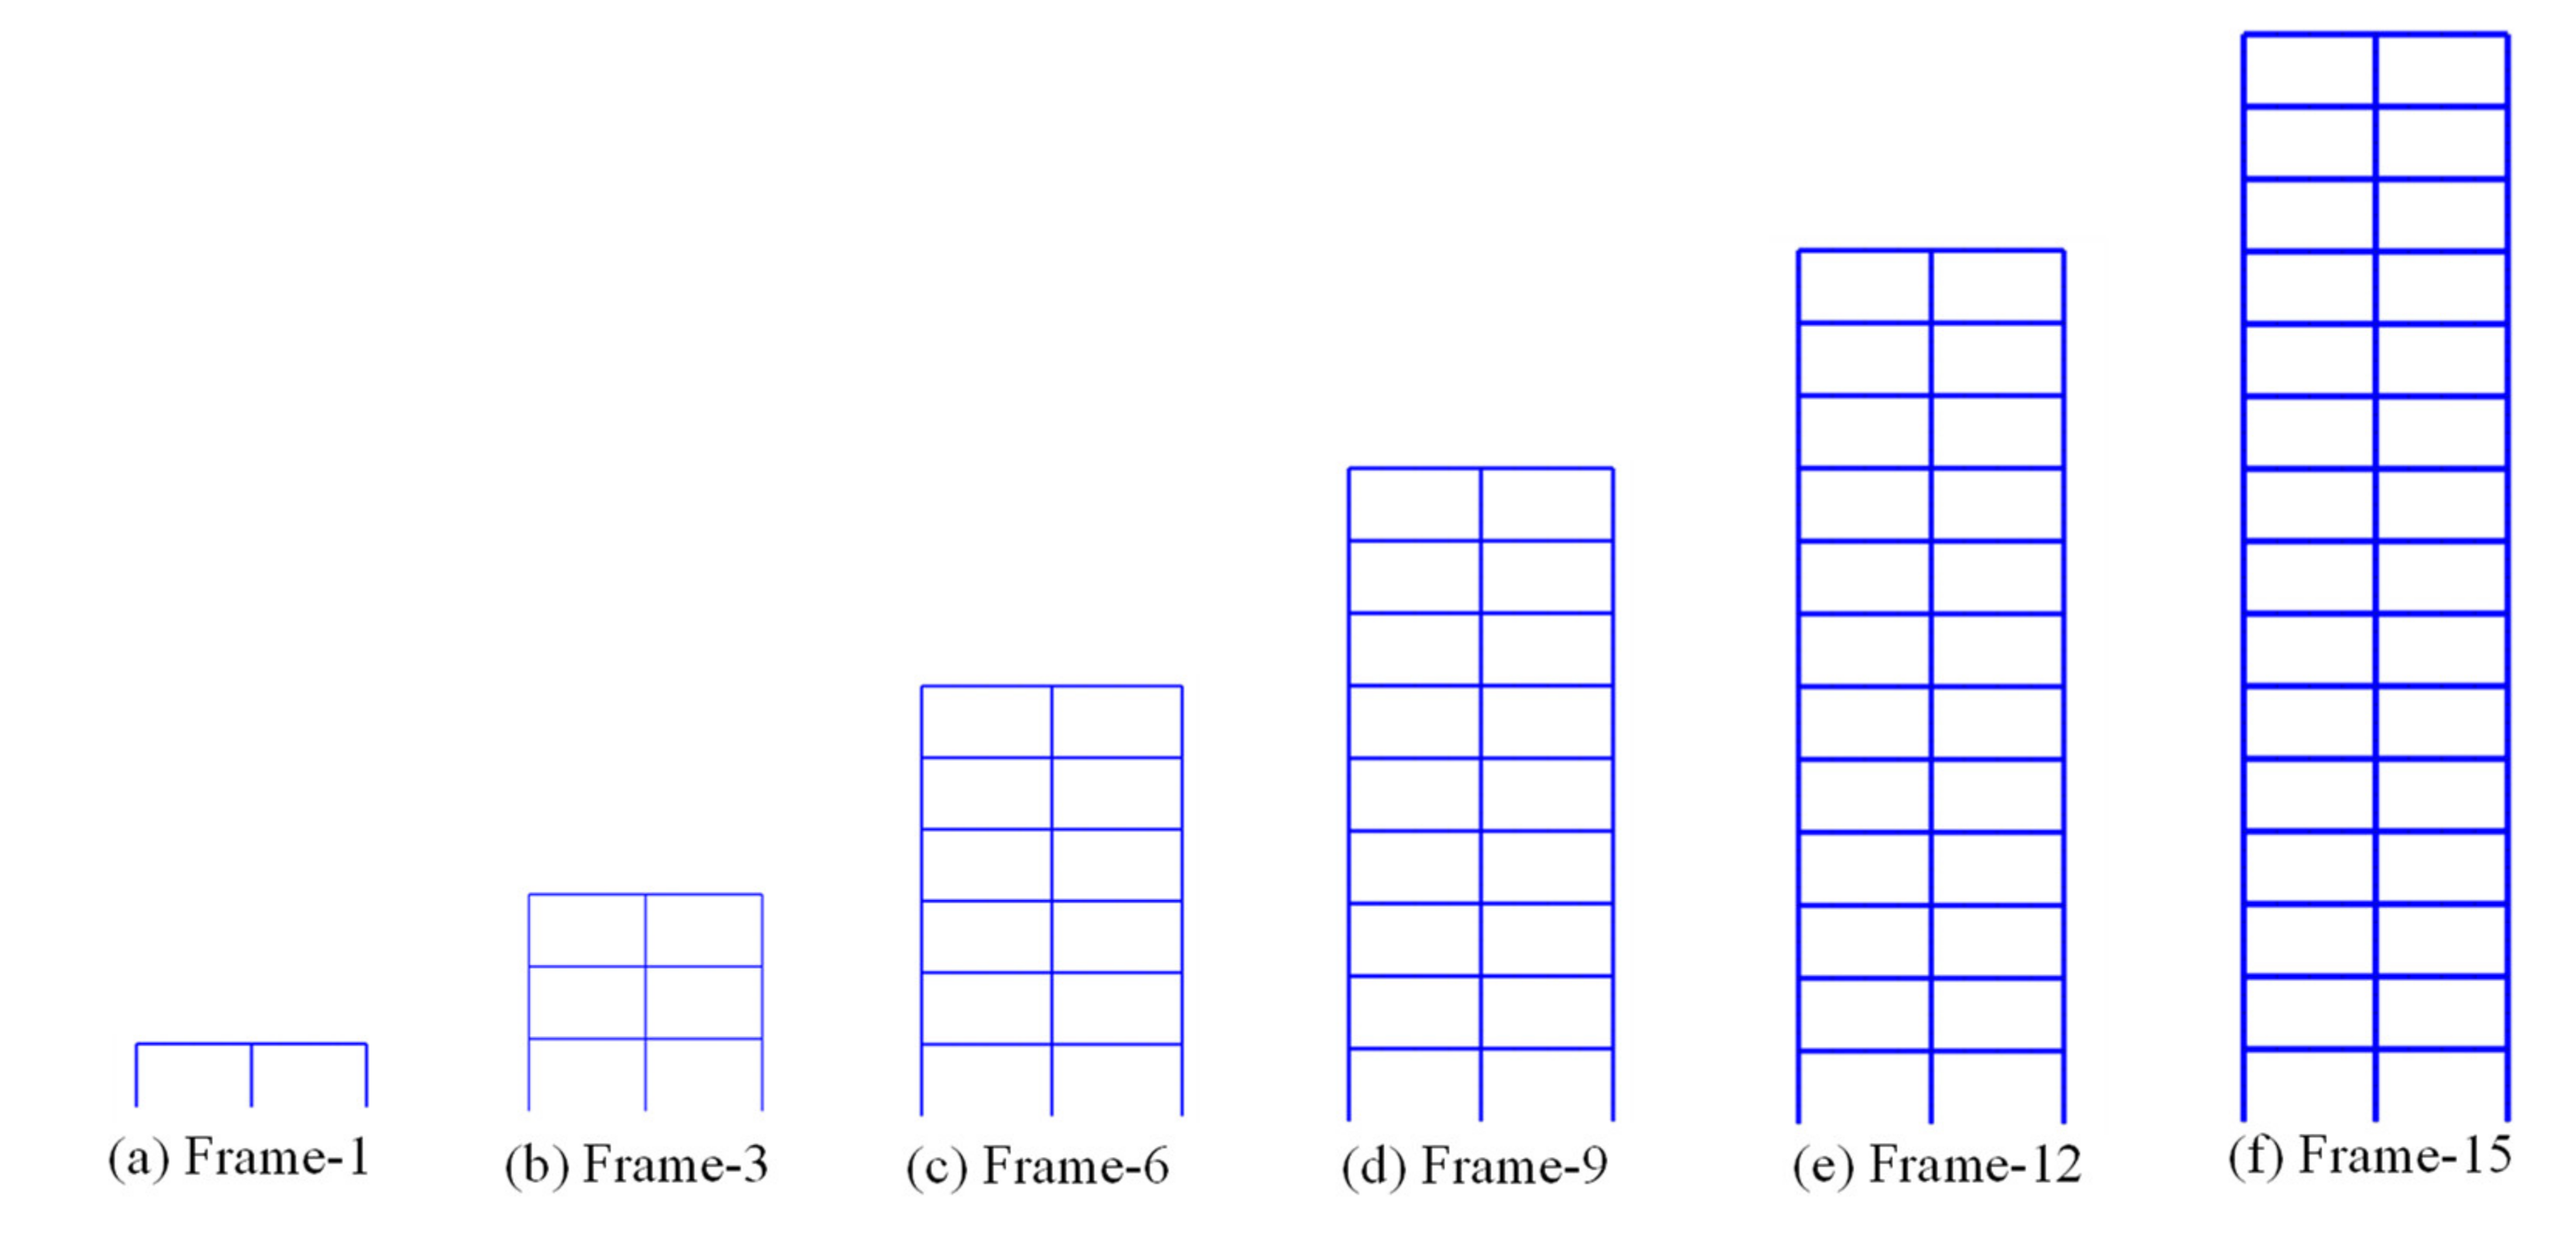
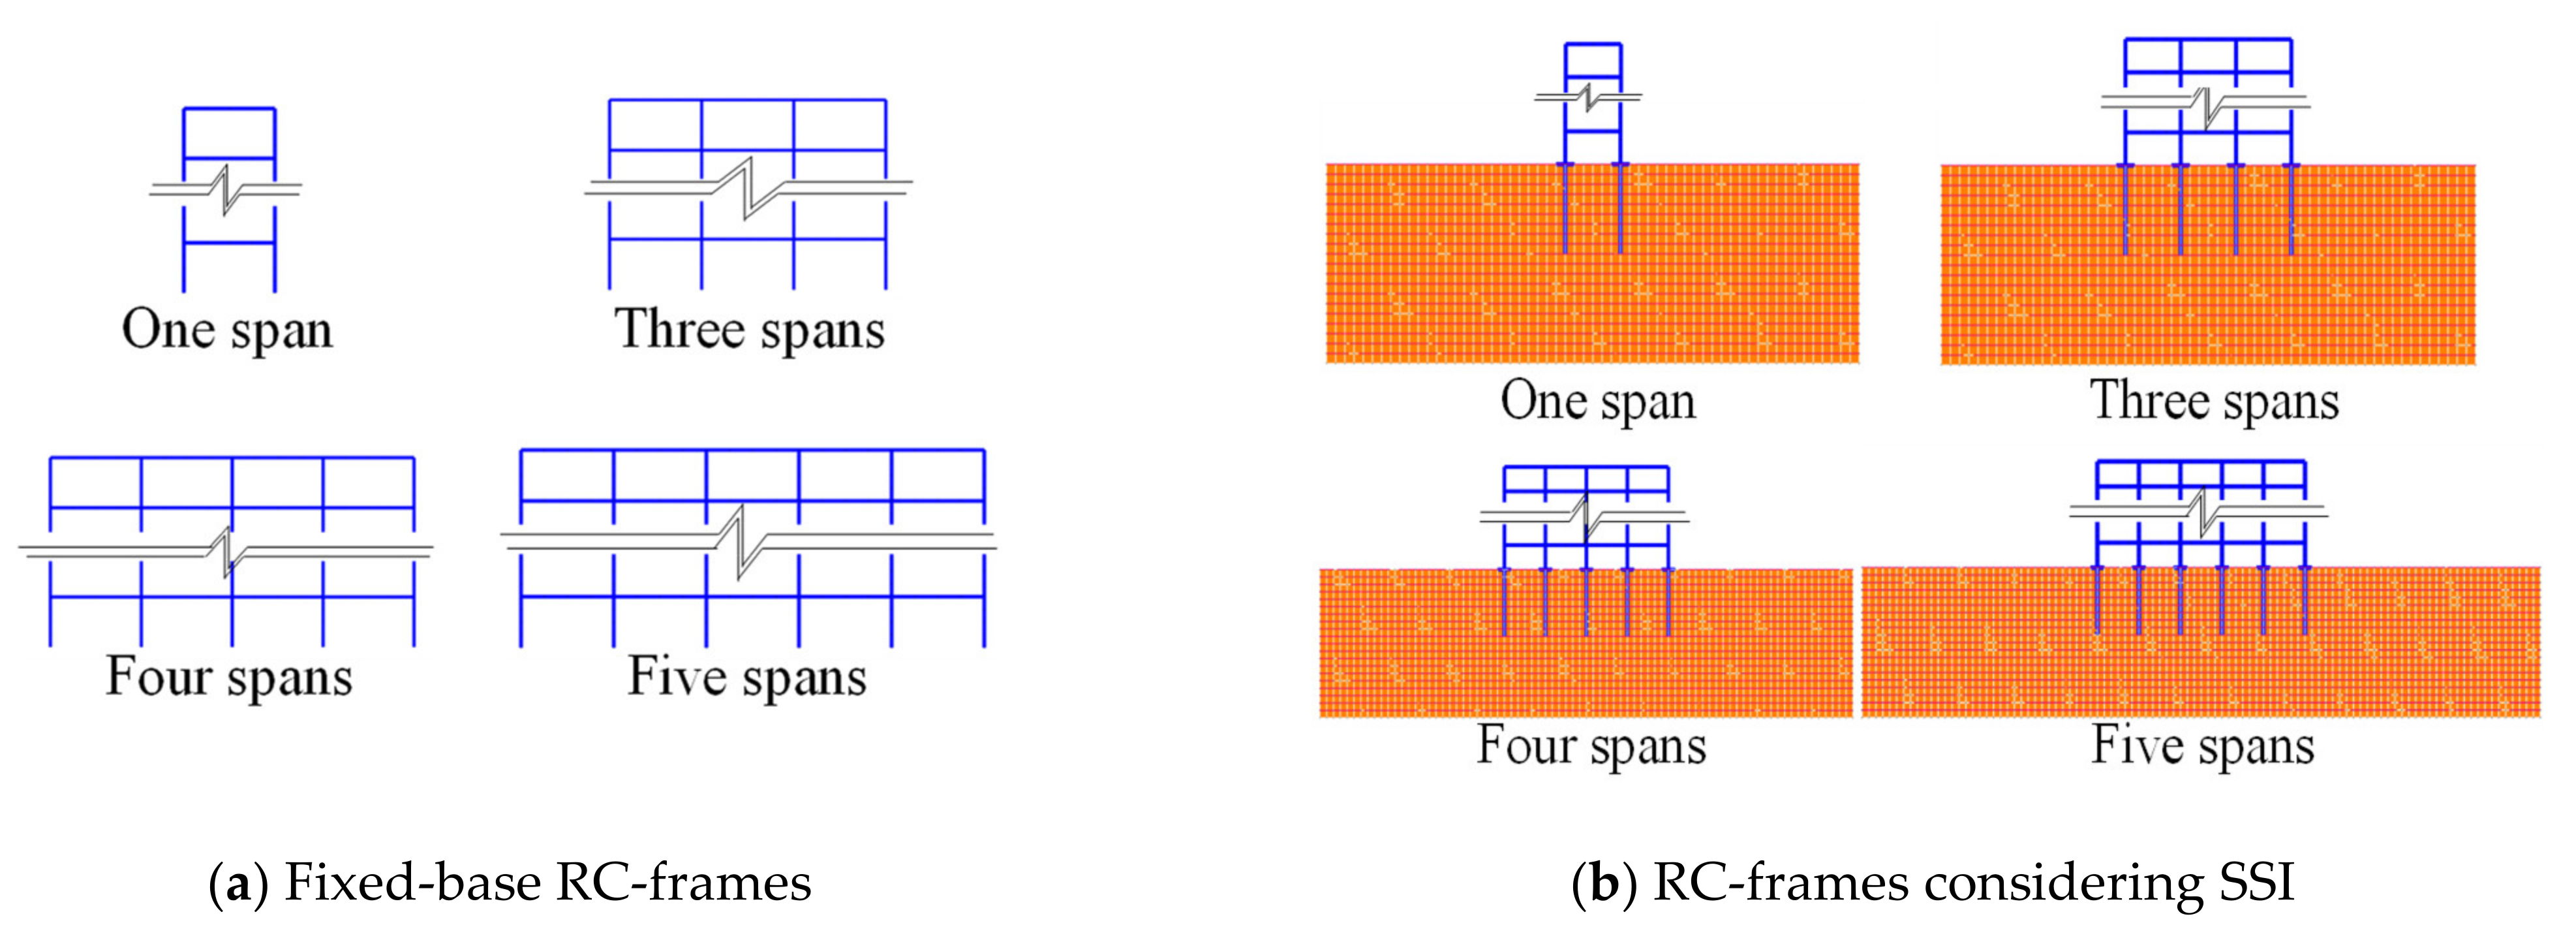
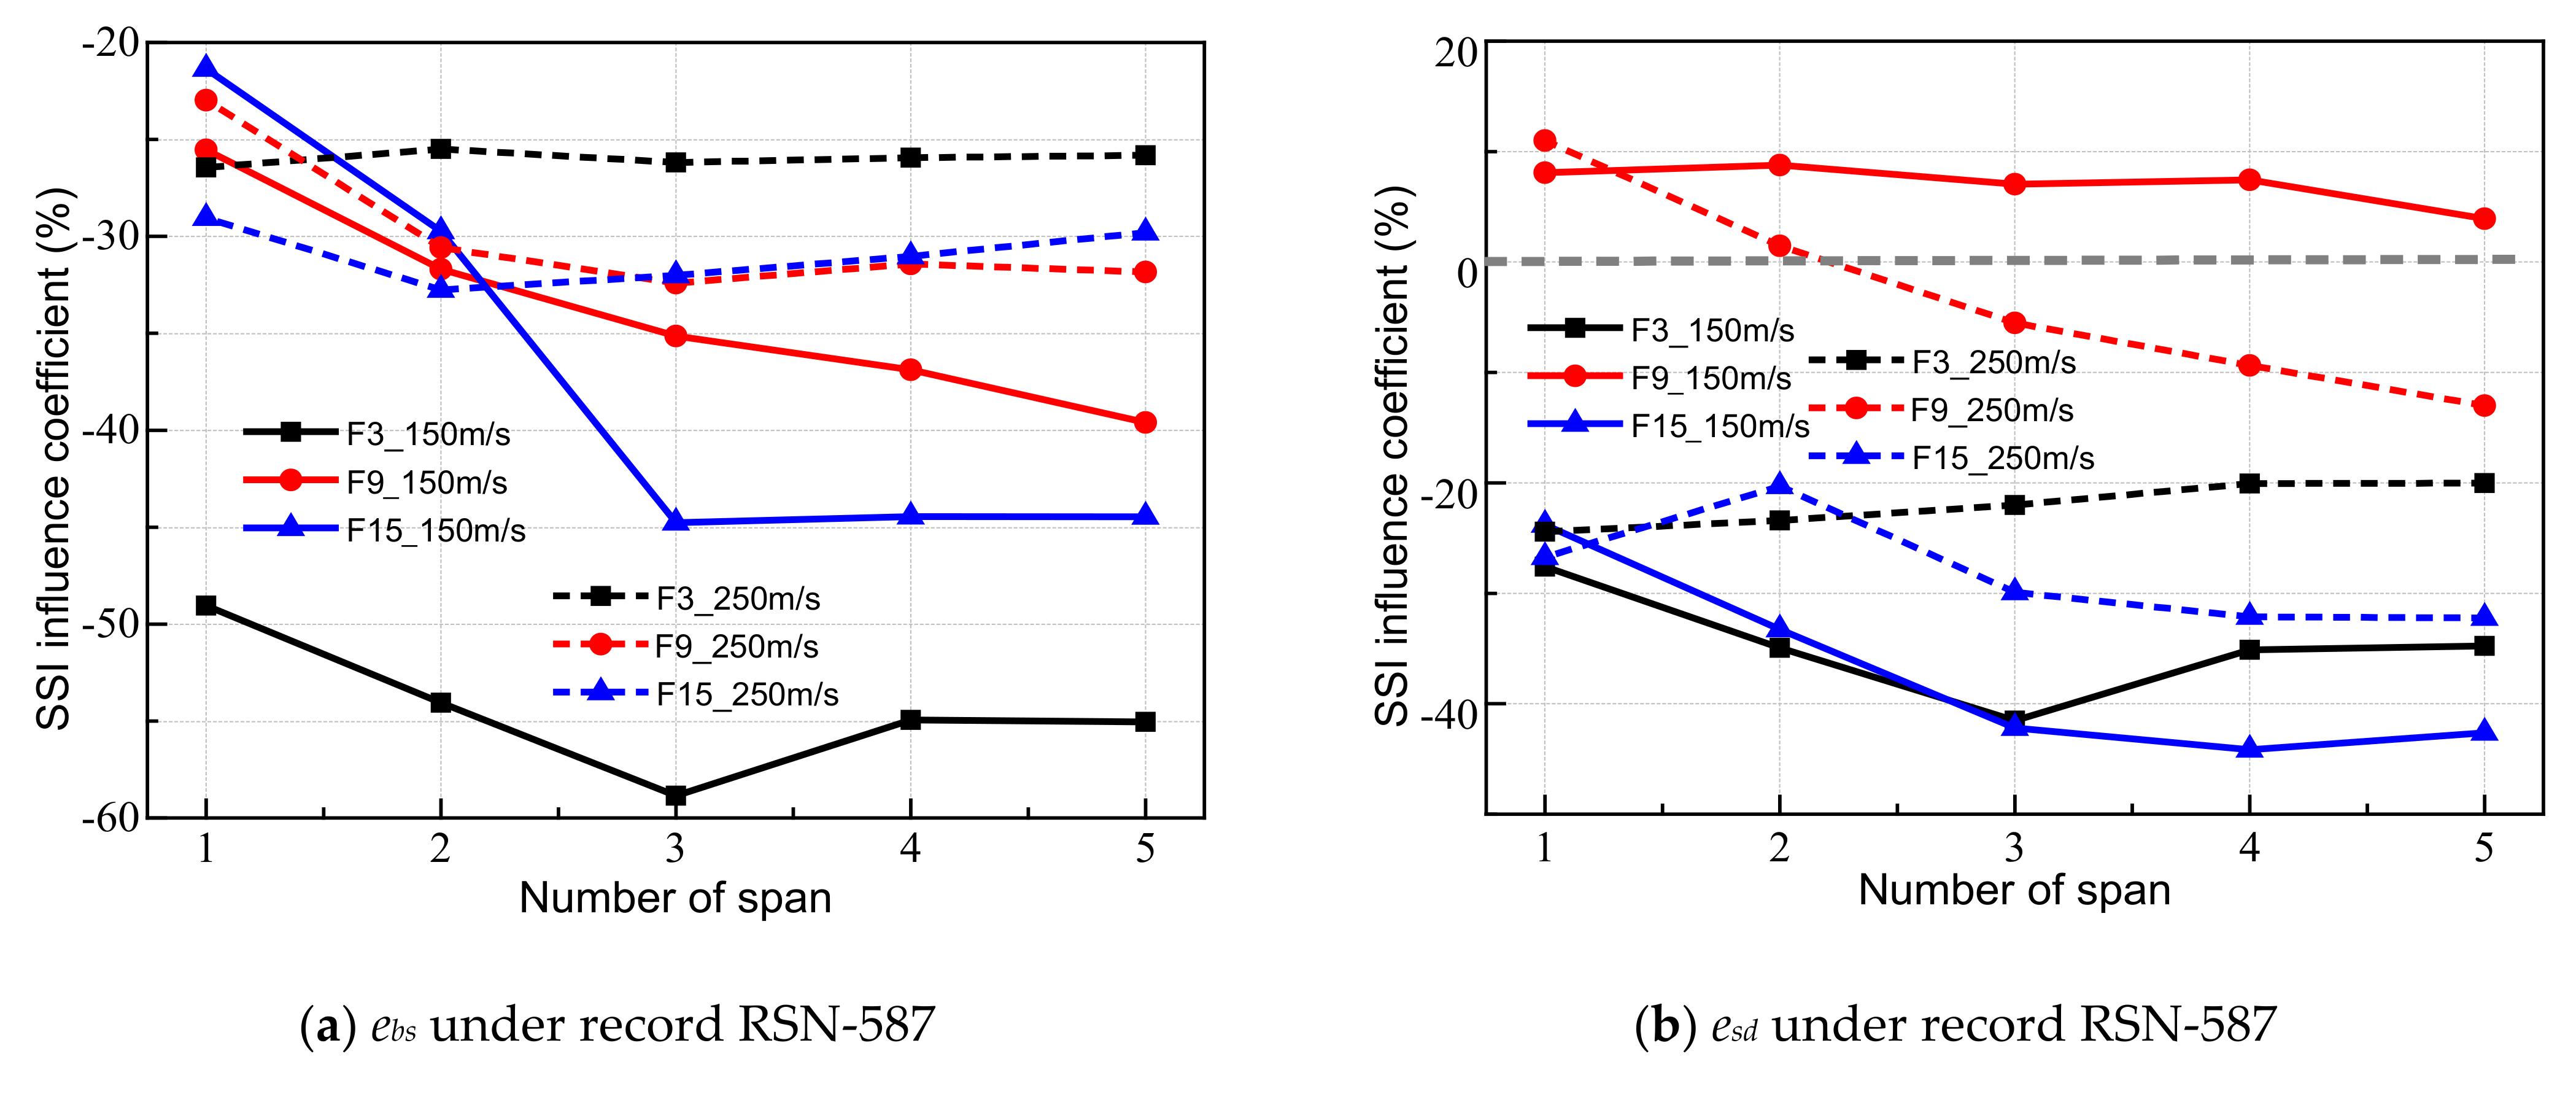
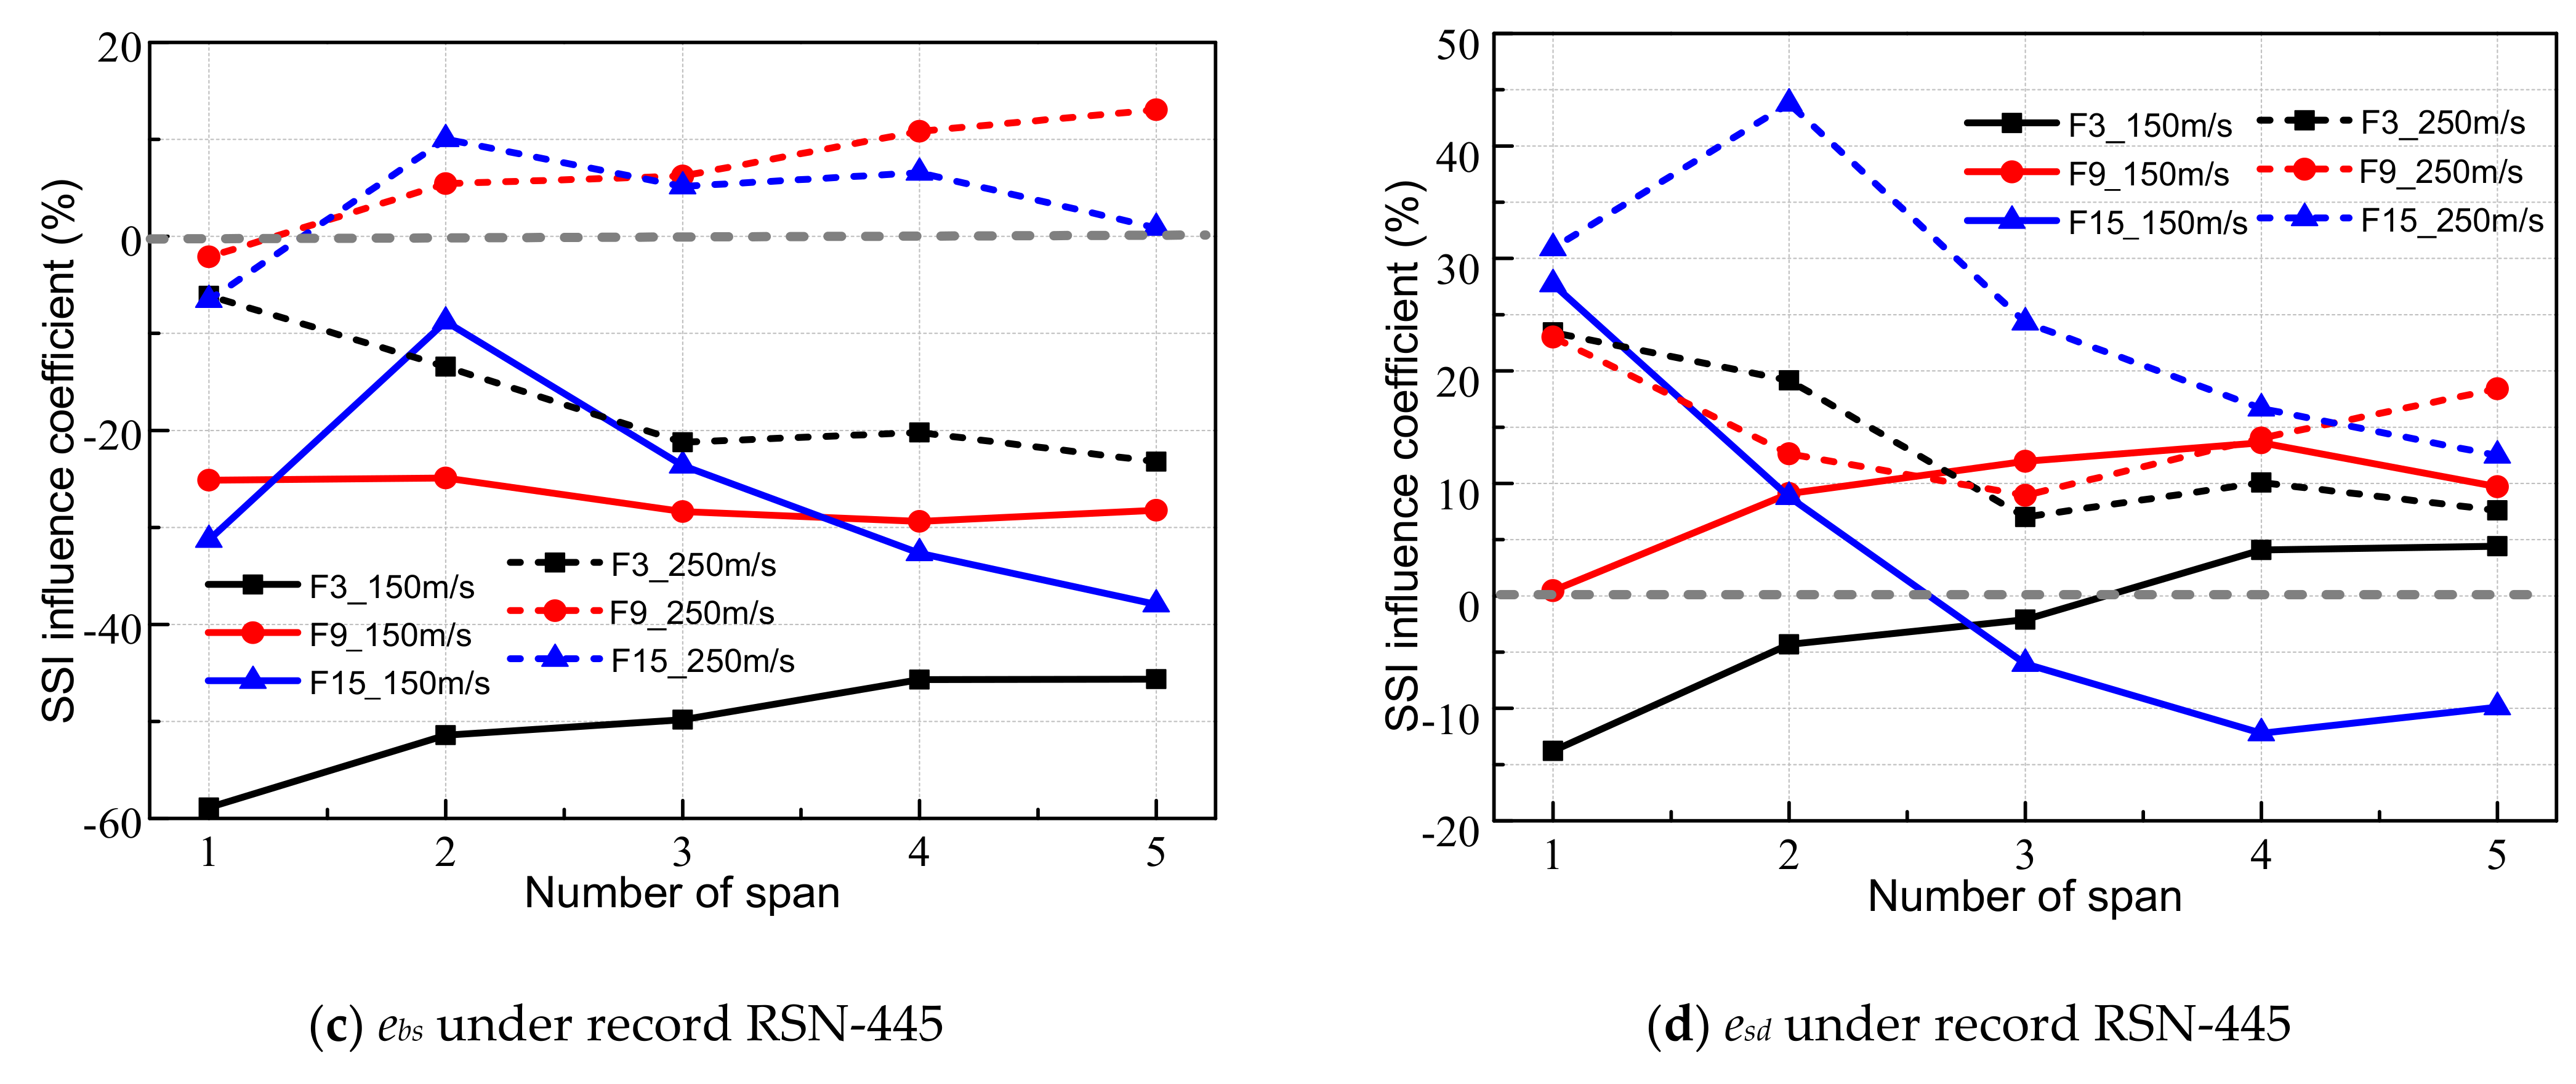
5.1. Span Number of the RC-Frame
5.2. Seismic Intensity
6. Conclusions
- (1)
- For pile-supported RC-frames considering SSI, the maximum base shear generally increases with a larger pile length and the growth is within 10%; the maximum base shear and story drift, respectively, increases and decreases with the increase in the pile diameter, and the maximum change is up to 20% and 40%, respectively.
- (2)
- Both the span number and seismic intensity can considerably influence the seismic demands of pile-supported RC-frames in some cases and their influences on the structural seismic demands have no obvious laws. In general, the influence of SSI on the structural seismic demands decreases with a larger soil shear wave velocity.
- (3)
- SSI can reduce the maximum base shears of pile-supported RC-frames in most cases while it can also significantly increase the structural maximum base shear and story drift in some specific cases, especially for low-rise structures built on tough soil. The SSI effect on the maximum base shear does not always have a positive correlation with that on the maximum story drift.
- (4)
- The SSI effect on seismic demands predominantly depends on the structural frequency, spectral characteristic, and peak acceleration of the seismic record and the soil shear wave velocity while the influence of the pile diameter and span number of structure still cannot be neglected in some cases.
- (5)
- The influence of the seismic soil–structure interaction should be fully considered to reduce casualties and economic losses when designing low-rise structures built on tough soil and high-rise structures built on soft soil. Machine learning is expected to solve the seismic soil–structure interaction issue by establishing and training a data set that sufficiently considers all the influencing factors of soil–structure interaction.
Author Contributions
Funding
Data Availability Statement
Acknowledgments
Conflicts of Interest
References
- Zhang, L.; Gu, Y. Seismic analysis of a curved bridge considering soil-structure interactions based on a separated foundation model. Appl. Sci. 2022, 10, 4260. [Google Scholar] [CrossRef]
- Veletsos, A.S.; Meek, J.W. Dynamic behaviour of building-foundation systems. Earthq. Eng. Struct. Dyn. 1974, 3, 121–138. [Google Scholar] [CrossRef]
- GB 50011-2010; Code for Seismic Design of Buildings. MHURD-PRC (Ministry of Housing and Urban-Rural Development of the People’s Republic of China): Beijing, China, 2010. (In Chinese)
- NBCC (National Building Code of Canada); NRC Institute for Research in Construction: Ottawa, ON, Canada, 2010.
- IBC (International Building Code); International Code Council (ICC): Washington, DC, USA, 2012.
- BS EN 1998-1:2004; Eurocode 8: Design of Structures for Earthquake Resistance. European Committee for Standardization: Brussels, Belgium, 2004.
- Xiong, C.; Lu, X.; Huang, J.; Guan, H. Multi-LOD seismic-damage simulation of urban buildings and case study in Beijing CBD. Bull. Earthq. Eng. 2019, 17, 2037–2057. [Google Scholar] [CrossRef]
- Xiong, C.; Deng, X.; Liang, Y.; Li, Q.; Huang, J.; Lin, X.; Li, D. Regional Seismic Damage Simulation of Corroded RC Frame Structures: A Case Study of Shenzhen City. Appl. Sci. 2020, 10, 4818. [Google Scholar] [CrossRef]
- Tabatabaiefar, H.R.; Clifton, T. Significance of considering soil-structure interaction effects on seismic design of unbraced building frames resting on soft soils. Aust. Geomech. J. 2016, 51, 55–64. [Google Scholar]
- Far, H. Advanced computation methods for soil structure interaction analysis of structures resting on soft soils. Int. J. Geotech. Eng. 2019, 13, 352–359. [Google Scholar] [CrossRef]
- Nappa, V.; Oztoprak, S.; Ramaglia, G.; Sargin, S.; Flora, A.; Chiaradonna, A.; de Sanctis, L.; Lignola, G.P. Understanding the Damages Caused by the 1999 Kocaeli Earthquake on One of the Towers of the Theodosian Walls of Constantinople. Int. J. Archit. Herit. 2022, 16, 1076–1100. [Google Scholar]
- Goit, C.S.; Saitoh, M.; Mylonakis, G.; Kawakami, H.; Oikawa, H. Model tests on horizontal pile-to-pile interaction incorporating local non-linearity and resonance effects. Soil Dyn. Earthq. Eng. 2013, 48, 175–192. [Google Scholar] [CrossRef]
- Pecker, A.; Paolucci, R.; Chatzigogos, C.; Correia, A.; Figini, R. The role of non-linear dynamic soil-foundation interaction on the seismic response of structures. Bull. Earthq. Eng. 2014, 12, 1157–1176. [Google Scholar] [CrossRef]
- Noto, F.; Iovino, M.; Di Laora, R.; de Sanctis, L.; Franchin, P. Non-linear dynamic analysis of buildings founded on piles: Simplified modelling strategies for soil-foundation-structure interaction. Earthq. Eng. Struct. Dyn. 2022, 51, 744–763. [Google Scholar] [CrossRef]
- Khosravifardshirazi, A.; Johari, A.; Javadi, A.A.; Khanjanpour, M.H.; Khosravifardshirazi, B.; Akrami, M. Role of Subgrade Reaction Modulus in Soil-Foundation-Structure Interaction in Concrete Buildings. Buildings 2022, 12, 540. [Google Scholar] [CrossRef]
- Raychowdhury, P. Effect of soil parameter uncertainty on seismic demand of low-rise steel buildings on dense silty sand. Soil Dyn. Earthq. Eng. 2009, 29, 1367–1378. [Google Scholar] [CrossRef]
- Tomeo, R.; Pitilakis, D.; Bilotta, A.; Nigro, E. SSI effects on seismic demand of reinforced concrete moment resisting frames. Eng. Struct. 2018, 173, 559–572. [Google Scholar] [CrossRef]
- Cayci, B.T.; Inel, M.; Ozer, E. Effect of Soil-Structure Interaction on Seismic Behavior of Mid- and Low-Rise Buildings. Int. J. Geomech. 2021, 21, 04021009. [Google Scholar] [CrossRef]
- Arboleda-Monsalve, L.G.; Mercado, J.A.; Terzic, V.; Mackie, K.R. Soil–structure interaction effects on seismic performance and earthquake-induced losses in tall buildings. J. Geotech. Geoenviron. 2020, 146, 04020028. [Google Scholar] [CrossRef]
- Galal, K.; Naimi, M. Effect of soil conditions on the response of reinforced concrete tall structures to near-fault earthquakes. Struct. Des. Tall. Spec. 2008, 3, 541. [Google Scholar] [CrossRef]
- Zhang, X.; Far, H. Effects of dynamic soil-structure interaction on seismic behaviour of high-rise buildings. Bull. Earthq. Eng. 2022, 20, 3443–3467. [Google Scholar] [CrossRef]
- Hippola, H.M.S.S.; Wijesundara, K.K.; Nascimbene, R. Response of shear critical reinforced concrete frames and walls under monotonic loading. Eng. Struct. 2022, 251, 113483. [Google Scholar] [CrossRef]
- Liang, F.; Chen, H.; Huang, M. Accuracy of three-dimensional seismic ground response analysis in time domain using nonlinear numerical simulations. Earthq. Eng. Eng. Vib. 2017, 16, 487–498. [Google Scholar] [CrossRef]
- Yassin, M.H.M. Nonlinear Analysis of Prestressed Concrete Structures under Monotonic and Cycling Loads. Ph.D. Thesis, University of California, Berkeley, CA, USA, 2019. [Google Scholar]
- Filippou, F.C.; Popov, E.P.; Bertero, V.V. Effects of Bond Deterioration on Hysteretic Behavior of Reinforced Concrete Joints; Report EERC 83-19; Earthquake Engineering Research Center, University of California: Berkeley, CA, USA, 1983. [Google Scholar]
- Wang, J.; Guo, T.; Song, L.; Song, Y. Performance-based seismic design of RC moment resisting frames with friction-damped self-centering tension braces. J. Earthq. Eng. 2022, 26, 1723–1742. [Google Scholar] [CrossRef]
- Ge, Q.; Xiong, F.; Xie, L.; Chen, J.; Yu, M. Dynamic interaction of soil-Structure cluster. Soil Dyn. Earthq. Eng. 2019, 123, 16–30. [Google Scholar] [CrossRef]
- Wang, J.; Guo, T.; Du, Z. Experimental and numerical study on the influence of dynamic structure-soil-structure interaction on the responses of two adjacent idealized structural systems. J. Build. Eng. 2022, 52, 104454. [Google Scholar] [CrossRef]
- Tsai, C.-C.; Lin, W.-C.; Chiou, J.-S. Identification of dynamic soil properties through shaking table tests on a large saturated sand specimen in a laminar shear box. Soil Dyn. Earthq. Eng. 2016, 83, 59–68. [Google Scholar] [CrossRef]
- Fiorentino, G.; Cengiz, C.; De Luca, F.; Mylonakis, G.; Karamitros, D.; Dietz, M.; Nuti, C. Integral abutment bridges: Investigation of seismic soil-structure interaction effects by shaking table testing. Earthq. Eng. Struct. Dyn. 2021, 50, 1517–1538. [Google Scholar] [CrossRef]
- Wang, J.; Guo, T.; Du, Z.; Yu, S. Shaking table tests and parametric analysis of dynamic interaction between soft soil and structure group. Eng. Struct. 2022, 256, 114041. [Google Scholar] [CrossRef]
- Wang, S.; Cao, Z. Modern Seismic Design Method; China Building Industry Press: Beijing, China, 1997. [Google Scholar]
- Schnabel, P.B. SHAKE: A Computer Program for Earthquake Response Analysis of Horizontally Layered Sites; EERC Report 72-12 1972; University of California: Berkeley, CA, USA, 1972. [Google Scholar]
- Joyner, W.B.; Boore, D.M. Peak horizontal acceleration and velocity from strong 560 motion records including records from the 1979 Imperial Valley, California, earthquake, 561. Bull. Seismol. Soc. Am. 1981, 71, 2011–2038. [Google Scholar] [CrossRef]
- GB 50010-2010; Code for Design of Concrete Structures. MHURD-PRC (Ministry of Housing and Urban-Rural Development of the People’s Republic of China): Beijing, China, 2010. (In Chinese)
- Güllü, H.; Karabekmez, M. Effect of near-fault and far-fault earthquakes on a historical masonry mosque through 3D dynamic soil-structure interaction. Eng. Struct. 2017, 152, 465–492. [Google Scholar] [CrossRef]


| Records | Earthquake Name | Year | Station Name | Magnitude | Rjb (km) | Component |
|---|---|---|---|---|---|---|
| RSN-445 | New Zealand-01 | 1984 | Turangi Telephone Exchange | 5.5 | 3.76 | TUR329.AT2 |
| RSN-587 | New Zealand-02 | 1987 | Matahina Dam | 6.6 | 16.09 | MAT083.AT2 |
| RSN-1050 | Northridge-01 | 1994 | Pacoima Dam | 6.69 | 4.92 | PAC175.AT2 |
| Frames | Story | Beam | Column | Pile Foundation | ||||
|---|---|---|---|---|---|---|---|---|
| Section (m) | Rebar (mm2) (Top × Bottom) | Section (m) | Rebar (mm2) (Each Side) | Diameter (m) | Length (m) | Total Rebar (mm2) | ||
| Frame-1 | 1 | 0.3 × 0.6 | 1080 × 940 | 0.5 × 0.5 | 833.2 | 0.20 | 1.0 | 251.2 |
| Frame-3 | 1 to 3 | 0.3 × 0.6 | 1080 × 940 | 0.5 × 0.5 | 833.2 | 0.30 | 3.0 | 565.2 |
| Frame-6 | 1 to 6 | 0.3 × 0.6 | 1080 × 940 | 0.6 × 0.6 | 1200 | 0.45 | 6.0 | 1272 |
| Frame-9 | 1 to 5 | 0.3 × 0.6 | 1080 × 940 | 0.65 × 0.65 | 1408 | 0.55 | 9.0 | 1900 |
| 6 to 9 | 0.3 × 0.6 | 1080 × 940 | 0.55 × 0.55 | 1008 | ||||
| Frame-12 | 1 to 4 | 0.3 × 0.6 | 1080 × 940 | 0.7 × 0.7 | 1633.2 | 0.65 | 12.0 | 2653.6 |
| 5 to 8 | 0.3 × 0.6 | 1080 × 940 | 0.6 × 0.6 | 1200 | ||||
| 9 to 12 | 0.3 × 0.6 | 1080 × 940 | 0.5 × 0.5 | 833.2 | ||||
| Frame-15 | 1 to 5 | 0.3 × 0.6 | 1080 × 940 | 0.75 × 0.75 | 1875 | 0.75 | 15.0 | 3532.8 |
| 6 to 10 | 0.3 × 0.6 | 1080 × 940 | 0.65 × 0.65 | 1408 | ||||
| 11 to 15 | 0.3 × 0.6 | 1080 × 940 | 0.55 × 0.55 | 1008 | ||||
Publisher’s Note: MDPI stays neutral with regard to jurisdictional claims in published maps and institutional affiliations. |
© 2022 by the authors. Licensee MDPI, Basel, Switzerland. This article is an open access article distributed under the terms and conditions of the Creative Commons Attribution (CC BY) license (https://creativecommons.org/licenses/by/4.0/).
Share and Cite
Wang, J.; Yang, J. Parametric Analysis on the Effect of Dynamic Interaction between Nonlinear Soil and Reinforced Concrete Frame. Appl. Sci. 2022, 12, 9876. https://doi.org/10.3390/app12199876
Wang J, Yang J. Parametric Analysis on the Effect of Dynamic Interaction between Nonlinear Soil and Reinforced Concrete Frame. Applied Sciences. 2022; 12(19):9876. https://doi.org/10.3390/app12199876
Chicago/Turabian StyleWang, Jishuai, and Jun Yang. 2022. "Parametric Analysis on the Effect of Dynamic Interaction between Nonlinear Soil and Reinforced Concrete Frame" Applied Sciences 12, no. 19: 9876. https://doi.org/10.3390/app12199876