Abstract
The quality of DEMs is especially being considered based on the spatial resolution of the created digital models and the type of terrain of the interest area. DEM analysis was performed specifically for LiDAR-based DEMs, as well as a comparison with results obtained using the radar recording method (Shuttle Radar Topography Mission). The application of DEM data for security-sensitive systems requires the fulfillment of security requirements, such as authenticity, integrity, confidentiality, and non-repudiation. For this purpose, the authors have developed a model for non-repudiation and protecting DEM data. The model simulation shows it is possible to detect even the smallest changes made in the transmission or the DEM location, as well as proving the data authenticity and non-repudiation of the sender. DEM data security testing has shown that DEM data is effectively protected from the source of origin to the end entity location.
1. Introduction
Most human activities take place on the surface of the Earth. It is therefore reasonable that a person seeks to collect and analyze various information on the ground and the Earth’s surface. On a topographic map, all features present on the field are projected orthogonally in the 2D projection.
The use of such maps dates back to the 18th century [1]. Many believe that the topographic map is one of the most important procedures in mapping history due to its convenience. With the development of technology and the human desire for a realistic representation of the earth’s surface in three dimensions, the need for 3D data and 3D models arose. Digital terrain modeling involves a whole range of activities related to the collection and processing of terrain surface data, the creation of appropriate digital terrain models and analysis, as well as the use of acquired digital models in different areas [2]. Progress in the development of Earth observations allows the capturing of larger amounts of detailed data that are useful in many areas, such as geodesy, geography, geology, and others. LiDAR technology (light detection and ranging) allows for the capture of different layers of a surface with considerable precision [3].
The InSAR system used on the Shuttle Radar Topography Mission in February 2000, currently provides the most complete and robust source of elevation data at the global scale [4]. At the beginning of this century, with the cooperation of several US agencies, the so-called SRTM (Shuttle Radar Topography Mission) was carried out. With a special aircraft, radar stereo pairs were collected within a few days for almost the entire Earth’s surface. By processing these stereo pairs, in the period from 2000 to 2003, an accurate and high-quality digital elevation model (spatial resolution 90 m) was created, and in it, these models were freely placed on the Internet. By further processing and supplementing previous missions, on September 24, 2014, a 1-arc second global digital elevation model (spatial resolution 30 m) was published, which was used in the continuation of the work. Thanks to the SRTM mission, created by radar technology, it can be downloaded completely free on the Internet. To acquire topographic data, the SRTM payload was outfitted with two radar antennas. One antenna was located in the shuttle’s payload bay, and the other allowed single-pass interferometry that was on the end of a 60 m mast that extended from the payload bay once the shuttle was in space. The technique employed is known as interferometric synthetic aperture radar or InSAR [5].
The ASTER (Advanced Spaceborne Thermal Emission and Reflection Radiometer) Global Digital Elevation Model (GDEM) determined elevation by two images at different angles using stereotopic pairs and photogrammetry. The measurement was subject to errors due to cloudiness over certain areas [6].
The Japan Aerospace Exploration Agency (JAXA) collected images using the ALOS satellite (Advanced Land Observing Satellite) with an integrated PRISM (Panchromatic Remote-sensing Instrument for Stereo Mapping) instrument. Based on those images, the ALOS Global Digital Surface Model (AW3D30) was generated [7].
Airborne Light Detecting and Ranging instruments provide high precision topographic mapping tools via discrete surface height samples instead of a continuous coverage across small areas [8]. Laser altimetry or LiDAR is a technology that has the most diverse application in many scientific disciplines. When it comes to laser scanning, it is generally an active laser system recording that records reflected signals from the Earth’s surface. It can be said that LiDAR is a fully automated, active, optical-mechanical procedure for spatial data collection. This method provides a large amount of data, the so-called cloud of points or point cloud, characterized by extremely high density and speed of collecting points (10,000–80,000 points per second), based on which we can create DEMs with high spatial resolutions. In a cloud of points obtained by scanning, a single point represents a footprint or electromagnetic wave reflection from a part of the surface of a scanned object [9]. Although there have been several studies analyzing the quality of the SRTM data in general [10,11,12], there has not been much research on the quality and usability of the SRTM data for a small surface area. Deviations from the SRTM data to the reference data set are in the following referred to as ‘errors’. It shall be made clear, however, that the reference data set also has errors associated with it [13].
Digital elevation models (DEM) are the generally adopted data structures for storing topographic information [14,15]. The Digital Surface Model (DSM) represents the surface of the earth and includes all objects on it [16].
In a raster-oriented GIS, the basic visual structure of data makes the correct (usually rectangular or square) network. This is a simplified view using square cells, i.e., pixels, and is determined by dimensions (spatial resolution). Each pixel has its value, and in the case of DTM representation, the pixel value refers to the height of the terrain [17]. There are two approaches to defining the height of the terrain surface using GRID [17]: surface grid and lattice.
TIN (Triangular Irregular Network) is a digital data structure for terrain surface modeling that is a vector representation of the Earth’s physical surfaces, and consists of irregularly arranged nodes and lines with three-dimensional coordinates that are assembled in a continuous triangle network [18].
The accuracy of digital data collected by terrain scanning directly depends on the technology and devices in use. However, the accuracy of data indirectly depends on the handling of it during creation [19], transmission, processing, and storage [20,21,22]. Like all other data, DEM data is at security risk primarily due to intentional or unintentional data changes during creation, transmission, and storage. Making decisions based on incorrect data can lead to material and financial damage, increased risk to people’s safety, or even undesired consequences. This is characteristic of systems that use terrain shape data or data on what is on the terrain. DEM is important for military purposes, especially in command and information systems. It is therefore important that the data be secure and non-repudiated at the location of the reception and safe during transmission.
Geospatial data is now widely distributed in government organizations, the military, municipal affairs, and disaster defense. Therefore, this data must be reliable and secure. One of the applied mechanisms in privacy protection models uses disguising the geospatial data location [23,24]. Different security policies have been considered in different environments [25,26], as well as the application of blockchain technology [27,28,29,30] for geospatial data privacy and integrity preservation. In [31], the authors consider the protection of DEM information through encryption, hiding, and disguising. They analyze the difference between the mentioned protections to create theoretical support for DEM protection research. PKI (Public Key Infrastructure) has proven to be a good environment for preserving the integrity, authenticity, and protection of data, as well as the non-repudiation of parties in communication [32,33,34,35,36].
The purpose of this paper is to create an environment that will enable the authenticity, integrity, and non-repudiation of DEM data using PKI. The paper contains a comparative analysis of the digital elevation model data changing impact based on SRTM (Shuttle Radar Topography Mission) with a spatial resolution of 30 m and the LiDAR method of data collection with spatial resolutions of 1, 2, 5, 10, 20, and 30 m using suitable software and tools. When two or more DEMs for the same area are available, those with the highest resolution and best vertical accuracy should be considered as the reference basis for the representation of terrain features [37], which was LiDAR in this case. The model ensures the protection of DEM data at the location and during transmission, as well as the non-repudiation of parties in communication in security-sensitive systems [38], e.g., command information systems.
In the second section, the authors present the applied materials and methods. The proposed model for non-repudiation and protecting DEM data is given in the third section. The fourth section describes the results and discussion of the DEM analyses, whereas the conclusion is summed up in the conclusion section.
2. Materials and Methods
2.1. Creation DEMs Based on LiDAR Data
The cloud of points used for the continuation of work was obtained by LiDAR technology, and as the beginning of the work noted, the entire process of creating, analyzing, and visualizing digital elevation models was possible via the use of open-source software and tools. Regarding digital elevation models of radar records that are compared with models created by LiDAR technology, as noted, they can be downloaded from the Internet completely free of change. The software and tools used are:
- -
- Quantum GIS (QGIS), version 2.18.20;
- -
- Software package LasTools [39].
Quantum GIS is an open-source software, a computer application that allows you to view, edit, and analyze geo-data. Also, Quantum GIS supports a variety of raster and vector data formats. As an open-source program, there are countless upgrades and addins so that the program can be used in different areas of application.
In addition to its many features, LasTools is capable of working in a multi-purpose series. It contains tools for classification, transformation, filtering, rasterization, contouring, cutting, and polygonizing LiDAR data. All tools can be run through the Command Prompt operating environment and are also available as LiDAR data processing tools for ArcGIS, QGIS, and ERDAS IMAGINE.
To make the analysis of the results more thorough and clearer, it is necessary to collect a sample of values. For comparative analysis of digital elevation models, the number of points for sampling that was used in this paper was 100 randomly distributed points in one area of interest. Of course, this number can be increased or decreased depending on the type of analysis being performed.
2.2. Security Technologies Applied in the Model
The model is based on cryptographic technologies and PKI [40]. Encryption is the process of changing data so that the content is unreadable to anyone other than the entity performing the encryption. We used the following cryptographic technologies: symmetric and asymmetric cryptography. The model uses a combination of symmetric and asymmetric cryptography to provide encryption and signing of messages, as well as generation and encryption of the secret key.
PKI is a complex structure that includes a hardware-software-application platform and is completed with rules to manage public keys and digital certificates. The PKI uses the principles of asymmetric and symmetric cryptography to establish a secure data exchange between end entities (users, devices, software) by ensuring the authenticity, confidentiality, integrity, and non-repudiation of transactions. The PKI provides a framework that allows the effective implementation of digital certificates and digital signatures in systems with my users.
PKI gives an electronic identity to resources so that they can reliably represent themselves to other resources, communicate securely, and be responsible for transaction performing. Military applications are increasingly using PKI to guarantee high data security.
A digital certificate represents the electronic identity of an entity by establishing a connection between the entity and the public key. The entity’s private key corresponds to the public key. The electronic identity is established by the certification authority, which establishes the entity–public key connection by digitally signing the entity’s certificate with its private key.
2.3. Digital Signature Technology
A digital signature is created by calculating the hash value of the message using a hash function. The resulting digital print is encrypted by the private key of the message signer using an asymmetric cryptographic algorithm. A digital signature is added to a message that is verified on the recipient’s side to determine its authenticity.
The digital signature confirms the authenticity and integrity of messages [41]. This means that if all conditions for a digital signature are met, the user who received the signed message can believe, with certainty, that the sender has created it (authenticity) and that the message has not been changed during the transfer. A digital signature ensures non-repudiation of the parties to the transaction, which means that the sender cannot successfully argue that the message is not signed until it disturbed the confidentiality of his private key. The requirement for non-repudiation should define how the participants in the transaction cannot subsequently deny their participation in all or only in some parts of the transaction.
A digital signature represents an executed cryptographic action applied to the output of the hash function. A hash function is a function performing compression of input content into significantly smaller size output content known as digests, hash values, hashes, or hash codes.
A cryptographic hash function has special characteristics suitable for cryptographic use. One of these functions used for digital signing belongs to the family of one-way functions. This family of functions within functions has the characteristics of simple calculations of any input, while the calculated output, which is random, cannot be converted into input [42]. It is characteristic that a minimal change in the input leads to a significant change in the output. By applying a one-way hash function to a document, it becomes computationally infeasible to find another document that hashes to the same value.
Digital signing is a procedure for assigning a digital signature to a message (Figure 1). By using a one-way function, the message is transformed into a hash value, MD. Then, the hash value is encrypted by an asymmetric cryptographic algorithm (e.g., RSA) and the private key of the signer, PrKs. The value obtained is the digital signature of the message (MD) appended to the message, M.
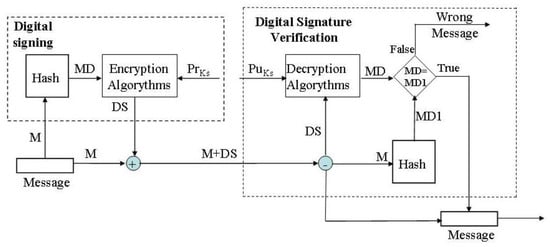
Figure 1.
Digital signing and digital signature verification procedure.
Verification of the digital signature is performed on the recipient side to establish that the signature is valid. Verification is performed by separating the digital signature from the message. The digital signature (DS) is converted by the same cryptographic algorithm (RSA) and the public key of the signer (PuKs) into a value hash. If the received hash value is equal to the hash value of the message, then the digital signature is valid. This means that the message has not been changed, that the signatory signed the message, and cannot claim that he has not signed the message. If the verification was not successful, then the integrity of the message, authenticity of the signer, and non-repudiation are jeopardized.
2.4. Applied Methodology
The methodology applied in this research consists of nine steps: selection of security issues, analysis of security issues, attack impacts on security issues, assessment of consequences, assessment of the impact on DEM data changes, selection of security technology, creation of security model, model testing, and application and comparison of the model, Figure 2.
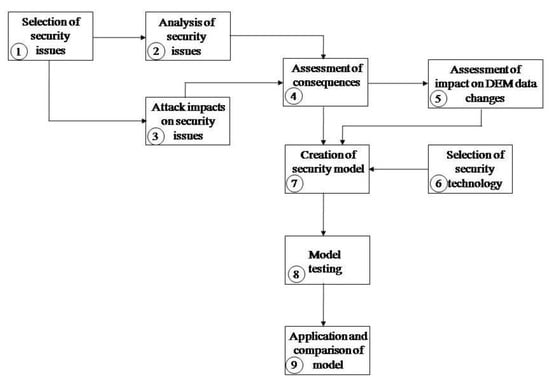
Figure 2.
Applied methodology for the creation of a model for non-repudiation and to protect DEM data.
Selection of security questions. We selected security questions from a well-known model in the literature, the five pillars of the security model, which contains the following questions [43]:
- Authenticity—the method of determining the identity of the user or entity.
- Integrity—feature that the data has not been altered or destroyed in an unauthorized manner.
- Confidentiality—the feature that the information is not available, nor is accessible to those who are not authorized to receive it.
- Availability means that the data can be freely used when needed.
- Non-repudiation—the impossibility of subsequently denying one’s participation in all or only some parts of the completed transaction.
Analysis of security issues. In this phase, we considered how to be sure that the DEM data is truly authentic—that it comes from a trusted source. We also looked at how to prevent someone else from presenting as an authentic source for DEM data.
The integrity of DEM data is important because it assures us that the data has not been changed after creation, during storage, or transferred to another location. The implementation of the integrity mechanism does not prevent the data from being modified but enables the detection of the resulting data change.
The issue of confidentiality is particularly important for security-sensitive systems that want DEM data to remain hidden from others. We consider the fulfillment of this question from point to point, that is, from the sender of DEM data to the recipient, and not only between their network devices. The goal is to make it impossible for an attacker to discover data during transmission from the sender to the recipient. The data is also protected at the storage location.
We do not consider the availability of DEM data from the aspect of enabling uninterrupted access to the data, but whether the data is available for the interested party.
Non-repudiation makes it impossible for the source to deny that the DEM data originated from him if the decisions made based on this data lead to damage. Likewise, the user cannot blame another source for the resulting damage. Therefore, the issue of non-repudiation should be carefully considered.
Attack impacts on security issues. In this step, we looked at attacks that impact the above security issues. The most common authentication attacks are brute force, impersonate attacks and man-in-the-middle attacks. Data integrity attacks are hiding, replacing, modifying, and discarding attacks. Active attacks are traffic analysis, masking, and modification attacks. Attacks on confidentiality are man-in-the-middle, traffic analysis, and traffic monitoring attacks, whereas the most famous attacks on availability are denial of service (DoS) and distributed denial of service (DDoS) attacks.
Assessment of consequences. In this step, we looked at the consequences of an attack on breaching security issues. The consequences of an authenticity violation lead the decisionmaker into the delusion that he received data from a reliable source, whereas an integrity violation leads to the use of wrong data. By violating trust, a competing party can gain insight into DEM data and, accordingly, gain dominance or other gains in the field. Failure to consider non-repudiation means that DEM data can be used, and the data source can deny that the data originated from it. Likewise, a user can use data from one source and blame another source for his failure because of using that data.
In the phase of assessment of the impact on DEM data changes, we consider in more detail the impact of unauthorized data changes, that is, data integrity violation.
After the consequences and security issues, we considered the possibility of applying security technologies. After the selection of security technologies, we created a security model. We tested the model using the appropriate application and PKI of the Ministry of Defense and the Serbian Army Forces.
We then compared the commercial DEM with the developed model and considered the feasibility of the proposed model.
3. Results
Leaking of data from this system means significant damage to this system, but also other systems (business organizations, government organizations, and the state). Security is a major problem for these systems, and it lies in its nature [44]: collection, processing, transmission, and storage of data. Security threats exploit the vulnerabilities of sensitive information such as authenticity, integrity, confidentiality, and non-repudiation.
In this section, we propose a model for non-repudiation and protected DEM data in security-sensitive systems. The model meets the following security requirements: confidentiality, authenticity, integrity, non-repudiation of transactions, and trust of the parties in the transaction. The fulfillment of the security requirements of the model is achieved by the combined application of cryptography and PKI.
The digital signature and digital certificate are used to fulfill the requirements of the authenticity, integrity, and non-repudiation of the transaction. A digital certificate and a PKI are applied to the trust of the parties in the transaction. Whereas symmetric cryptography is used to satisfy the confidentiality of transactions, asymmetric cryptography has applied the confidentiality of the secret key in the transaction.
3.1. A Model for Non-Repudiation and Protect DEM Data
The model is designed to meet the security requirements of sensitive information systems. Geographic information systems are of great importance in the military because they provide information on the geographic area necessary for planning the deployment of military forces. The army must have accurate and reliable data on the geographic area in which it operates. Operation planners can obtain geographic information (e.g., DEM data) via a computer network or a portable medium. It is very important that there is trust in the DEM data source, that they have not been changed regarding the original data, that the data source cannot deny that the DEM data originate from it, that the enemy does not come into possession of the data, and that there is trust between the parties using the DEM data.
For this purpose, the authors developed a model for securing the transfer of non-repudiated and protected DEM data in security-sensitive systems (Figure 3). The model aims to enable authentication, integrity, non-repudiation, the privacy of the message, and trust of the parties in communication. The model is described on the sender’s side and the recipient’s side. On the sender’s side, the following steps are followed before the message is sent:
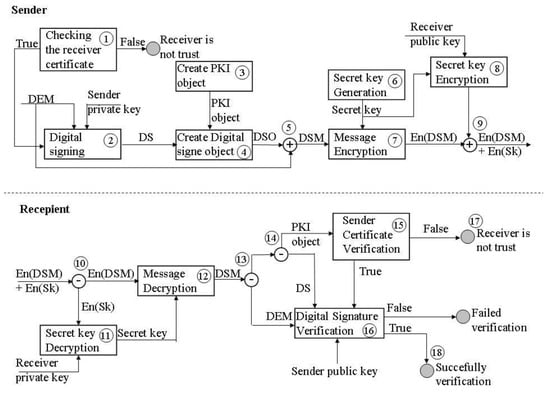
Figure 3.
Model for securing the transfer of non-repudiated and protected DEM data.
- Checking the digital identity of the message recipient;
- Digitally signing and creating the structure of a digitally signed object;
- Generating a secret key for DEM data protection during a transfer;
- Encrypting a message and a secret key;
- Forming of DEM-protected structure delivered to the recipient.
On the side of the recipient, the following steps are followed:
- Deconcatenation of the message;
- Deciphering the secret key and message;
- Separating the PKI structure from the message;
- Checking the sender’s digital identity;
- Digital signature verification.
First performed is the recipient’s digital certificate check on the sender’s side. Checking the certificate implies verification of the certificate chain, validity period, and certificate status (1). Verification of the certificate chain proves trust on the other side. The validity period and CRL check determine whether the certificate is still valid. If the certificate verification is not successful, then the sender cannot trust the recipient. Digital signing of the DEM data by the public key of the sender is performed after a successful check (2). From the received digital signature and the created PKI object (3), a digitally signed object is created (4). The PKI object contains the trust path, the CRL, and the sender’s certificate. The DSO is added to the DEM data and forms a digitally signed DEM message (5). The next step is generating a secret key (6) for encrypting the DEM data (7). At the same time, the secret key is encrypted by the message recipient’s public key (8). The encrypted message and the encrypted secret key are merged (9) and sent to the message recipient.
On the recipient side, the message is split into the part related to the message and the part related to the secret key (10). The encrypted secret key is decrypted with the private key of the recipient that corresponds to the public key (11). The message is decrypted by a secret key (12). The decrypted message splits into the DSO part and the DEM data (13). The DSO part is separated into a PKI object (14), from which is performed the verification of the sender’s certificate (15). If the verification is successful, then begins the digital signature verification (16). Otherwise, the message is rejected (17) because there is no trust in the message sender. After successful digital signature verification, the recipient accepts the message as an authentic and unchanged item (18). Now, the recipient of a DEM message may consider that only he has insight into the content of the message and that the sender cannot deny that he has sent the message.
3.2. Testing of the Proposed Model
We tested the application of the proposed model in a computer simulation environment by simulating the protection from the LiDAR radar to the end user (application, storage, user, …). For the simulation, we used the services of the Certification Authority of the Ministry of Defense and Serbian Armed Forces (Certification Authority of the MoD and SAF) and the existing service for electronic signature and point-to-point file encryption.
3.2.1. Configuring the Simulation Environment
We configured the simulation environment as follows:
- The Certification Authority of the MoD and SAF issued two types of certificates for each entity. The first entity is the LiDAR radar and the second is the end user. The Certification Authority during this process generated the first pair of asymmetric keys used for encryption purposes, whereas the second pair of cryptographic asymmetric keys is generated on the contact microcontroller of the smart card. The Certification Authority of the MoD and SAF for each generated public key or entity, issues an electronic certificate, Figure 4 and Figure 5. The first issued certificate, i.e., the first pair of asymmetric keys, is used for the electronic signature and its verification, and the second certificate, i.e., the second pair of asymmetric keys is used for encryption and decryption purposes.
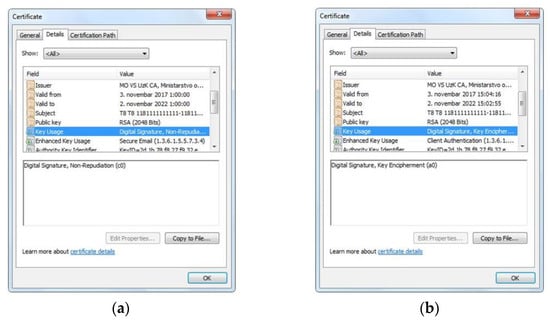 Figure 4. Digital certificates for LiDAR radar. (a) Digital certificate for electronic signature; (b) Digital certificate for encryption.
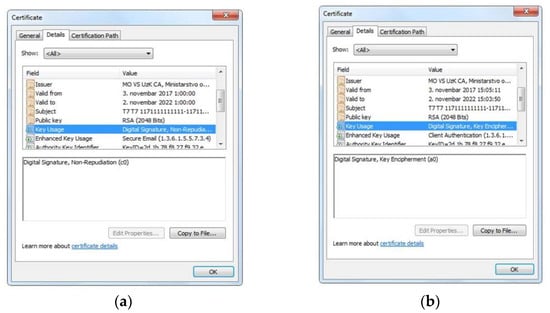 Figure 5. Digital certificates for end user. (a) Digital certificate for electronic signature; (b) Digital certificate for encryption.
 - Installing the trust path. The root certification authority such as trust point (MOVSRootCA) is installed, followed by the certificate of the subordinate certification authority (MOVSUzKCA). The point of trust is the point, i.e., the certification authority, from which the entity’s certificate starts the validation of the certification path. A certificate path is a chain of trust between certification authorities that verifies that a certificate comes from the right issuer.
- Installation of the application for working with smart cards. The TrustEdgeID v2.2.0 x64 application represents middleware for working with the contact microcontroller content of the electronic card.
- Installation of the electronic signature and encryption application. e-Doc Encryptor is an application for signing files, verifying, encrypting, and decrypting, using certificates of the Certification Authority of the MoD and SAF. This application includes a verification module as a separate PDC Manager application.
- Creation of means for a qualified electronic signature, i.e., smart cards. For testing purposes, the Certification Authority and the personalization system of the MoD and SAF issued two smart cards for LiDAR and the end user.
3.2.2. Testing of Integrity, Authenticity, and Non-Repudiation
Using the e-Doc Encryptor application we simulated electronic signing on the LiDAR side of the associated certificate for electronic signing and the means for creating a qualified electronic signature (smart card). The resulting digitally signed file was sent to the end user who verified the electronic signature, Figure 6.
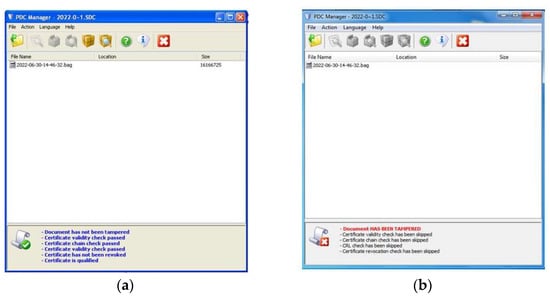
Figure 6.
Digital signature verification. (a) Successful verification; (b) Failed Verification.
The verification of the electronic signature was performed successfully, which means that there were no changes in the content of the original file generated by the LiDAR radar. In this way, the integrity of the data is preserved. Figure 7a shows the content of the original file. The public key contained in the signer’s certificate is used in the verification process. Based on the messages received during verification, we see that the signer’s certificate (LiDAR radar) is valid and that the chain of trust trusted by the signer is valid. Since both parties trust the Certification Authority of the MoD and SAF, which issued the certificate, the end user can be sure that the received file is generated on the side of the real LiDAR radar. In this way, the authenticity of the sender or the creator of the LiDAR file received by the recipient was demonstrated.
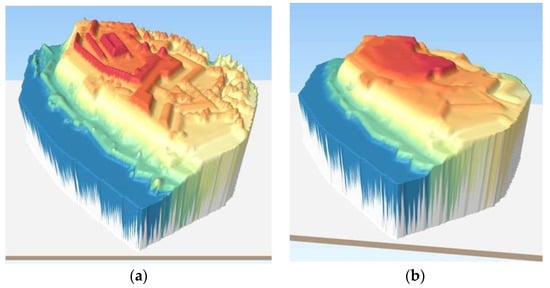
Figure 7.
Display of DEM data in GIS. (a) Original; (b) After integrity violation.
The sender uses a private key corresponding to the public key in his certificate during the signing. The sender cannot deny the generation of the content received by the end user, because only he owns the private key that corresponds to the public key in the certificate, and he used it to digitally sign. In this way, the non-repudiation of the generated data was proven, that is, it cannot be claimed that the observed LiDAR radar did not generate data.
An attack that changed the content of the file during transmission was simulated, Figure 7b. The digital signature was verified on the recipient’s side. However, the verification was unsuccessful and the received message indicates that the content has been violated, Figure 6b. This means that the data has been changed and does not match the original data that was generated on the LiDAR radar.
3.2.3. Testing of Encryption
Testing of the secure transmission of DEM data from the LiDAR radar to the end user was carried out using the e-Doc Encryptor application encryption module. This module also uses an electronic signature module to simultaneously ensure integrity, authenticity, and non-repudiation.
A symmetric key was generated on the LiDAR side to encrypt the data. Encryption of the symmetric DES 256-bit key was performed by the public key from the end user’s certificate, which is delivered to the end user during the transfer of encrypted data.
The end user decrypts the symmetric key using his private key located in the means for qualified electronic signature (electronic card chip) and authenticated with his PIN code. The resulting content is decrypted using a symmetric key.
A malicious user cannot gain insight into the contents of a protected file because he does not have the corresponding private key. Figure 8 shows an attempt to maliciously access the file content using a fake electronic card.
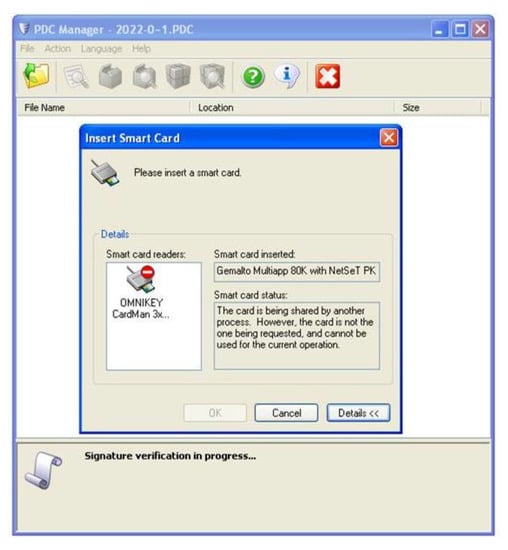
Figure 8.
An attempt to maliciously access the contents of a protected file.
The decryption module started with the procedure of decrypting the encrypted symmetric key by the private key from the electronic card. Since the private key in the attacker’s electronic card chip does not correspond to the public key, as well as the end user’s certificate for encryption does not correspond to the certificate on the attacker’s electronic card, the card software detected an irregularity and refused to carry out the decryption operation. An attacker or malicious person cannot now access the contents of the DEM.
4. Discussion
The discussion of the results can be divided and considered into three separate parts:
- Discussion of the impact of changing DEM data
- Discussion of the difference between the “commercial” and the non-repudiated and protected DEM
- Discussion of the feasibility of the proposed model
4.1. Discussion on the Impact of Changing DEM Data
Within the analysis of the impact of intentional or unintentional data changes (errors) in LiDAR digital models, the areas of the Center and Petrovaradin Fortress will be treated, because they are characters in themselves. The first area belongs to the plain part of the terrain whereas the other area belongs to the hilly part. First of all, it is important to emphasize that unauthorized data change may appear to be an accidental error in the whole process of creating DEMs. The error can be described as a recess that otherwise does not exist on that part of the terrain (Figure 9).
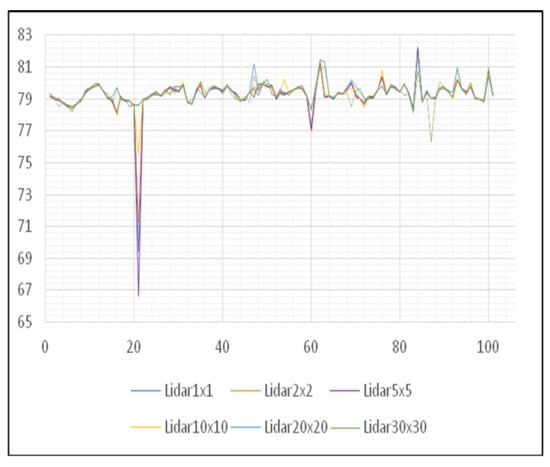
Figure 9.
Movement of height values of the DEM of the Center area.
Since the unified graph of the movement of height values does not show certain anomalies, it is necessary to divide the graphics (Figure 10). By dividing graphs, it can be noticed that the impact of this type of error is present most in digital models of higher spatial resolutions, such as 1, 2, and 5 m. While in digital models of lower spatial resolutions, such as 10, 20, and 30 m, the impact of this error is eliminated.
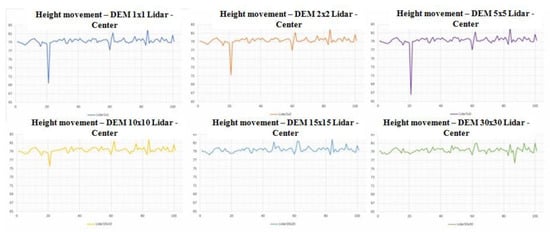
Figure 10.
Divided graphs of the movement of height values.
Based on the graphic representation of height movement for the Center area, it can be concluded that it is more convenient to use a digital elevation model created by lower spatial resolution because it is a flat terrain that does not require a high degree of detail that is obtained by the use of high-resolution digital models. As seen from the graphs in this way, it is possible to avoid accidental errors in the input data. This means that a malicious person can cause such a change in data at the source, during transmission, or stored data so the change is not visible in low resolution, whereas in high resolution it can represent an advantage for the attacker.
After establishing the error and extracting certain conclusions from this case, the error is resolved. To correct the error, after performing the classification of points, it is necessary to perform reclassification and remove these kinds of anomalies by manual processing. When the reclassification is performed, one can notice that the result is much more reliable than the previous one (Figure 11). However, this result is based on the data changed during the attack and is not reliable because there is no information on which DEM data was changed during the attack.
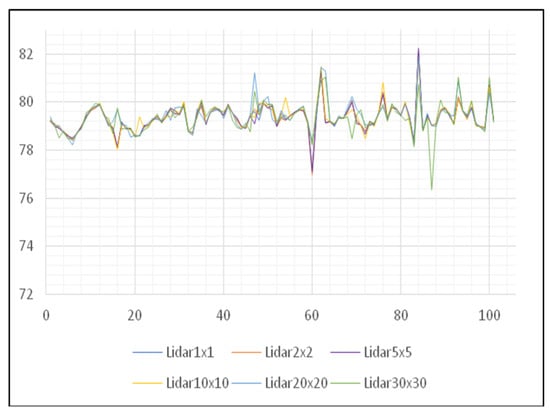
Figure 11.
Movement of corrected values of height of DEM of the Center area.
It is also necessary to analyze the results of other areas to make a conclusion regarding the use of digital elevation models created by the LiDAR data acquisition method. The next area of interest is the Petrovaradin Fortress. Unlike the previous area, this area lies on hilly terrain and has very characteristic contours of the terrain. With a graphical presentation of height values movement, it can be seen that there is a large degree of terrain unevenness, but what can also be seen is, as in the previous corrected example, the congruence of the terrain lines (Figure 12).
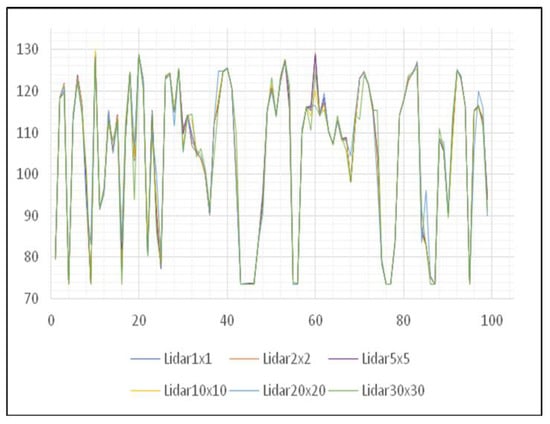
Figure 12.
Movement of the height of the DMV of the Petrovaradin Fortress area.
By comparing Figure 11 and Figure 12, it is concluded that digital elevation models created by the LiDAR method of data collection give very consistent results when talking about different spatial resolutions. Also, based on data changes made during the attack it was noted that it is more advantageous to use DEMs created with lower spatial resolution since the impact of such errors is neglected. However, the changes made in high resolution will significantly change the terrain and affect decision making. The choice of spatial resolution in the process of DEM creation depends largely on the continued use of created DEMs. If a further flow of use requires a higher degree of detail in the model, it is necessary to examine the cloud of points that enters the process of creation and make reclassification more thoroughly, so that no accidental error would occur.
The next step in the analysis of the results is the comparison of the difference in digital elevation models created by the LiDAR method, as well as the difference between LiDAR and SRTM models. Linear regression was used as a statistical indicator of the results, which in statistics refers to each approach for modeling relations between one or more variables marked with Y, as well as one or more variables marked with X, in such a way that the model linearly depends on unknown parameters collected from the data. The following statistical indicators were also obtained based on differences in height, such as root mean squared error (1) and standard deviation (2).
The root means squared error (RMSE) measures how much error exists between two sets of data. In other words, it compares the predicted value, Pi, and the observed or known value, Oi. In the continuation of the determination of RMSE for the predicted value, the values of the LiDAR digital models of various spatial resolutions were used, and for the observed value, the values of the digital models created by the radar method of recording were used. The standard deviation shows how much on average the elements of a set deviate from the arithmetic mean of the set.
Figure 13a shows the linear regression for LiDAR and SRTM digital elevation models based on the sample value of hundred points. The equation that is derived is the relationship between the LiDAR and radar digital models, and for the Center area reads y = −0.0408x + 82.74, where the value of x represents the radar DEM, and y represents the LiDAR DEM. The percentage value determination is also calculated, which in statistics represents the percentage of variation of the dependent variable that is predictable from the other independent variable.
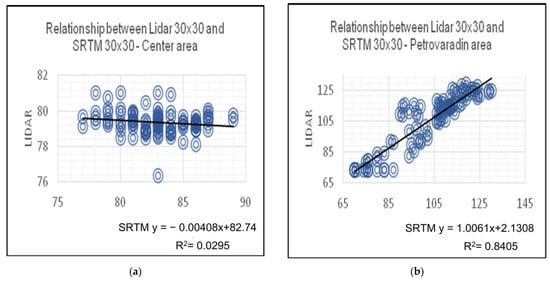
Figure 13.
Linear regression of LiDAR and radar DEMs. (a) Linear regression based on the collected sample of the Center area; (b) Linear regression based on the collected sample of the Petrovaradin area.
If the regression line does not miss any of the points significantly, then the determination percentage is relatively high. The average percentage of determination of the height values for the Center area is about 3%. Also, in Figure 13b, referring to the Petrovaradin Fortress area, linear regression of the height values from which the linear equation y = 1.0061x + 2.1308 is performed, but in contrast to the previous area, the average determination percentage is about 86%.
The average percentage of determination of altitude values based on the same calculations for the Spens area is about 6%, whereas for the Campus area it is about 11%. In addition, during the analysis, RMSE and standard deviations of the difference in the value of the heights of all areas are calculated (Table 1 and Table 2).

Table 1.
Calculated RMSE values.
Table 2.
Standard deviations of LiDAR DEM differences and LiDAR and SRTM DEM spatial resolutions 30 × 30.
By determining the statistical indicators, it was concluded that there are large differences between the digital models created by LiDAR and the radar method. Table 2 shows standard deviations calculated based on DEM differences created by only LiDAR methods and standard deviation of LiDAR and SRTM DEM spatial resolutions 30 × 30. By comparing, it is concluded that the use of radar digital models with a spatial resolution of 30 m may have an impact on obtaining incorrect results in the subsequent use of the model, in the case of small areas as shown in the paper.
4.2. Discussion of the Difference between the “Commercial” and the Non-Repudiated and Protected DEM
Commercial DEM data are open for use on the market and can be downloaded on the Internet. Are the published DEM data to locations real? Do the data show the real geographic area? By using a protected and non-repudiation DEM, the user is sure that the data comes from a source he trusts and that they did not change during delivery or after the digital signing (if it is performed at the time of the data creation).
The DEM data source may deny that the data originates from it. However, digital signatures technology and PKI firmly prove who is the data source. Non-repudiation is realized by the inability of the sender to subsequently revoke the sending message if his digital signature is successfully verified.
In military applications, it is important to protect the transfer of DEM data. If the enemy reveals the contents of the operation, which was planned using DEM data, they will be able to take appropriate measures to make the operation unsuccessful.
The model allows the preservation of confidentiality of DEM data using message encryption by a symmetric cryptographic algorithm, while secrecy of the key is realized by encryption with an asymmetric cryptographic algorithm. In this model, trust is built by the certification authority trusted by all users, as it issues a digital certificate to all.
4.3. Discussion of the Feasibility of the Proposed Model
The management of DEM data in a military network.
DEM data can be managed by using the digital certificate status check service. A digital certificate can have a revoked or suspended status. The status of the digital certificate is checked on the sender’s side, so if the certificate is revoked or suspended, the sender cannot send data to the recipient. On the other hand, if the recipient finds that the certificate is not valid during the verification of the digital signature, it rejects such data because there is no longer any guarantee that it comes from the trusting sender.
The model enables secure transmission of the digital securities to every end entity. This characteristic can be used to download the encryption key from the distribution center for key management.
Message protection from source to end user. The model allows data to be transmitted to the end source without a third-party having insight into the content of the message. Data security is not affected by the transmission path nor the number of devices participating in the transmission. The model assures the recipient that they will receive data that other entities have not had access to, has not been altered, and came from a trusted source. On the other hand, the sender is sure that they sent the data to the authentic recipient and that no one other than the recipient will see the data.
The model does not depend on the applied network technology. This means that the model does not depend on the size of the network, the topology of the network, the role of the entities in the network, and the method of communication between the network nodes.
Independence from the position of end entities and network nodes. The model enables the fulfillment of security questions in stationary and dynamic environments of entities and network elements. If the entities that exchange data move and (or) if the network nodes change their position, as long as there is network connectivity, the model will ensure authenticity, integrity, confidentiality, and non-repudiation.
5. Conclusions
With the latest achievements in the field of computer technology, very fast processing of millions of points is enabled. It is also possible to create high-quality digital models with today’s data collection technology and processing software. If there is no trust in the collected data at the source or during transmission, as well as at the location of use, the digital model is unreliable and risky for decision making no matter how high quality it is.
It also concluded that the use of digital elevation models created by the LiDAR method of data collection is far more accurate even when using lower spatial resolution models. Moreover, based on the analysis, it is shown that using the lower resolution model leads to the removal of system errors that have occurred in the data collecting process.
The proposed model for providing non-repudiation and protected DEM data makes it possible to prove the authenticity and non-repudiation of the DEM data source, the integrity of the DEM data, and the way of protecting the confidentiality of the data during the transfer. The applied technology in the model provides reliability and security in the application of DEM data for military and commercial purposes. Trusted and protected DEM data give priority to business and military applications of GIS.
Author Contributions
Conceptualization, I.V. and M.B.; methodology, R.P., D.R. and G.O.; software, V.M.P.; validation, S.S., M.B. and D.R.; formal analysis, V.M.P.; investigation, R.P. and V.M.P.; resources, M.B. and I.V.; data curation, V.M.P.; writing—original draft preparation, R.P., M.B. and V.M.P.; writing—review and editing, S.S., G.O., I.V. and D.R.; visualization, R.P.; supervision, S.S.; project administration, I.V. and G.O.; funding acquisition, I.V. All authors have read and agreed to the published version of the manuscript.
Funding
This work was financially supported by the University of Defense, Serbia, grant number VA-TT/1/21-23. The APC was funded by University of Defense, Serbia, grant number VA-TT/1/21-23.
Institutional Review Board Statement
Not applicable.
Informed Consent Statement
Not applicable.
Data Availability Statement
Not applicable.
Acknowledgments
The paper is a part of the research done within the project “Designing and realization of the algorithm” for autonomous guidance of unmanned mobile ground platforms”. No. VA-TT/1/21-23. The authors would like to thank the University of Defense, Serbia.
Conflicts of Interest
The authors declare no conflict of interest.
References
- Kent, A.J.; Hopfstock, A. Topographic Mapping: Past, Present and Future. Cartog. J. 2018, 55, 305–308. [Google Scholar] [CrossRef]
- Šiljeg, A.; Lozić, S.; Radoš, D. The effect of interpolation methods on the quality of a digital terrain model for geomorphometric analyses. Teh. Vjesn. 2015, 22, 1149–1156. [Google Scholar]
- Miha, L.; Ciril, B.; Matija, M. Porazdeljeno upodabljanje vokseliziranih podatkov LiDAR. Distributed rendering of voxelized LiDAR data. Geod. Vestn. 2016, 60, 615–626. [Google Scholar]
- Earth Resources Observation and Science (EROS) Center. USGS EROS Archive—Digital Elevation—Shuttle Radar Topography Mission (SRTM) Non-Void Filled, USGS. Available online: https://www.usgs.gov/centers/eros/science/usgs-eros-archive-digital-elevation-shuttle-radar-topography-mission-srtm-non (accessed on 16 September 2022).
- GISGeography. SRTM Shuttle Radar Topography Mission. Available online: https://gisgeography.com/srtm-shuttle-radar-topography-mission/ (accessed on 10 September 2022).
- ASTER Global Digital Elevation Map Announcement. Jet Propulsion Laboratory, NASA. Available online: https://asterweb.jpl.nasa.gov/gdem.asp (accessed on 10 September 2022).
- ALOS. ALOS Research and Application Project. Available online: https://www.eorc.jaxa.jp/ALOS/en/index_e.htm (accessed on 10 September 2022).
- Schumann, G.; Matgen, P.; Cutler, M.E.J.; Black, A.; Hoffmann, L.; Pfister, L. Comparison of remotely sensed water stages from LiDAR, topographic contours and SRTM. ISPRS J. Photogramm. Remote Sens. 2007, 63, 283–296. [Google Scholar] [CrossRef]
- Tilen, U.; Božo, K.; Bojan, S.; Mojca, K.F. Analiza kakovosti določitve parametrov krogle pri terestričnem laserskem skeniranju. Quality analysis of the sphere parameters determination in terrestrial laser scanning. Geod. Vestn. 2014, 58, 11–27. [Google Scholar]
- Jojemar, B.; Romy, A.; Alex, O. Contour Comparison of SAR and LiDAR DEM using Field Data Points. Philippine LiDAR II, College of Forestry and Environmental Science, Central Mindanao University, University Town, Musuan, Maramag, Bukidnon, Philippines. Available online: https://citeseerx.ist.psu.edu/viewdoc/download?doi=10.1.1.740.378&rep=rep1&type=pdf (accessed on 10 September 2022).
- Meixner, J.; Grimmer, J.C.; Becker, A.; Schill, E.; Kohl, T. Comparison of different digital elevation models and satellite imagery for lineament analysis: Implications for identification and spatial arrangement of fault zones in crystalline basement rocks of the southern Black Forest (Germany). J. Struct. Geol. 2017, 108, 256–268. [Google Scholar] [CrossRef]
- Rajasekhar, M.; Raju, G.S.; Raju, R.S.; Ramachandra, M.; PradeepKumar, B. Data on comparative studies of lineaments extraction from ASTER DEM, SRTM, and Cartosat for Jilledubanderu River basin, Anantapur district, A.P, India by using remote sensing and GIS. Data Brief 2018, 20, 1676–1682. [Google Scholar] [CrossRef]
- Ralf, L.; Philipp, S. Validation of digital elevation models from SRTM X-SAR for applications in hydrologic modelling. ISPRS J. Photogramm. Remote Sens. 2006, 60, 339–358. [Google Scholar]
- Arun, P.V. A comparative analysis of different DEM interpolation methods. Egypt. J. Remote Sens. Space Sci. 2013, 16, 133–139. [Google Scholar]
- Arun, P.; Katiyar, S.K.; Vishnu, P. Performances evaluation of different open source DEM using Differential Global Positioning System. Egypt. J. Remote Sens. Space Sci. 2016, 19, 7–16. [Google Scholar]
- Ismail, E. Vertical accuracy assessment for SRTM and ASTER Digital Elevation Models: A case study of Najran city, Saudi Arabia. Ain Shams Eng. J. 2017, 9, 1807–1817. [Google Scholar]
- Kutalmis, G.; Alper, S. Comparison of spatial interpolation methods and multi-layer neural networks for different point distributions on a digital elevation model. Geod. Vestn. 2013, 57, 523–543. [Google Scholar]
- Li, Z.; Zhu, Q.; Gold, C. Digital Terrain Modeling—Principles and Methodology; CRC Press: Boca Raton, FL, USA, 2015. [Google Scholar]
- Mesa-Mingorance, J.L.; Ariza-López, F.J. Accuracy Assessment of Digital Elevation Models (DEMs): A Critical Review of Practices of the Past Three Decades. Remote Sens. 2020, 12, 2630. [Google Scholar] [CrossRef]
- Bays, L.R.; Oliveira, R.R.; Barcellos, M.P.; Gaspary, L.P.; Mauro Madeira, E.R. Virtual network security: Threats, countermeasures, and challenges. J. Internet Serv. Appl. 2015, 6, 1. [Google Scholar] [CrossRef]
- Ferreira, M.B.; Alonso, K.C. Identity management for the requirements of information security. In Proceedings of the 2013 IEEE International Conference on Industrial Engineering and Engineering Management, Bangkok, Thailand, 10–13 December 2013. [Google Scholar]
- Singh, S.; Jeong, Y.; Hyuk, J. A survey on cloud computing security: Issues, threats, and solutions. J. Netw. Comput. Appl. 2016, 75, 200–222. [Google Scholar] [CrossRef]
- Hojati, M.; Farmer, C.; Feick, R.; Robertson, C. Decentralized geoprivacy: Leveraging social trust on the distributed web. Int. J. Geogr. Inf. 2021, 35, 2540–2566. [Google Scholar] [CrossRef]
- Partovi, A.; Zheng, W.; Jung, T.; Lin, H. Ensuring privacy in location-based services: A model-based approach. arXiv 2020, arXiv:2002.10055. [Google Scholar]
- Rajpoot, M.S.; Patel, P.A. Comparative Study on Various Aspects of Security of Geospatial Data. In Proceedings of the 2014 Fourth International Conference on Communication Systems and Network Technologies, Bhopal, India, 7–9 April 2014; pp. 708–712. [Google Scholar]
- Matheus, A. Security Considerations on Processing of Geospatial Information in the Cloud. In Proceedings of the 2013 Fourth International Conference on Computing for Geospatial Research and Application, San Jose, CA, USA, 22–24 July 2013; pp. 82–86. [Google Scholar]
- Papantoniou, C. GeoBlockchain: The Analysis, Design, and Evaluation of a Spatially Enabled Blockchain. Ph.D. Thesis, The Claremont Graduate University, Claremont, CA, USA, 2021. [Google Scholar]
- Qiu, Y.; Liu, Y.; Li, X.; Chen, J. A novel location privacy preserving approach based on blockchain. Sensors 2020, 20, 3519. [Google Scholar] [CrossRef]
- Daho, A.B. Crypto-spatial: An open standards smart contracts library for building geospatially enabled decentralized applications on the Ethereum blockchain. ISPRS Arch. 2020, 43, 421–426. [Google Scholar]
- Kamali, M.; Malek, M.R.; Saeedi, S.; Liang, S. A Blockchain-Based Spatial Crowdsourcing System for Spatial Information Collection Using a Reward Distribution. Sensors 2021, 21, 5146. [Google Scholar] [CrossRef]
- Chen, L.Y.; Song, G.M. Study of DEM Information Security in Geographic Information Service. Appl. Mech. Mater. 2015, 713, 2147–2151. [Google Scholar] [CrossRef]
- Prodanović, R.; Sarang, S.; Rančić, D.; Vulić, I.; Stojanović, G.M.; Stankovski, S.; Ostojić, G.; Baranovski, I.; Maksović, D. Trustworthy Wireless Sensor Networks for Monitoring Humidity and Moisture Environments. Sensors 2021, 21, 3636. [Google Scholar] [CrossRef]
- Prodanović, R.; Rančić, D.; Vulić, I.; Zorić, N.; Bogićević, D.; Ostojić, G.; Sarang, S.; Stankovski, S. Wireless Sensor Network in Agriculture: Model of Cyber Security. Sensors 2020, 20, 6747. [Google Scholar] [CrossRef]
- Höglund, J.; Lindemer, S.; Furuhed, M.; Raza, S. PKI4IoT: Towards public key infrastructure for the Internet of Things. Comput. Secur. 2020, 89, 101658. [Google Scholar] [CrossRef]
- Akhundov, H.; van der Sluis, E.; Hamdioui, S.; Taouil, M. Public-key based authentication architecture for IoT devices using PUF. arXiv 2020, arXiv:2002.01277. [Google Scholar]
- Wang, M.; Qian, C.; Li, X.; Shi, S.; Chen, S. Collaborative Validation of Public-Key Certificates for IoT by Distributed Caching. In Proceedings of the IEEE INFOCOM 2019—IEEE Conference on Computer Communications, Paris, France, 29 April–2 May 2019; pp. 847–855. [Google Scholar]
- Leitão, J.P.; Prodanović, D.; Maksimović, Č. Improving merge methods for grid-based digital elevation models. Comput. Geosci. 2016, 88, 115–131. [Google Scholar] [CrossRef]
- Wu, X.; Le, P.D.; Bala, S. Security Architecture for Sensitive Information Systems. In Convergence and Hybrid Information Technologies; Crisan, M., Ed.; IntechOpen: London, UK, 2010; pp. 239–266. [Google Scholar]
- Rapidlasso GmbH. LAStools. Available online: https://rapidlasso.com/lastools/ (accessed on 10 September 2022).
- Adams, C.; Lloyd, S. Understanding PKI: Concepts, Standards, and Deployment Considerations, 2nd ed.; Addison-Wesley Professional: Boston, MA, USA, 2003. [Google Scholar]
- Gallagher, D.P. Digital Signature Standard (DSS); National Institute of Standards and Technology: Gaithersburg, MD, USA, 2013. [Google Scholar] [CrossRef]
- Buldas, A.; Lipmaa., H.; Schoenmakers, B. Optimally Efficient Accountable Time-Stamping. In Public Key Cryptography—PKC’2000; LNCS 1751; Springer: Berlin, Germany, 2000; pp. 293–305. [Google Scholar]
- Belapurkar, A.; Chakrabarti, A.; Ponnapalli, H.; Varadarajan, N.; Padmanabhuni, S.; Sundarrajan, S. Distributed Systems Security: Issues, Processes and Solutions; John Wiley & Sons Inc.: Hoboken, NJ, USA, 2009. [Google Scholar]
- Xianping, W. Security Architecture for Sensitive Information Systems. Ph.D. Thesis, Faculty of Information Technology Monash University, Clayton, Australia, 2009. [Google Scholar]


Publisher’s Note: MDPI stays neutral with regard to jurisdictional claims in published maps and institutional affiliations. |
© 2022 by the authors. Licensee MDPI, Basel, Switzerland. This article is an open access article distributed under the terms and conditions of the Creative Commons Attribution (CC BY) license (https://creativecommons.org/licenses/by/4.0/).