1. Introduction
Environmental Microorganisms (EMs) collectively refer to all microorganisms that have an impact on the environment, including microorganisms living in the natural environment (such as oceans and deserts) and artificial environments (such as fisheries and wheat fields) [
1]. There are about
types of EMs on Earth [
2]. All of them play a positive or negative role in the task of environmental governance. For example, plant rhizosphere-promoting bacteria can help promote plants’ healthy growth. It can also inhibit pathogenic microorganisms that harm plants. However, harmful rhizosphere bacteria can inhibit the normal growth of plants by producing phytotoxins [
3]; the emergence of cyanobacteria will accelerate the process of eutrophication of water bodies and damage water quality, which will eventually lead to the death of a large number of aquatic organisms; aspidisca has a strong sensitivity to the chemical substances contained in the water body. Therefore, aspidisca is widely applied for evaluating the quality of the aquaculture water body in the water aquaculture industry. To better play the role of EMs in environmental governance, research on EM detection is essential. The methods of EM detection can be mainly grouped into manual microscope observation methods and computer-aided detection methods.
Manual microscope observation methods refer to the observation and record of EMs in the field of view by an experimenter with certain professional knowledge using a microscope. However, there exist some limitations and disadvantages with respect to manual microscope observation methods. First, the experimenter cannot make quick judgments and must consult many reference materials when facing a wide variety of EMs. Second, all experimenters have to spend a substantial amount of time when learning the basics of EMs and the operation of the microscope. Finally, the detection results obtained by different operators might be different, and the objectivity of the detection results is insufficient [
4]. Therefore, manual microscope observation methods have great limitations for EM detection tasks.
Compared to manual microscope observation methods, computer-aided detection methods are more objective, accurate, and convenient. With rapid developments in computer vision and deep learning technologies, computer-assisted image analysis is broadly applied in many research fields, including fire emergency [
5], histopathological image analysis [
6,
7,
8,
9], cytopathological image analysis [
10,
11,
12], object detection [
13,
14,
15,
16,
17], microorganism classification [
18,
19,
20,
21,
22,
23], microorganism segmentation [
24,
25,
26,
27], and microorganism counting [
28,
29]. In addition, with the advancement of computer hardware and the rapid development of computer-aided detection methods, the results obtained by computer-aided detection methods in EM detection are improving. Currently, the most popular computer-aided detection method is the EM detection method based on deep learning [
30]. However, there is no relevant research on the detection of multi-class EMs. Therefore, we choose some classical detectors based on deep learning for multi-class EM detection and propose a novel detector called squeeze-and-excitation-based mask region convolutional neural network (SEM-RCNN). The flowchart of SEM-RCNN is shown in
Figure 1.
In
Figure 1, three main parts are contained. Part one is the original dataset part, which includes enough images of EMs for model training and testing. We will introduce the specific information about the original dataset in detail in the experimental section. Part two is the data-processing part. In this part, the original dataset is firstly labeled in the format of the object detection dataset. Then, all data are grouped into the training set, validation set, and test set according to a certain proportion. Part three is the EM detection part. Firstly, the original SEM-RCNN is pre-trained on Microsoft Common Objects in Context (MS-COCO) dataset. Then the proposed model is finetuned and trained on the training and validation sets of EMDS-6. After that, the detection performance of the trained model is verified on the test set. Finally, we evaluate the detection results of SEM-RCNN by employing appropriate evaluation indicators.
The main contributions of this paper are listed as follows:
A novel detector based on convolutional neural network (CNN): SEM-RCNN is proposed for multi-class EM detection;
The block of SENet is designed to combine with ResNet as the backbone of the proposed SEM-RCNN, which can extract features with a self-attention mechanism;
The proposed SEM-RCNN achieves the optimal detection performance both for small (EMDS-6) and large (blood cell) datasets.
To illustrate the proposed method clearer, the structure of this paper is designed as follows: In
Section 2, the related research about computer-aided EM detection is summarized; In
Section 3, detailed information about SEM-RCNN is introduced; In
Section 4, the detailed operation of the experiments is introduced, including experimental data, experimental settings, evaluation criteria, detection results, and extensive experiment; In
Section 5, the paper is summarized comprehensively.
2. Related Work
In this section, we group all computer-aided EM detection methods into classical image-processing-based methods, traditional machine-learning-based methods, and deep-learning-based methods. The detection methods are introduced based on relevant research studies.
2.1. Classical Image Processing Based Methods
Classical image-processing-based methods are the earliest computer-aided methods for EM detection. Classical image-processing-based methods contain two subcategories of detection methods, segmentation-based methods, and classification-based methods.
Thresholding-based methods are the most used technologies for image segmentation, such as in [
31,
32,
33,
34,
35,
36,
37,
38,
39,
40,
41,
42,
43,
44,
45,
46,
47,
48]. Thresholding methods are the most commonly used methods in image segmentation. In addition, thresholding methods can select an appropriate threshold for detection according to different EMs, which gives these methods strong generalization abilities. In [
32], an area threshold was applied for
Chlamydomonas and
Chlamydomonas bicuspidata detection. In [
37], the multiple thresholds method was employed for motile microorganisms. Multiple thresholds were firstly applied to binarize input images. Then, all white regions are regarded as EMs. In [
40], the color threshold was applied for tubercle bacillus detection. In [
43], adaptive threshold and global threshold were applied for nematode detection. An adaptive threshold was employed for binarizing the original image. Then, a global threshold was applied for extracting reference labels. By combining these two processed images, the nematode can be detected. Among all these works, the Otsu threshold is the most used one. In [
33,
42,
44,
45,
46], the Otsu threshold is applied for different EMsdetection. The main idea of Otsu was to select an optimal threshold automatically from a gray-level histogram by a discriminant criterion [
49]. The Otsu threshold can provide good results with simple calculations. Even if the gray value of the object to be segmented is similar to the gray value of the background, the Otsu threshold can achieve good segmentation results. However, due to the limitation of the calculation method, when the difference between the foreground and the background area is too large, the Otsu threshold cannot achieve a good segmentation result [
50].
Classification-based methods apply shape features, geometric features, color features, texture features, and statistical features for EM detection, such as in [
51,
52,
53,
54,
55,
56,
57,
58,
59,
60,
61,
62,
63,
64,
65]. In [
51,
52,
55], shape features were selected as vital information for EM detection, including contour features, area features, squareness, angular, roundness, etc. In [
56], a contour feature was used for detecting
Methanospirillum hungatei and
Methanosarcina mazei. In [
52], a
C. elegans nematode worm detection method based on angular features was designed. In [
55], roundness was selected as the criterion for judging whether the detected objects are Rotavirus-A particles. In [
57,
59,
60,
61,
62,
63,
66], geometric features were selected for EM detection. In [
60], the area was regarded as an important indicator for judging the presence of bacteriophage. In [
61], the most suitable combination of some kinds of geometric features was selected and applied for bacilli detection. In [
62,
63], an automatic detection method based on area-to-length ratio was proposed for six different airborne fungi spores. In [
57,
61], color features were employed for initial screening regions containing EMs. In [
64], a
Anabaena and
Oscillatoria detection method based on texture features was proposed. From all these classification based methods, we can find that shape features are the most suitable feature for EM detection. In addition, detection methods by combining different features can achieve improved detection performances than a single feature.
2.2. Traditional Machine-Learning-Based Methods
Since 2006, traditional machine-learning-based methods have been gradually applied in the field of EM detection, such as in [
67,
68,
69,
70,
71,
72,
73,
74,
75,
76,
77,
78,
79]. The main idea of this method is to determine the EMs category according to the acquired feature information and the corresponding network structure. In [
67], a back propagation neural network was employed for bacteria detection. After several preprocessing steps such as threshold-based segmentation and denoising, morphological features of bacteria are extracted and then sent to a back propagation neural network for detection. In [
68], a genetic algorithm-neural network method was presented for tubercle bacillus detection. By applying a color filter, moving
k-means clustering, and region growing, a suitable segmented image was obtained, which is then sent to the color filter, moving
k-means clustering and region growing for the final detection. In [
69], a probabilistic neural network is applied for pathogens detection. First, the original image is processed by background correction and object isolation. Then, regions that may contain pathogens were selected. At last, a probabilistic neural network is built for pathogen detection.
Based on the research on traditional machine learning methods in this field, we find that the most widely used classification model is the support vector machine (SVM) classifier, mentioned in [
70,
71,
72,
73,
74,
75,
76,
77,
78,
79]. SVM can construct an optimal separation hyperplane in the feature space of the data to maximize the gap between positive and negative samples in the training set [
80], which makes SVM an efficient classifier for binary classification tasks. Furthermore, SVM can efficiently use smaller training samples. This enables SVM in achieving higher classification accuracies on a smaller training set. Therefore, after the development of related technologies of SVM, it has been gradually applied to the detection of EMs. In [
71], an SVM classifier is proposed for P. minimum species detection. In addition, to improve the accuracy of the detection results, the SVM classifier is combined with a random forest classifier. In [
74], a multi-class SVM was proposed for EM detection. First, the Sobel edge detector is applied for image segmentation. After that, shape features, Fourier descriptors, and some other features were extracted from processed images and then sent to a multi-class SVM for detecting EMs. In [
78], an SVM classifier is applied for planktonic organisms detection. The preprocessing step includes threshold segmentation, robust refocusing criterion, and re-segmentation. After that, the processed image is detected by an SVM classifier.
2.3. Deep-Learning-Based Methods
Compared with methods based on traditional machine learning, deep-learning-based methods have the advantages of the wide range of applications and high applicability. In the feature extraction step of detection processing, traditional machine-learning-based methods use manual feature engineering methods, which are labor-intensive and time-consuming. Deep-learning-based methods can achieve automatic feature learning through advanced network structures and complex features compared to simple ones. Therefore, with the development of deep learning technologies, increasing research about EM detection using deep learning methods is presented, such as in [
81,
82,
83,
84,
85,
86,
87,
88,
89,
90]. In [
81,
82,
83], CNN was employed for EM detection. In [
81], a tubercle bacillus detector was designed based on CNN. In [
83], a CNN-based method was proposed for actinobacterial species detection. In [
88], a region convolutional neural network (R-CNN)-based detector was proposed for diatom detection. In addition, a you only look once (YOLO)-based detector is prepared for comparisons. The result indicates that YOLO performs better than R-CNN in diatom detection. In [
84,
85,
86,
87], Faster R-CNN-based methods were employed for EM detection. In [
85], a Faster R-CNN-based detector was proposed for parasite egg detection. In [
87], Faster R-CNN was applied for algal detection. About 1859 samples were prepared for the test.
After consulting all these related research studies, we found that classical image-processing-based methods were mainly used as preprocessing methods in current EM detection studies. The most widely used methods in EM detection are traditional machine-learning-based methods. Although there are a few studies about deep-learning-based methods, deep-learning-based methods show great potential in EM detection. Therefore, we designed a deep-learning-based detector for EM detection called SEM-RCNN.
3. SEM-RCNN-Based EM Detection Method
The structure of the proposed SEM-RCNN is shown in
Figure 2, which mainly includes the input step, feature extraction step, region proposal step, a mapping step between candidate boxes and feature maps, and the output step.
Figure 2: (a) Input: The dataset contains images of 21 types of EMs and their corresponding labeled images. There are 840 images in total, and each type has 40 original images (
Section 4.1 and
Section 4.2.1 for details). (b) Feature extraction: A combination network based on SENet and feature pyramid network (FPN) is proposed for fuller and deeper feature extraction (
Section 3.1 for details). (c) Region proposal: A region proposal network (RPN) was applied to obtain multi-candidate boxes of the object (
Section 3.2 for details). (d) Mapping between candidate boxes and feature maps: The method based on the region of interesting align (ROI align) is applied for accurate mapping between candidate boxes and the feature map, as well as the mapping between the feature map and the fixed size feature map (
Section 3.3 for details). (e) Output: A multi-branched structure is applied for feature maps regression, and the combined approach of the fully connected layer, bounding box regression, and Softmax is applied for object detection (
Section 3.4 for details).
3.1. Feature Extraction Step
The feature extraction step is the basis for deep learning to perform all tasks. Therefore, whether a suitable feature extraction network is selected or not directly affects final detection results. After analyzing and comparing the existing networks, we finally chose the deep residual network (ResNet) [
91] combined with a squeeze-and-excitation network (SENet) [
92] as the basic backbone, together with the feature pyramid network(FPN) [
93]. ResNet can solve the degradation problem occurring in the training process of CNN. SENet can effectively enhance the needed feature information while suppressing less useful feature information. FPN can achieve the accurate detection of multi-scale objects by making good use of shallow feature information and deep feature information.
3.1.1. ResNet
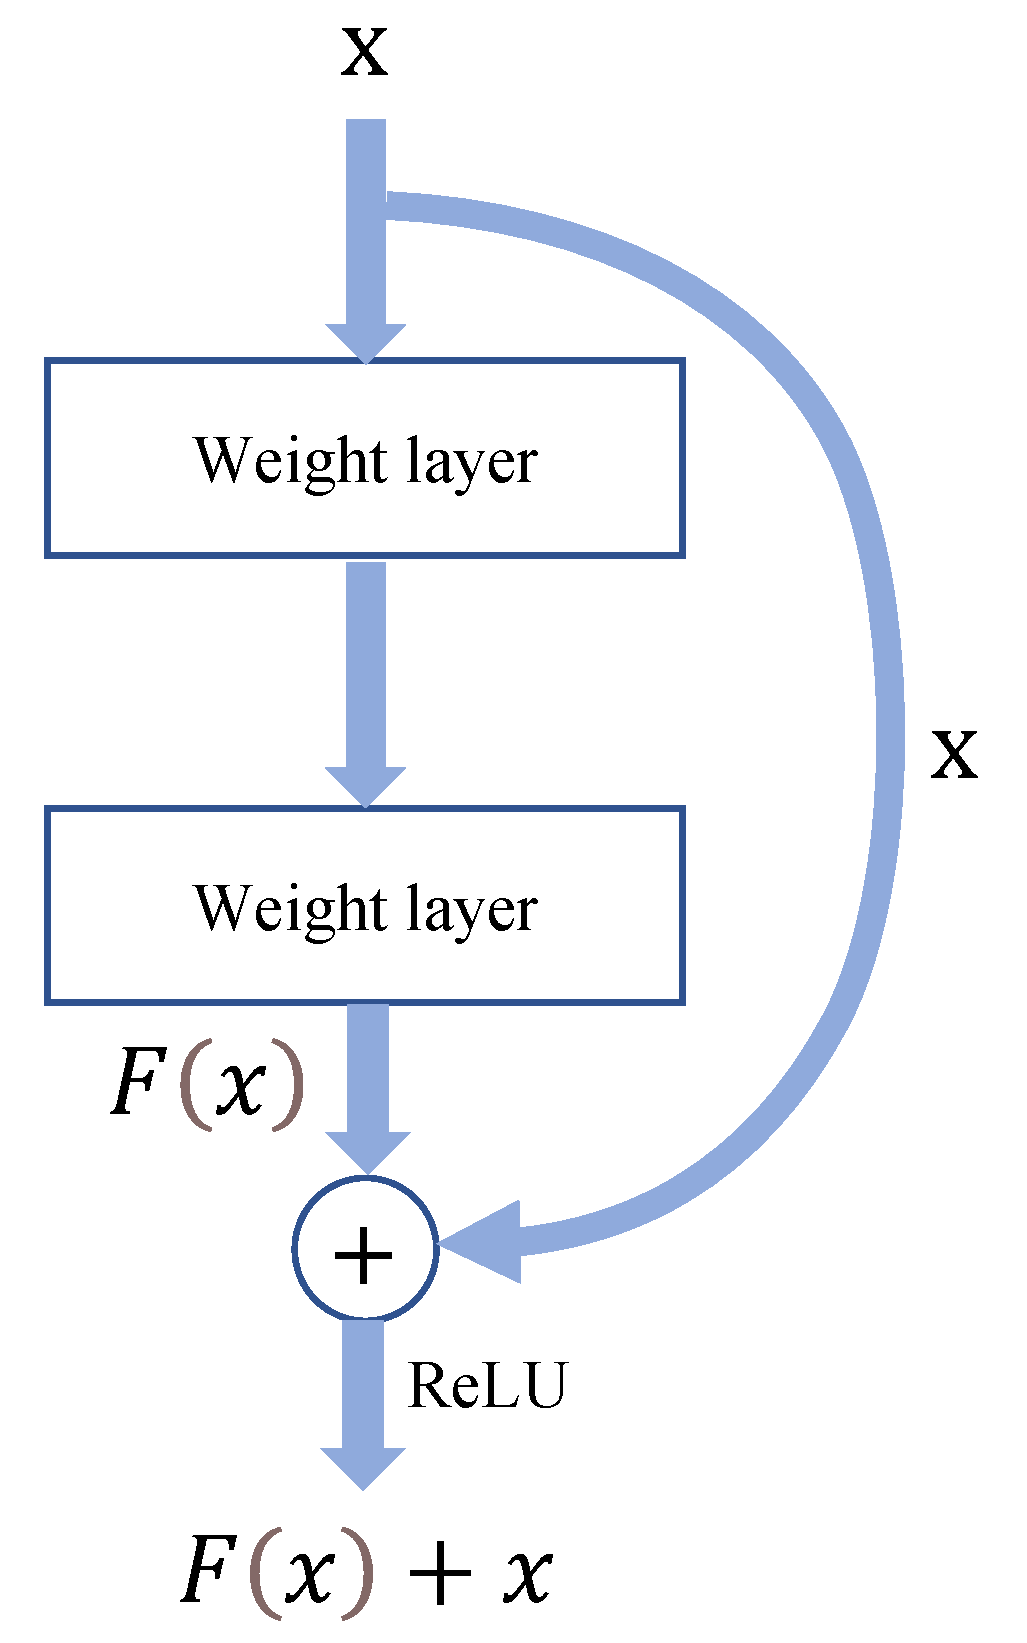
The main contribution of ResNet concerns an inevitable problem in the training of CNN, called the degradation problem. In general, as the number of layers of the network model increases, the overall detection effectiveness of the CNN model improves. However, when the number of layers deepens to a certain level, the effectiveness of the CNN model decreases, which is the degradation problem that occurs when CNN is trained. The idea of residual learning is introduced with conventional CNNs in ResNet to solve the degradation problem encountered in the deep training of CNN. The structure of a residual block is shown in
Figure 3, where
x denotes features learned by the shallow network;
F(
x) is the residual function. The residual block allows the deep network to learn new features relative to the shallow network continuously. From
Figure 3, the actual features learned by the network after the residual block are
F(
x) +
x, which means that a deep network can obtain deeper and more complex features from the features extracted by the shallow network based on the introduction of the residual block.
3.1.2. SENet
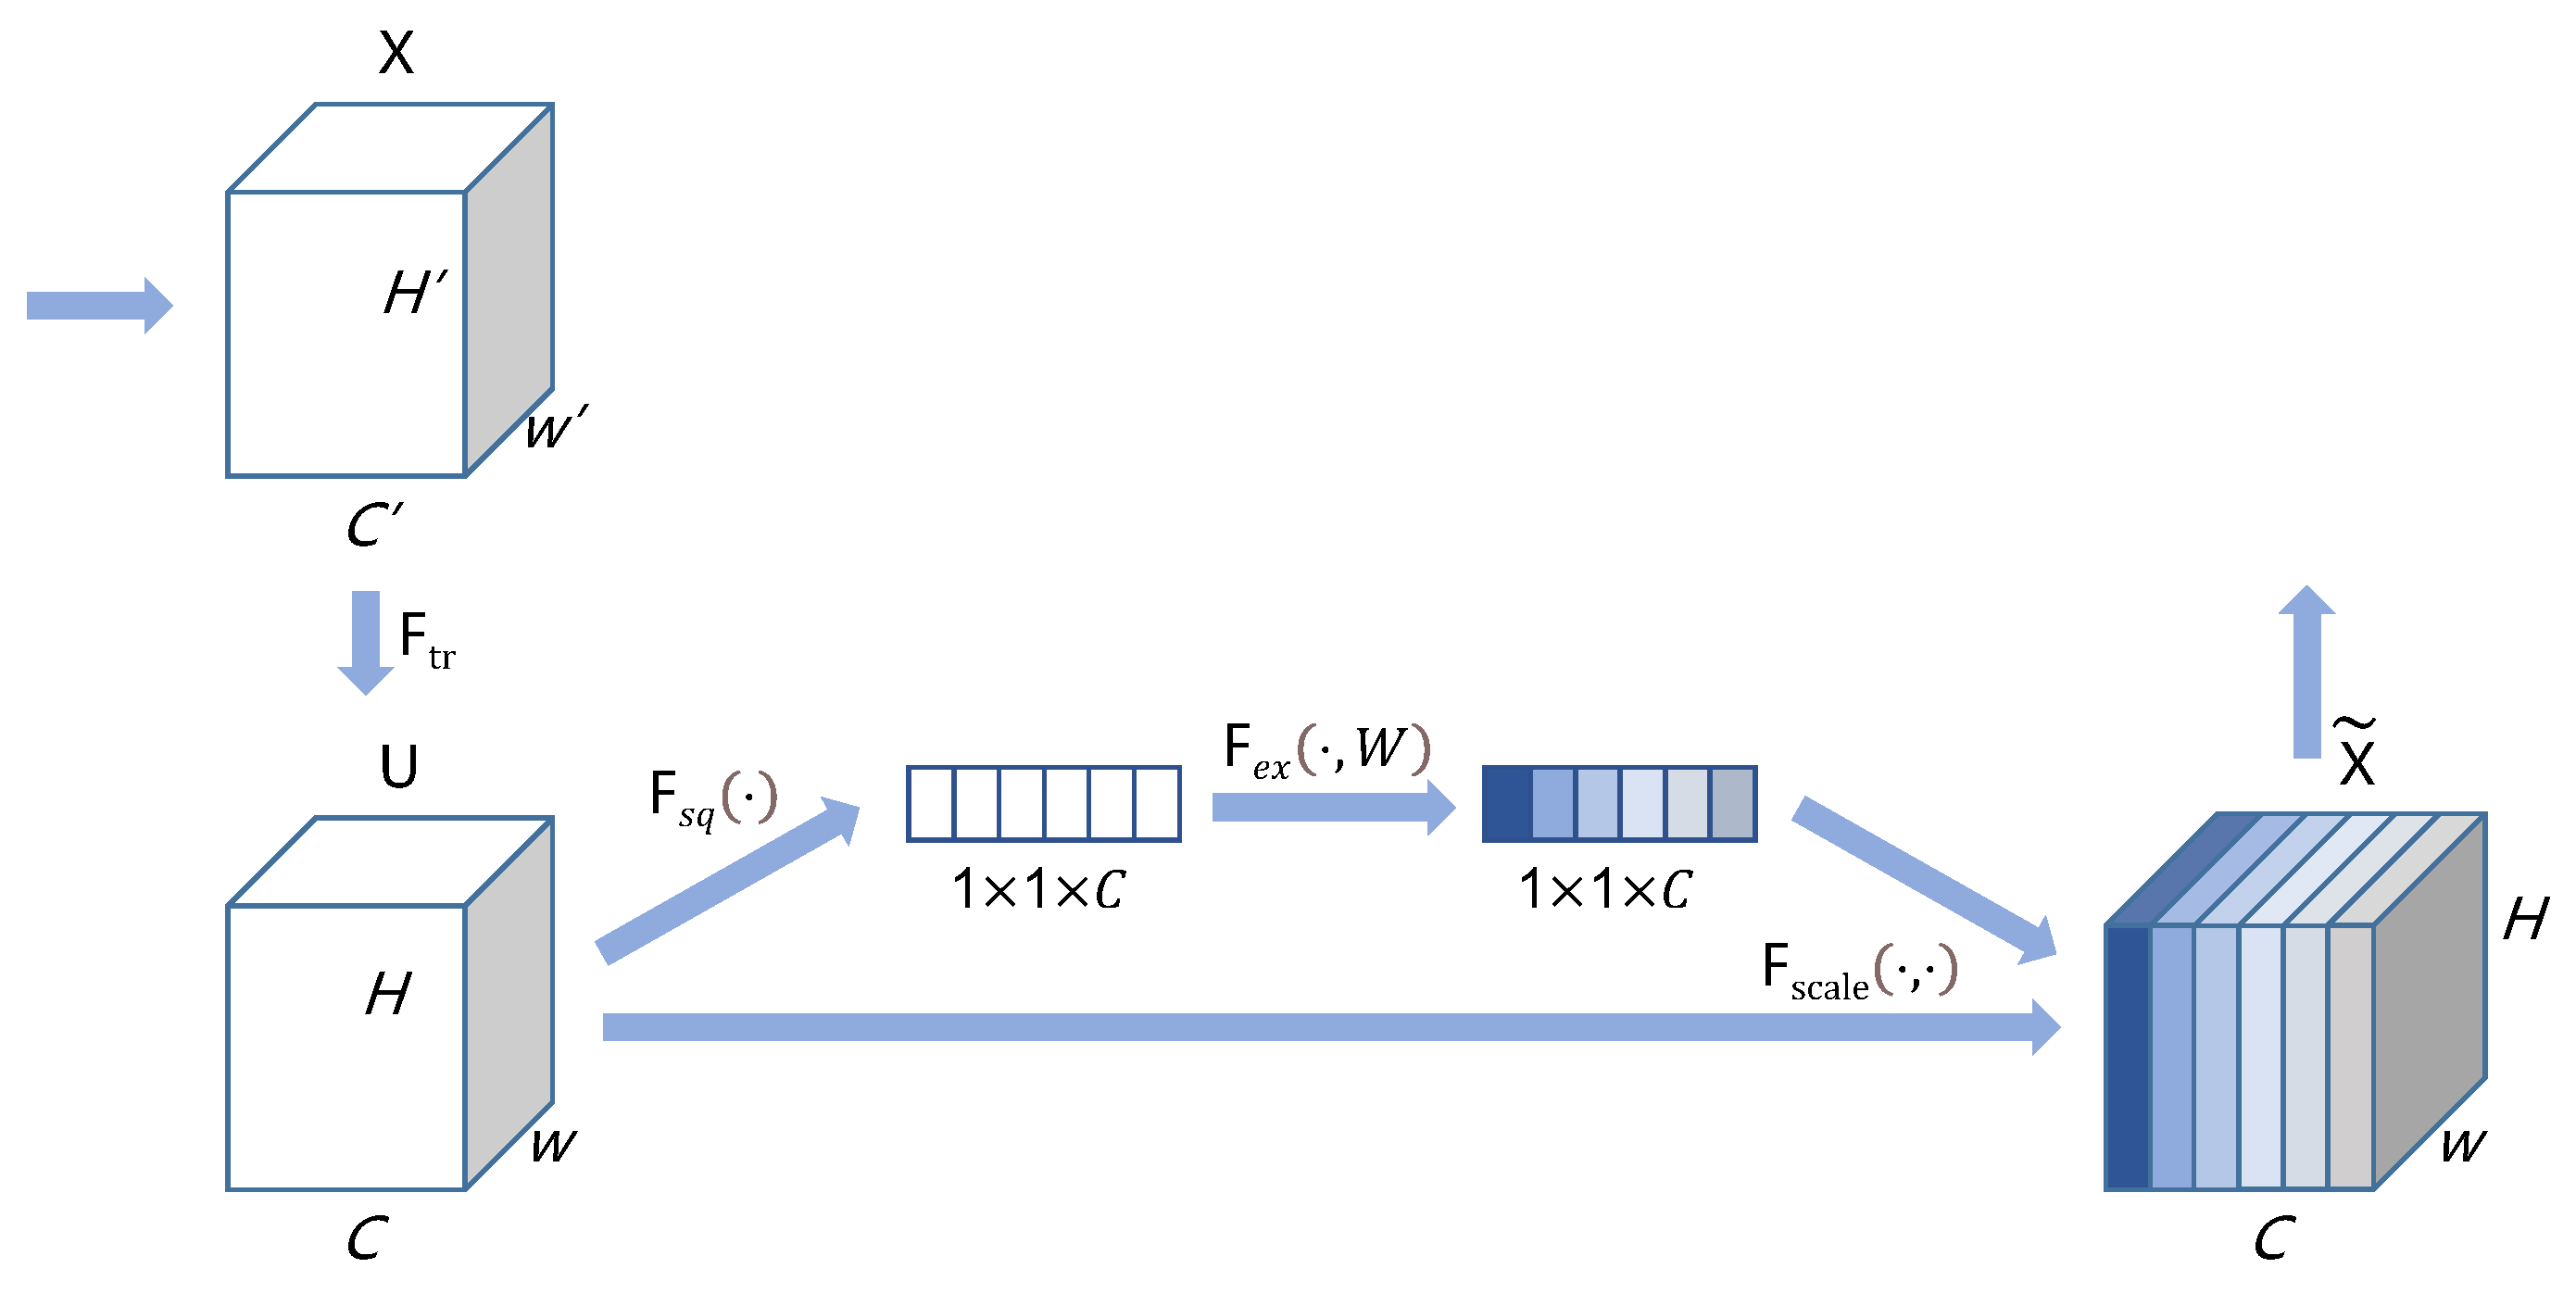
SENet is a network structure that focuses on enhancing data channel information and enhancing desired feature information while suppressing less useful feature information based on the self-attention mechanism. SE block is the basic module of SENet and can be well integrated with many existing models. The corresponding experimental classification and detection results show that the combination with an SE block can increase the feature representation capability of the model and, thus, improve the classification or detection effects of the model. The basic structure of the SE block is shown in
Figure 4. Among them,
is the traditional convolution operation.
X and
U represent the input and output of this convolution operation, respectively;
C,
W,
H,
C′,
W′, and
H′ represent the scales of data; function
and
represent the two core processes of the SE block, squeeze processing and excitation processing;
represents the final output of the SE block.
In the SE process, a squeeze operation is first performed on the convolution output. To make better use of the interconnected information between input data channels, the SE block first uses the idea of averaging to convert the information of all pixels involved in a plane into a specific value. The specific calculation procedure for averaging is shown in Equation (
1).
In Equation (
1),
represents the squeeze output of the
c channel data of input data;
represents the
c channel data of input data. It can be seen from the formula that input data eventually become a column vector in the squeeze process. The length of this vector is the same as the number of channels, and each data value in this vector is closely related to the corresponding channel data.
After that, to further exploit the interlinked information between channels, SE designs an excitation process. The equation for this process is shown in Equation (
2).
In Equation (
2),
is the rectified linear unit (ReLU) activation function;
;
;
is the dimensionality reduction layer with a dimensionality reduction ratio of
r.
is the proportionally identical data-dimensionality increase layer. After the excitation process, the complexity of the entire model is controlled. Moreover, vital features are enhanced, and weak features are limited based on the self-attention mechanism. Moreover, the generalization ability of the model is enhanced. The sigmoid function processes the final output of the excitation process to a value between zero and one.
The final output of the SE block multiplies the value obtained after compression and activation processing with the data of all the channels that U has. Based on such processing, the SE block can enhance features that have a greater impact on the experimental results while weakening features that have a smaller impact on experimental results.
3.1.3. FPN
FPN is a network component that assists CNN in detecting objects with different scales. From the comparison of the information contained in shallow and deep features, shallow features have richer location information and are more suitable for predicting the location coordinates of the object; deep features have richer category information and are more suitable for predicting the category of the object. Therefore, a suitable combination of shallow and deep features can achieve the accurate detection of EMs, which is the main idea of FPN. FPN consists of three main network structures: down–up processing, up–down processing, and horizontal linkage of feature layers, as shown in
Figure 5.
Down–up processing is the feedforward process of CNN. By non-stop convolutional operations, multiple feature maps of different scales are obtained in this step. After that, the feature maps output by the deepest level network are up-sampled by the operation to keep the same size as the feature maps output by the previous level network. Then, upsampled feature maps are fused with the feature maps outputted by the previous layer network. Feature maps obtained based on FPN are richer in feature information than traditional feature maps. In addition, to better fuse the information of each map, FPN processes the fusion between feature maps by using the horizontal linkage operation. The horizontal linkage is performed by convolutional processing using a -sized convolutional kernel. In general, FPN can combine the rich location information of shallow feature maps and the rich category information of deep feature maps to provide accurate categories and locations of objects at different scales without increasing computational efforts.
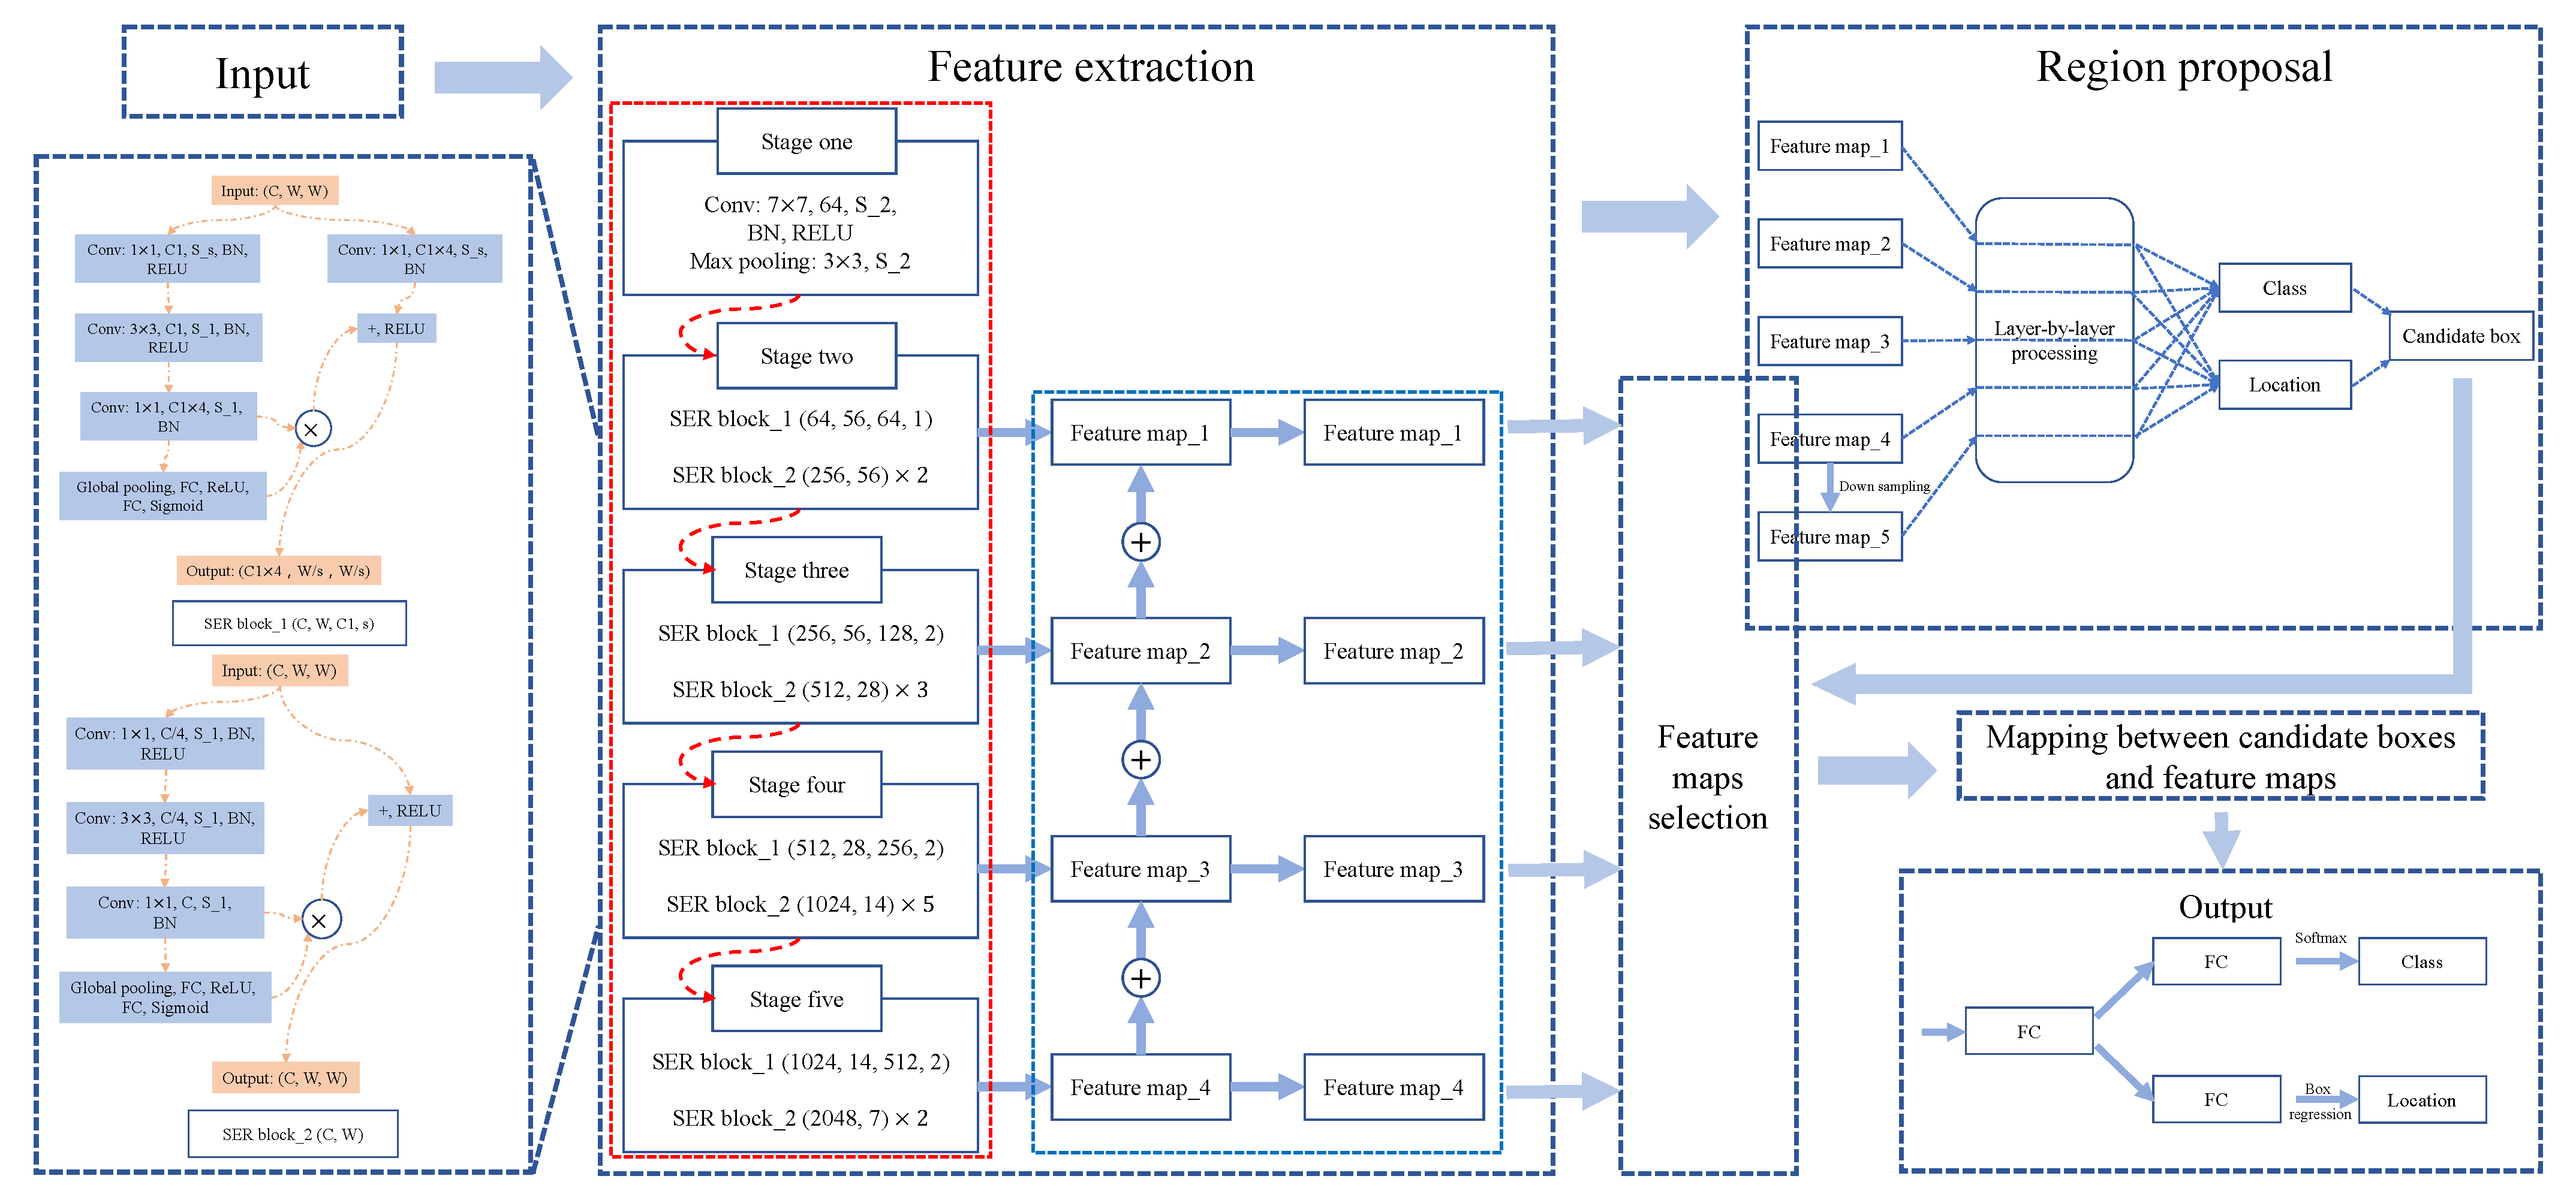
3.1.4. Backbone of Feature Extraction Step
By fusing ResNet, SENet, and FPN, we finally design the backbone of SEM-RCNN, as shown in
Figure 6. There are mainly five steps in the red dashed box in
Figure 6. In stage one, 64 convolution kernels with a kernel size of 7 × 7 and a stride of 2, followed by batch normalization (BN) and ReLU operations, were applied for feature extraction. Then, max-pooling with a size of 3 × 3 and stride of 2 was applied to reduce the size of feature maps. After that, the following four steps are based on the combination approach of SER block_1 and SER block_2. The SER block_1 and SER block_2 are important parts of the backbone, and its structure are shown in
Figure 7. From
Figure 7, we can see that the SER block_1 is mainly used to deal with the case where the input and output dimensions are different; the SER block_2 is mainly used to deal with the case where input and output dimensions are the same. For the input parameters of SER block_1, the channel of the input image is denoted as C, the width (same as height) of the input image is denoted as W, the output channel of the feature map is denoted as C1, and the stride is denoted as s. For example, in stage two of
Figure 6, input images are processed at the size of 54 × 54 with 64 channels. Hence, in the first step of SER block_1, 64 convolution kernels with the kernel size of 1 × 1 and stride of 1 (followed by BN and ReLU operations) were applied first. Then, the convolution kernels with the kernel size of 3 × 3 and 1 × 1 were applied sequentially to extract the feature and to adjust channels. At the same time, the input image is processed by 64 × 4 convolution kernels with the kernel size of 1 × 1 and stride of 1 (right part of SER block_1). Finally, the feature maps after global pooling and sigmoid (the left part of SER block_1) are residually connected with the right part of SER block_1. The output size of SER block_1 is 56 × 56 with channels of 64 × 4. The structure of SER block_2 is similar to SER block_1, but the output size is the same as the input size. The combination method of SER block_1 and SER block_2 repeats four times in SEM-RCNN for feature extraction.
Based on our sufficient research foundation [
15,
20,
21,
22,
24,
29], it can be found that only a few studies employed deep learning methods to perform the detection task in microorganism image analysis. Since the detection task in microorganism image analysis has strong application background, almost all studies directly utilize existing deep learning models, such as RCNN [
88] and Faster R-CNN [
84,
85]. Different from these studies, we proposed a novel self-attention-based two-stage detection framework, which is inspired by ResNet, SENet, and FPN. This framework achieves state-of-the-art performances on the detection task, which significantly promotes the development of the detection technology in the application of microorganism image analyses.
3.2. Region Proposal Step
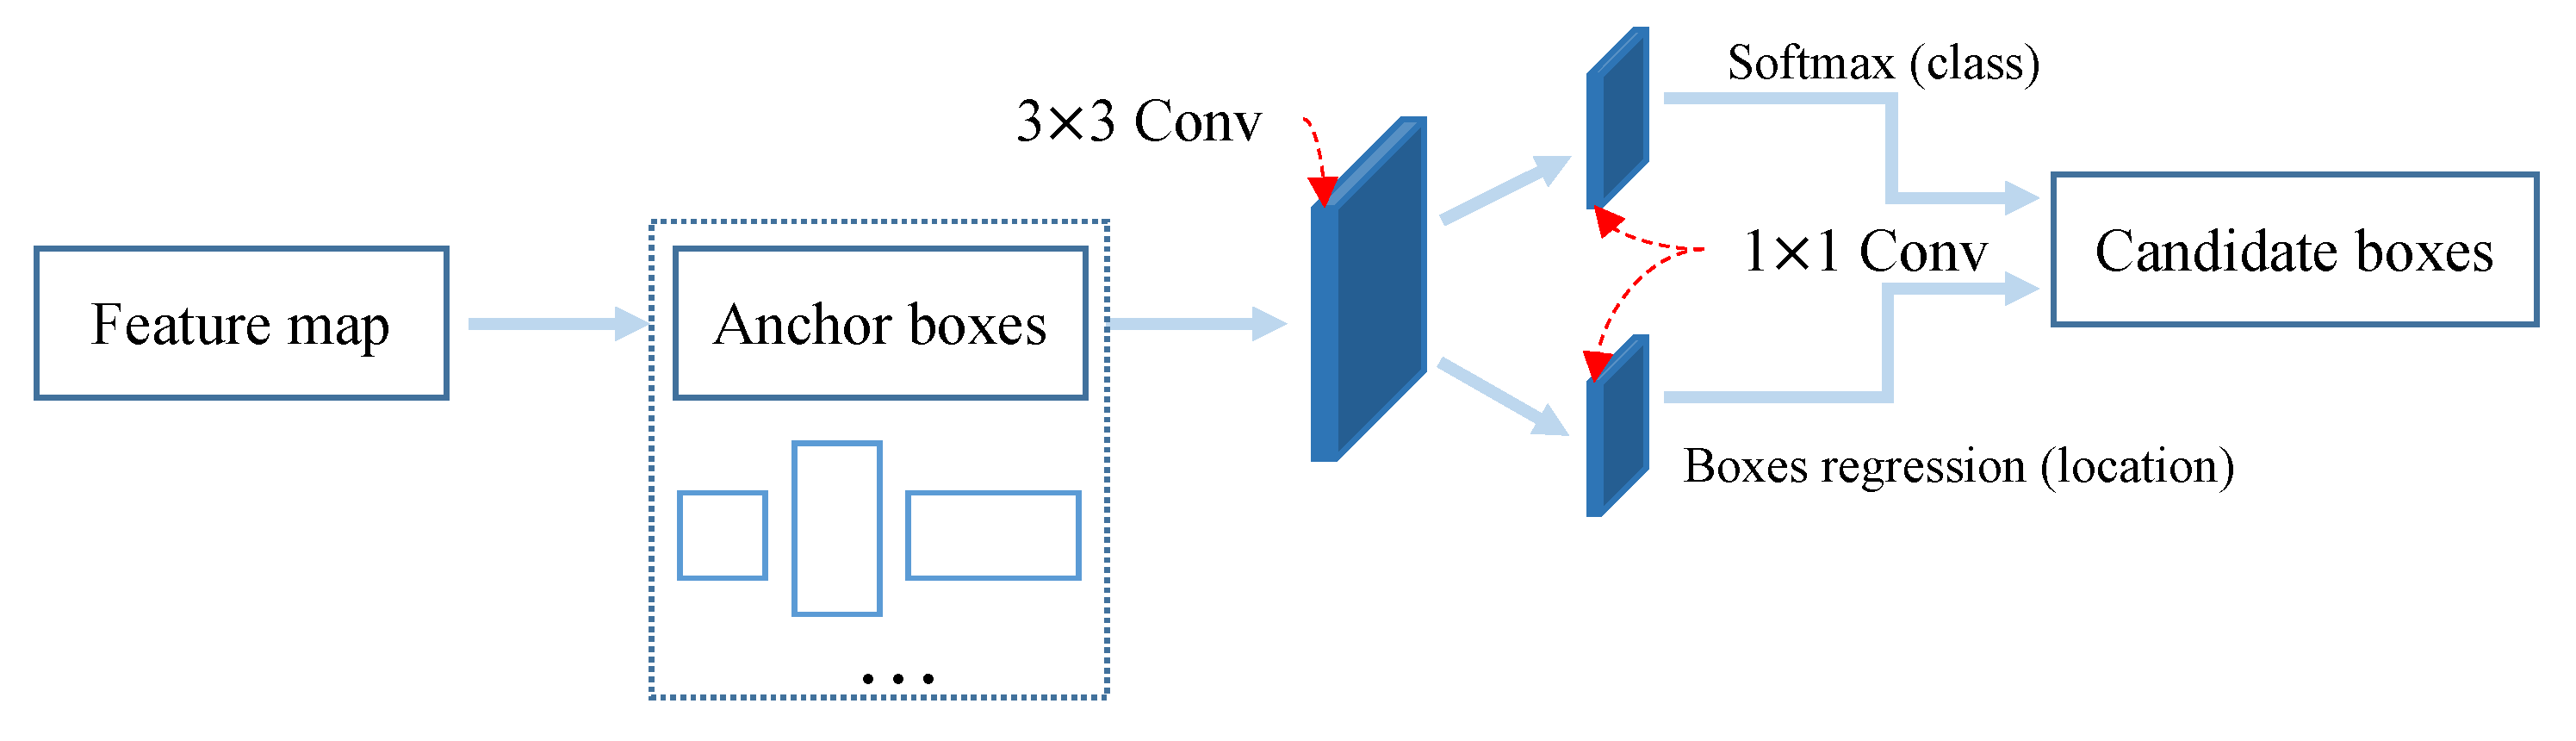
Generating candidate boxes for objects is an important processing step of an object detector. In this step, a suitable target candidate frame needs to be generated based on the input feature map. Here, we choose the region proposal network (RPN) to accomplish the task of candidate boxes proposal for SEM-RCNN. RPN can generate prediction boxes for objects with different scales in a short period. RPN mainly includes three processing steps: generating anchor boxes, judging the category of generated anchor boxes, and adjusting the position of anchor boxes. The main flow of RPN is shown in
Figure 8. First, RPN generates a certain amount of anchor boxes based on the input feature map; after that, the generated Anchor boxes are convolved with a convolution kernel of
; then, the Softmax function and the border regression algorithm are used to distinguish prospect and background of boxes and obtain position coordinates of the predicted boxes respectively; finally, the candidate boxes are determined based on the obtained category scores and position coordinates.
3.3. RoI Align
After obtaining suitable boxes, the detector needs to associate the obtained boxes with feature maps. Here, RoI Align is employed to this end. The main idea of RoI Align is to use bilinear interpolation to obtain the value of floating-point coordinates. Therefore, RoI Align chooses to keep the floating-point coordinates in determining the corresponding area in the feature map based on the position coordinates of the candidate box. When dividing the area corresponding to the candidate box on the feature map equally into multiple small fixed-size feature maps, RoI Align chooses to maintain the segmented boundaries instead of performing quantization operations. Eventually, bilinear interpolation allows the RoI Align to obtain the feature values corresponding to the four coordinate positions of each small feature map.
Bilinear interpolation is the calculation of the value of a pixel point (floating point) that does not exist in the location image from the value of a known pixel point. The bilinear interpolation method can be computed by performing two horizontal interpolation operations and then one vertical interpolation or by performing two vertical interpolation operations and then one horizontal interpolation. Here, the specific calculation process of the bilinear interpolation method with lateral interpolation followed by vertical interpolation is introduced. The specific coordinates of
,
,
,
,
,
and
P involved in the formula are shown in
Figure 9.
First is the first horizontal interpolation calculation, as shown in Equation (
3).
This is followed by a second horizontal interpolation calculation, as shown in Equation (
4).
The last step is calculation of the value of P point based on the two transverse interpolation results (
f(
) and
f(
)) obtained from above calculation, as shown in Equation (
5).
3.4. Output
The final goal of SEM-RCNN is to obtain the bounding box and class of object. Therefore, in the output part of SEM-RCNN, the feature map after RoI Align processing is first classified using a fully connected (FC) layer. Then, the output of the coordinate information of the object is realized by the FC layer and border regression; the output of the class information of the object is realized by the fully connected layer and Softmax function. Finally, the task of target detection is accomplished by combining border coordinate information and class information, as shown in
Figure 10.
5. Conclusions and Future Work
The analysis and research of EMs are essential. Therefore, a suitable method for EM detection needs to be explored. After summarizing and analyzing the work related to EM detection, we designed the SEM-RCNN for the detection of EMs. In terms of applications, to fully demonstrate the feasibility of SEM-RCNN for EM detection, model training and testing were conducted in a small dataset of EMs and a large dataset of blood cells, respectively. The final detection results demonstrate the feasibility of SEM-RCNN for detecting EMs. In terms of technology, an improved method combining Mask RCNN with SENet is proposed in this paper. To verify the feasibility of the improved method, the detection results of SEM-RCNN and the original Mask RCNN are compared on the EMDS-6 dataset and blood cell dataset, respectively. The comparison results showed that the detection results of SEM-RCNN improved two to three points in mAP than that of the original Mask RCNN. Finally, SEM-RCNN achieved a 0.511 mAP on EMDS-6 and 0.907 mAP on the blood cell dataset.
This paper fills the gap in computer-aided multi-class EM detection research. However, considering the continuous innovation of related technologies and the challenges that need to be faced in practical applications, there is still more research potential and room for improvement in several aspects of this study. Regarding current research results, further research content with respect to our work will mainly be considered from EMs data. From the detection results on dataset EMDS-6 and blood cell dataset, it can be seen that sufficient training data can significantly improve the detection effect of the model. In contrast, insufficient training data can lead to poor detection effects from the model. Therefore, in the follow-up study, we will focus part of our efforts on expanding the existing microbial dataset to build an EMs dataset with more sufficient data and to better meet the training of detection models.


 ,
, 


