Article

Mitigating Sensor and Acquisition Method-Dependence of Fingerprint Presentation Attack Detection Systems by Exploiting Data from Multiple Devices

Department of Electrical and Electronic Engineering, University of Cagliari, 09123 Cagliari, Italy
*
Author to whom correspondence should be addressed.
Appl. Sci. 2022, 12(19), 9941; https://doi.org/10.3390/app12199941
Submission received: 30 August 2022 / Revised: 23 September 2022 / Accepted: 26 September 2022 / Published: 2 October 2022
(This article belongs to the Special Issue Application of Artificial Intelligence in Visual Signal Processing)

Abstract

:
The problem of interoperability is still open in fingerprint presentation attack detection (PAD) systems. This involves costs for designers and manufacturers who intend to change sensors of personal recognition systems or design multi-sensor systems, because they need to obtain sensor-specific spoofs and retrain the system. The solutions proposed in the state of the art to mitigate the problem still require data from the target sensor and are therefore not exempt from the problem of obtaining new data. In this paper, we provide insights for the design of PAD systems thanks to an overview of an interoperability analysis on modern systems: hand-crafted, deep-learning-based, and hybrid. We investigated realistic use cases to determine the pros and cons of training with data from multiple sensors compared to training with single sensor data, and drafted the main guidelines to follow for deciding the most convenient PAD design technique depending on the intended use of the fingerprint identification/authentication system.

1. Introduction

Biometric technologies are gaining popularity owing to their reliability and ease. Faces, fingerprints, and other biometric traits can identify individuals with a high degree of accuracy. Among these, the fingerprint is the most widespread due to its uniqueness and ease of use. However, artificial fingerprint replicas, also called spoofs or presentation attacks (PAs), can circumvent fingerprint-based personal recognition. Both consensual and nonconsensual procedures may be used to replicate a fingerprint. Consensual techniques need the awareness and cooperation of the intended person, whereas nonconsensual approaches are more dangerous and covert and are based on the acquisition of latent fingerprints left unknowingly on reflective or partially reflective surfaces. Given that automated fingerprint identification systems (AFIS) frequently secure sensitive and critical data, it is crucial to equip them with presentation attack detectors (PADs) that help determinine whether the fingerprint acquired by the sensor is genuine (live) or a replica (fake). Although PADs are nowadays very accurate, their development and use still present open problems.
One of these is the so-called lack of interoperability. A PAD trained on data from one sensor works precisely on images of that sensor. However, it can lead to much lower results when used on images of different sensors. This is a frequent problem when a manufacturer or user needs to replace the sensor of an authentication system with a more current and high-performing device. In this case, in fact, it is not possible to use the previous PAD; the system must be retrained, fine-tuned, or updated on new images. Obtaining these new images may not be easy, as it requires multiple acquisitions of real users and fake fingerprints made with different materials and techniques. Although some recently proposed works aim to mitigate the problem of interoperability [1], they require a subset of the target sensor samples. This makes interoperability an open and critical issue for AFIS systems, especially when obtaining target samples at the design stage is difficult or even infeasible.
Another open problem is the lack of ability of modern PADs to recognize PAs obtained with acquisition techniques and/or materials not used during the training phase. Even in this case, to make the PAD robust and able to recognize the greatest number of types of PAs, a designer must predict, obtain, and use them in the training phase. Obtaining PAs made with all known state-of-the-art techniques and materials can be very expensive.
As the organizers of the Fingerprint Liveness Detection Competition (LivDet) (https://livdet.diee.unica.it/, accessed on 19 September 2022) we were able to observe some different PAD training techniques among researchers. In fact, most of the LivDet competitors trained their PADs on single-sensor data. This training procedure is recommended and rewarded for the purposes of the competition because it allows a precise reading of the results and associates cause and effect in the proposed challenges. However, other competitors used all the data of the training sets from different acquisition sensors simultaneously, and others on additional data compared to the training sets provided. These procedures proved successful in the latest edition of the competition, LivDet 2021, obtaining the best results in terms of presentation attack detection, even on the “advanced“ never-seen-before attacks perpetrated by a new semi-consensual acquisition technique called ScreenSpoof [2]. Moreover, these large-trained algorithms have been shown to be particularly robust across the sensors of the competition. Based on this evidence, we wondered to which extent training on data acquired with multiple sensors helps detect artificial replicas. Is this procedure truly beneficial in solving the interoperability and/or generalization problem?
To properly answer, we designed different PADs from scratch and investigated how the performances change by varying the composition of the training set, exploring different interoperability scenarios using LivDet 2013, 2019, and 2021 data sets. As a matter of fact, although the problems of interoperability and generalization are well known at the state of the art [3], this work aims to systematically analyze the various real application contexts in which a PAD can be used. In particular, we represented and examined different combinations between training and use contexts (intra-method and intra-sensor, cross-method, cross-sensor, etc.) and then evaluated which ones can preferably be addressed with a single-sensor training approach, i.e., with a PAD trained on data acquired from a single sensor or with a multi-sensor training approach, that is, a PAD trained on data acquired from different sensors. These experiments allowed us to outline the limits and potentials of single-sensor and multi-sensor training solutions when tested on entirely or partially unknown data.

2. Fingerprint Presentation Attack Detection and Interoperability

2.1. FPAD

The threat of fingerprint spoofs has been known since 1998, the year of publication of the first paper that demonstrated the vulnerability of fingerprint sensors to artificial replicas [4]. A few years later, the first hardware and software countermeasures were proposed [5,6]. The PAD software systems focus on anatomical, physiological, and textural properties and other features that can be extracted and used for matching purposes. As in all fields of pattern recognition, the feature extraction and image classification phases for the detection of presentation attacks have passed from hand-crafted approaches and shallow classifiers to the deep-learning era. Among the hand-crafted extraction methods are local descriptors such as SIFS, BSIF, LBP, and LPQ [7,8]. These approaches use a binary code to characterize each pixel’s neighborhood, which is derived by computing the image’s convolution with a collection of linear filters and then binarizing the filter responses. The resulting feature vectors are often inputs to shallow classifiers such as SVM [9], but can be input to complex neural networks. Other deep learning techniques are often based on convolutional neural networks (CNN) [10]. They provide extremely high accuracy, but require many training data and a significant amount of time and resources. In recent years, the two types of techniques, hand crafted and deep learning-based, have been increasingly combined to overcome limitations such as the difficulty of modern PADs to generalize and the need for extensive computational resources. One example is Fingerprint Spoof Buster [11], which uses locally centered and aligned patches using fingerprint minutiae to train a MobileNet-v1 model.

2.2. The Interoperability and Generalization Problem

The interoperability challenge is fundamentally connected to the hardware and software variations between fingerprint acquisition sensors. Optical, solid-state, and ultrasonic sensors are the three most common types of acquisition hardware. Each type of sensor produces a particular distortion in the image linked to a different physical phenomenon, which encodes the valleys and ridges. In addition to the kind of acquisition, scanners can be grouped by image characteristics such as DPI (dot per inch), scan area, geometric precision, etc. The interoperability problem across sensors was recognized in the first instance from the point of view of fingerprint verification. Numerous works over the years have proposed effective solutions to mitigate the drop in accuracy due to the scanner change [12,13]. Recently, this problem has also been addressed in the field of presentation attack detection, proving to be particularly critical. As a matter of fact, many modern solutions still suffer poor generalization performance when tested on data not seen during the training phase, leading to spoof detection error rates up to three times higher [14]. One potential reason for this complexity in generalizing across sensors is that fingerprint images from different sensors possess different textural characteristics (Figure 1). This complexity is exacerbated by the employment of different acquisition procedures and materials between the training and system use phases, which provides an additional degree of freedom to the fingerprint’s appearance.
In recent years, numerous works have aimed at overcoming these limits. For instance, authors in [1,10,15] mitigated such differences by designing a style-transfer wrapper to add on top of any CNN architecture in order to reduce the performance gap due to cross-sensor evaluations. Their idea is to use a limited number of live fingerprints of the “new” sensor, hereinafter called the target sensor, in order to project its style into live and spoof samples coming from the “old” sensor. This new synthetically generated dataset is then employed to train a liveness detector from scratch, improving the average cross-sensor spoof detection performance by approximately 13%.
Another plausible justification for the problem of interoperability is that the different ways of representing the ridges and valleys of a fingerprint affects the frequencies of the grey-level histogram of the images. Figure 2 supports this idea, where we can observe the mean grayscale histogram for the five sensors investigated in this paper. Starting from this peculiarity, Tuveri et al. [16] reached a significant level of interoperability by shifting sensor-specific feature distributions based on the least squares algorithm. The feature vectors were calculated by using textural algorithms. This solution is optimal since it does not require any additional PAD training. Nevertheless, both live and spoof samples are needed to relocate the feature space of the target sensor into that of the original sensor.
All these works generally acknowledge the need for a subset of the target sensor’s samples to solve the interoperability problem. This inevitably leads to issues from an economic point of view. In fact, effort and money are necessary to collect a spoof dataset; it is essential to find volunteers willing to donate their fingerprints, fabricate fakes of each finger with a substantial number of materials, and finally acquire them via the scanner. Furthermore, based on the employed materials, costs can grow considerably.
The procedure shown in [15] is not affected by these obstacles. On the other hand, it substitutes the original FPAD with a new one tailored to the target sensor. In many applications, this procedure is not feasible. Moreover, this implies that it would be challenging for companies to scale up FPAD tools since each scanner would require its custom detector.
Therefore, with no access to the target sensor data, is it possible to mitigate the sensor dependence on an FPAD system? The goal of this work is to answer this question.

3. Interoperability Scenarios for the Design of Fingerprint PAD

In this paper, we investigated to what extent the interoperability problem afflicts modern PAD systems and whether some solutions such as training on multiple types of data are beneficial or counterproductive. In particular, we want to evaluate whether training on data from different sensors helps the system to generalize or if it allows to it recognize more types of data, but lowers the general performance. For this purpose, we identified the following project scenarios based on the concept of interoperability applied to fingerprint sensors and the PAI fabrication methods:
  • Intra-sensor and intra-method: this is the standard and optimal application scenario. The PAD is used to analyze and classify images acquired with the same sensor used in the training phase. The type of PAI used to attack the system is known by the system;
  • Intra-sensor and cross-method: this is a standard, but unfavorable application scenario. The PAD is used to analyze and classify images acquired with the same sensor used in the training phase. The type of PAI used to attack the system are unknown to the system. Such a scenario is unpredictable by the designer as new replication methods can be discovered and used after the PAD has been designed and trained;
  • Cross-sensor and intra-method: the designer/manufacturer decides, knowing the risks, to use a PAD trained on a sensor on a AFIS consisting of a different acquisition sensor. This choice is not optimal, but is made for economic reasons or in the absence of data to retrain/fine-tune a new PAD. The type of PAI used to attack the system is known by the system, but since the acquisition sensor is different, the resulting images could be very different;
  • Cross-sensor and cross-method: as in the previous scenario, the designer uses a PAD trained on a sensor on an AFIS consisting of a different acquisition sensor. Moreover, the type of PAI used to attack the system is unknown to the system.
The first two scenarios exemplify the standard functioning of a PAD and allow us to evaluate the system’s robustness to never-seen-before attacks.
On the other hand, cross-sensor scenarios assess the ability of PADs to generalize concerning the scanner change. These are typically non-optimal cases, useful to assess a situation in which a designer cannot easily collect the data with the new sensor or cannot replace the PAD.

Experimental Protocol

To replicate the application scenarios identified in the previous section, we carried out the following experiments:
  • Intra-sensor and intra-method: the training set is partially or totally composed of data belonging to the target sensor. The PAIs are created with the same method in the two sets;
  • Intra-sensor and cross-method: the training set is partially or totally composed of data belonging to the target sensor. The spoofs of the training set were created with a different method than the test set ones;
  • Cross-sensor and intra-method: the training set does not contain data on the target sensor. The PAIs are created with the same method in the two sets;
  • Cross-sensor and cross-method: the training set does not contain information on the target sensor. The spoofs of the training set were created with a different method than the test set ones.
For each application scenario, we divided the experimentation into two protocols based on the designer’s choice to use a pre-trained model or to train a model from scratch:
  • Pre-trained: some competitors from the eighth edition of the Fingerprint Liveness Detection Competition have been selected (Table 1). Certain of them used additional data for training, although the use of only the LivDet 2021 training dataset was recommended. This experiment is strongly representative of the current state of the art, but it is not completely controlled, since the implementation details are unknown;
  • Self-trained: the experiments are fully controlled and the details and training data are known. In particular, (i) two hand-crafted PADs have been implemented consisting of a feature extractor via BSIF and LBP, respectively, followed by a linear SVM classifier and (ii) one deep-learning based PAD. The Spoof Buster method is implemented.
LBP and BSIF allow for obtaining a statistically meaningful representation of the fingerprint data by respectively applying hand-crafted and a fixed set of filters on sub-portions of the image. The feature extraction step is followed by a shallow classifier, a linear SVM. On the other hand, the Spoof Buster method is based on a CNN trained on local patches centered and aligned using minutiae location and orientation.
The performances of the FPADs were evaluated using the ISO metrics [17], in particular, (i) APCER (attack presentation classification error rate), that is, the rate of misclassified fake fingerprints; (ii) BPCER (bona-fide presentation classification error rate), that is, the rate of misclassified live fingerprints; and (iii) liveness accuracy, the percentages of samples correctly classified by the PAD.

4. Results

4.1. Dataset

In general, the cross-sensor analysis can be viewed as two separate cases: (i) all sensors in the evaluation utilize the same sensing technology, and (ii) the sensing mechanisms differ. We explored both cases and, in this respect, we utilized datasets from LivDet 2013, 2019, and 2021 competitions [18] in our experimental analysis. They consist of live and spoof fingerprint images from five different devices, which differ in scan area and sensing technology (Table 2). The spoof images were collected using cooperative and non-cooperative methods based on the LivDet edition.
Furthermore, the materials used to fabricate the PAIs vary across the training and the test sets, as reported in Table 3 and Table 4. Due to this lack of knowledge of the spoofing nature, we can simulate a true attack scenario, following the typical fingerprint PAD evaluation protocols.

4.2. Pre-Trained Analysis

To evaluate how much the problem of interoperability affects modern PADs, we studied the behavior of a selection of competitors in the latest edition of the LivDet competition. The LivDet 2021 competitors’ detectors are typically composed of two models, each trained on a different type of data: a set acquired with the GreenBit sensor and one with the Dermalog sensor, the characteristics of which are reported in Section 4.1. Nevertheless, some competitors claimed to have obtained a single model by training on both sets simultaneously; others added additional data to the training data. These cases will be marked with a single (*) or double (**) asterisk, respectively. The results reported in the Table 5 and Table 6 refer to the GreenBit and Dermalog test sets, respectively. Although half of the PADs show a drop in the cross-sensor performance, the other half maintains the same accuracy. We hypothesized that PADs with the same or similar intra-sensor and cross-sensor accuracy were related to models trained on both sensors or additional data. This hypothesis is confirmed by the competitors, who have declared this training approach (marked with the asterisk). The PADs that have this behavior, that is, LivDet_Col_C2, LivDet_DOB_c2, megvii, and PADUnk, are also the best detectors of the eighth edition of the competition on the cross-method data, that is, the spoofs acquired with the semi-consensual ScreenSpoof (SS) technique. We therefore wondered if the training technique on multiple types of data could mitigate the problem of interoperability or make the PADs more robust to attacks “never seen before”, such as fakes made on new materials or with new acquisition techniques. However, these systems, except for megvii, are also the ones that, in the intra-dataset scenario, have a higher APCER and perform worse.
To control the experiment more and to select data that were unknown during the training phase, we submitted images to the LivDet 2021 PADs acquired with two very different sensors compared to those used during the eighth edition of the competition, LivDet Orchantus 2019 and LivDet Biometrika 2013. The results of this analysis are shown in Table 7. In this case, some data are unavailable, so we have to restrict the analysis to six PADs. Apart from a few exceptions with megvii, all PADs show a significant drop in performance and are completely ineffective on the new data. This is evident, above all, from the results on Orchantus 2019, whose non-optical acquisition technology obtains very different images compared to the sensors of the training set. It is worth underlining that, based on the type of image, the error can be shifted entirely to fakes, as in the case of Biometrika 2013, or entirely to live, as in the case of Orcanthus 2019. From these results, we can hypothesize that training on different types of data improves the performance on unknown attacks such as ScreenSpoof at the expense of a greater intra-sensor APCER. This is evident, for example, from LivDet_Dob_C2 in Table 5, which, in the intra-method test (i.e., trained on the GreenBit train and tested on the consensual GreenBit test (GB CC), is among the least accurate PADs with 85.88% accuracy, while in the cross-method test (i.e., trained on the GreenBit train and tested on the GreenBit ScreenSpoof (GB SS) test), it is the highest performing, exceeding 97% accuracy.
However, the lack of controllability of the training phase is a limitation of this analysis. For this reason, in the next section, we analyzed the behavior of completely self-trained PADs where both the implementation and the training data were known.

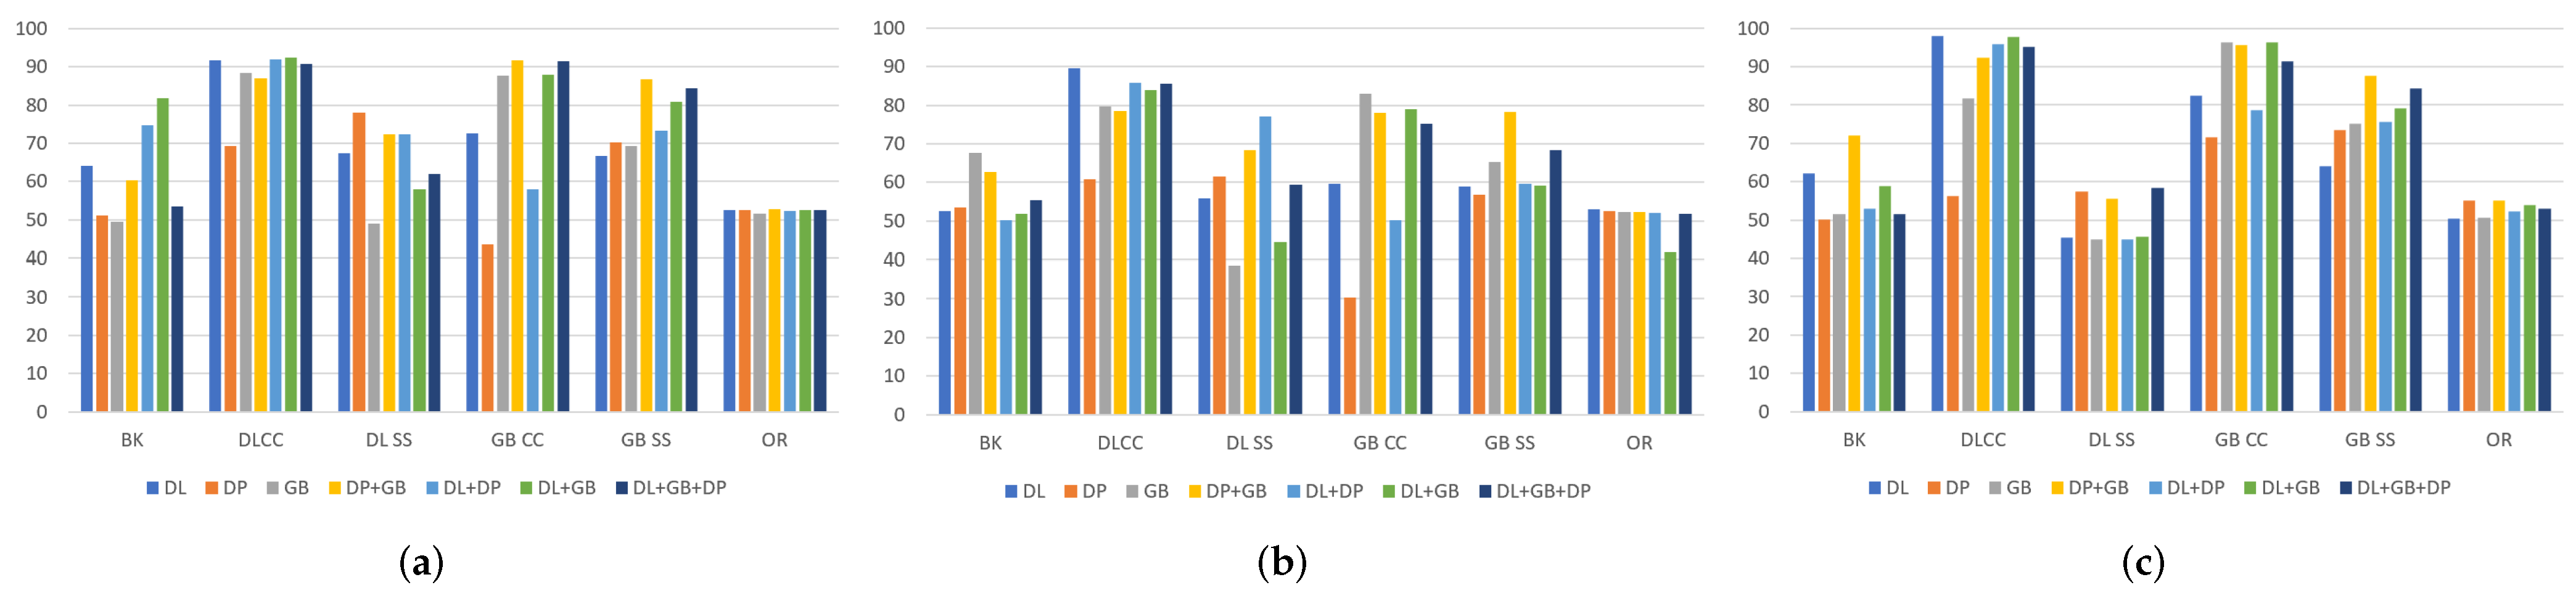
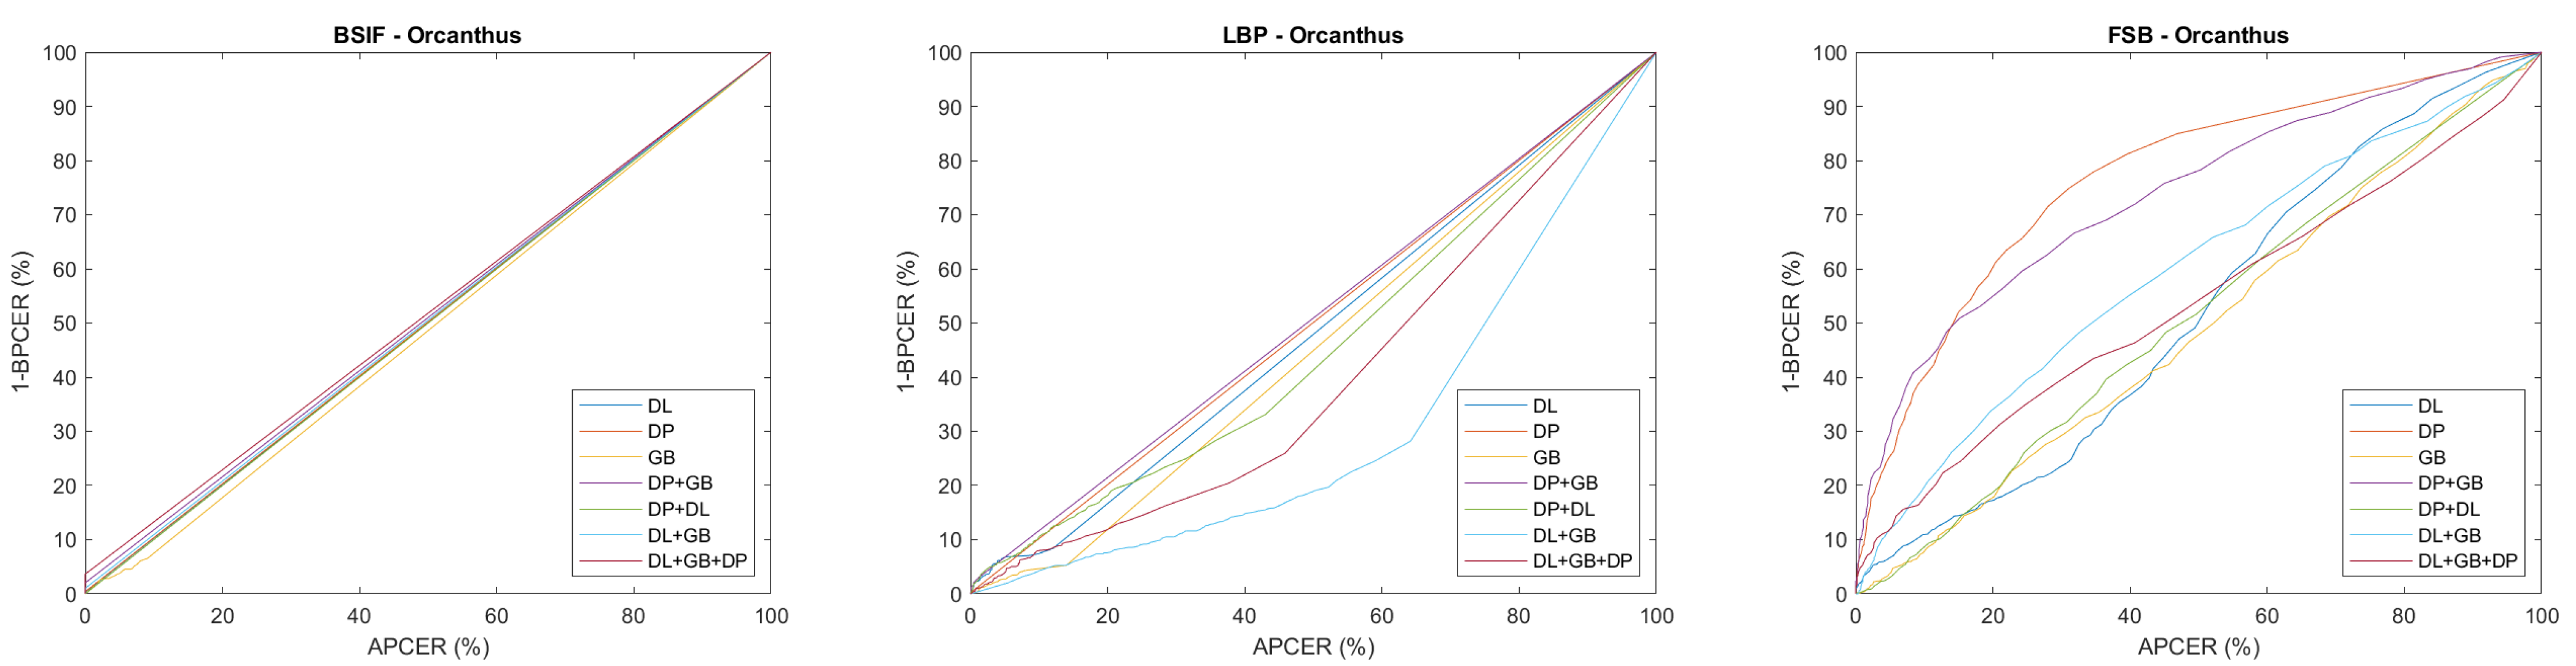
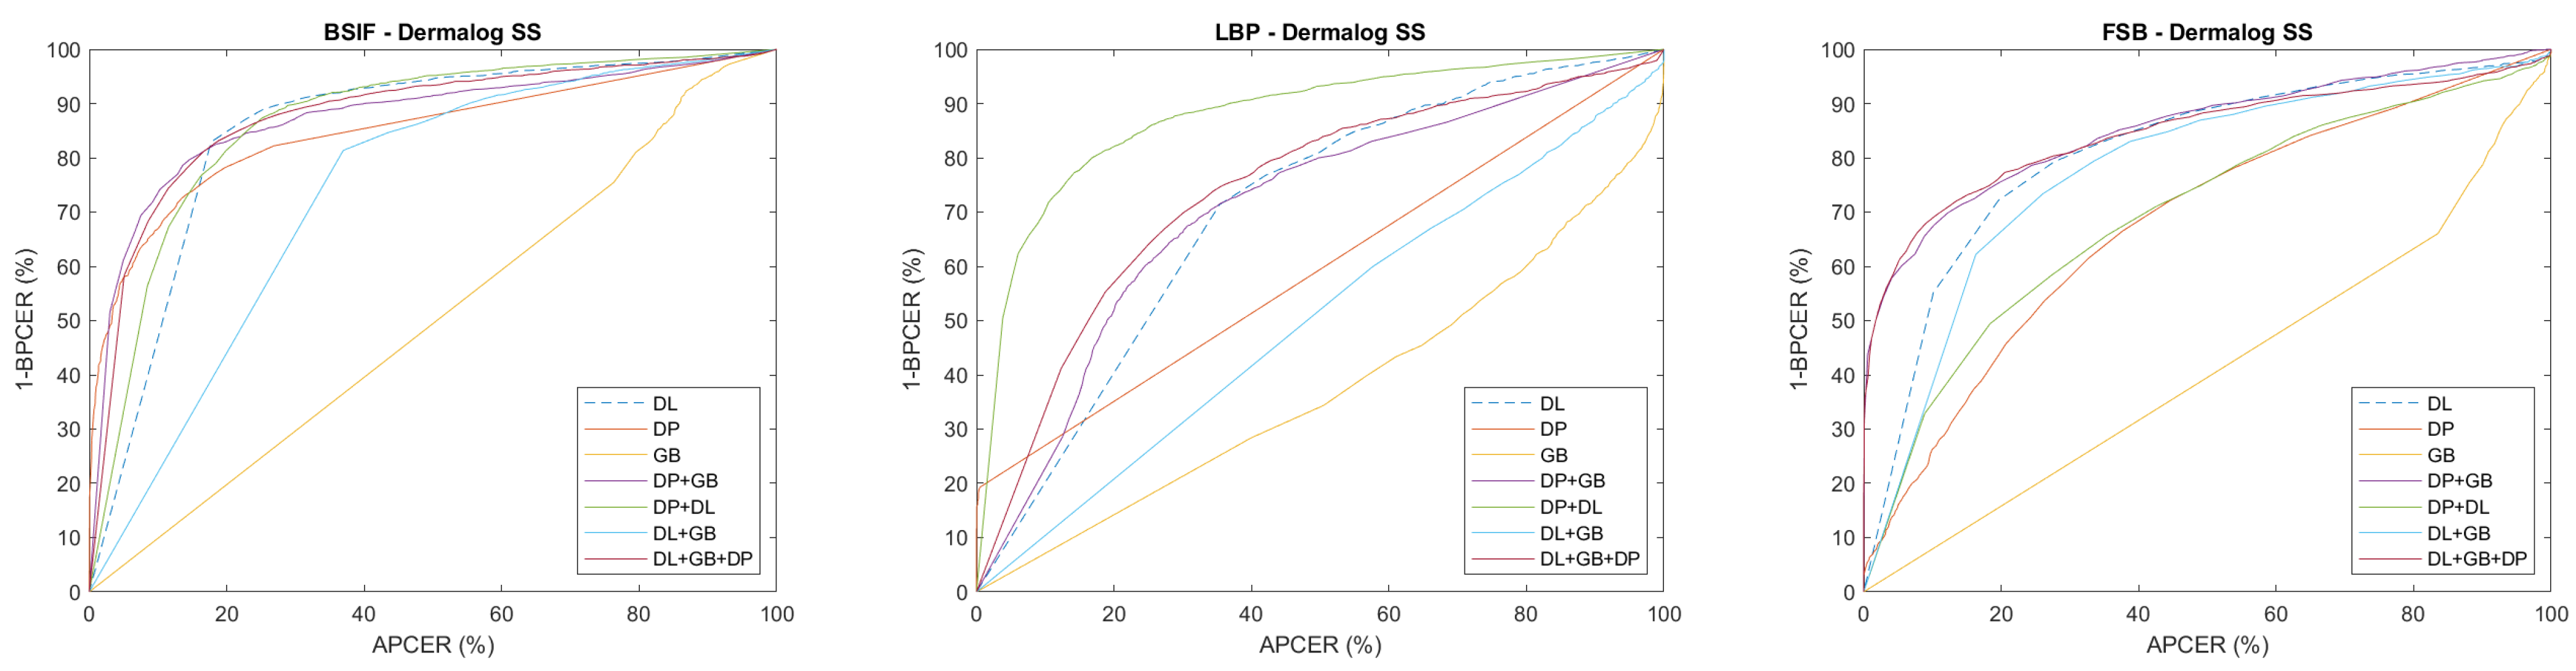
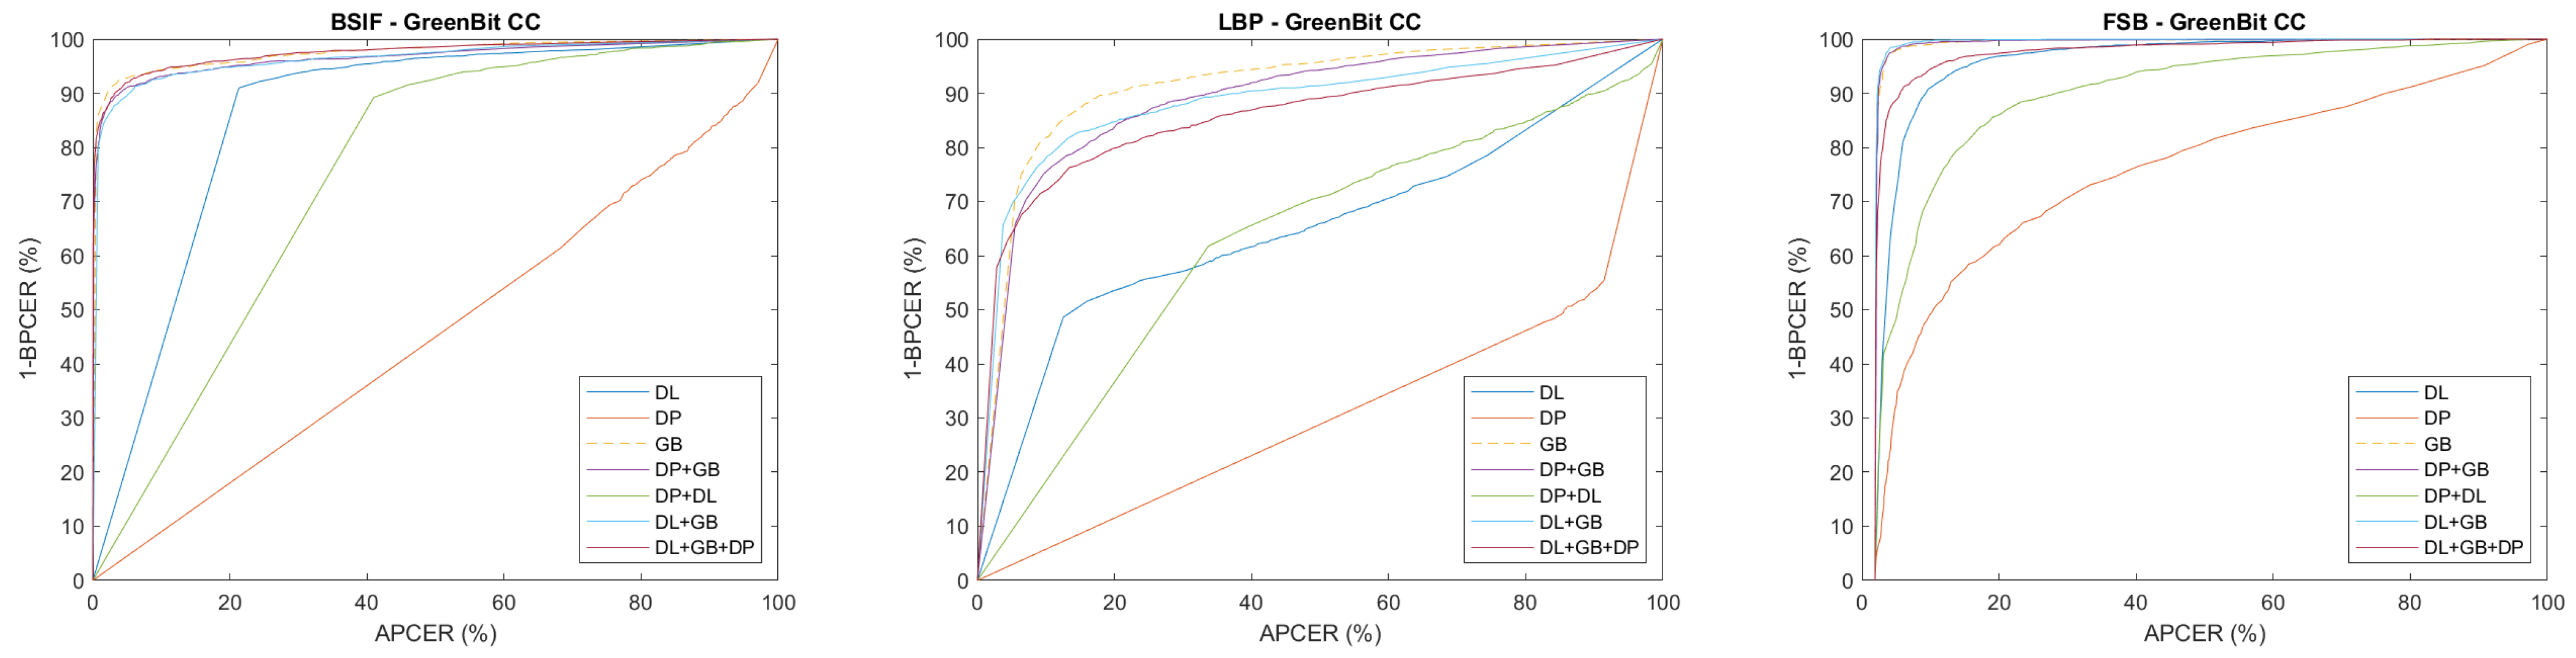
4.3. Self-Trained Analysis

Starting from the findings reported in the previous section, we decided to carry out new experiments in which we carefully selected the training and test sets to evaluate different interoperable scenarios. We chose the same training sets of LivDet 2021 to compare the results directly and added the LivDet 2019 DigitalPersona dataset, keeping the same sensing technology of GreenBit and Dermalog scanners. We then merged these three datasets in different proportions while maintaining a regular training set size. Accordingly, we used half or one-third of the datasets when we combined two or three of them, respectively. This approach helps evaluate the impact of heterogeneous data on classification.
Thus, we designed three different PADs: two hand-crafted, based on a linear SVM classifier trained with two of the most adopted textural algorithms at the state of the art, namely BSIF and LBP [7,8]; and one based on the SpoofBuster algorithm [11]. We did not carry out any parameter optimization since our purpose was not to design the optimal PAD, but to enhance the improvement achievable when introducing samples coming from multiple scanners.
As a first analysis, we investigated the PADs’ accuracies at a decision threshold of 0.5 score (range [0,1]) (Table 8 and Table 9). Figure 3 illustrates the accuracy analysis visually to make it easy to read. From these results, it can be seen that, except for some tests related to LBP, the use of training on different types of data benefits the performance of the PADs. Again, this benefit is nil in the case of the Orcanthus 2019 test, in which all our self-trained PADs fail to classify the images. This is because this dataset is the only cross-sensing one. In fact, its PAs were acquired with thermal swipe technology, while all the training sets are related to optical technology, albeit with different sensors.
The next step has been to extend the investigation to all the liveness thresholds. The resulting analysis suggests that the advantages of employing multiple sensors depend on the final operating context. For a more precise reading, we have reported the errors related to some specific operational points in Table 10 and Table 11, in particular, the BPCER value when the APCER is less than 5%, the APCER value when the BPCER is less than 5%, and the EER. This allows the simulation of application contexts in which first- and second-type errors weigh differently. The results indicate that, in an interoperable situation where avoiding presentation attacks is a primary concern, utilizing diverse data sources is ineffective since it increases the BPCER. In fact, in the intra-sensor and intra-method experiments, i.e., training and testing on data obtained from the same sensor and acquisition method, the use of additional data increases the error. Conversely, if the system is to be used in critical applications and the priority is to avoid rejecting genuine users, adding various sensors in the training set improves the spoof detection. This is especially evident when PADs are assaulted with never-seen-before attacks in the cross-method scenario, but it is also true in the intra-sensor and intra-method scenarios. For example, note the behavior of the PAD SpoofBuster when tested on consensual GreenBit data (GB CC); training on GreenBit data alone leads to an APCER at 5% and a BPCER equal to 9.88%; adding Dermalog data during the training phase drops the error to 6.41%. About the same improvement is obtained by adding DigitalPersona data.
ROC curves shown in Figure 4, Figure 5, Figure 6, Figure 7, Figure 8 and Figure 9 give us more insights about these scenarios. They highlight that for the BSIF detector, training on GreenBit, Dermalog, and DigitalPersona is optimal at various operational points; for the SpoofBuster detector, the most effective combination is given by training on GreenBit and DigitalPersona.
It is also easy to see how the training can sometimes be ineffective; for instance, a BSIF-based PAD cannot distinguish the images coming from the Orcanthus sensor (Figure 5), and the LBP-based detector even reciprocates the classes, namely, it predicts a negative class as a positive class and vice versa, since the ROC is u-shaped. This case is frequent when DigitalPersona is used as the only dataset for training in combination with hand-crafted features. This is due to the great difference in the characteristics of the images acquired with the DigitalPersona sensor compared to those of GreenBit and Dermalog, as is evident from Figure 1. This behavior highlights how the same sensing technology does not always equate to a correspondence between the images’ characteristics. In designing the PAD training phase, it is, therefore, necessary to know these characteristics to face a cross-sensor scenario. However, the minutiae-based approach of the FSB partly solves the difficulties of the textural algorithms, proving to be more efficient when trained on DigitalPersona, especially in the cross-scenarios. For this reason, we further investigate this method’s behavior through its probability distributions (Figure 10, Figure 11, Figure 12, Figure 13, Figure 14 and Figure 15).
Optimal distributions are represented by unimodal distributions with low variability, averaging equal to zero for lives and equal to one for fakes. Besides confirming the observation previously presented, this representation allows us to appreciate the impact of training with multiple data on the classification. The use of multiple data in the training phase allows us, in fact, to obtain mono-modal distributions using datasets that individually lead to multi-modal distributions or distributions with averages far from the optimal ones.
This is evident from the GreenBit ScreenSpoof data distributions (Figure 11), in which the model trained on GreenBit and DigitalPersona positively exploits the GreenBit contribution on lives and the DigitalPersona contribution on fakes, allowing it to obtain a minimum overlap with respect to the distributions of the single models (brown curve). Furthermore, this analysis allows us to explain why fusion does not influence cross-sensor scenarios with different sensing technology, as in the case of the Orchantus experiments. The samples acquired with the Orchantus sensor, in fact, always correspond to a low output score for all the tested models. The models cannot represent the two classes and all the samples are classified as fake. The fusion, therefore, fails to bring benefits because the information at the base is missing; there are no representative samples in the training phase. This shows that the benefit of training on different types of data must be adequately designed to cover all the types of data that the system must be able to recognize; if data are not available on a specific sensor to be integrated into an AFIS, it is necessary to find data as close as possible in terms of image characteristics to those of the target sensor. This is also demonstrated by the results on Dermalog ScreenSpoof (DL SS). Training on the DigitalPersona and GreenBit combination obtains an EER almost equal to or less than training on Dermalog data. The GreenBit data are very similar in terms of image characteristics to those of Dermalog. Using DigitalPersona data increases the ability to generalize and better recognize cross-method data.

5. Discussion and Conclusions

In this paper, we analyzed the impact on cross-sensor use of introducing variety in the type of training data, i.e., when the test data has been acquired with a different sensor than the training data; and on cross-method use, i.e., when the test data have been acquired with different techniques. This allowed us to provide some insights to PAD designers based on cost/efficiency trade-offs and the specific application context of the system. We have reported the main findings of our investigation in Table 12, from which we can derive the following guidelines:
  • For intra-method and intra-sensor experiments, training on the target sensor is preferable; however, training on multiple sensors does not significantly worsen the results;
  • For cross-method experiments, training on different types of images allows obtaining better results for operational points relative to low APCERs. In general, using numerous data for ScreenSpoof tests at the EER is comparable to or better than the single best training;
  • For the cross-sensor experiments, it is not possible to detect a benefit related to the use of training on multiple sensors. However, even single-sensor training does not result in effective PADs, showing that the interoperability problem is still open, and it is not possible to solve it without references from the target sensor. In particular, the need to use in training =the same sensing technology for data acquisition with respect to that expected during system operation was highlighted.
To sum up, if the usage of the AFIS is entirely controlled, there is no expectation of sensor change over time and there is a low probability of falsification using unknown techniques. It is preferable to train with specific target data. If the aim is to make the system more robust to never-before-seen attacks, it is preferable to train it on different data sources. However, an analysis of the image characteristics is necessary to select the best training data.
This work also highlights the need for an in-depth study of the characteristics of both live and fake fingerprint images to obtain a representation capable of including all intra-class variations due to different factors such as sensing technology, sensor size, materials, techniques for making a fake (for PAs), or skin conditions (for lives).

Author Contributions

Conceptualization, G.L.M.; methodology, M.M., G.O., and R.C.; software, M.M., G.O., and R.C.; validation, M.M., G.O., and R.C.; formal analysis, M.M., G.O., and R.C.; investigation, M.M., G.O., and R.C.; resources, M.M., G.O., and R.C.; data curation, R.C.; writing—original draft preparation, M.M., G.O., and R.C.; writing—review and editing, M.M., G.O., R.C., and G.L.M.; supervision, G.L.M. All authors have read and agreed to the published version of the manuscript.

Funding

This research received no external funding.

Institutional Review Board Statement

Not applicable.

Informed Consent Statement

Informed consent was obtained from all subjects involved in the study.

Data Availability Statement

Data supporting reported results can be found at https://livdet.diee.unica.it/ (accessed on 25 September 2022 ).

Conflicts of Interest

The authors declare no conflict of interest.

Abbreviations

The following abbreviations are used in this manuscript:
PAD    Presentation Attack Detection
FPAD    Fingerprint Presentation Attack Detection
SIFS    Scale Invariant Feature Transformation
BSIF    Binarized Statistical Image Features
LBPLocal Binary Pattern
LPQLocal Phase Quantization
SVMSupport Vector Machine
CNNConvolutional Neural Networks
APCERAttack Presentation Classification Error Rate
BPCERBona fide Presentation Classification Error Rate
ROCReceiver Operating Characteristic
GBGreenBit dataset—LivDet 2021 train
GB CCGreenBit consensual dataset—LivDet 2021 test
GB SSGreenBit ScreenSpoof dataset—LivDet 2021 test
DLDermalog dataset—LivDet 2021 train
DL CCDermalog consensual dataset—LivDet 2021 test
DL SSDermalog ScreenSpoof dataset—LivDet 2021 test
BKBiometrika dataset—LivDet 2013 test
OROrcanthus dataset—LivDet 2019 test
DPDigitalPersona dataset—LivDet 2019 train

References

  1. Chugh, T.; Jain, A.K. Fingerprint spoof detector generalization. IEEE Trans. Inf. Forensics Secur. 2020, 16, 42–55. [Google Scholar] [CrossRef]
  2. Casula, R.; Orrù, G.; Angioni, D.; Feng, X.; Marcialis, G.L.; Roli, F. Are spoofs from latent fingerprints a real threat for the best state-of-art liveness detectors? In Proceedings of the 2020 25th International Conference on Pattern Recognition (ICPR), Milan, Italy, 10–15 January 2021; pp. 3412–3418. [Google Scholar]
  3. Sharma, D.; Selwal, A. FinPAD: State-of-the-art of fingerprint presentation attack detection mechanisms, taxonomy and future perspectives. Pattern Recognit. Lett. 2021, 152, 225–252. [Google Scholar] [CrossRef]
  4. Willis, D.; Lee, M. Six Biometric Devices Point the Finger at Security. Netw. Comput. 1998, 9, 84–96. [Google Scholar]
  5. Kallo, P.; Kiss, I.; Podmaniczky, A.; Losi, J. Detector for Recognizing the Living Character of a Finger in a Fingerprint Recognizing Apparatus. U.S. Patent 6,175,641, 16 January 2001. [Google Scholar]
  6. Schuckers, S.A.C. Spoofing and anti-spoofing measures. Inf. Secur. Tech. Rep. 2002, 7, 56–62. [Google Scholar] [CrossRef]
  7. Ghiani, L.; Hadid, A.; Marcialis, G.L.; Roli, F. Fingerprint liveness detection using binarized statistical image features. In Proceedings of the 2013 IEEE Sixth International Conference on Biometrics: Theory, Applications and Systems (BTAS), Arlington, VA, USA, 29 September–2 October 2013; pp. 1–6. [Google Scholar]
  8. Gragnaniello, D.; Poggi, G.; Sansone, C.; Verdoliva, L. Fingerprint liveness detection based on weber local image descriptor. In Proceedings of the 2013 IEEE Workshop on Biometric Measurements and Systems for Security and Medical Applications, Napoli, Italy, 9 September 2013; pp. 46–50. [Google Scholar]
  9. Rattani, A.; Scheirer, W.J.; Ross, A. Open Set Fingerprint Spoof Detection Across Novel Fabrication Materials. IEEE Trans. Inf. Forensics Secur. 2015, 10, 2447–2460. [Google Scholar] [CrossRef]
  10. Grosz, S.A.; Chugh, T.; Jain, A.K. Fingerprint presentation attack detection: A sensor and material agnostic approach. In Proceedings of the 2020 IEEE International Joint Conference on Biometrics (IJCB), Houston, TX, USA, 28 September–1 October 2020; pp. 1–10. [Google Scholar]
  11. Chugh, T.; Cao, K.; Jain, A.K. Fingerprint spoof buster: Use of minutiae-centered patches. IEEE Trans. Inf. Forensics Secur. 2018, 13, 2190–2202. [Google Scholar] [CrossRef]
  12. Lugini, L.; Marasco, E.; Cukic, B.; Gashi, I. Interoperability in fingerprint recognition: A large-scale empirical study. In Proceedings of the 2013 43rd Annual IEEE/IFIP Conference on Dependable Systems and Networks Workshop (DSN-W), Budapest, Hungary, 24–27 June 2013; pp. 1–6. [Google Scholar]
  13. Alshehri, H.; Hussain, M.; Aboalsamh, H.A.; Emad-Ul-Haq, Q.; AlZuair, M.; Azmi, A.M. Alignment-free cross-sensor fingerprint matching based on the co-occurrence of ridge orientations and Gabor-HoG descriptor. IEEE Access 2019, 7, 86436–86452. [Google Scholar] [CrossRef]
  14. Marasco, E.; Sansone, C. On the Robustness of Fingerprint Liveness Detection Algorithms against New Materials used for Spoofing. Biosignals 2011, 8, 553–555. [Google Scholar]
  15. Gajawada, R.; Popli, A.; Chugh, T.; Namboodiri, A.; Jain, A.K. Universal material translator: Towards spoof fingerprint generalization. In Proceedings of the 2019 International Conference on Biometrics (ICB), Crete, Greece, 4–7 June 2019; pp. 1–8. [Google Scholar]
  16. Tuveri, P.; Ghiani, L.; Zurutuza, M.; Mura, V.; Marcialis, G.L. Interoperability among capture devices for fingerprint presentation attacks detection. In Handbook of Biometric Anti-Spoofing; Springer: Berlin/Heidelberg, Germany, 2019; pp. 71–108. [Google Scholar]
  17. ISO/IEC 30107-3:2017(en). Information Technology-Biometric Presentation Attack Detection-Part 3: Testing and Reporting. 2017. Available online: https://www.iso.org/obp/ui/#iso:std:iso-iec:30107:-3:ed-1:v1:en (accessed on 19 September 2022).
  18. Micheletto, M.; Orrù, G.; Casula, R.; Yambay, D.; Marcialis, G.L.; Schuckers, S.C. Review of the Fingerprint Liveness Detection (LivDet) competition series: From 2009 to 2021. arXiv 2022, arXiv:2202.07259. [Google Scholar]
Figure 1. Examples of acquisitions with different sensors: (a) Biometrika, (b) DigitalPersona, (c) Orcanthus, (d) GreenBit, (e) Dermalog. The characteristics of the images are strictly influenced by the acquisition technology.
Applsci 12 09941 g001
Figure 2. Mean histogram of grayscale for all the five considered datasets.
Applsci 12 09941 g002
Figure 3. Comparison of self-trained protocol accuracies for (a) BSIF, (b) LBP, and (c) SpoofBuster with different single-sensor and multi-sensor training techniques.
Applsci 12 09941 g003
Figure 4. Comparison between ROCs of our self-trained PAD systems in an intra- (dashed) and cross- (solid) sensor scenario on the Biometrika dataset from LivDet 2013.
Applsci 12 09941 g004
Figure 5. Comparison between ROCs of our self-trained PAD systems in an intra- (dashed) and cross- (solid) sensor scenario on the Orcanthus dataset from LivDet 2019.
Applsci 12 09941 g005
Figure 6. Comparison between ROCs of our self-trained PAD systems in an intra- (dashed) and cross- (solid) sensor scenario on the Dermalog Consensual dataset from LivDet 2021.
Applsci 12 09941 g006
Figure 7. Comparison between ROCs of our self-trained PAD systems in an intra- (dashed) and cross- (solid) sensor scenario on the Dermalog ScreenSpoof dataset from LivDet 2021.
Applsci 12 09941 g007
Figure 8. Comparison between ROCs of our self-trained PAD systems in an intra- (dashed) and cross- (solid) sensor scenario on the GreenBit consensual dataset from LivDet 2021.
Applsci 12 09941 g008
Figure 9. Comparison between ROCs of our self-trained PAD systems in an intra- (dashed) and cross- (solid) sensor scenario on the GreenBit ScreenSpoof dataset from LivDet 2021.
Applsci 12 09941 g009
Figure 10. Probability distributions of (a) real and (b) fake fingerprint scores of the GreenBit consensual dataset obtained by the PAD Spoofbuster.
Applsci 12 09941 g010
Figure 11. Probability distributions of (a) real and (b) fake fingerprint scores of the GreenBit ScreenSpoof dataset obtained by the PAD Spoofbuster.
Applsci 12 09941 g011
Figure 12. Probability distributions of (a) real and (b) fake fingerprint scores of the Dermalog consensual dataset obtained by the PAD Spoofbuster.
Applsci 12 09941 g012
Figure 13. Probability distributions of (a) real and (b) fake fingerprint scores of the Dermalog ScreenSpoof dataset obtained by the PAD Spoofbuster.
Applsci 12 09941 g013
Figure 14. Probability distributions of (a) real and (b) fake fingerprint scores of the Biometrika 2013 dataset obtained by the PAD Spoofbuster.
Applsci 12 09941 g014
Figure 15. Probability distributions of (a) real and (b) fake fingerprint scores of the Orchantus 2019 dataset obtained by the PAD Spoofbuster.
Applsci 12 09941 g015
Table 1. Characteristics of the pre-trained PAD LivDet 2021 competitors used for the analysis.
ParticipantAlgorithm NameTypeAcronym
DermalogLivDet21ColC2Deep-learningCol
LivDet21DobC2Deep-learningDob
UnespcontrerasHand-craftedcon
Hangzhou Jinglianwen
Tech. Co., Ltd.
JLWLivDetLHybridJLW
MEGVII (BEIJING)
Technology Co., Ltd.
megvii_singleDeep-learningm_s
megvii_ensembleDeep-learningm_e
University of Applied Sciences DarmstadtPADUnkHand-craftedPAD
Chosun UniversityB_ld2Deep-learningbld
Anonymousbb8Hybridbb8
r2d2Hybridr2d2
Table 2. Device characteristics for LivDet 2013, 2019, and 2021 datasets.
ScannerModelResolution [dpi]Image Size [px]FormatType
BiometrikaFX2000569315x372PNGOptical
OrcanthusCertis2 Image500300xNPNGThermal swipe
DigitalPersonaU.are.U 5160500252x324PNGOptical
GreenBitDactyScan84C500500x500BMPOptical
DermalogLF10500500x500PNGOptical
Table 3. Number of samples for each scanner employed in the training phase.
Training SetsLiveLatexRProFastWoodGlueEcoflexGelatine
LivDet 2021 GreenBit Training1250750750---
LivDet 2021 Dermalog Training1250750750---
LivDet 2019 DigitalPersona Training1000250-250250250
Table 4. Number of samples for each scanner employed in the test phase.
DatasetTest Set
LivDet 2021
GreenBit CC/SS
LiveMix1BodyDoubleElmersGlue
2050820820820
LivDet 2021
Dermalog CC/SS
LiveGLS20RFast30
205012301230
LivDet 2019
Orchantus
LiveMix1Mix2Liquid Ecoflex
990384308396
LivDet 2013
Biometrika
LiveEcoflexGelatineLatexModasilWoodGlue
1000200200200200200
Table 5. Results of LivDet 2021 competitors on test sets acquired with the GreenBit sensor. In particular, GB CC is a test set acquired with the consensual technique, while GB SS is a test set acquired with the ScreenSpoof technique. (*) indicates training on both GreenBit and Dermalog Livdet training sets. (**) indicates training on additional data with respect to LivDet training sets.
Alg.Trained on GB and
Tested on GB CC
Trained on DL and
Tested on GB CC
Trained on GB and
Tested on GB SS
Trained on DL
and Tested on GB SS
BPCER
[%]
APCER
[%]
Liv.
Acc. [%]
BPCER
[%]
APCER
[%]
Liv.
Acc. [%]
BPCER
[%]
APCER
[%]
Liv.
Acc. [%]
BPCER
[%]
APCER
[%]
Liv.
Acc. [%]
Col (**)0.2029.8883.610.2423.7886.920.2024.7686.410.2421.3888.23
Dob (**)0.5925.4185.880.4429.8483.530.593.2597.960.444.7297.23
con8.983.9493.771.8580.6955.148.9826.6781.371.8594.5547.58
JLW2.598.2194.350.2087.7652.042.5954.1169.310.2079.7656.41
m_s (*)0.296.3096.430.296.3096.430.2913.9492.260.2913.9592.26
m_e (*)0.052.7298.490.052.7298.490.0513.6292.550.0513.6292.55
PAD (*)1.4637.2079.051.4637.2079.051.4618.4289.291.4618.4289.29
Bld3.615.3795.436.4986.1850.043.6127.5683.326.4989.4748.25
bb83.467.8594.152.2998.2545.373.4639.876.722.2991.5449.02
r2d22.2012.3692.261.6696.3446.702.2057.9367.061.6689.0250.69
Table 6. Results of LivDet 2021 competitors on test sets acquired with the Dermalog sensor. In particular, Derm CC is a test set acquired with the consensual technique, while Derm SS is a test set acquired with the ScreenSpoof technique. (*) indicates training on both GreenBit and Dermalog Livdet training sets. (**) indicates training on additional data with respect to LivDet training sets.
Alg.Trained on DL and
Tested on DL CC
Trained on GB and
Tested on DL CC
Trained on DL and
Tested on DL SS
Trained on GB and
Tested on DL SS
BPCER
[%]
APCER
[%]
Liv.
Acc. [%]
BPCER
[%]
APCER
[%]
Liv.
Acc. [%]
BPCER
[%]
APCER
[%]
Liv.
Acc. [%]
BPCER
[%]
APCER
[%]
Liv.
Acc. [%]
Col (**)1.6126.7199.181.510.2999.161.6158.8667.161.5161.565.76
Dob (**)1.070.1699.371.270.2099.311.0731.3482.411.2726.5984.92
con5.270.2893.4636.440.1683.355.2773.9457.2736.4445.5058.07
JLW0.6830.6598.165.5125.0883.810.6895.1245.415.5199.9243.00
m_s (*)0.832.8099.200.830.7799.200.8329.0783.770.8329.0783.77
m_e (*)0.240.7799.870.240.0499.870.2428.6684.260.2428.6684.26
PAD (*)2.6813.1396.162.684.8096.162.6824.7285.302.6824.7285.30
Bld2.594.8094.285.850.3797.142.5977.9756.305.8522.0385.32
bb82.398.3396.583.6149.5971.312.3969.5146.033.6199.8843.88
r2d21.274.2798.030.7368.2962.421.2782.1145.850.73100.0045.12
Table 7. Results of LivDet 2021 competitors on LivDet Biometrika 2013 and LivDet Orcanthus 2019 test sets. (*) indicates training on both GreenBit and Dermalog Livdet training sets.
Alg.Trained on GB and
Tested on BK 2013
Trained on DL and
Tested on BK 2013
Trained on GB and
Tested on OR 2019
Trained on DL and
Tested on OR 2019
BPCER
[%]
APCER
[%]
Liv.
Acc. [%]
BPCER
[%]
APCER
[%]
Liv.
Acc. [%]
BPCER
[%]
APCER
[%]
Liv.
Acc. [%]
BPCER
[%]
APCER
[%]
Liv.
Acc. [%]
con16.305.7089.000.00100.0050.0098.1822.8941.2483.2362.8727.43
JLW70.404.4062.6052.902.2072.4589.8022.6145.3874.8565.8129.88
m_s0.3011.1094.300.3011.1094.3093.540.4655.2093.540.4655.20
m_e0.300.2099.750.300.2099.7597.270.3753.4697.270.3753.46
PAD (*)0.0092.4053.800.0092.4053.8053.6439.3453.8553.6439.3453.85
Bld18.1734.0073.6516.1097.7043.1099.80052.4581.2110.0256.06
Table 8. Results in terms of accuracy, BPCER, and APCER with a threshold at 0.5 of BSIF, LBP, and SpoofBuster PADs with different single-sensor and multi-sensor training techniques for LivDet 2021 datasets.
ScannerDL CCDL SSGB CCGB SS
BPCERAPCERAccuracyBPCERAPCERAccuracyBPCERAPCERAccuracyBPCERAPCERAccuracy
BSIFDL4.9311.0291.754.9355.8567.293.5647.1172.683.5658.2566.61
DP42.6320.8969.2242.634.7678.0319.5687.3643.4619.5638.2570.24
GB8.4914.3188.348.4986.5048.964.4918.9887.614.4952.6469.25
DL+GB4.8310.0092.354.8373.0557.965.4617.6887.875.4630.4180.93
DL+DP5.669.9692.005.6645.7772.462.3975.1657.922.3946.9573.30
DP+GB9.7615.5787.079.7642.6472.317.079.3591.697.0718.4186.74
DL+GB+DP4.3913.2190.804.3966.2261.885.1711.3491.465.1724.4784.30
LBPDL5.8014.1589.655.8076.2655.7637.0243.1759.6237.0244.5958.85
DP84.931.1060.8084.930.0461.3749.1786.8730.2749.1738.1356.85
GB24.8316.5979.6724.8392.0338.518.5923.9083.068.5956.5465.25
DL+GB6.7324.0283.846.7396.3044.4112.6328.0978.9412.6364.4759.09
DL+DP11.2716.5085.8811.2732.6477.0715.9578.2950.0415.9560.6159.69
DP+GB37.567.9778.5837.5626.6768.3810.6831.5977.9210.6831.1078.18
DL+GB+DP11.0217.3285.5411.0265.5359.2515.5132.6475.1415.5145.2068.29
SpoofBusterDL1.222.6098.031.2299.2345.321.7130.5782.552.8363.3764.15
DP90.494.7656.2790.492.6457.4248.2411.6771.7151.125.8973.55
GB1.3632.1581.841.3799.8044.942.344.7196.362.1443.8275.12
DL+GB1.372.8997.801.3798.5445.631.275.4596.451.4136.9179.22
DL+DP1.026.5495.961.0299.8845.058.9331.5078.7612.5434.3975.54
DP+GB4.2410.6192.284.2477.8055.631.126.9195.721.1221.5087.76
DL+GB+DP8.001.9595.308.0069.6758.364.0512.5291.334.1025.4584.26
Table 9. Results in terms of accuracy, BPCER, and APCER with a threshold at 0.5 of BSIF, LBP, and SpoofBuster PADs with different single-sensor and multi-sensor training techniques for earlier LivDet editions datasets.
ScannerBK 2013OR 2019
BPCERAPCERAccuracyBPCERAPCERAccuracy
BSIFDL71.800.1064.0599.900.0052.41
DP98.000.0051.0099.900.0052.41
GB3.1098.2049.3596.674.4151.64
DL+GB33.003.2081.9099.700.0052.50
DL+DP49.301.3074.70100.000.0052.36
DP+GB7.3072.3060.2099.290.0052.69
DL+GB+DP0.5092.7053.4099.900.0052.41
LBPDL0.0095.0052.5096.572.1152.89
DP92.500.7053.4099.800.0052.45
GB30.5034.1067.7099.091.1952.17
DL+GB0.0096.3051.8589.4929.5041.92
DL+DP0.0099.6050.2091.418.3652.07
DP+GB43.2031.5062.65100.000.0052.36
DL+GB+DP0.3089.0055.3595.255.2451.88
SpoofBusterDL74.501.1062.2083.2318.8450.48
DP99.700.0050.1593.930.3755.05
GB0.2096.7051.5580.6020.8650.67
DL+GB80.601.5058.9594.142.4853.85
DL+DP94.000.0053.0099.800.2852.31
DP+GB42.2013.5072.1593.840.4655.05
DL+GB+DP96.700.1051.6098.380.1853.03
Table 10. Results in terms of accuracy, BPCER, and APCER at different operational points of BSIF, LBP, and SpoofBuster PADs with different single-sensor and multi-sensor training techniques for LivDet 2021 datasets.
ScannerDL CCDL SSGB CCGB SS
APCER (%)@
BPCER = 5%
BPCER (%)@
APCER = 5%
EERAPCER (%)@
BPCER = 5%
BPCER (%)@
APCER = 5%
EERAPCER (%)@
BPCER = 5%
BPCER (%)@
APCER = 5%
EERAPCER (%)@
BPCER = 5%
BPCER (%)@
APCER = 5%
EER
BSIFDL100.0017.076.32100.00100.0017.4075.49100.0015.1683.82100.0016.34
DP100.0072.0035.18100.0062.3920.78100.00100.0053.42100.00100.0028.83
GB100.00100.0011.00100.00100.0050.4257.8514.056.5780.28100.0016.28
DL+GB100.0018.636.48100.00100.0027.7960.8917.328.0370.24100.0011.93
DL+DP65.2423.276.9286.71100.0019.2888.86100.0025.8861.46100.0014.19
DP+GB100.0048.3911.41100.00100.0017.8572.7617.667.8774.2724.639.96
DL+GB+DP62.9721.956.6796.14100.0017.8160.2015.376.7968.0129.9010.84
LBPDL61.6723.229.0494.27100.0032.00100.00100.0038.78100.00100.0039.83
DP100.0085.2742.80100.0080.6840.61100.00100.0067.33100.00100.0044.29
GB100.0060.2021.73100.00100.0058.45100.00100.0013.73100.00100.0023.01
DL+GB100.0040.0512.27100.00100.0048.85100.00100.0016.63100.00100.0029.11
DL+DP81.2237.6612.6386.38100.0018.66100.00100.0035.97100.00100.0033.59
DP+GB100.0061.8525.95100.00100.0031.7976.10100.0017.8370.69100.0018.11
DL+GB+DP100.0044.7312.98100.00100.0030.11100.00100.0020.07100.00100.0024.79
SpoofBusterDL3.982.201.7899.51100.0024.2241.26100.009.4386.9977.8021.46
DP100.0096.3451.09100.0093.2735.5897.20100.0029.57100.0076.8324.50
GB36.7933.958.7599.92100.0058.749.88100.003.5562.6460.4912.39
DL+GB5.693.561.9599.51100.0026.356.14100.003.4043.0957.129.81
DL+DP6.545.802.8099.88100.0034.8384.51100.0016.8787.8973.1221.10
DP+GB33.2522.886.7195.2056.2922.667.20100.003.5728.0138.246.21
DL+GB+DP24.2712.494.3899.8053.3222.2543.70100.007.5162.6435.809.09
Table 11. Results in terms of accuracy, BPCER, and APCER at different operational points of BSIF, LBP, and SpoofBuster PADs with different single-sensor and multi-sensor training techniques for earlier LivDet editions datasets.
ScannerBK 2013OR 2019
APCER (%)@
BPCER = 5%
BPCER (%)@
APCER = 5%
EERAPCER (%)@
BPCER = 5%
BPCER (%)@
APCER = 5%
EER
BSIFDL100.0062.5031.50100.0099.4949.84
DP100.0093.0046.50100.0099.6049.80
GB99.30100.0050.45100.0098.5951.27
DL+GB100.0045.4018.40100.0098.8949.49
DL+DP100.0053.1020.70100.00100.0050.00
DP+GB100.00100.0028.60100.0097.9848.99
DL+GB+DP89.70100.0038.65100.0096.3648.18
LBPDL90.80100.0045.55100.0097.6851.83
DP100.0091.9045.90100.0099.8049.90
GB100.00100.0032.95100.0099.4954.36
DL+GB100.00100.0046.30100.00100.0067.99
DL+DP100.00100.0049.50100.0097.7854.94
DP+GB100.00100.0035.25100.0097.0749.09
DL+GB+DP85.20100.0042.45100.0098.9959.95
SpoofBusterDL95.2075.5031.15100.0097.5850.18
DP100.0087.2032.25100.0091.4128.26
GB87.60100.0021.6598.9099.7051.09
DL+GB100.0084.5039.55100.0097.1742.72
DL+DP100.0079.6037.45100.0099.6049.01
DP+GB92.7074.7028.0594.0388.6932.62
DL+GB+DP100.0087.3046.60100.0094.6547.65
Table 12. Pros and cons of training on data acquired with multiple sensors for the investigated scenarios.
ScenarioPropertyMulti-Sensor Training ProsMulti-Sensor Training Cons
Intra-sensor and
intra-method
  • Same sensor in training and test sets;
  • Same sensor intraining and test sets;
-
  • Increase the BPCER;
  • Effectiveness depends on the final operating context.
Intra-sensor and
cross-method
  • Same sensor in training and test sets;
  • Different methods of spoof fabrication.
  • More robust to PA committed with unknown methods;
  • Better results for operational points relative to low APCERs.
-
Cross-sensor and
intra-method
Intra-sensing
  • Different sensors in training and test sets, but with the same sensing technology (e.g., all optical);
  • Same method ofspoof fabrication.
  • Low training costs;
  • Beneficial, especially on APCER.
  • Improvement depends on the quality of the PAD.
Cross-sensing
  • Different sensors in training and test sets, with different sensing technologies (e.g., optical and capacitive);
  • Same method ofspoof fabrication.
-
  • Ineffective: images could be very different, leading to a low accuracy.
Cross-sensor and
cross-method
Intra-sensing
  • Different sensors in training and test sets, but with the same sensing technology (e.g., all optical);
  • Different methods of spoof fabrication.
  • Low training costs;
  • General improvement with multi-sensor training; the BPCER at stringent operational thresholds improves considerably;
  • Better accuracy then single sensor training.
-
Cross-sensing
  • Different sensors in training and test sets, with different sensing technologies (e.g., optical and capacitive);
  • Different methods of spoof fabrication.
Not evaluated.
Publisher’s Note: MDPI stays neutral with regard to jurisdictional claims in published maps and institutional affiliations.

