Abstract
As the need for medical services has grown in recent years, medical image critical point detection has emerged as a new subject of research for academics. In this paper, a search decision network method is proposed for medical image landmark detection. Unlike the conventional coarse-to-fine methods which generate bias prediction due to poor initialization, our method is to use the neural network structure search strategy to find a suitable network structure and then make reasonable decisions for robust prediction. To achieve this, we formulate medical landmark detection as a Markov decision process and design a shooting reward function to interact with the task. The task aims to maximize the discount of the received value and search for the optimal network architecture over the entire search space. Furthermore, we embed the central difference convolution, which typically extracts the data invariant feature representation, into the architectural search space. In experiments using standard accessible datasets, our approach achieves a detection accuracy of 98.59% in the 4 mm detection range. Our results demonstrate that, on standard datasets, our proposed approach consistently outperforms the majority of methods.
1. Introduction
Recently, orthodontics is one of the most popular surgeries, which improves patients’ facial appearance. A successful orthodontics surgery requires reliable and precise preoperative preparation. The stomatologist analyzes the orthodontic patient’s tooth angle and linear measurement of the point position through the anatomical landmarks annotated (Figure 1) in the skull X-ray images, makes a clinical diagnosis, and formulates an accurate and effective treatment plan according to the measurement results [1]. However, the manual annotation of the landmarks still requires time, even among seasoned medical professionals. Hence, fully automatic and accurate cephalometric landmark detection is currently the main research.
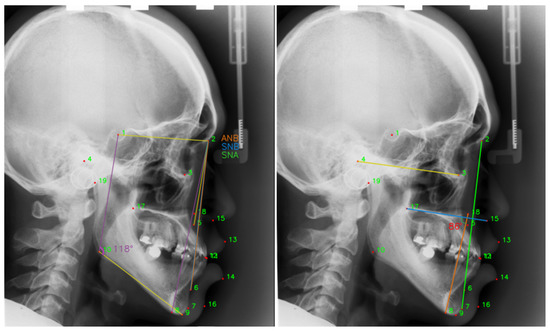
Figure 1.
Doctors perform linear measurements based on the positions of the annotated landmarks. ANB = , the angle between the landmark 5, 2 and 6. SNB = , the angle between the landmarks 1, 2 and 6. SNA = , the angle between the landmark 1, 2 and 5.
Many methods have been devoted to automatic cephalometric landmark detection. Deep learning-based techniques and conventional image-based strategies are the two basic types of landmark detection. The more widely used techniques for detecting images include pixel classification [2,3] and random forest regression [4,5], which are based primarily on statistical a priori information. Deep learning techniques have been extensively applied in recent years to issues with medical image analysis. Deep learning techniques perform landmark detection tasks on medical images far more accurately than conventional machine learning techniques [6,7,8,9,10]. For the first time, Lee et al. utilized the deep learning approach to cephalometric landmark detection [6]. In order to identify different landmarks on MR images of the brain, Zhang et al. integrated two deep CNN networks, one of which was used to regress the coordinates of image landmarks and the other to learn the correlation between local image patches and the target anatomical landmarks [7]. Regarding the proposed U-net network, U-net is also widely used in medical image landmark detection [11]. Zhong et al. proposed two U-nets to produce ‘coarse’ and ‘fine’ heatmap predictions of landmark locations [8]. In simultaneously classifying and identifying landmarks of abdominal ultrasound images using a single network, Xu et al. presented a multi-task learning (MTL) strategy. They discovered that the training method of the multi-task network outperformed the single-task processing method [9]. Payer et al. implicitly modeled the relationships by a spatial configuration block [12]. Anatomical landmarks are often found close to the margin of a particular anatomical area, and Chen et al. developed a cascaded two-stage U-Net network based on this idea for heat map regression [13]. Liu et al. evaluated the clinically significant correlations between the landmarks and position-constrained landmarks with the clinically significant associations, then generated both heat maps and position-constrained vectors for the landmarks [10]. However, the researchers personally created each of the aforementioned neural network architectures. It would not be best to deploy neural network designs that were manually created. On account of this, neural network architectures that can automatically determine the most effective medical landmark regression under the supervised signal of the pertinent task should be taken into consideration.
Manually created regression detection networks with excellent performance need significant skill and a large number of comparing experiments to evaluate the network’s relevant parameters. As a result, the majority of researchers presently use pre-existing networks (such as U-Net [11] and ResNet [14]) and build on top of them with different modifications for different tasks. Therefore, Zoph et al. presented the neural architecture search (NAS) approach, which intends to automatically search for more appropriate neural network architectures for learning than those created manually by experts [15]. The controller is principally responsible for the reinforcement-based strategy for producing new designs for training and assessing the performance of the search architecture. As a reward for architectural search training, the controller utilizes the accuracy of the search architectures on the validation set. NAS has proven to be quite effective in natural image recognition, and researchers are now adapting it to medical image analysis, such as medical segmentation [16] and medical object detection [17].
In this work, we present using reinforcement learning to optimize the loss function and search for accurate and reliable neural network architectures to evaluate the accuracy of regression image landmarks. Specifically, we employ a neural architecture search approach that is based on the optimization of a reinforcement learning algorithm. We propose medical landmark detection as a Markov decision process. To achieve the accuracy of landmark regression, we created the shooting reward function, a learnable reward function that controls the neural network architecture to search and then optimizes the regression process for training landmarks. Compared with vanilla convolution, central difference convolution can better extract semantic information and gradient-level details. Hence, we add central difference convolution in vanilla convolution to extract the data-invariant feature representation. Relevant experiments were carried out using a widely used publicly available dataset, and the experimental findings demonstrated the reliability of the proposed approach.
The main contributions of this work are summarized two-fold:
- We propose an intelligent shooting reward learning network to regress the medical landmark. Benefiting from the full access to all landmarks, our method simultaneously achieves the invariant feature representation and makes reasonable decisions for robust prediction.
- Moreover, the central difference convolution is introduced inside our model, replacing the vanilla convolution to extract the data invariant feature representation. Hence, our method extracts the semantic information and gradient-level detailed messages for robust medical landmark regression.
- Experimentally, we present folds of comparisons with the state of the art and ablation studies on different components. Both the quantitative and qualitative results indicate the effectiveness of the proposed method on the standard dataset.
The remainder of the paper is organized as follows. In Section 2, we give more related work related to medical landmark detection. In Section 3, we discuss the components of our shooting reward learning network algorithm and develop the guidelines for the reward function and network architecture, searching to achieve algorithm stability and robustness based on the theoretic analysis. Section 4 presents our model and discusses the experimental results. Finally, we conclude our work and discuss further work in Section 5.
2. Related Work
In this subsection, we briefly review the related literature on landmark detection.
Conventional landmark detection. Image landmark detection is widely used in face-alignment tasks. In face-alignment research, cascaded regression is widely used to map landmark feature localization to shape. In the initial detection of landmarks in medical images, methods such as pixel classification and random forest regression are mainly used. These methods utilize prior knowledge in statistics to be data driven to explore mathematical relationships between landmarks. However, there are some problems with both face-alignment and landmark-detection methods in medical images. Essentially, the features of images are extracted manually, which requires professional experts and consumes a lot of time. Furthermore, the mapping of linear features cannot handle the localization of landmarks in complex scenes, and the prediction stability of these methods is relatively poor. Hence, proposing a stable and robust method for landmark detection is an extremely challenging task.
Deep Learning-based landmark detection. Deep learning networks have been used to address the issue of landmark recognition in recent years [18], mostly in an end-to-end manner with better nonlinear capabilities for image-to-shape mapping. Deep neural networks learn adaptive feature representations directly from raw image pixels and greatly improved model robustness. For example, Zhang et al. proposed a deep cascade convolutional network, which, with the powerful feature extraction ability of a convolutional neural network and improved the detection accuracy of landmarks [7]. Lee et al. [19] applied a deep learning network to cephalometric landmark detection for the first time, which proposes an end-to-end deep learning system for cephalometric landmark detection. The landmark detection methods based on deep learning can be divided into those based on coordinate regression, heatmap regression, and graph network regression.
Dollar et al. [20] presented cascaded pose regression (CPR) which gradually refines a specified initial prediction value through a series of regressors, where each regressor relies on the output of the previous regressor to perform a simple image operation. The whole system can automatically learn from the training samples. Zhang et al. [21] proposed a multi-task cascaded convolutional network (MTCNN) that can handle both face detection and alignment. MTCNN adopts an online selection method to improve network performance, which can select difficult samples during the training process. However, these methods provide less supervision information during the training process, and the model converges slowly. To address the problem, heatmap-based approaches [10,13,22,23] have also been proposed for landmark detection on a large scale. The deep learning network based on heatmap directly regresses the probability of each class of landmarks, providing supervision information. The network converges faster, and at the same time, predicting the position of each pixel can improve the positioning accuracy of landmarks. Kowalski et al. proposed a new heatmap-based cascaded deep neural network (DAN), which can effectively overcome the problems caused by pose changes and initialization by taking the entire image as input. Since the U-net is widely used in the field of medical image processing, the landmark detection of medical images uses the U-net network to predict the landmark heatmap and then process the final landmark position. Yao et al. [24] implemented a multi-task U-net to predict both heatmaps and offset maps simultaneously. Zhu et al. [25] developed a general anatomical landmark detection model to implement hybrid-based end-to-end training for multiple landmark detection tasks, and the model design requires much fewer parameters than models with standard convolutions. It is well known that all current fully supervised image landmark detection methods require professional doctors to label training data, which usually consumes considerable time and cost. Hence, Yao et al. [26] proposed a self-supervised novel framework named cascade comparing to detect (CC2D) for one-shot landmark detection. The task of landmark localization is particularly suitable for modeling graph networks, and graph modeling is performed based on the positional relationship between landmarks and landmarks [27,28,29,30]. Zhou et al. [30] presented the exemplar-based graph matching (EGM) network, using network learned shape constraints to model graph network structure matching and directly obtain optimal landmark configurations. Li et al. [31] proposed a topology-adaptive deep graph learned end-to-end network by two graph convolutional networks (GCNs) to construct graph signals using local image features and global shape features.
Neural Architecture Search. Recently, many research studies have been conducted on automatic neural architecture search methods [15,32,33,34,35,36,37], and neural architecture search (NAS) is gradually being applied to many computer vision tasks [38], such as image classification [39], object detection [40] or image segmentation [16]. Meanwhile, current neural architecture search algorithms are based on reinforcement learning (RL) [41], the evolutionary algorithm (EA) [42], and the gradient-based method [43]. In RL-based methods, Baker et al. [41] model the network architecture search as a Markov decision process, using RL methods (specifically, the Q-learning algorithm) to generate CNN architectures. For each layer of CNN, learn to choose the type of layer and corresponding parameters. The evaluation accuracy obtained after training after generating the network structure is rewarded. Liu et al. [43] mixed the candidate operations using the softmax function. In this way, the search space becomes a continuous space, and the objective function becomes a differentiable function. Gradient-based optimization methods can be used to find the optimal structure. After the search is over, these mixed operations are replaced by the operations with the largest weight to form the final result network. After that, NAS was gradually applied to the field of medical image segmentation. Yan et al. [44] proposed a multi-scale NAS framework with a multi-scale search space from the network backbone to cell operations and a multi-scale fusion function that fuses features of different sizes. Utilize partial connectivity and two-step decoding to reduce computational overhead while maintaining optimal quality. Zhu et al. formulated structural learning as a differentiable neural architecture search and let the network itself choose between 2D, 3D, or Pseudo-3D (P3D) convolutions at each layer [45]. Kim et al. [46] proposed a neural architecture search (NAS) framework for 3D medical image segmentation, where the NAS framework searches the structure of each layer in the encoder and decoder. Yu et al. [16] presented a coarse-to-fine neural architecture search (C2FNAS) to automatically search 3D segmentation networks from scratch to address inconsistencies in network size or input size. In this work, our method automatically searches for a task-adapted neural network architecture by designing an excitation function and providing a well-initialized parameter during training.
3. Our Proposed Shooting Reward Learning Network
As shown in Figure 2, we present a reinforcement learning-based neural network architectural search technique for searching the regression neural network for the optimal landmarks. Moreover, we create a new learnable reward mechanism function that serves as an effective supervisory signal for neural architecture search and regression network training. Technically, we formulate medical landmark detection as a Markov decision process and leverage reinforcement learning algorithms to incorporate NAS with the medical image landmark regression task. We present central difference convolution, replacing vanilla convolution because central difference convolution can extract the intensity-level semantic information and gradient-level detailed information.
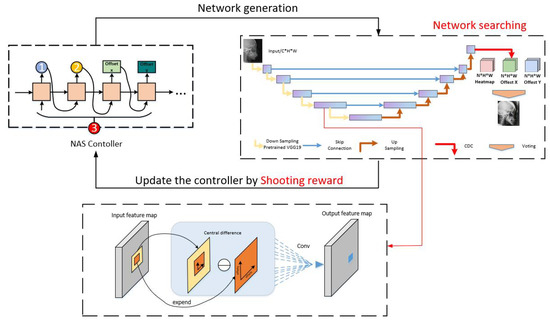
Figure 2.
The overall framework of our method. We design a reward (shooting reward) and exploit a neural architecture search algorithm (reinforcement learning-based with LSTM controller) beyond a search space.
3.1. Central Difference Convolution
Following the convention of NAS, the generated building blocks for the outside network are called cells [47]. The down-sampling and up-sampling blocks are named down-sampling cell (DC) and up-sampling cell (UC), respectively. We design two types of cell architectures called DC and UC based on a multi-task U-Net backbone [24]. Central difference convolution can extract the data invariant feature representation [48]. Semantic information and gradient-level detail information are critical for the regression of medical image landmarks in medical images, which indicates that combining vanilla convolution with central differential convolution may yield more robust regression network models. Hence, we generalize central difference convolution as [48]
where denotes the current location on both input and output feature maps, while enumerates the locations in R.
We replace the vanilla convolution in the backbone network’s up and down sampling with central difference convolution (CDC), and we also replace the vanilla convolution in the network’s deep network with CDC.
3.2. Markov Decision Process Formulation
Inspired by the reinforcement learning for face-alignment tasks, in this work we propose medical landmark detection as a Markov decision process [49]. We define as a location vector of I points, where denotes for the horizontal and vertical coordinates of the i-th landmark, given a medical image I. All ground truth landmarks should be represented by the vector . In this work, a Markov decision process is realized through the definition of an agent. We constrain the full procedure to have both an action space A and a discrete, finite state space S. The agent can select from a finite set of actions, , for each state . With probability, an agent in state will transition to state after performing action . The agent is rewarded at each time step t, depending on the transition from state s to state and the action . Maximizing the total anticipated reward along the whole available structure approaches is the agent’s purpose. Starting from a certain state , perform action in accordance with policy . Bellman’s Equation, often known as the recursive maximization equation, can be articulated as
The Bellman equation could frequently be formulated as an iterative update [41]:
where stands for the agent’s reward and is the maximum total expected reward. Consequently, is referred to as the Q-values. The weight provided to fresh knowledge over old information is determined by the Q-learning rate (), while the weight given to immediate rewards over long-term rewards is determined by the discount factor ().
We evaluate each candidate’s quality value using the searched network and choose a course of action based on policy :
where denotes the network architecture parameters for the entire search.
Shooting reward. We modified the distance between the anticipated regression landmark and the target in different places after assessing the model’s performance, and we assigned various rewards depending on where the regression landmark was located. If we utilize ground truth as the target for the landmark detection task, landmark detection becomes identical to a shooting game that is repeatedly played to achieve the goal of getting nearer to the target. Therefore, to concurrently maximize both processes of learning a landmark loss function and routing a reliable regression network architecture, we designed a learnable incentive (shooting reward Figure 3). In particular, the reward function is intended to quantify the SDR evaluation index, which is defined as follows:
where is the pixel spacing and , are the horizontal and vertical differences between the predicted landmarks and the ground truth, respectively.
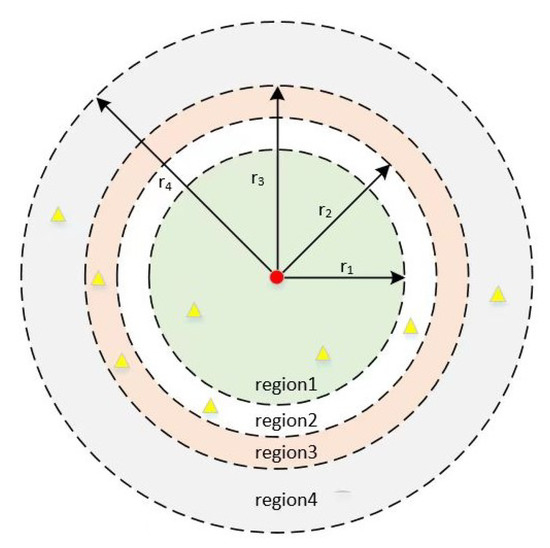
Figure 3.
Schematic of shooting reward. We take the target point as the center of the circle, and according to the SDR evaluation index of the data, we divide four regions with the radii of 2.0 mm, 2.5 mm, 3.0 mm, and 4.0 mm. The red points represent the ground truth, and the yellow points represent the landmarks predicted by the model. The predicted landmarks fall into different regions to give them different rewards.
3.3. Search Strategy
Using a reinforcement learning technique, the agent sequentially selects structures until it reaches a termination state. The verification accuracy and architectural description are deposited in the long short-term memory (LSTM), and the knowledge is sampled from the LSTM on a regular basis to update the Q-value via Equation (3). A neural network with that architecture is created after the controller LSTM has completed deriving it. The model calculates its accuracy on a constant validation sample during the search. The controller LSTM’s relevant settings are then optimized to enhance the anticipated validation accuracy of the search architecture. The controller’s predicted list of operations may be construed as a set of procedures for generating a sub-network architecture. We will train the LSTM controller based on the shooting reward and deploy it as a signal for the search architecture.
We utilize Williams’ reinforcement rule in this work. Since the reward signal cannot be differentiated, we iteratively update using the strategic gradient approach [15]:
where T is the total amount of hyperparameters our controller will predict in order to create a neural network architecture, and m is the total number of designs the controller samples in a batch. After being trained on a training dataset, the k-th neural network design achieves the validation accuracy of , and b is an exponential moving average of the validation accuracy of the preceding architectures.
We design to embed the CDC operation within the search space in order to automatically search a network architecture with promising performance. The specification of a hybrid module, which is the basic computational component in both downsampling cells and upsampling cells, is the first element in explaining the searching space [23]. The hybrid module combines with several operations (), all of which are guaranteed to have the same output structure. There is a parameter that is assigned a weight to the output of each , where . The optimizers will enhance the , whose bonded affected the hybrid module more as the search process progressed, and decrease the other that belong to a less significant . In this research, we present two different types of hybrid modules, the DC and UC. As a consequence, our approach concentrates on selecting the optimal DC and UC design. Table 1 lists the alternative search subspace DC and UC operations.

Table 1.
Operation candidates for down-sampling cell and up-samping cell.
The CDC, in addition to a number of frequently used candidate operations, such as 3 × 3 dilated convolution, 3 × 3 and 5 × 5 depthwise separable convolution, 3 × 3 cweight operation, 2 × 2 pooling operation, and skip connection, make up the search space for the DC and UC.
Algorithm 1 details the training procedure of our shooting reward learning network (SRLN).
| Algorithm 1: SRLN |
| Input: Training set: with N samples, T = 300, t = 75. sharing parameters ,
LSTM controller parameters . Output: SRLN model searching step: for do Initialize and ; A random selection of network architectures ; Update and on training sample; Compute Reward via Equations (5) and (6); Optimize and by Maximizing the function Equation (7); Update parameters and the search network parameters; end training step: for do for do Load the searched network architecture ; Initialize searched network with and ; Execute action and the new state ; Compute Reward via Equations (5) and (6); Update based on Equation (4); Optimize and by Maximizing the function Equation (3); Update based on Equation (4); end end |
4. Performance Evaluation
In this section, we qualitatively and quantitatively evaluate our model and compare it with the public methods on a standard X-ray dataset. In addition, we perform an ablation experiment to show how certain components enhance the effectiveness of our model.
4.1. Setting
All of our experiments were completed on an NVIDIA RTX 3090 GPU and were performed in Pytorch 1.8.0. A setup of 300 epochs was selected for the search neural network architecture task, and 300 epochs were set for neural network training. The training network and the search neural network design both have a batch size of two. We used the ADAM optimizer for both search and training throughout the process. Additionally, the maximum validation accuracy of the previous five epochs is the shooting reward utilized to update the NAS controller. During model training, we use the loss function to optimize the gradient and use the shooting reward to show the training accuracy of the model, as shown in Figure 4.
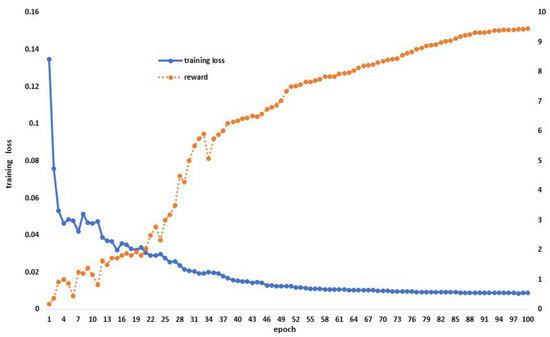
Figure 4.
Model training situation, use the loss function to optimize the gradient during model training and display the score of the excitation function in the process.
4.1.1. Dataset
We made use of the 400 X-ray images from the IEEE ISBI 2015 Challenge, a widely used public dataset for cephalometric landmark recognition. For each X-ray image, 19 landmarks of clinical anatomical relevance were identified by two experienced doctors (Table 2). A training set of 150 images, a test set of 150 images, and a test set of 100 images, respectively, are separated from the dataset.
Table 2.
List of anatomical landmarks.
4.1.2. Metrics
Mean radial error (MRE) and the corresponding standard deviation (SD) are used to measure the quantitative comparison. The successful detection rates for the accuracy ranging as 2.0 mm, 2.5 mm, 3.0 mm, and 4.0 mm served as another assessment criterion. Doctors designated a single pixel rather than a whole region as the location of each landmark. The detection of this landmark is regarded as successful if the absolute difference between the detected and the reference landmark is no larger than z; otherwise, it is regarded as a misdetection. The success detection rate (SDR) with precision less than z is formulated as follows:
where and represent the locations of the detected landmark and the ground truth landmark, respectively; z denotes four precision ranges used in the evaluation, including 2.0 mm, 2.5 mm, 3.0 mm and 4.0 mm; and represent the number of detections made.
4.2. Ablation Study
We developed two baseline techniques and compared them to the ISBI2015 dataset in order to thoroughly justify the components of our proposed module. We used the multi-task U-net network’s results for Baseline-1 without making any changes. We evaluated the backbone multi-task U-net network with central difference convolution for Baseline-2. Based on Baseline-1, we trained the Baseline-3 model and used the proposed reinforcement learning mechanism-based network architecture search to find a network architecture with high performance. Figure 5, Table 3 and Table 4 shows a comparison between our approach and the three established baselines. We show in Figure 6 the locations of the specific landmarks obtained by the different baseline methods. We can see from the figure that our method’s performance is better than the two previous baselines, which demonstrates how effective our network would be at reliably learning landmark regression. Comparing the result reveals a significant increase in detection accuracy, proving the value of automatically searching for appropriate network architectures.
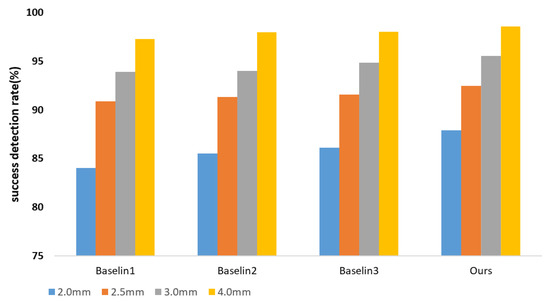
Figure 5.
Ablation study of our model. Success detection rates (SDRs) using four precision ranges, including 2 mm, 2.5 mm, 3 mm, and 4 mm, with 150 test images.
Table 3.
Ablation study results of Baseline-1, Baseline-2, Baseline-3 and our shooting reward learning in ISBI2015 test set 1 (measured by MRE and SDR).
Table 4.
Ablation study results of Baseline-1, Baseline-2, Baseline-3 and our shooting reward learning in ISBI2015 test set 2 (measured by MRE and SDR).
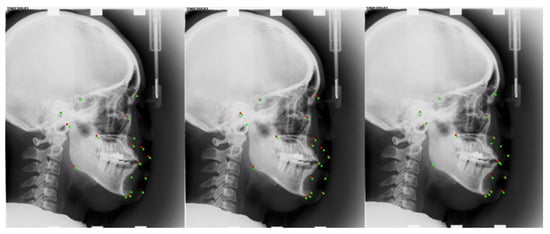
Figure 6.
Medical Landmark detection on the ISBI2015 dataset under a different method. From left to right are the results of Baseline-2, Baseline-3, and our method. Red points are predicted landmarks; green points are ground truth.
4.3. Architecture of Algorithmic Search
The down-sampling and up-sampling cells that were searched using our approach are represented in Figure 7 and Figure 8. Each cell in the figures has three intermediate nodes, each of which has two operations performed out from the preceding nodes. The nodes correspond to feature maps for each cell. Our proposed reward, which receives the maximum reward during the search optimization epochs, determines which cell structure is selected. Figure 7 and Figure 8 demonstrate that the CDC operation is preferable in our search space by the search processing. In order to provide more accurate high-level semantic information and details of the gradient level between the down-sampling and up-sampling routes, the CDC procedure complements the conventional convolution operation.
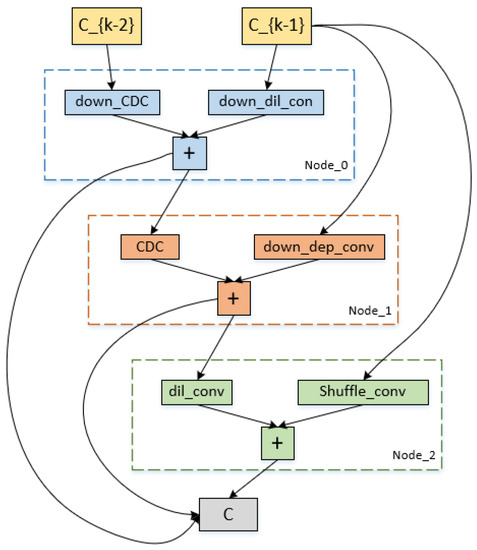
Figure 7.
Cell architecture search by our method on the ISBI2015 dataset. It is the down-sampling cell architecture.
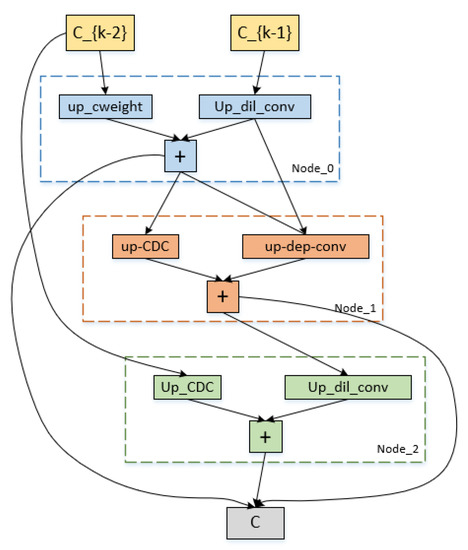
Figure 8.
Cell architecture search by our method on the ISBI2015 dataset. It is the up-sampling cell architecture.
4.4. Result
We quantitatively compare our approach to various current state-of-the-art supervised algorithms as well as the first and second place winners from the ISBI 2015 Challenge in Table 5 and Table 6. As a consequence, our approach obtains MRE of 1.09 mm, 3 mm SDR of 95.54%, 4 mm SDR of 98.59%, and MRE of 1.34 mm, 4 mm SDR of 95.05% in test 2, which are competitive compared to other supervised methods. We provide the model detection image results in Figure 9 so that we can evaluate how accurately our model performs. On several measures, nevertheless, our experiment results fall short of the ideal performance. The fundamental cause of our method’s underperformance on all measures is that our model’s performance is very reliant on the backbone network. We draw the conclusion that each landmark detection produces a different variety of results based on the experimental results in Figure 10. The effectiveness of our model may also be increased by investigating the causes of the high MRE value of landmark detection and then further optimizing the network structure design.
Table 5.
Comparisons of SDR of our method with recent compelling methods on ISBI2015 test set (1).
Table 6.
Comparisons of SDR of our method with recent compelling methods on ISBI2015 test set (2).
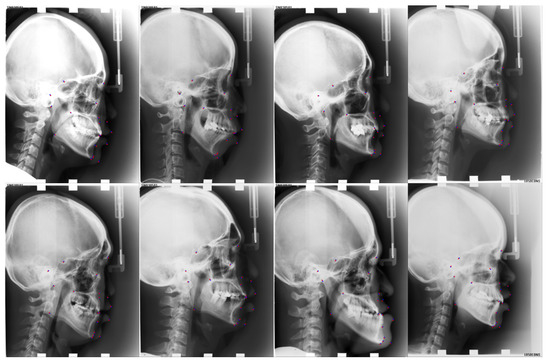
Figure 9.
Visualized results of our approach for the ISBI2015 dataset. Red points are predicted landmarks; blue points are ground truth.
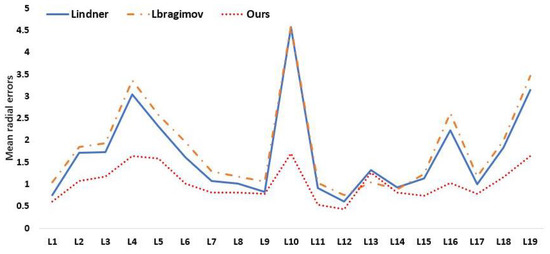
Figure 10.
Mean radial errors (unit: 1 mm) in detection of individual landmarks on the ISBI2015 Test (1).
5. Conclusions and Future Work
In this paper, we develop a reinforcement learning approach and a learning reward to choose a reliable landmark regression network architecture. Extensive experimental results on standard benchmarks show the validity of our shooting reward learning network on model balancing and its effectiveness of medical landmark detection. Future research will focus on self-supervised or unsupervised landmark recognition in medical images, which can solve the problem of expensive labeling. To raise the competence of our model, it would be desirable to design new network configurations and operators. Additionally, to provide supervision signals and improve model performance, structural information connecting medical landmarks will be introduced. We may conclude from our experiments that our model still falls short in terms of the regression accuracy of particular landmarks, and the following work might be examined and adapted for specific spots with inadequate identification.
Author Contributions
Writing—original draft, F.F. and K.H.; Writing—review & editing, F.F. and K.H. All authors have read and agreed to the published version of the manuscript.
Funding
This research was funded by Ningxia Natural Science Foundation Key Project grant number: 2021AAC02004 and Ningxia Key Research and Development project grant number: 2022BEG02016.
Institutional Review Board Statement
Not applicable.
Informed Consent Statement
Not applicable.
Data Availability Statement
The ISBI2015 database is available from http://www-o.ntust.edu.tw/~cweiwang/ISBI2015/challenge1.
Conflicts of Interest
The authors declare no conflict of interest.
References
- Wang, C.W.; Huang, C.T.; Lee, J.H.; Li, C.H.; Chang, S.W.; Siao, M.J.; Lai, T.M.; Ibragimov, B.; Vrtovec, T.; Ronneberger, O.; et al. A benchmark for comparison of dental radiography analysis algorithms. Med. Image Anal. 2016, 31, 63–76. [Google Scholar] [CrossRef] [PubMed]
- Lu, X.; Jolly, M.P. Discriminative context modeling using auxiliary markers for LV landmark detection from a single MR image. In Proceedings of the International Workshop on Statistical Atlases and Computational Models of the Heart, Nice, France, 5 October 2012; pp. 105–114. [Google Scholar]
- Mahapatra, D. Landmark detection in cardiac MRI using learned local image statistics. In Proceedings of the International Workshop on Statistical Atlases and Computational Models of the Heart, Nice, France, 5 October 2012; pp. 115–124. [Google Scholar]
- Gao, Y.; Shen, D. Collaborative regression-based anatomical landmark detection. Phys. Med. Biol. 2015, 60, 9377. [Google Scholar] [CrossRef] [PubMed]
- Han, D.; Gao, Y.; Wu, G.; Yap, P.T.; Shen, D. Robust anatomical landmark detection for MR brain image registration. In Proceedings of the International Conference on Medical Image Computing and Computer-Assisted Intervention, Boston, MA, USA, 14–18 September 2014; pp. 186–193. [Google Scholar]
- Lee, H.; Park, M.; Kim, J. Cephalometric landmark detection in dental x-ray images using convolutional neural networks. In Proceedings of the Medical Imaging 2017: Computer-Aided Diagnosis (SPIE), Orlando, FL, USA, 11–16 February 2017; Volume 10134, pp. 494–499. [Google Scholar]
- Zhang, J.; Liu, M.; Shen, D. Detecting anatomical landmarks from limited medical imaging data using two-stage task-oriented deep neural networks. IEEE Trans. Image Process. 2017, 26, 4753–4764. [Google Scholar] [CrossRef] [PubMed]
- Zhong, Z.; Li, J.; Zhang, Z.; Jiao, Z.; Gao, X. An attention-guided deep regression model for landmark detection in cephalograms. In Proceedings of the International Conference on Medical Image Computing and Computer-Assisted Intervention, Shenzhen, China, 13–17 October 2019; pp. 540–548. [Google Scholar]
- Xu, Z.; Huo, Y.; Park, J.; Landman, B.; Milkowski, A.; Grbic, S.; Zhou, S. Less is more: Simultaneous view classification and landmark detection for abdominal ultrasound images. In Proceedings of the International Conference on Medical Image Computing and Computer-Assisted Intervention, Granada, Spain, 16–20 September 2018; pp. 711–719. [Google Scholar]
- Liu, W.; Wang, Y.; Jiang, T.; Chi, Y.; Zhang, L.; Hua, X.S. Landmarks detection with anatomical constraints for total hip arthroplasty preoperative measurements. In Proceedings of the International Conference on Medical Image Computing and Computer-Assisted Intervention, Lima, Peru, 4–8 October 2020; pp. 670–679. [Google Scholar]
- Ronneberger, O.; Fischer, P.; Brox, T. U-net: Convolutional networks for biomedical image segmentation. In Proceedings of the International Conference on Medical Image Computing and Computer-Assisted Intervention, Munich, Germany, 5–9 October 2015; pp. 234–241. [Google Scholar]
- Payer, C.; Štern, D.; Bischof, H.; Urschler, M. Regressing heatmaps for multiple landmark localization using CNNs. In Proceedings of the International Conference on Medical Image Computing and Computer-Assisted Intervention, Athens, Greece, 17–21 October 2016; pp. 230–238. [Google Scholar]
- Chen, R.; Ma, Y.; Chen, N.; Lee, D.; Wang, W. Cephalometric landmark detection by attentive feature pyramid fusion and regression-voting. In Proceedings of the International Conference on Medical Image Computing and Computer-Assisted Intervention, Shenzhen, China, 13–17 October 2019; pp. 873–881. [Google Scholar]
- He, K.; Zhang, X.; Ren, S.; Sun, J. Deep residual learning for image recognition. In Proceedings of the IEEE Conference on Computer Vision and Pattern Recognition, Las Vegas, NV, USA, 27–30 June 2016; pp. 770–778. [Google Scholar]
- Zoph, B.; Le, Q.V. Neural architecture search with reinforcement learning. arXiv 2016, arXiv:1611.01578. [Google Scholar]
- Yu, Q.; Yang, D.; Roth, H.; Bai, Y.; Zhang, Y.; Yuille, A.L.; Xu, D. C2fnas: Coarse-to-fine neural architecture search for 3d medical image segmentation. In Proceedings of the IEEE/CVF Conference on Computer Vision and Pattern Recognition, Seattle, WA, USA, 13–19 June 2020; pp. 4126–4135. [Google Scholar]
- Ghiasi, G.; Lin, T.Y.; Le, Q.V. Nas-fpn: Learning scalable feature pyramid architecture for object detection. In Proceedings of the IEEE/CVF Conference on Computer Vision and Pattern Recognition, Long Beach, CA, USA, 15–20 June 2019; pp. 7036–7045. [Google Scholar]
- Xia, J.; Qu, W.; Huang, W.; Zhang, J.; Wang, X.; Xu, M. Sparse Local Patch Transformer for Robust Face Alignment and Landmarks Inherent Relation Learning. In Proceedings of the IEEE/CVF Conference on Computer Vision and Pattern Recognition, New Orleans, LA, USA, 21 June 2022; pp. 4052–4061. [Google Scholar]
- Sun, Y.; Wang, X.; Tang, X. Deep convolutional network cascade for facial point detection. In Proceedings of the IEEE Conference on Computer Vision and Pattern Recognition, Portland, OR, USA, 23–28 June 2013; pp. 3476–3483. [Google Scholar]
- Dollár, P.; Welinder, P.; Perona, P. Cascaded pose regression. In Proceedings of the 2010 IEEE Computer Society Conference on Computer Vision and Pattern Recognition, San Francisco, CA, USA, 13–18 June 2010; pp. 1078–1085. [Google Scholar]
- Zhang, K.; Zhang, Z.; Li, Z.; Qiao, Y. Joint face detection and alignment using multitask cascaded convolutional networks. IEEE Signal Process. Lett. 2016, 23, 1499–1503. [Google Scholar] [CrossRef]
- Kowalski, M.; Naruniec, J.; Trzcinski, T. Deep alignment network: A convolutional neural network for robust face alignment. In Proceedings of the IEEE Conference on Computer Vision and Pattern Recognition Workshops, Honolulu, HI, USA, 21–26 July 2017; pp. 88–97. [Google Scholar]
- Wang, F. Neural architecture search for gliomas segmentation on multimodal magnetic resonance imaging. arXiv 2020, arXiv:2005.06338. [Google Scholar]
- Yao, Q.; He, Z.; Han, H.; Zhou, S.K. Miss the point: Targeted adversarial attack on multiple landmark detection. In Proceedings of the International Conference on Medical Image Computing and Computer-Assisted Intervention, Lima, Peru, 4–8 October 2020; pp. 692–702. [Google Scholar]
- Zhu, H.; Yao, Q.; Xiao, L.; Zhou, S.K. You only learn once: Universal anatomical landmark detection. In Proceedings of the International Conference on Medical Image Computing and Computer-Assisted Intervention, Strasbourg, France, 27 September–1 October 2021; pp. 85–95. [Google Scholar]
- Yao, Q.; Quan, Q.; Xiao, L.; Kevin Zhou, S. One-shot medical landmark detection. In Proceedings of the International Conference on Medical Image Computing and Computer-Assisted Intervention, Strasbourg, France, 27 September–1 October 2021; pp. 177–188. [Google Scholar]
- Zhu, S.; Li, C.; Change Loy, C.; Tang, X. Face alignment by coarse-to-fine shape searching. In Proceedings of the IEEE Conference on Computer Vision and Pattern Recognition, Boston, MA, USA, 7–12 June 2015; pp. 4998–5006. [Google Scholar]
- Yu, X.; Huang, J.; Zhang, S.; Metaxas, D.N. Face landmark fitting via optimized part mixtures and cascaded deformable model. IEEE Trans. Pattern Anal. Mach. Intell. 2015, 38, 2212–2226. [Google Scholar] [CrossRef] [PubMed]
- Yu, W.; Liang, X.; Gong, K.; Jiang, C.; Xiao, N.; Lin, L. Layout-graph reasoning for fashion landmark detection. In Proceedings of the IEEE/CVF Conference on Computer Vision and Pattern Recognition, Long Beach, CA, USA, 15–20 June 2019; pp. 2937–2945. [Google Scholar]
- Zhou, F.; Brandt, J.; Lin, Z. Exemplar-based graph matching for robust facial landmark localization. In Proceedings of the IEEE International Conference on Computer Vision, Sydney, Australia, 1–8 December 2013; pp. 1025–1032. [Google Scholar]
- Li, W.; Lu, Y.; Zheng, K.; Liao, H.; Lin, C.; Luo, J.; Cheng, C.T.; Xiao, J.; Lu, L.; Kuo, C.F.; et al. Structured landmark detection via topology-adapting deep graph learning. In Proceedings of the European Conference on Computer Vision, Glasgow, UK, 23–28 August 2020; pp. 266–283. [Google Scholar]
- Cheng, X.; Zhong, Y.; Harandi, M.; Dai, Y.; Chang, X.; Li, H.; Drummond, T.; Ge, Z. Hierarchical neural architecture search for deep stereo matching. Adv. Neural Inf. Process. Syst. 2020, 33, 22158–22169. [Google Scholar]
- Ren, P.; Xiao, Y.; Chang, X.; Huang, P.Y.; Li, Z.; Chen, X.; Wang, X. A comprehensive survey of neural architecture search: Challenges and solutions. ACM Comput. Surv. 2021, 54, 76. [Google Scholar] [CrossRef]
- Bashivan, P.; Tensen, M.; DiCarlo, J.J. Teacher guided architecture search. In Proceedings of the IEEE/CVF International Conference on Computer Vision, Seoul, Korea, 27 October–2 November 2019; pp. 5320–5329. [Google Scholar]
- Zheng, X.; Ji, R.; Tang, L.; Zhang, B.; Liu, J.; Tian, Q. Multinomial distribution learning for effective neural architecture search. In Proceedings of the IEEE/CVF International Conference on Computer Vision, Seoul, Korea, 27 October–2 November 2019; pp. 1304–1313. [Google Scholar]
- Mei, J.; Li, Y.; Lian, X.; Jin, X.; Yang, L.; Yuille, A.; Yang, J. Atomnas: Fine-grained end-to-end neural architecture search. arXiv 2019, arXiv:1912.09640. [Google Scholar]
- Liu, X.; Zhao, J.; Li, J.; Cao, B.; Lv, Z. Federated neural architecture search for medical data security. IEEE Trans. Ind. Inform. 2022, 18, 5628–5636. [Google Scholar] [CrossRef]
- Wang, Y.; Ma, Z.; Wei, X.; Zheng, S.; Wang, Y.; Hong, X. Eccnas: Efficient crowd counting neural architecture search. ACM Trans. Multimed. Comput. Commun. Appl. 2022, 18, 36. [Google Scholar] [CrossRef]
- Real, E.; Aggarwal, A.; Huang, Y.; Le, Q.V. Aging evolution for image classifier architecture search. In Proceedings of the AAAI Conference on Artificial Intelligence, Honolulu, HI, USA, 27 January–1 February 2019; Volume 2, p. 2. [Google Scholar]
- Zoph, B.; Vasudevan, V.; Shlens, J.; Le, Q.V. Learning transferable architectures for scalable image recognition. In Proceedings of the IEEE Conference on Computer Vision and Pattern Recognition, Salt Lake City, UT, USA, 18–22 June 2018; pp. 8697–8710. [Google Scholar]
- Baker, B.; Gupta, O.; Naik, N.; Raskar, R. Designing neural network architectures using reinforcement learning. arXiv 2016, arXiv:1611.02167. [Google Scholar]
- Real, E.; Aggarwal, A.; Huang, Y.; Le, Q.V. Regularized evolution for image classifier architecture search. In Proceedings of the AAAI Conference on Artificial Intelligence, Honolulu, HI, USA, 27 January–1 February 2019; Volume 33, pp. 4780–4789. [Google Scholar]
- Liu, H.; Simonyan, K.; Yang, Y. Darts: Differentiable architecture search. arXiv 2018, arXiv:1806.09055. [Google Scholar]
- Yan, X.; Jiang, W.; Shi, Y.; Zhuo, C. Ms-nas: Multi-scale neural architecture search for medical image segmentation. In Proceedings of the International Conference on Medical Image Computing and Computer-Assisted Intervention, Lima, Peru, 4–8 October 2020; pp. 388–397. [Google Scholar]
- Zhu, Z.; Liu, C.; Yang, D.; Yuille, A.; Xu, D. V-NAS: Neural architecture search for volumetric medical image segmentation. In Proceedings of the 2019 International Conference on 3D Vision (3DV), Quebec, QC, Canada, 15–18 September 2019; pp. 240–248. [Google Scholar]
- Kim, S.; Kim, I.; Lim, S.; Baek, W.; Kim, C.; Cho, H.; Yoon, B.; Kim, T. Scalable neural architecture search for 3d medical image segmentation. In Proceedings of the International Conference on Medical Image Computing and Computer-Assisted Intervention, Shenzhen, China, 13–17 October 2019; pp. 220–228. [Google Scholar]
- Weng, Y.; Zhou, T.; Li, Y.; Qiu, X. Nas-unet: Neural architecture search for medical image segmentation. IEEE Access 2019, 7, 44247–44257. [Google Scholar] [CrossRef]
- Yu, Z.; Zhao, C.; Wang, Z.; Qin, Y.; Su, Z.; Li, X.; Zhou, F.; Zhao, G. Searching central difference convolutional networks for face anti-spoofing. In Proceedings of the IEEE/CVF Conference on Computer Vision and Pattern Recognition, Seattle, WA, USA, 13–19 June 2020; pp. 5295–5305. [Google Scholar]
- Liu, H.; Lu, J.; Guo, M.; Wu, S.; Zhou, J. Learning reasoning-decision networks for robust face alignment. IEEE Trans. Pattern Anal. Mach. Intell. 2018, 42, 679–693. [Google Scholar] [CrossRef] [PubMed]
- Lindner, C.; Cootes, T.F. Fully automatic cephalometric evaluation using random forest regression-voting. In Proceedings of the IEEE International Symposium on Biomedical Imaging (ISBI) 2015–Grand Challenges in Dental X-ray Image Analysis–Automated Detection and Analysis for Diagnosis in Cephalometric X-ray Image, Brooklyn, NY, USA, 16–19 April 2015. [Google Scholar]
- Ibragimov, B.; Likar, B.; Pernus, F.; Vrtovec, T. Computerized cephalometry by game theory with shape-and appearance-based landmark refinement. In Proceedings of the International Symposium on Biomedical Imaging (ISBI), Brooklyn, NY, USA, 16–19 April 2015. [Google Scholar]
- Arik, S.Ö.; Ibragimov, B.; Xing, L. Fully automated quantitative cephalometry using convolutional neural networks. J. Med. Imaging 2017, 4, 014501. [Google Scholar] [CrossRef] [PubMed]
- Sun, K.; Xiao, B.; Liu, D.; Wang, J. Deep high-resolution representation learning for human pose estimation. In Proceedings of the IEEE/CVF Conference on Computer Vision and Pattern Recognition, Long Beach, CA, USA, 15–20 June 2019; pp. 5693–5703. [Google Scholar]


Publisher’s Note: MDPI stays neutral with regard to jurisdictional claims in published maps and institutional affiliations. |
© 2022 by the authors. Licensee MDPI, Basel, Switzerland. This article is an open access article distributed under the terms and conditions of the Creative Commons Attribution (CC BY) license (https://creativecommons.org/licenses/by/4.0/).