Article

Effects of Glucose Addition on Dynamics of Organic Carbon Fractions and cbbL-Containing Bacteria in Wetlands

1
School of Architecture and Urban Planning, Shandong Jianzhu University, Jinan 250101, China
2
College of Chemistry and Chemical Engineering, Qilu Normal University, Jinan 250200, China
3
School of Municipal and Environmental Engineering, Shandong Jianzhu University, Jinan 250101, China
*
Authors to whom correspondence should be addressed.
Appl. Sci. 2022, 12(20), 10239; https://doi.org/10.3390/app122010239
Submission received: 20 August 2022 / Revised: 5 October 2022 / Accepted: 8 October 2022 / Published: 12 October 2022

Abstract

:
Studying the CO2-assimilation potential under the effect of glucose addition is of great significance to completely comprehend the dynamic carbon cycle in wetland ecosystems. Rhizospheric sediments (RS) and bulk sediments (BS) were selected, with the addition of glucose (G) or not, and two experimental pots (RSG and BSG) and two control pots (RS and BS) were formed. Then, within 45 h of glucose addition, the sediments were sampled at intervals of 4 h for dynamic monitoring. The bacterial communities encoded by CO2-assimilating function genes (cbbL) and the corresponding activities of key enzyme (ribulose-1,5-bisphosphate carboxylase oxygenase, RubisCO), and the light fraction (LF) and heavy fraction (HF) of organic carbon (C) and nitrogen (N) of the samples were determined. The results demonstrated that the dynamic processes of glucose deposition and degradation occurred in sediments from RSG and BSG, with the greatest depositions of 2.35 and 2.48 mg·g−1 in the 4th and 12th hour, respectively. The contents of LFOC, LFON, HFOC, and HFON decreased by 171.70%, 125.45%, 8.40%, and 68.17% in the RSG pot, and decreased by 221.55%, 102.61%, 0.07%, and 74.74% in the BSG pot, respectively, which suggested the dominant activities of C and N mineralization. The FT-MIR of LF showed different changes of typical chemical bonds between RSG and BSG during the process, which further indicated irregular and inconsistent mineralization activities. The RubisCO activities in the rhizospheric sediments (52.14 nmol (g·min)−1 on average) were substantially greater than in the bulk sediments, which indicated the high potential of carbon assimilation in rhizospheric sediments. Moreover, it showed a lower trend in BSG, BS, and RS, but an increasing trend in RSG after the glucose addition, albeit the effects were recovered in the 45th hour. The cbbL-containing bacteria were more abundant in the rhizospheric sediments than in the bulk sediments, and this effect was higher than that of the glucose addition. Proteobacteria were the dominating phylum with mean values of 93.49%, and Burkholderiales was found to be the dominant order (37.74% on average). Moreover, the changes in bacterial composition between the rhizospheric sediments and bulk sediments were more pronounced than they were during the process. Therefore, the effects of glucose degradation on RubisCO activity and cbbL-containing bacteria were transient, but the effects on organic matter fractions were straightforward, which probably further change the bacterial abundance and composition.

1. Introduction

When faced with the discharge of human pollutants and animal waste and the decomposition of biological residues, water can retain a large number of small-molecule organic matter (OM) [1,2]. The substrate of wetland, such as rivers, lakes, and marshes, comprises sediment, gravel, and many other base materials [3]. A large number of microbial communities live in the wetland substrate. The small-molecule OM in the overlying water can be settled, accumulated, degraded, and transformed by the microbial activities, thus the concentration of small-molecule OM is reduced and water eutrophication is alleviated in the wetlands [4,5]. Meanwhile, the above-mentioned metabolic process can seriously affect the carbon sequestration, nitrogen removal, and other functions of wetlands [6], while the attention on the accumulation and degradation of small-molecule OM in wetlands is far from enough. At present, most relevant studies focus on the effects of exogenous carbon addition on the greenhouse gas and nitrogen emissions [7,8], but the internal dynamics and affecting mechanisms are still not clear.
Many scholars have studied the dynamic impacts of exogenous carbon addition on the nitrogen cycle and carbon cycle in soils and wetland sediments. Organic fertilizers, as one compound of exogenous nutrition, can directly input labile carbon into soils, stimulating the degradation of soil organic carbon (OC) by microorganisms [9]. Additionally, the addition of organic fertilizers significantly enhances the abundance of genes related to nitrification and denitrification [10]. Furthermore, the inputs of chemical N fertilizers (ammonium- or nitrate-based) can not only stimulate N2O, but also promote CH4 and CO2 emissions [11]. Exogenous carbon addition enriches the relative abundances of proteobacteria and planctomycetes that carry C and N cycling genes, while inhibiting the growth of oligotrophic groups such as Verrucomicrobia [12]. Moreover, the results have indicated that exogenous carbon addition can significantly decrease soil nitrate nitrogen (NO3-N) and ammonium nitrogen (NH4+-N) contents, and reduce the nitrogen mineralization by inhibiting nitrification [13,14]. The addition of monosaccharides or synthetic root secretions can rapidly raise the nitrogen-fixing bacteria abundance and nitrogen fixation rate in sediments, thus improving the organic nitrogen accumulation [15]. Yang et al. (2019) indicated that exogenous biochar addition can elevate soil fertility, crop yield, CO2 absorption, and organic carbon accumulation [16]. Zieger et al. (2018) suggested little increase in organic carbon storage when exogenous carbon is continuously added to carbon-saturated soils for years [17]. The addition of plant residues can increase the prim effect and promote the native original organic carbon decomposition [18]. Aye et al. (2016) reported that the effects on exogenous glucose addition are mainly manifested in the first 3 days, with glucose mostly being degraded and the mineralization of native organic carbon being induced [19]. Moreover, the impacts of glucose addition on bacteria were more significant than fungi, and bacterial abundance was remarkably elevated with glucose addition [16], while the impacts on wetland OC dynamics were still not deep enough. This research identified the main dynamics of nitrogen, carbon, and microbial activities after the addition of various amounts of exogenous carbon. The CO2 assimilation by autotrophic microbes and biology-derived OM input are also important aspects of sediment carbon fixation and sequestration, while the affecting performance is less studied.
Mostly, autotrophic microbes fix CO2 through the Calvin cycle [20]. Ribulose-1,5-bisphosphate carboxylase oxygenase (RubisCO) is the key enzyme for controlling the Calvin cycle rate, which is performed in four forms (I, II, III, and IV), with different structures, functions, and O2 sensitivities [21]. Among them, the I form of RubisCO is the most dominant, whose large subunit contains catalytically active amino acid residues encoded by the cbbL genes [22]. In recent years, RubisCO and the encoded cbbL genes have been widely valued and studied in aquatic, terrestrial, and wetland ecosystems. Yuan et al. (2013) studied the community structure and diversity of the autotrophic bacteria in agricultural soil and paddy systems, and indicated the significant effects of different land use, and also showed that the synthesis rates of soil organic carbon ranged from 0.0134 to 0.103 g·C·m−2·day−1 [23]. Cao et al. (2017) showed the different amounts of RubisCO activity in the rhizospheric sediments of Poyang Lake, as well as the significant and positive correlations between RubisCO activity and organic carbon fractions [24]. Wu et al. (2014) also showed the significantly higher 14C-OC in surface soil than in subsurface soil after 80 days of 14C-CO2 incubation, and the wetland sediments presented notably higher CO2 fixation rates than upland sediments [25]. Thus, the CO2 fixation process and RubisCO activity are very sensitive to surroundings and soil properties, and wetland sediments potentially present certain advantages. From the previous reports, we deduced that exogenous carbon addition could also have certain effects on the RubisCO activity and composition of cbbL gene-containing bacterial communities.
Based on the chemical stability and soil density, OM can be separated into light fraction and heavy fraction organic matter (LFOM and HFOM). LFOM, mainly the undecomposed or partly decomposed residues of animals, plants, and microbes, basically accounts for about 1–5% and is sensitive to land use and climate changes [26]. HFOM is the dominant component of the OM reservoir pool in wetland sediment, accounting for more than 60% of total amount [27]. It presents a complex chemical structure and stable physicochemical properties, and is not easily affected by biological activities or environmental changes [28]. Several studies have expounded the effect of land change, upland types, different rhizospheric sediments, and human activities on the dynamic changes of LFOM and HFOM [26,27,28], while the effect of exogenous carbon addition on the OM fractions is still not clear.
Although the global wetland area only accounts for 4–6% of the land area, it contains more than 30% of the global carbon reserves, and plays an important role in the process of the land and global carbon cycle. The impacts of exogenous carbon degradation on carbon composition and contents, abundance, and composition of cbbL gene-containing bacterial communities can directly relate to the carbon cycle in wetlands, thus reducing the carbon fixation potential. To explore the detailed affecting dynamics and internal mechanism of exogenous carbon addition, this experimental research is conducted. As the most typical constituent of small-molecule OM, glucose is selected as the representative. We designed the control experiment of glucose addition into wetland rhizospheric sediments and bulk sediments, and conducted the subsequent study. This study aims to (1) analyze the effects of glucose addition on LFOM, HFOM, as well as the changes of typical chemical bonds in LFOM, (2) present the changes of RubisCO activity and its relations with cbbL gene abundance, and (3) show the composition characteristics of cbbL-encoded bacteria during the glucose degradation. This study firstly revealed the responses of the CO2 assimilation process to the glucose addition in wetland, which is of great significance to clarify the soil carbon cycle in wetland ecosystem.

2. Methods and Materials

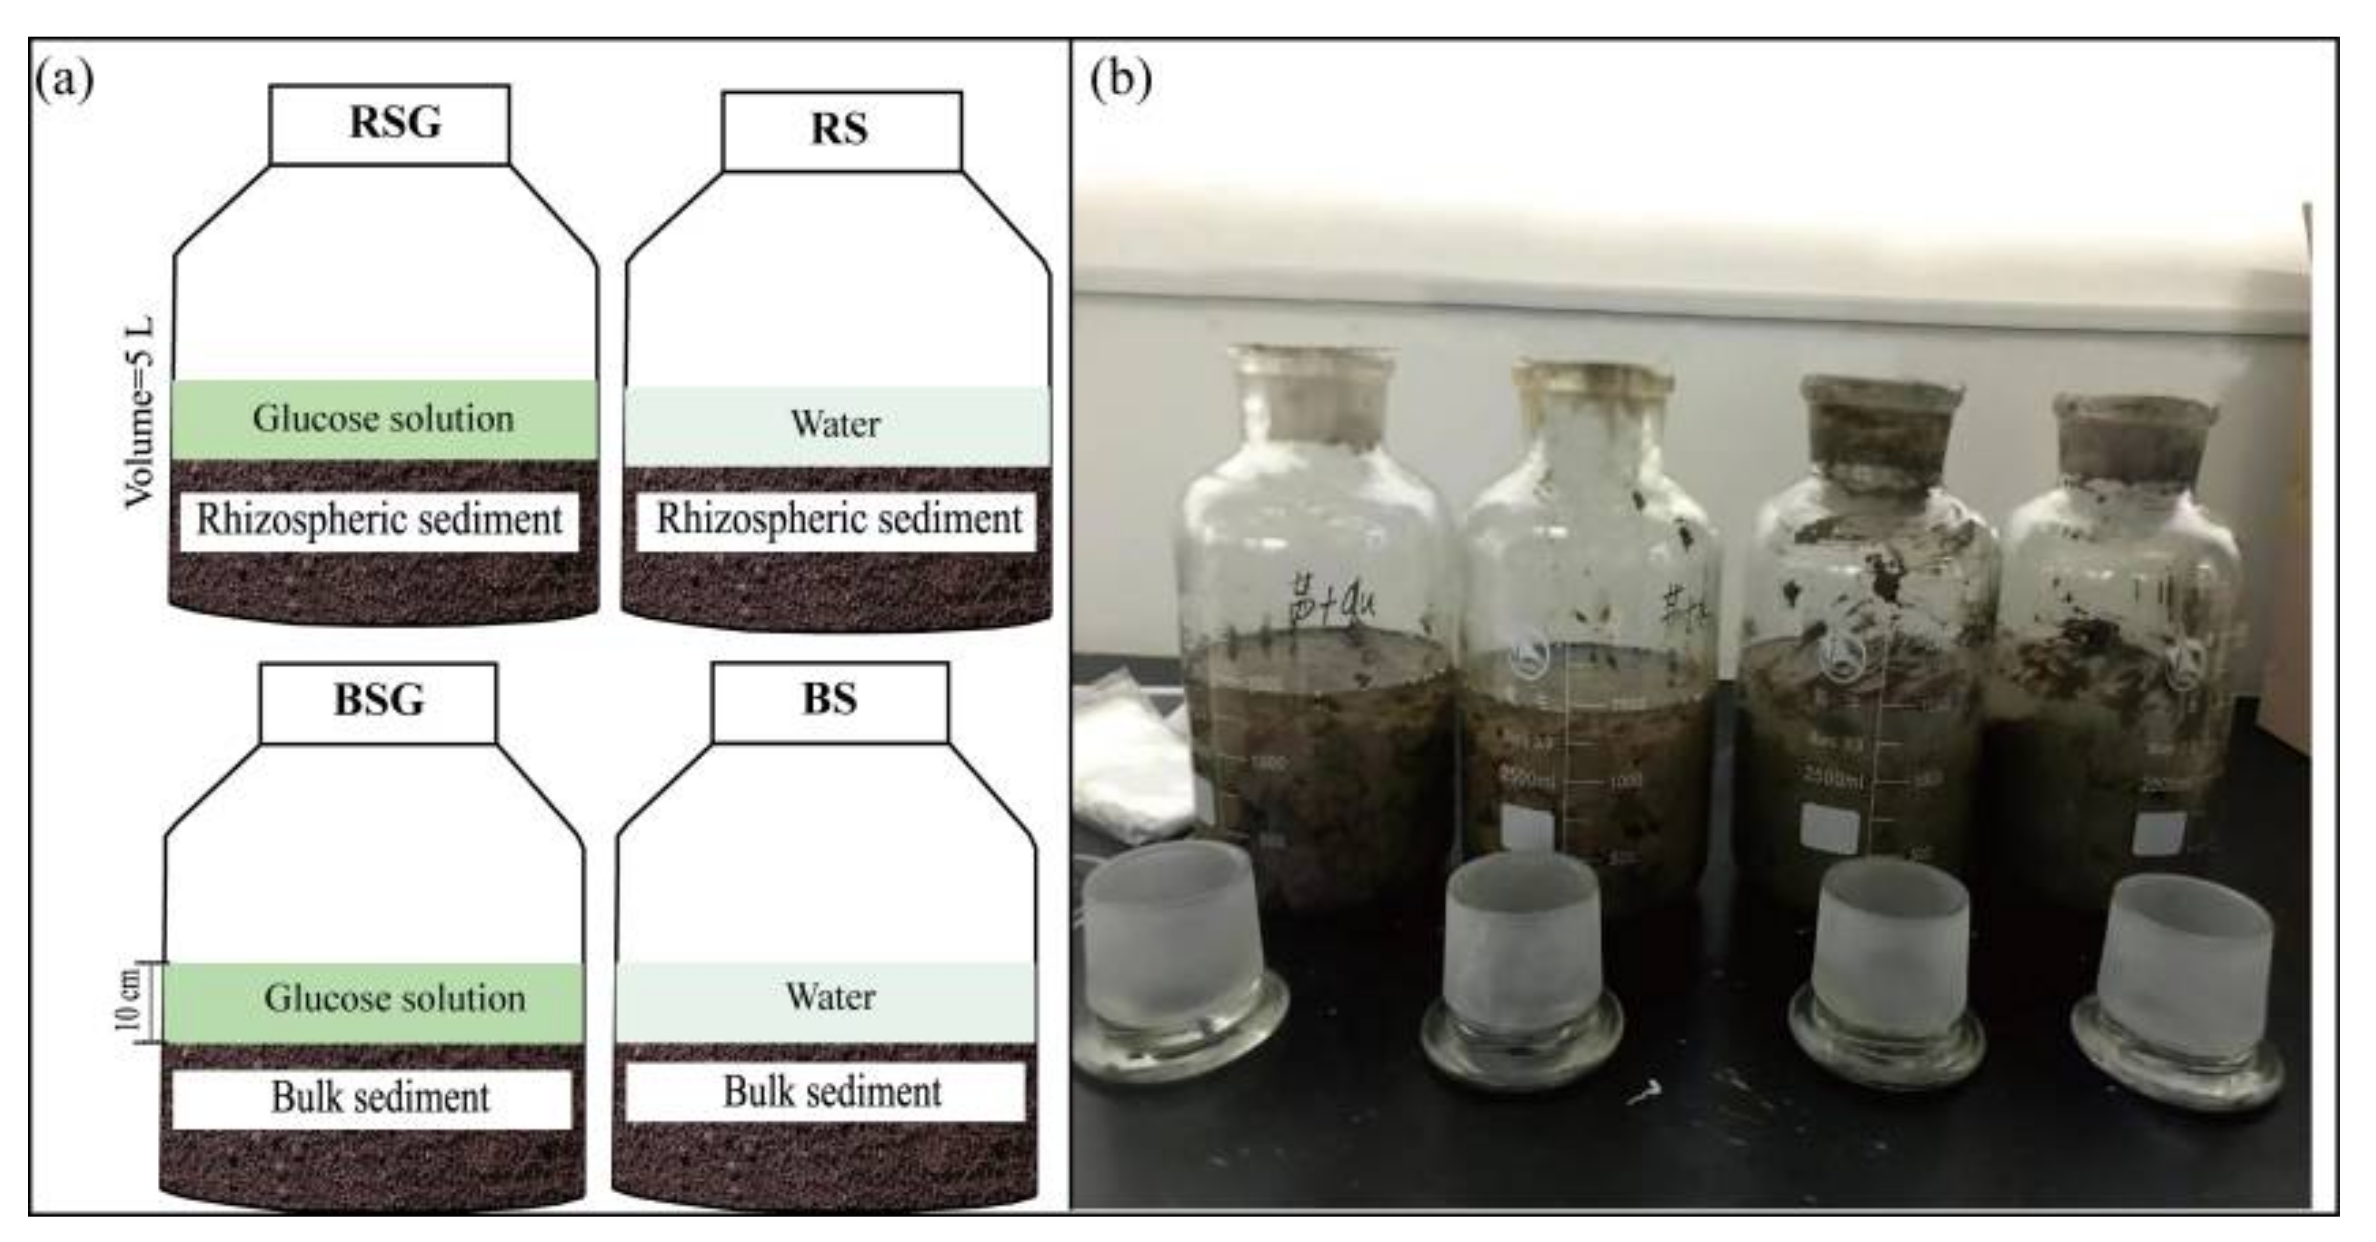
2.1. Field Sampling and Experimental Design

The field sampling was conducted in city of Feicheng, Shandong Province, China, in July 2021. The rhizosphere sediments (RS) of Phragmites australis and the neighboring bulk sediments (BS) were collected from a tributary of the Kangwang River. This study was conducted in the lab of Qilu Normal University. The sediments were ground and passed through 2 mm stainless steel sieves to remove gravel, biological residues, and bottom fauna [29]. The water contents and bulk density were analyzed by drying 100 cm3 of sediments at 105 °C until a constant weight, and then they were calculated by the corresponding formula [30]. Four cylindrical pots were customized with a depth of 35 cm and a diameter of 28 cm, among which two pots were placed with an RS of 2 kg dry weight, and the other two pots were loaded with BS. The sediments were incubated for 48 h with water saturation. The glucose of 15 mg·g−1 dry soil was dissolved with ultrapure water and poured into one RS pot and one BS pot—the detailed information is shown in Figure 1. Therefore, the experimental group with added glucose and the control group with added water were settled.

2.2. Experimental Analysis

Once the glucose and water had been added, we recorded the time. Duplicate sediment samples in each pot were collected into sealed bags at the 4th, 8th, 12th, 16th, 20th, 24th, 36th, and 45th hour; one was refrigerated at 4 °C, and another was frozen at −20 °C. The sampling principles referred to Bürgmann et al. [15]. After sampling, the refrigerated sediments were air-dried and passed through 0.9 mm sieves. The frozen sediments were freeze-dried and sieved for DNA extraction using Illumina MiSeq sequencing. The glucose content was determined using a glucose enzymatic kit (Nanjing Jiancheng Bioengineering Institute, China) according to the operating instructions. The pH of the sediment samples was also examined using a pH meter. Each sample was measured three times, with the mean value calculated as the final data.

2.2.1. Analysis of LFOM and HFOM

The gravity separation method was adopted to separate the LFOM and HFOM from the sediments [31]. Specifically, 10.00 g of the sediment samples were weighed into 100 mL centrifugal tubes, which were pre-weighed. Then, 1.80 g·mL−1 of sodium iodide solution was prepared by an areometer. The 40 mL sodium iodide solution (NaI) was added into the centrifuge tubes, which were shaken ultrasonically for 10 min, and then the light fraction (LF)was suspended in the solution and the heavy fraction (HF) was deposited at the bottom. The samples were stirred thoroughly and centrifuged for 10 min at 4500 r·min−1. The LF was filtered into 0.043 mm brass sieves. This procedure was repeated 2–3 times to ensure the thorough separation of the LF and HF. Then, the 0.01 M calcium chloride solution was used to repeat the procedures till all iodine ions (I) were removed, and then it was washed using ultrapure water till all chloridion (Cl) reactions ceased. The LF and HF were oven-dried at 40 °C and weighed. The contents of C and N in the LFOM and HFOM, respectively, were determined by an elemental analyzer (Vario EL III, Elementar Analysensysteme, Germany).

2.2.2. RubisCO Activity Analysis

The Ripnose-1,5-diphosphate (RuBP) carboxylase can catalyze the reaction of RuBP and CO2 to produce phosphoglyceric acid, which can be coupled to the oxidative action of nicotinamide adenine dinucleotide (NADH). Based on this chemical reaction process, the spectrophotometric enzyme-coupling method can be used to determine the RubisCO activity [32]. For all of the freeze-dried sediments, samples of 2.00 g were added into 10 mL centrifuge tubes, to which was also added 600 μL of 2.0 ug mL−1 protease inhibitor (Sigma), 6 mL of 100 mM Tris–HCl (pH 7.8) and 1 mM dithiothreitol. After 30 min of ultrasonic oscillation at 0 °C, the mixtures in the tubes were separated by centrifugation for 15 min at a speed of 14,000 r·min−1 and at 4 °C. The centrifugation was repeated to ensure the maximum particle removal rate. Ammonia sulfate was added to the suspensions until a saturation rate of 80% was reached. After stirring and centrifugation, the formed pellets were then dissolved in 50 μL buffer of 100 mM Tris–HCl (pH 7.8) and 1 mM dithiothreitol. Subsequently, 50 μL of 100 mM ATP, 100 mM phosphocreatine, 40 U·mL−1 phosphocreatine kinase, 80 U·mL−1 3-glycerophosphate dehydrogenase (Sigma), 80 U·mL−1 3-phosphoglycerate phosphokinase (Sigma), and 10 mM RuBP were added into 700 μL of the above-mentioned buffer, respectively. The absorbance of the buffer at a wavelength of 340 nm was detected by ultraviolet spectrophotometer, and it was recorded as E0. Then, 50 μL of 25 mM RuBP and 50 μL of 4 mM NADH were added to the buffer, and the absorbance was determined after a reaction time of 30s, which was recorded as Et. The formulation of RubisCO activity (nmol CO2 g−1 min−1) was listed as follows.
RubisCO   activity = F ( E 0 E t ) V ε dtw
In this formulation, F means the converted coefficient of the molecular ratio from CO2 to cofactor NADH, and the value is 0.5. V is the total volume of the reaction mixture (mL). ε means the absorptivity, the value of which is 6.22 × 10⁻³ mL nmol−1 cm−1, and d is the optical path length of the cuvette (cm). t and w are the reaction time (min) and soil weight (g), respectively. This experiment was repeated three times and the average values of absorbance were calculated as the final data of the RubisCO activity.

2.2.3. DNA Extraction, Illumina MiSeq Sequencing, and Real-Time PCR of cbbL Gene

For analyzing the composition changes of the CO2-assimilating bacterial communities during the glucose degradation, sediment samples from the 8th, 16th, 24th, and 45th hour were selected for DNA extraction and the quantification of the cbbL gene in the four pots [26]. The freeze-dried samples were weighed at 0.5000 g, and a bacterial DNA isolation kit (TianGEN Biotech Co. Ltd., Beijing, China) and Nanodrop were used to extract and quantify the DNA, respectively. The quality of the extracted DNA was tested by 1.2% agarose gel electrophoresis. K2f (5′-ACCAYCAAGCCSAAGCTSGG-3′) and V2f (5′-GCCTTCSAGCTTGCCSACCRC-3′) were the primers of the cbbL gene [33]. Then, PCR amplification was conducted based on the primers. Magnetic beads (Vazyme VAHTSTM DNA Clean Beads) were used to recover the purified PCR product. In addition, the Quant-iT PicoGreen dsDNA Assay Kit reagent and a microplate reader (BioTek, FLx800) were used to fluorescently quantify the purified PCR product [34]. The cycle parameters were as follows: 5 min at 95 °C, 40 cycles of 15 s min at 95 °C and 30 s at 60 °C, and 1 min 30 s at 72 °C. These cycles were followed by 10 min incubation at 70 °C. A TruSeq Nano DNA LT Library Prep Kit (Illumina Company, LTD) was applied to construct the sequencing library, which was qualified and tested with an Agilent Bioanalyzer and with an Agilent High Sensitivity DNA Kit. The sequencing length of the target fragment was 400–450 bp. The sequencing library was quantified with a Promega Quanti-Fluor system and a Quant-iT PicoGreen dsDNA Assay Kit. Paired-end sequencing was carried out using a MiSeq Reagent Kit V3 (600 cycles) and MiSeq sequenator [23]. During the process, the raw sequencing of high throughput was preliminarily screened, and barcode sequencing was removed. The analysis procedures of QIIME 2 and Vsearch software were used to denoise and cluster the operational taxonomic units (OTUs).

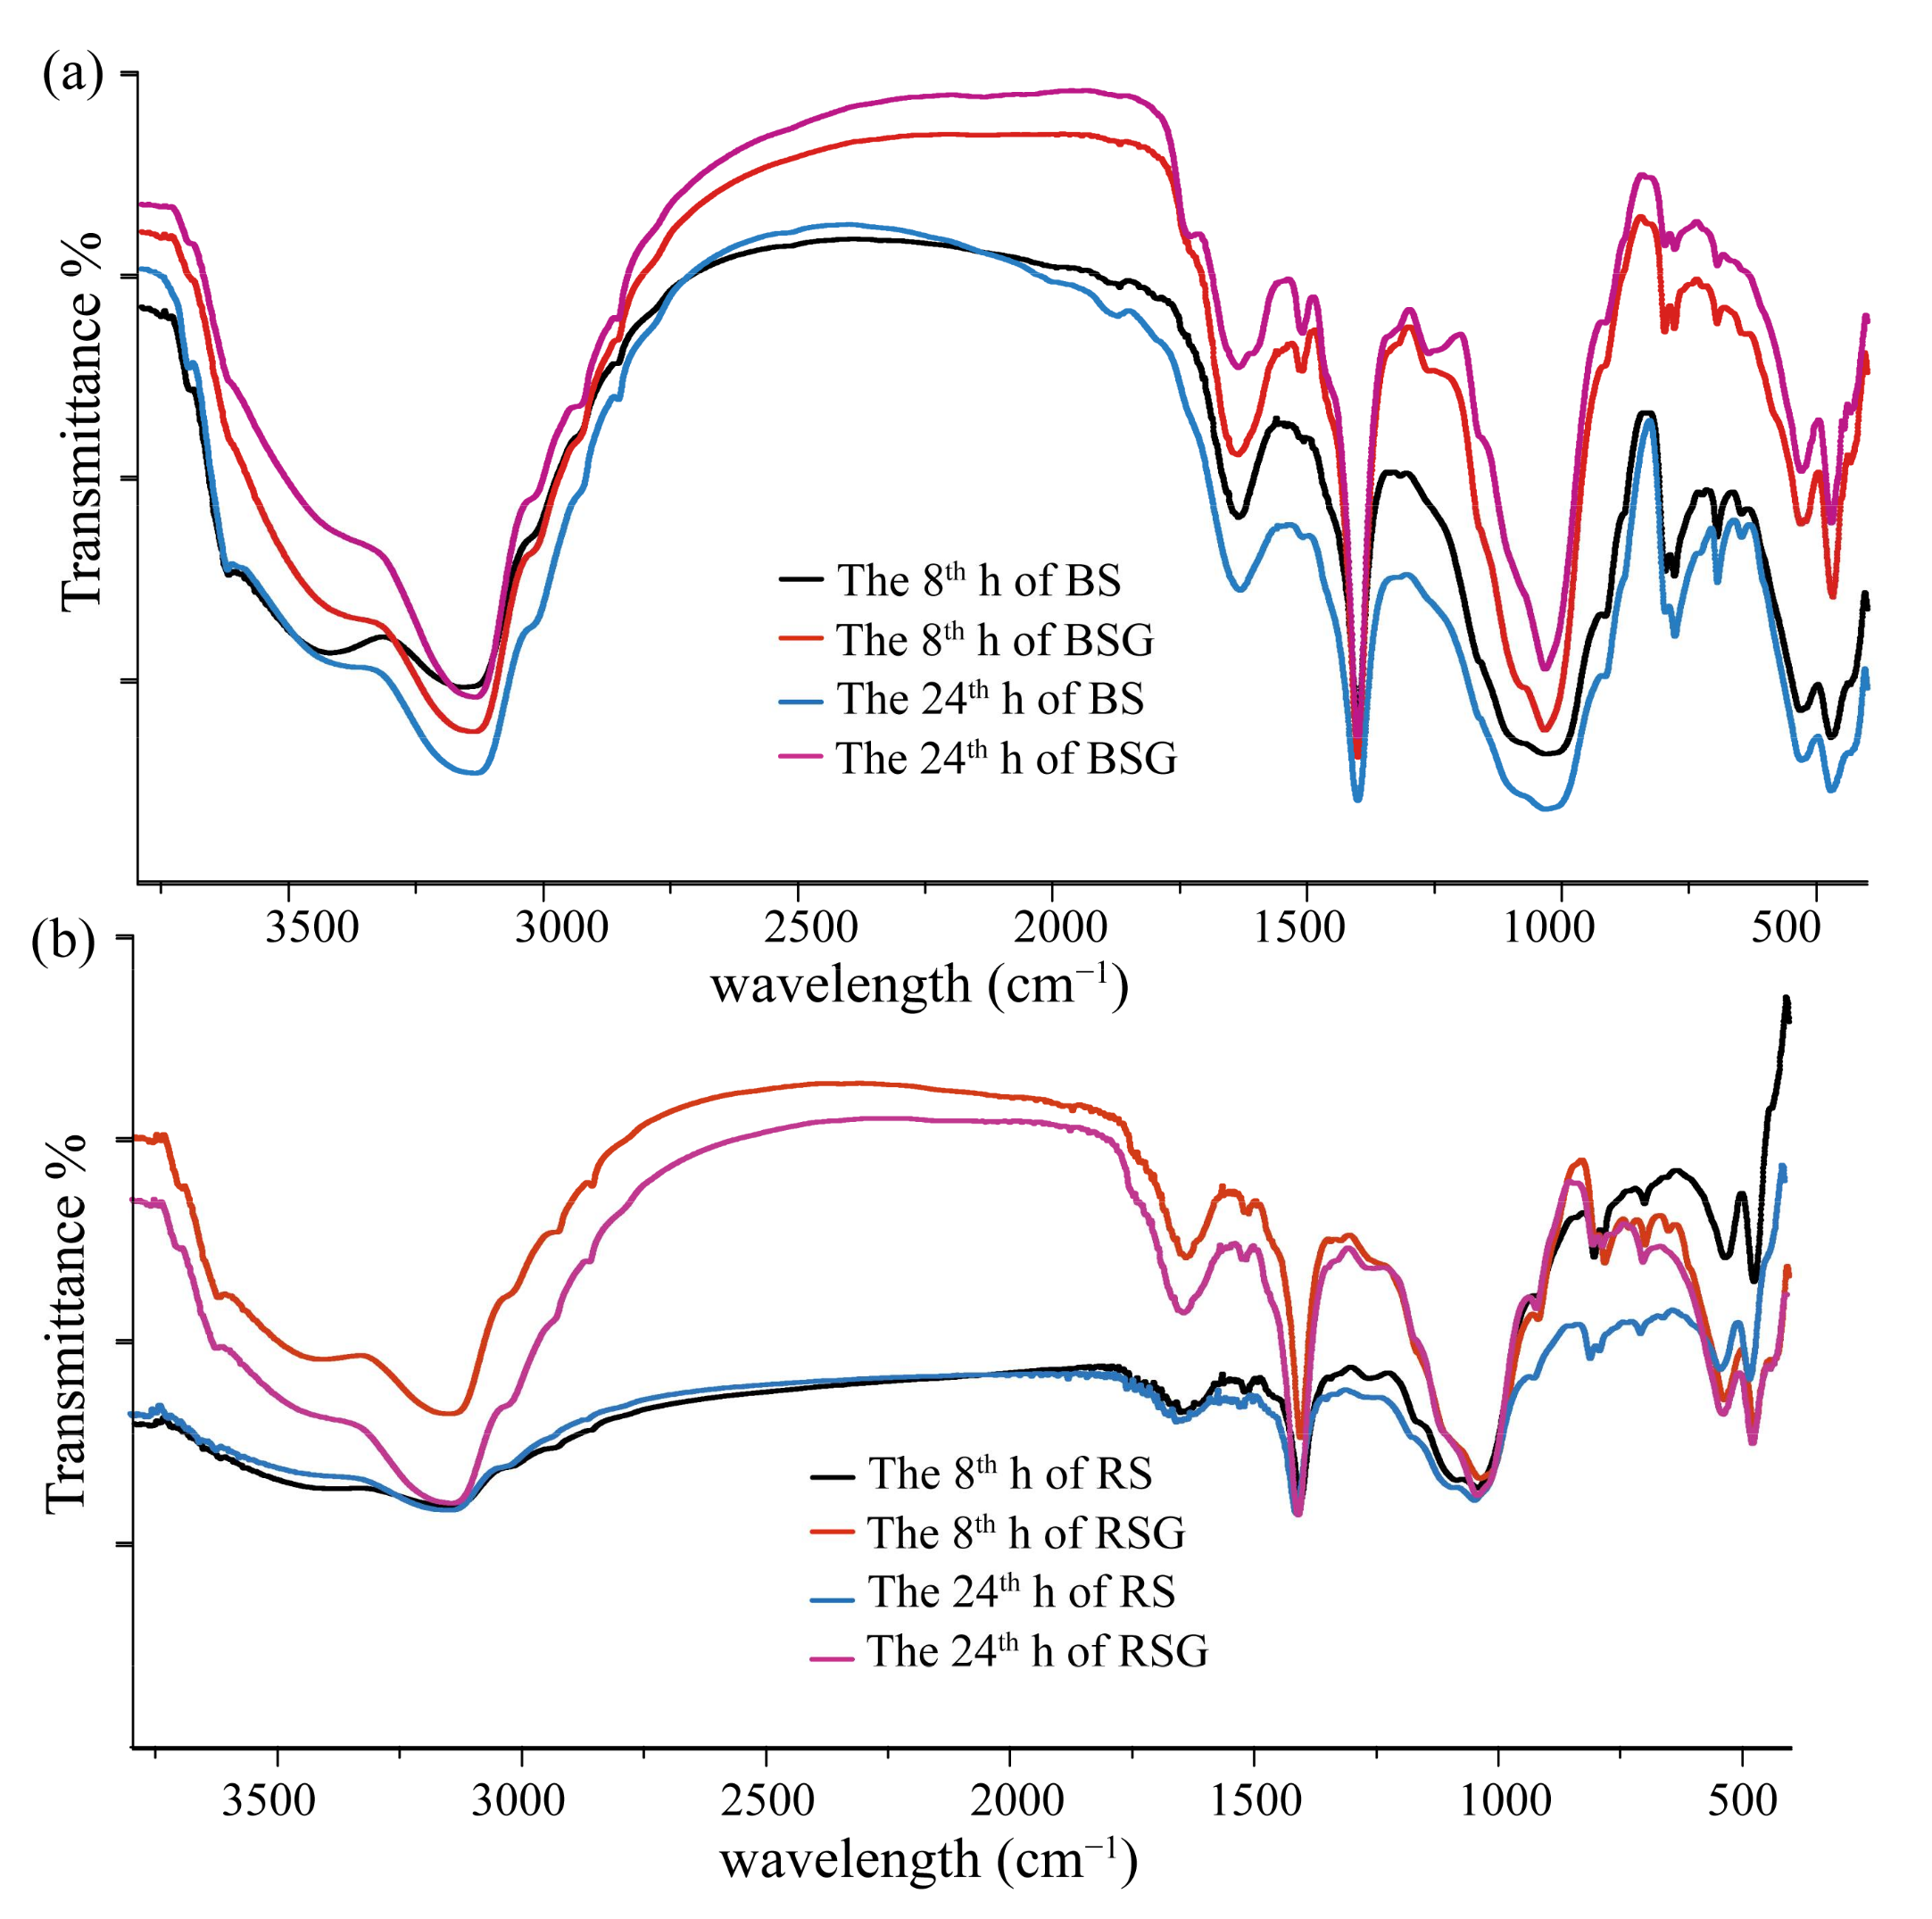
2.2.4. Spectroscopy Measurement of LFOM

To determine the complexity and instability of the LFOM composition, the Fourier-transform mid-infrared (FT-MIR) spectra of samples from the 8th and 24th hour were measured to reveal the differences and changes of the chemical bonds during the experiments. The LFOM was ground into powder and sieved through a 0.06 mm mesh, and each sample was mixed thoroughly and scanned twice. The average values of the spectra were calculated, and the transmittance was recorded. The FT-MIR reflectance was recorded at 1 nm interval range in the 400 to 4000 cm−1 regions using an FT-MIR spectrometer (TENSOR 37, BLUKER Ltd., Reichenau, Germany).

2.3. Statistical Analysis

The changing trends of glucose, LFOM, and HFOM in the four pots were analyzed and compared. Mean value analysis, one factor analysis of variance, cluster analysis, and Pearson correlation analysis were conducted on the carbon and nitrogen fractions. The diversity and abundance of cbbL gene-containing bacteria were estimated by alpha and beta diversity analysis, species composition analysis, correlation network analysis, principal component analysis (PCA), and function prediction. SPSS (version 21.0) and Canoco (version 4.5) were utilized for the statistical analysis, Origin Pro (version 9.0) was used for the drawing, and Adobe Illustrator (CS 6) was used for the figure design.

3. Results

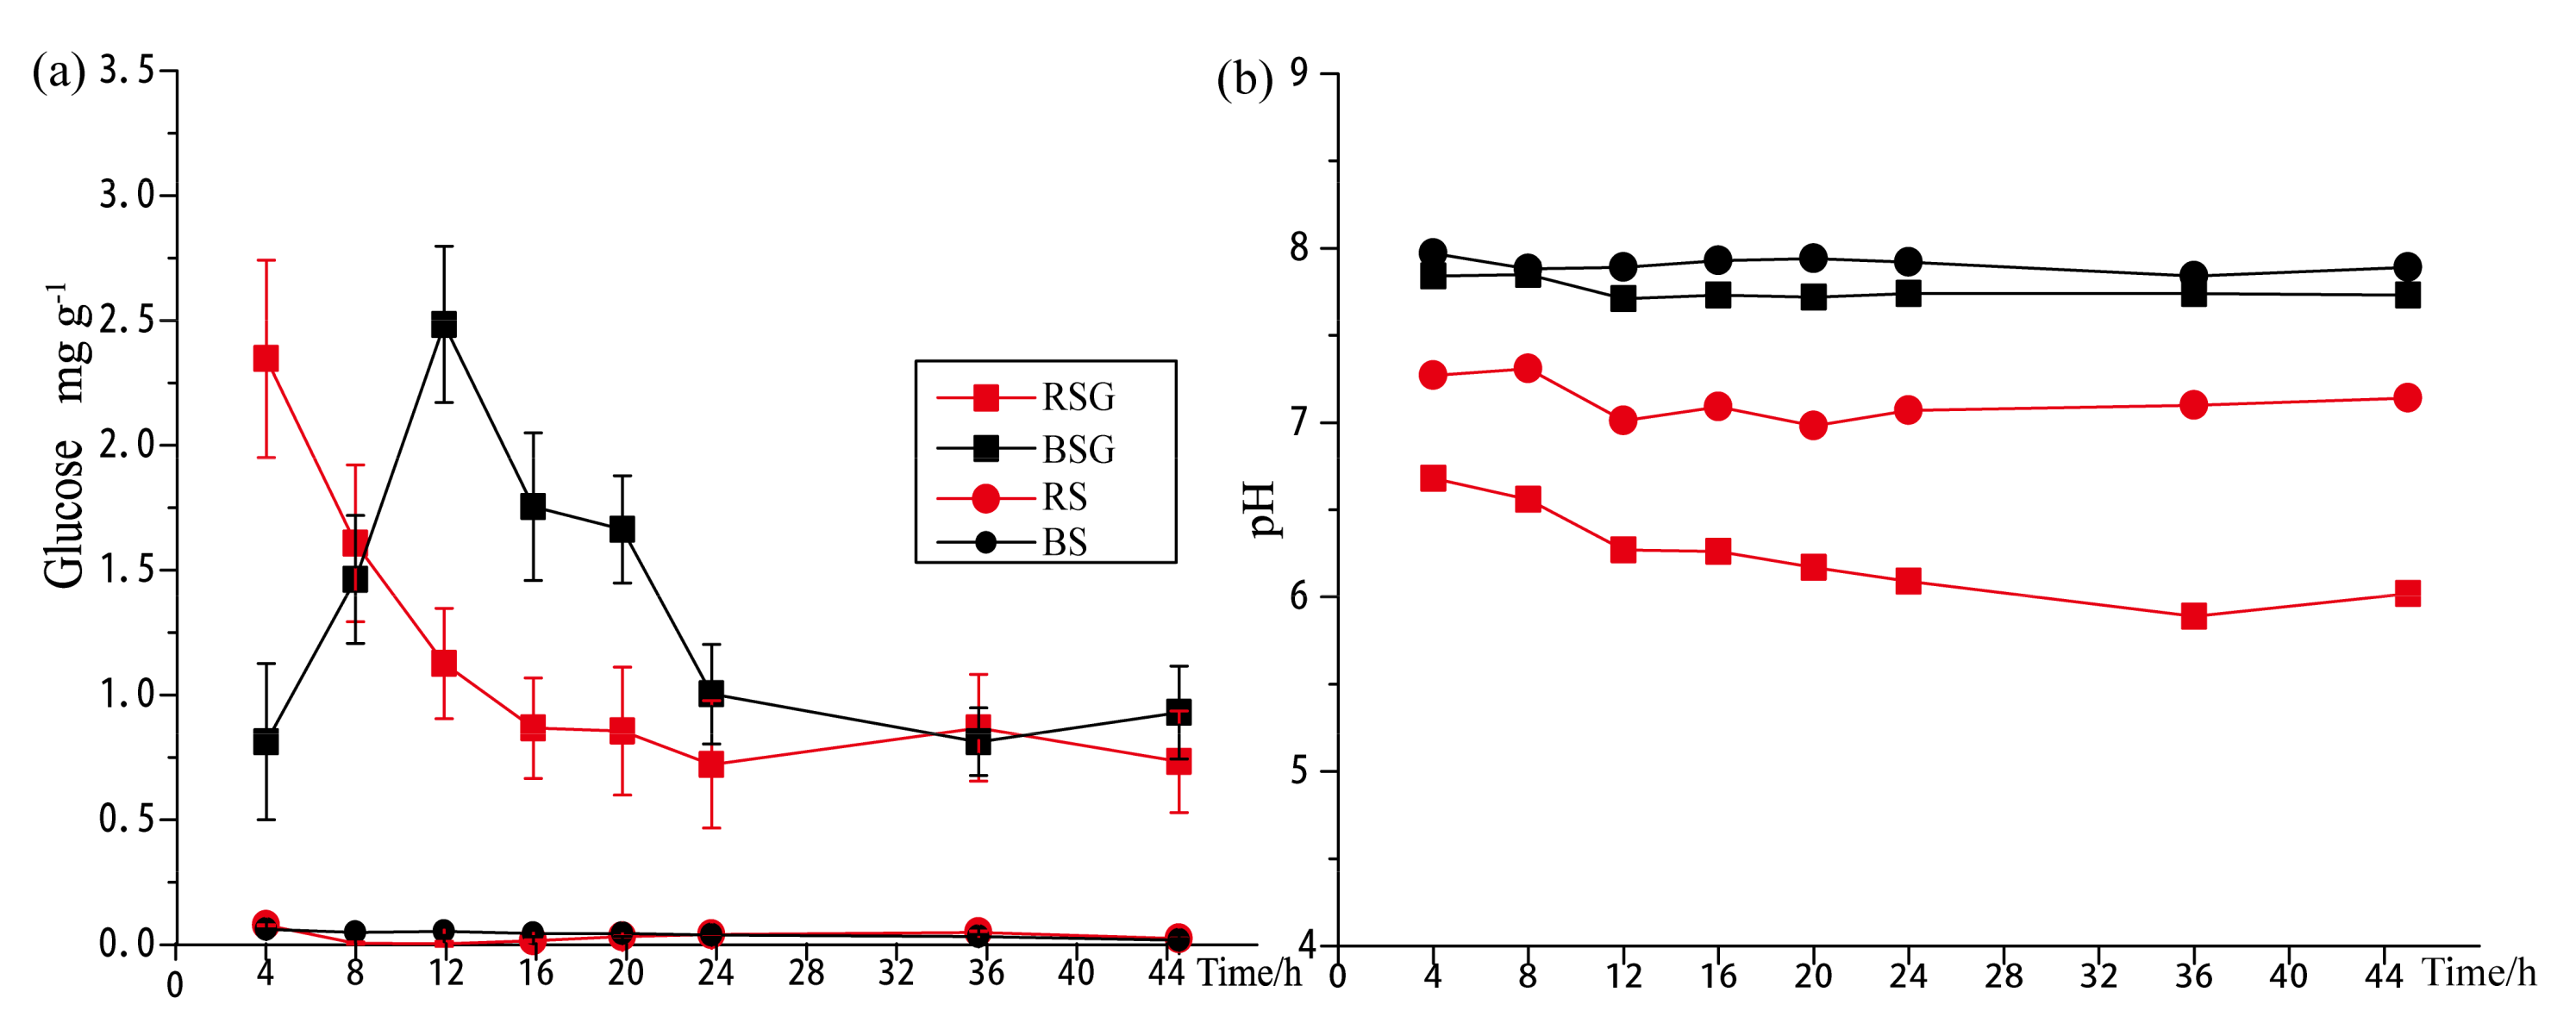
3.1. Glucose Degradation

The results showed that the glucose experienced the dynamic deposition and degradation process in the sediments of RSG and BSG, reaching the largest deposition of 2.35 and 2.48 mg·g−1 at the 4th h and 12th h, respectively, which may suggest that the glucose deposition in RSG was faster than in BSG (Figure 2a). The glucose became relatively steady after the 24th h, while it approached the minimum detectable quantity with no significant changes in the control group. Meanwhile, the pH values in the RS pots were lower than in the BS pots, indicating that rhizospheric sediments contain plenty of organic acids. The experimental group, with a decreasing trend of pH, showed significantly lower pH values (7.2) than the corresponding control group (7.52; α < 0.05; Figure 2b).

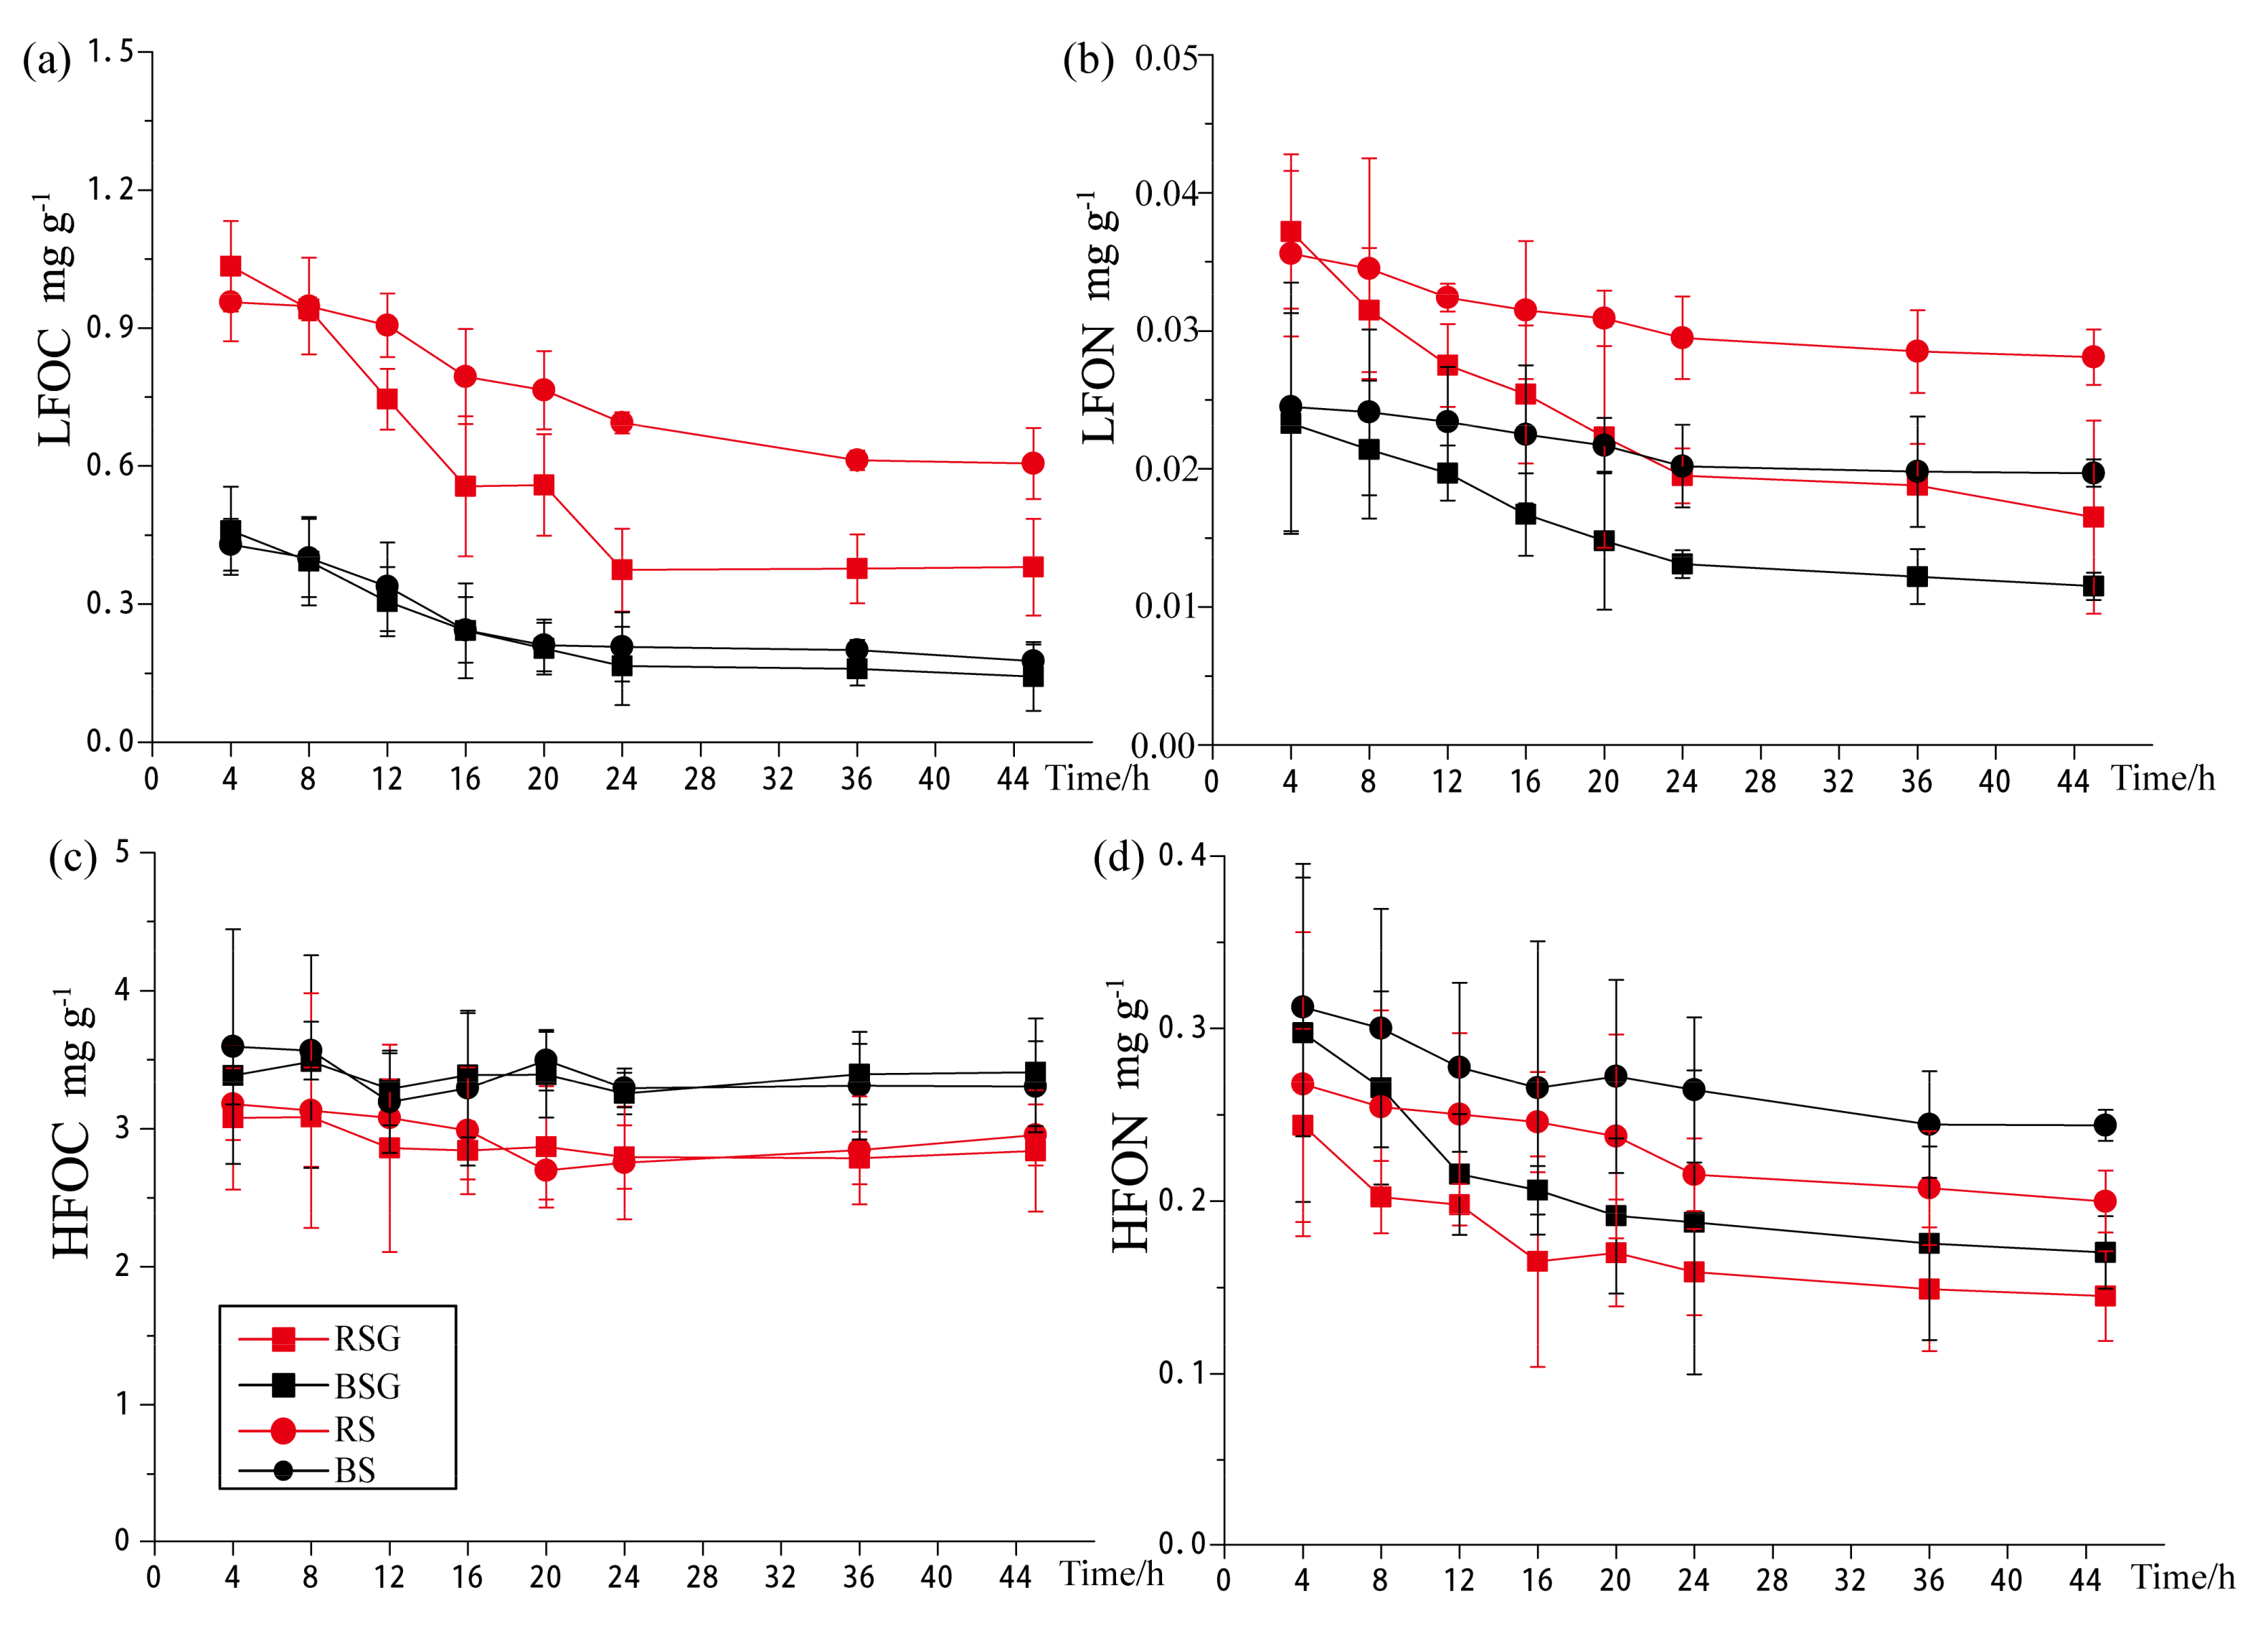
3.2. Changes of LFOM and HFOM

The mass fractions of LFOC and LFON presented increasing trends, while the mass of LFOM decreased sharply. As a result, the contents of LFOC and LFON presented decreasing trends in all of the pots (Figure 3a,b). The reduction rates of LFOC and LFON in the experimental group were higher than those in the control group, and RSG presented the largest reduction. The elimination of biological residues and pellets before the experiment probably amputated the dominant sources of light fractions, which resulted in the degradation and reduction in the four pots. The HFOC contents were higher in the BS pots than in the RS pots, indicating that the carbon fractions were animate and largely affected by microbes in the rhizospheric environment (Figure 3c). Meanwhile, HFOC showed no remarkable difference during the process, which suggest that glucose degradation did not affect the HFOC mineralization. The HFON indicated a coincident and decreasing trend during the process, with high values in the control group, but low contents in the corresponding experimental group (Figure 3d). In addition, the LFOC was negatively related to pH, while HFOC and HFON were positively related to pH (α < 0.01), indicating that pH is probably an important factor affecting the degradation and formation of C or N fractions. Moreover, LFOC was positively associated with LFON, but negatively related to HFOC, suggesting that LFOC and HFOC may have internal conversion.
Furthermore, to analyze the carbon chain and functional group changes of LFOM during the experiment, the spectral properties in the wavelength of the 400 to 4000 cm−1 regions of LFOM in the 8th and 24th hour were determined by Fourier-transform mid-infrared spectra. According to Lambert–Beer law, the mathematical expression is A = lg(1/T) (where A is the absorbance and T is the transmission ratio (transmittance)) [29]. The characteristic absorption peaks indicated the main chemical bonds and functional groups. The results showed that the spectral properties and shapes were very similar, and regular absorption peaks were mainly shown around 3150, 1646, 1400, 1038, 535, and 475 cm−1 in the four pots (Figure 4a,b). The differences of peak intensity in LFOM between the 8th h and 24th h samples indicated the chemical bond changes during the glucose degradation. The pseudo-absorbance (PA) of LFOM had no significant differences among the pots and few changes during the process. The PA of LFOM in RSG was mostly lower than that in RS at all wavelengths except for 535 and 475 cm−1. At the wavelength region above 1000 cm−1, the PA at the 24th h was higher than at the 8th h of RSG, while the result was found at wavelengths below 1000 cm−1 in the RS groups. For the BS and BSG pots, the PA in BS was higher than in BSG, especially at wavelengths below 1000 cm−1. The PA in the 8th h of BSG was higher than that at the 24th h, but the reverse was true for BS.

3.3. RubisCO Activity and Abundances Changes of cbbL Gene

The RubisCO activity exhibited an immediate reduction after the glucose addition, and then it gradually increased to reach a peak of 65.71 nmol·(g·min)−1 at the 24th h in RSG. The values decreased and then tended to stabilize in the other pots. The RubisCO activity in the RSG and RS pots reached similar values after glucose addition by the 45th h, which was very close to its original value in the RS; this finding was coincident in the BS and BSG pots (Figure 5a). On average, the RubisCO activity in RS was higher than in BS during the glucose degradation, indicating that the levels of cbbL-containing bacteria were higher in RS than in BS. Moreover, the mean values of the RubisCO activity between the experimental group and corresponding control group showed no significant difference. Pearson correlation analysis showed that the RubisCO activity was negatively and significantly associated with pH (p = −0.721), suggesting that the lower pH promoted the increase in RubisCO activity and CO2 fixation in RSG, BSG, and RS. In addition, the RubisCO activity was positively and significantly associated with LFOC (p = 0.707) and LFON (p = 0.593), which indicated the potential internal connections. Furthermore, curve estimation showed that cbbL gene abundance had a significant power function relationship with the RubisCO activity, with the largest R2 of 0.906. This finding suggested that the cbbL-containing bacteria dominated the potential of CO2 fixation (Figure 5b).

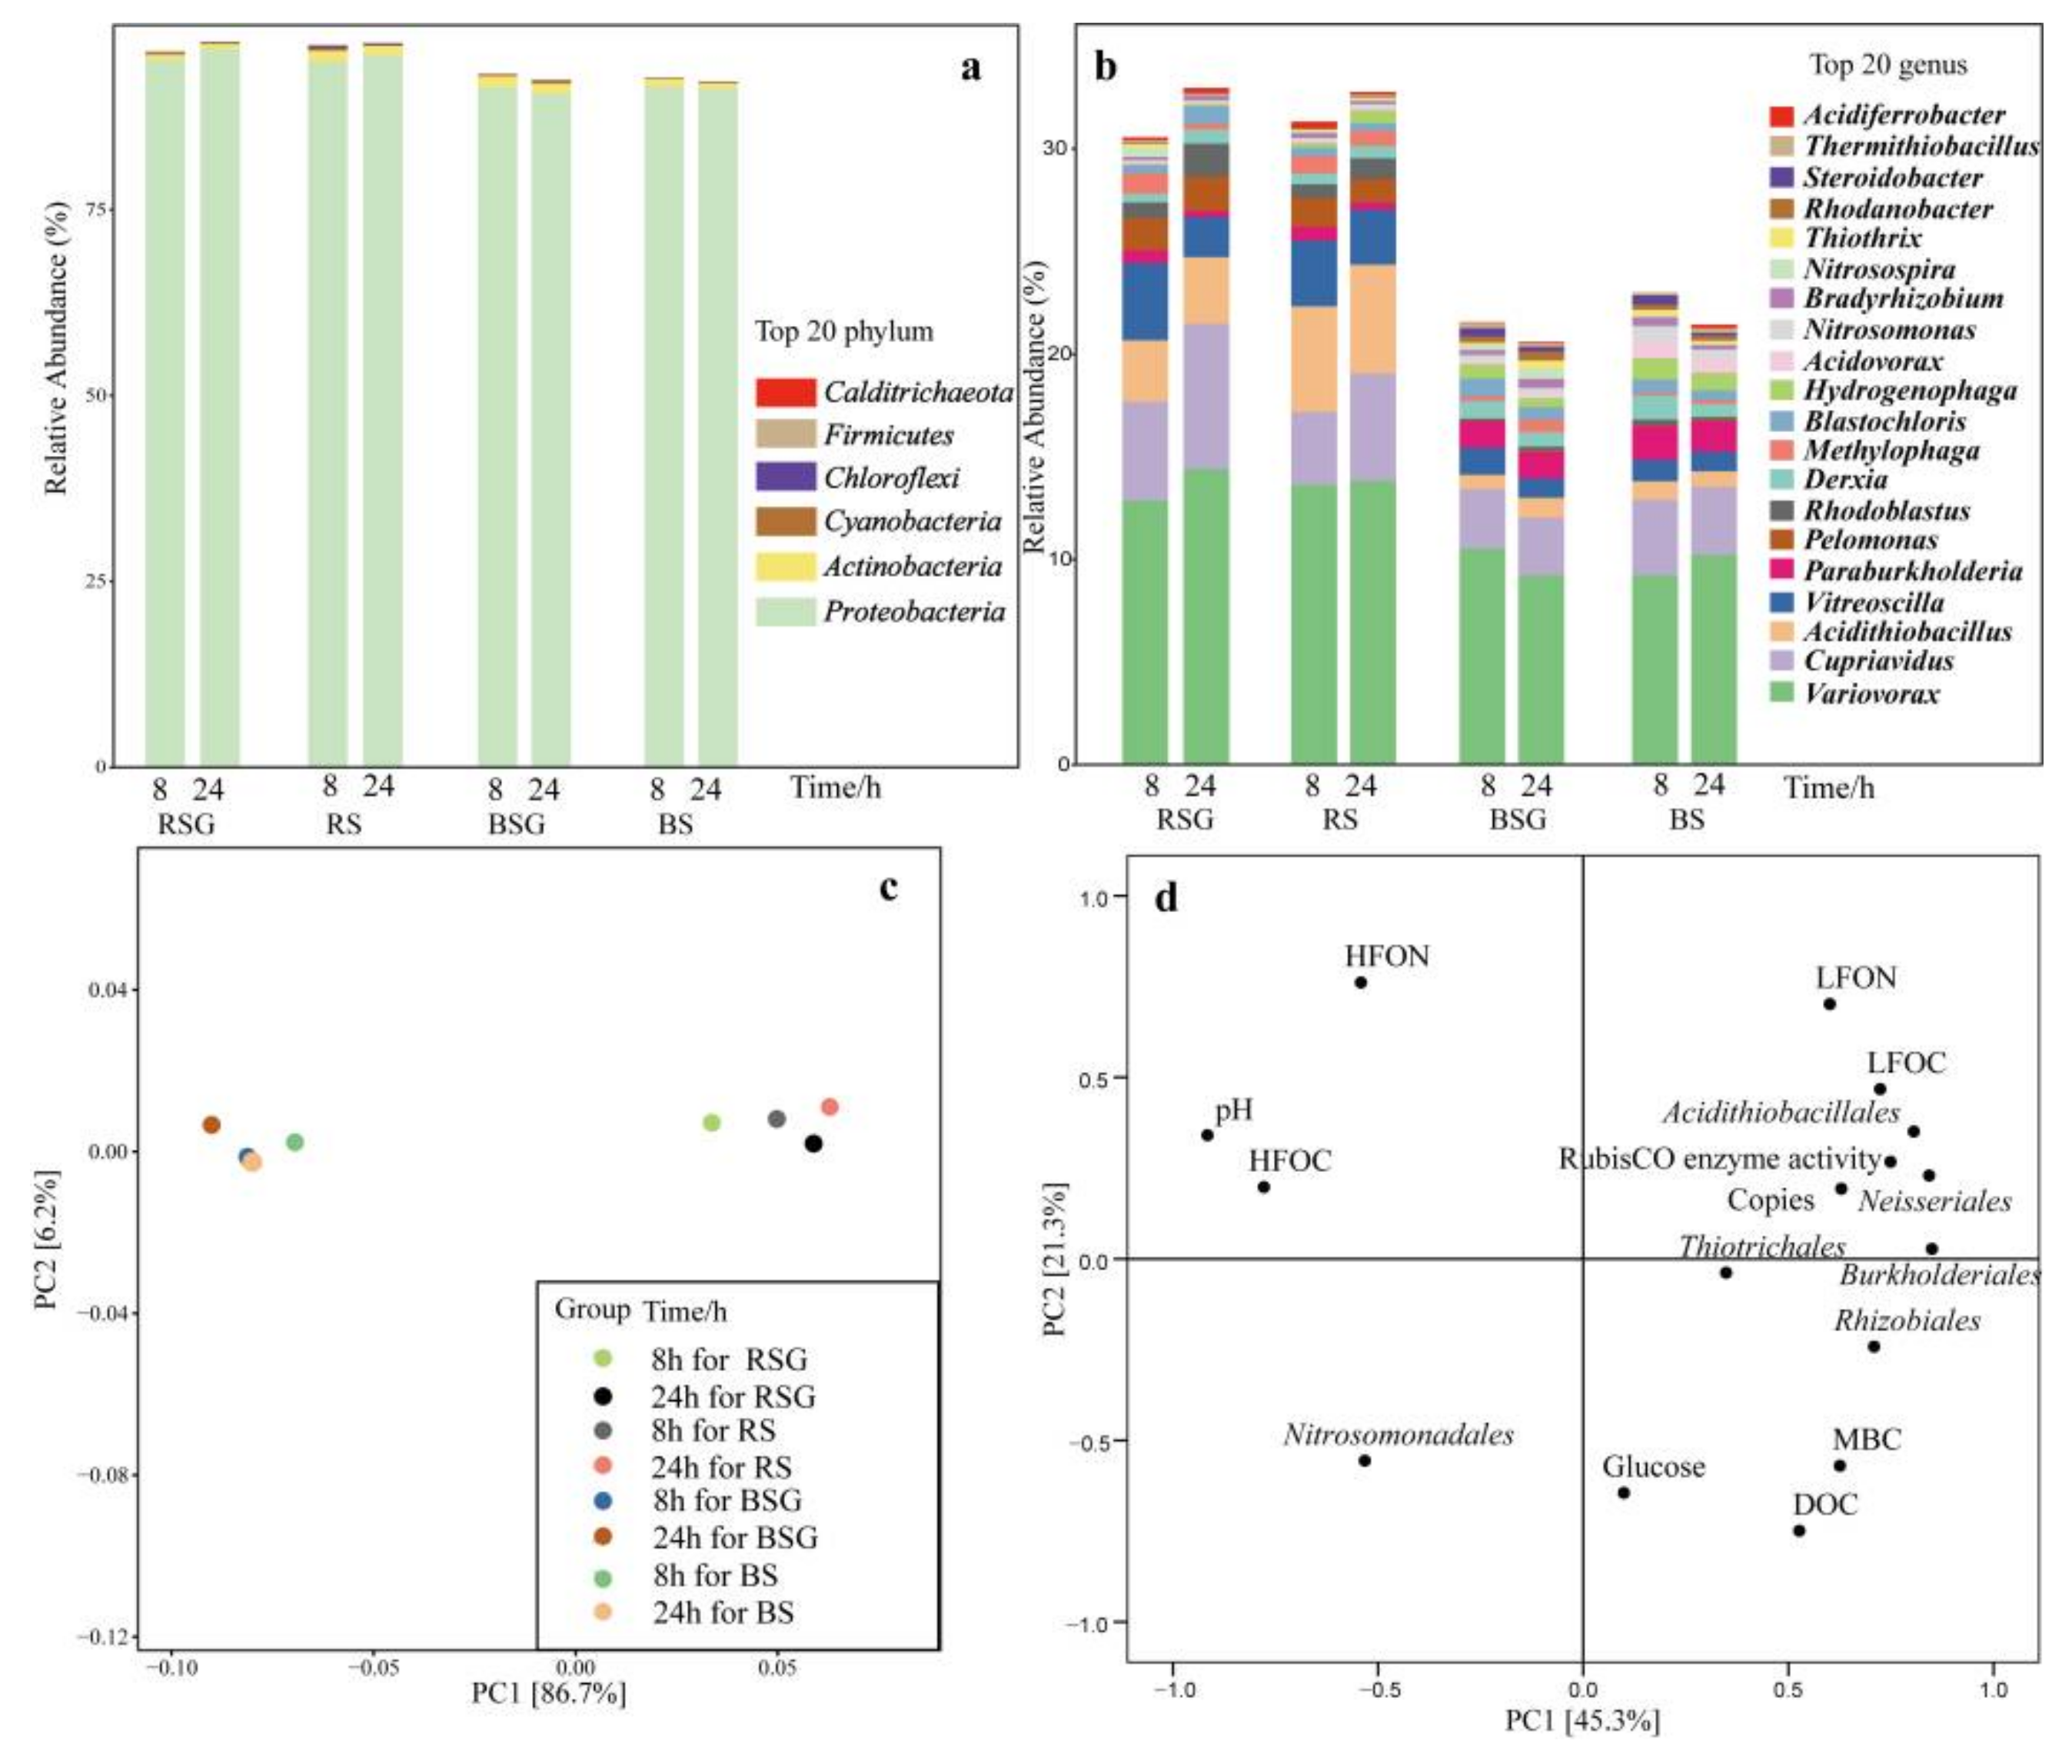
3.4. Composition and Changes of cbbL-Containing Bacteria

Proteobacteria was the dominant phyla among the cbbL-carrying bacteria, with mean values of 93.49% (Figure 6a). The proportions of β-, δ-, and α-Proteobacteria reached up to 43.71%, 27.00%, and 18.65% in class level, respectively, and Burkholderiales was the identified dominant order with a mean value of 37.74%. Orders of Rhizobiales (4.18%) and Nitrosomonadales (1.98%) were also very abundant. We found that the composition differences of the cbbL-containing bacteria between the rhizospheric sediments and bulk sediments were notably higher than those between sediments with and without glucose or those during the glucose degradation in levels of phyla to genus. The proportions of Proteobacteria in rhizospheric sediments (95.68%) was significantly higher than that in bulk sediments (91.30%) at the phylum level. Proteobacteria presented a slightly increased trend from the 8th h to 24th h in the RS and RSG pots, but gently decreased in the BS and BSG pots.
At the class level, Acidithiobacillia and β-proteobacteria were significantly higher in the rhizospheric sediments than in the bulk sediments, while α- and δ-proteobacteria were the opposite. In addition, β-proteobacteria showed a decreasing trend in the BS pots, but increased in the RS pots from the 8th h to 24th h, while δ-proteobacteria was the opposite. At the genus level, Acidithiobacillus, Cupriavidus, Variovorax, and Vitreoscilla were typical and dominant, with the proportions being notably or relatively higher in the RS pots than in the BS pots (Figure 6b). With respect to microbial changes during the experimental process, the RS groups and BS groups presented significantly different clusters, but not the result of glucose degradation (Figure 6c). The principal component analysis (PCA) suggested that the first two axes explained 66.6% of the distribution of the main microbial orders and soil properties, among which the variance of 45.3% was attributed to PC 1 (Figure 6d). In addition, the Pearson correlation analysis showed non-significant relations between all of the bacteria and glucose, but a significant association between pH and the dominant Proteobacteria (p = −0.900), which may suggest that the principal factor affecting the bacterial composition was pH, not the glucose content. Interestingly, the proportions of rhizobiales presented a notably opposite trend with an absorbance near 1600–1650 cm−1, and nitrosomonadales presented similar trend with an absorbance near 3150 cm−1; this finding may indicate that there were internal relations.

4. Discussion

4.1. Effects of Glucose Addition on OM Fractions

Wetlands are OC reservoirs, with a more stable carbon storage than farmland or other land types [35]. The addition of exogenous carbon would greatly affect the intensity of priming effects in wetlands, resulting in carbon mineralization [36]. A thorough understanding of this effect on OC dynamics is helpful in order to take corresponding measures in advance to improve the stability of wetland carbon storage [37,38]. Most previous studies focused on the dynamic responses of CO2 emission and SOC-derived carbon mineralization on exogenous carbon addition [7,18], but few studies revealed its dynamic effects on the content of carbon fractions or on the abundance and composition of cbbL gene-coded bacteria. Glucose is one typical exogenous carbon and is a direct nutrient and substrate for microbial activities [39,40]. For example, the addition of glucose to wetlands can significantly change the structures and activities of the bacterial communities dynamically, which affects the element cycle, especially the carbon and nitrogen cycle [41,42,43]. Numerous previous studies have been conducted on the response of wetlands to glucose addition, which provided a theoretical basis for the development of this study [44,45].
After the addition of glucose, the highest glucose deposition at the 12th and 4th h of the experimental group indicated the different deposition speeds of glucose in rhizospheric and bulk sediments. Krumböck et al. (1991) suggested that paddy soil had significantly higher glucose deposition and degradation speeds than bulk lake sediment [46]. Dunham-Cheatham et al. (2020) also reported that anaerobic and aerobic soil conditions affected the glucose degradation [47]. Thus, sediment physical properties and microbial activities were probably the dominant factors. Previous studies reported that LFOM was composed of partially decomposed and undecomposed biological residues, the main components of which were cellulose, hemicellulose, and lignin [48,49,50]. The high contents of LFOC and LFON in RS indicated the large contribution of P. australis and rhizospheric microorganisms. Chowdhury et al. (2014) showed that stubble addition can increase the CO2 emission [43], and Zhang et al. (2021) indicated that glucose addition promoted the mineralization of native OC [51], identifying that the rapid decrease of LFOM and degraded glucose were the dominant sources of C mineralization in this study. As a whole, the contents of LFOC decreased by 171.70% and 221.55% in the RSG pot and BSG pot, respectively.
The transmittance and pseudo-absorbance of Fourier-transform mid-infrared spectra (400–4000 cm−1) indicated the changes of the typical chemical bonds and functional groups of LFOM during the glucose degradation process. As previous studies showed, the wide absorption peaks around 3150 cm−1 indicated the abundance of C–H stretch [50]. The absorption peaks of the 1600–1650 cm−1 region indicated the presence of aromatic structures and C=C stretch [52,53]. Absorbance near 1038 cm−1 suggested the ester, phenol C–O–C and C–OH stretch [54,55]. The control group showed higher PA than the experimental group, which was in accordance with the high contents of LFOC and LFON in the control groups, suggesting the stable chemical structures of LFOM during the process. The higher PA at the 24th h of RSG indicated the abundant N–H, C–H, and C=C stretch, which suggested that glucose degradation promoted the formation of a carbon or nitrogen-based single chemical bond. The PA at the 24th h of RS exhibited high contents of C–C=O stretch, indicating the synthesis of certain unstable chemical bonds. Tian et al. (2019) reported that microorganisms preferentially utilize exogenous glucose instead of intrinsic SOC [56]. The lower PA of BSG at the 24th h than at the 8th h illustrated that LFOM degradation was becoming the major source of microbiological deterioration when most of the glucose was decomposed. The above-mentioned findings showed different changes of typical chemical bonds between RSG and BSG during the process, which further indicated irregular and inconsistent mineralization activities.

4.2. Effects of Glucose Addition on RubisCO Activity and cbbL-Containing Bacteria

The soil RubisCO activity differed significantly among the land types [23]. Its higher values in the RS and RSG pots than in the BS or BSG pots suggested higher C assimilation potential, similar to the reports of Wu et al. (2014), who presented higher RubisCO activity in paddy soils than that in upland soils [25]. The significant effect of glucose addition indicated that the responses of cbbL-containing bacteria and RubisCO activity were instantaneous. The reduced RubisCO activities after the glucose addition in RS, BS, and BSG suggested the lessened abundance of autotrophs, while the similar values at the 45th h of RSG and RS and that of BSG and BS may demonstrate that the effect of glucose degradation was flexible and restorable. Yuan et al. (2012) showed that the RubisCO activity increased when rice straw was returned to field, and this study also found extremely significant relations among LFOC, LFON, and RubisCO activity [32]. LFOM probably provides substrate for the production of ribulose-1,5-biphosphate, thus enhancing the RubisCO activities as well as the C-fixation efficiency. The significant power function relationship between RubisCO activities and cbbL gene abundance (p = 0.889, R2 = 0.906) suggested that RubisCO came mostly from the expression of the cbbL gene. Han et al. (2001) showed that RubisCO activities were easily affected by light, temperature, humidity, CO2 concentration, and pH, among which RubisCO activities were high in a relatively alkaline environment [56]. Our results showed a high number of cbbL gene copies in a faintly acid environment, which was consistent with the results of Yuan et al. [23]. The cbbL gene abundance in the wetland pots of this study was significantly higher than for both unplanted soils and paddy rice–upland crop rotation soils, but lower than paddy soils [32].
Although the microbial composition and abundance were sensitive to temperature, moisture, pH, OC content, etc. [57,58], we found that the effects of soil property and surroundings on cbbL-containing bacteria were negligible in contrast to the effects of root functions. RS and BS showed significantly different compositions of cbbL-containing bacteria. Wu et al. (2014) found that Mycobacterium sp., Rhodopseudomonas palustris, and Bradyrhizobium japonicum were the dominant species of cbbL-containing bacteria, and we found that Rhizobiales was greatly expressed in this study [25]. As the decomposer of polysaccharide [59], Burkholderiales was also abundant in the cbbL-containing bacteria. The significant relationships between the absorbance of certain regions and cbbL-containing bacteria or between organic matter and the bacteria may indicate the diverse microbial functions. Further research on the metabolic relationship between cbbL-containing bacteria and organic matter fractions is still needed.

5. Conclusions

For organic matter fractions, RubisCO activity, and cbbL-containing bacteria, the dynamic responses to glucose addition were expounded and the response mechanism was explored in the wetland pots. We found that the LFOC, LFON, and HFON contents were largely reduced, and pH values were also significantly decreased in experimental group compared with the control group. The results of FT-MIR on LFOM indicated irregular carbon mineralization between RSG and BSG. Based on the RubisCO activities and composition of cbbL-containing bacteria, this indicated that the effects of glucose degradation on RubisCO activity and cbbL-containing bacteria were transient, but the effects on organic matter fractions were straightforward, and probably further change the bacterial abundance and composition. This study provides a theoretical basis for revealing the response of wetland carbon cycle to exogenous carbon addition.

Author Contributions

Conceptualization, Q.C. and H.X.; methodology, B.L.; software, J.W.; validation, W.M. and H.X.; formal analysis, B.L.; investigation, Q.C.; data curation, Q.C.; writing—original draft preparation, Q.C. and H.X.; writing—review and editing, Q.C. and W.M.; visualization, J.W.; supervision, H.X.; funding acquisition, Q.C. All authors have read and agreed to the published version of the manuscript.

Funding

This work was supported by the Natural Science Foundation of Shandong Province, China (ZR2020QC041), and the Science Foundation of Shandong Jianzhu University (Grant No. X18047ZX).

Institutional Review Board Statement

Not applicable.

Informed Consent Statement

Not applicable.

Data Availability Statement

The data of bacterial sequences was uploaded in NCBI with the serial number of PRJNA888238.

Conflicts of Interest

The authors declare no conflict of interest.

References

  1. Zhang, Y.; Meng, X.W.; Bai, Y.Z.; Wang, X.Q.; Xia, P.; Yang, G.; Zhu, Z.W.; Zhang, H. Sources and features of particulate organic matter in tropical small mountainous rivers (SW China) under the effects of anthropogenic activities. Ecol. Indic. 2021, 125, 107471. [Google Scholar] [CrossRef]
  2. Rochera, C.; Picazo, A.; Murueta, N.; Camacho, A. In situ bioremediation techniques to reduce total organic matter oversaturation of fluvial sediments: An experimental study. Appl. Sci. 2020, 10, 4308. [Google Scholar] [CrossRef]
  3. Aguinaga, O.E.; White, K.N.; Dean, A.P.; Pittman, J.K. Addition of organic acids to acid mine drainage polluted wetland sediment leads to microbial community structure and functional changes and improved water quality. Environ. Pollut. 2021, 290, 118064. [Google Scholar] [CrossRef] [PubMed]
  4. Peng, S.I.; Shao, W.; Hui-Li, Y.U.; Qiao, X.S.; Yang, X.J.; Gao, D.T.; Wang, Z.Q. Response of microbial communities and enzyme activities to soil amendment with low-molecular-weight organic substances. Soil Fertilizer Sci. China 2019, 2, 75–82. [Google Scholar]
  5. Wang, Y.; Jiapeng, W.U.; Guan, F.; Xiang, H.E.; Jiao, L.; Hong, Y. Controls of organic matters on denitrification and anammox in sediments of pearl river estuary by mesocosm experiments. Ecol. Sci. 2018, 37, 27–34. [Google Scholar]
  6. Sakagami, N.; Shiotsu, F.; Asagi, N.; Nitta, M.K.; Suprapta, D.N. The carbon degradation of paddy soil under organic and conventional farming in bali, indonesia as measured by sequential loss on ignition. Trop. Agric. Dev. 2019, 63, 30–33. [Google Scholar]
  7. Han, W.; Chang, J.; Scott, X.; Fan, X.; Zhang, Y. Plant species diversity impacts nitrogen removal and nitrous oxide emissions as much as carbon addition in constructed wetland microcosms. Ecol. Eng. J. Ecotechnol. 2016, 93, 144–151. [Google Scholar] [CrossRef] [Green Version]
  8. Graham, E.B.; Gabor, R.S.; Schooler, S.; McKnight, D.M.; Nemergut, D.R.; Knelman, J.E. Oligotrophic wetland sediments susceptible to shifts in microbiomes and mercury cycling with dissolved organic matter addition. PeerJ 2018, 6, e4575. [Google Scholar] [CrossRef] [PubMed] [Green Version]
  9. Chen, Q.; Yuan, Y.; Hu, Y.; Wang, J.; Si, G.; Xu, R.; Zhou, J.; Xi, C.; Hu, A.; Zhang, G. Excessive nitrogen addition accelerates N assimilation and P utilization by enhancing organic carbon decomposition in a Tibetan alpine steppe. Sci. Total Environ. 2021, 764, 142848. [Google Scholar] [CrossRef]
  10. Ouyang, Y.; Evans, S.E.; Friesen, M.L.; Tiemann, L.K. Effect of nitrogen fertilization on the abundance of nitrogen cycling genes in agricultural soils: A meta-analysis of field studies. Soil Biol. Biochem. 2018, 127, 71–78. [Google Scholar] [CrossRef]
  11. Bonetti, G.; Limpert, K.E.; Brodersen, K.E.; Trevathan-Tackett, S.M.; Carnell, P.E.; Mareadie, P.I. The combined effect of short-term hydrological and N-fertilization manipulation of wetlands on CO2, CH4, and N2O emissions. Environ. Pollut. 2022, 294, 118637. [Google Scholar] [CrossRef] [PubMed]
  12. Hu, X.; Gu, H.; Liu, J.; Wei, D.; Zhu, P.; Cui, X.; Zhou, B.; Chen, X.; Jin, J.; Liu, X.; et al. Metagenomics reveals divergent functional profiles of soil carbon and nitrogen cycling under long-term addition of chemical and organic fertilizers in the black soil region. Geoderma 2022, 418, 115846. [Google Scholar] [CrossRef]
  13. Jia, J.X.; Li, Z.P.; Che, Y.P. Effects of glucose addition on nitrogen transformation in black soils different in organic carbon content. Acta Pedol. Sin. 2011, 48, 207–211. [Google Scholar]
  14. Hu, X.; Yin, P.; Nong, X.; Liao, J.H. Effect of exogenous carbon addition and the freeze-thaw cycle on soil microbes and mineral nitrogen pools1. IOP Conf. Ser. Earth Environ. Sci. 2018, 108, 032046. [Google Scholar] [CrossRef]
  15. Bürgmann, H.; Meier, S.; Bunge, M.; Widmer, F.; Zeyer, J. Effect of model root exudates on structure and activity of a soil diazotroph community. Environ. Microbiol. 2005, 7, 1711–1724. [Google Scholar] [CrossRef]
  16. Yang, S.H.; Sun, X.; Ding, J.; Jiang, Z.W.; Xu, J.Z. Effects of biochar addition on the NEE and soil organic carbon content of paddy fields under water-saving irrigation. Environ. Sci. Pollut. R. 2019, 26, 8303–8311. [Google Scholar] [CrossRef]
  17. Zieger, A.; Kaiser, K.; Guayasamín, P.R.; Kaupenjohann, M. Massive carbon addition to an organic-rich andosol increased the subsoil but not the topsoil carbon stock. Biogeosciences 2018, 15, 2743–2760. [Google Scholar] [CrossRef] [Green Version]
  18. Wang, Q.; Zeng, Z.Q.; Zhong, M.C. Soil moisture alters the response of soil organic carbon mineralization to litter addition. Ecosystems 2016, 19, 450–460. [Google Scholar] [CrossRef]
  19. Aye, N.S.; Butterly, C.R.; Sale, P.W.G.; Tang, C. Residue addition and liming history interactively enhance mineralization of native organic carbon in acid soils. Biol. Fert. Soils 2017, 53, 61–75. [Google Scholar] [CrossRef]
  20. Ma, A.; Zhang, J.; Liu, G.; Zhuang, X.; Zhuang, G. Cryosphere microbiome biobanks for mountain glaciers in China. Sustainability 2022, 14, 2903. [Google Scholar] [CrossRef]
  21. Pu, X.; Han, Y. Promotion of carbon dioxide biofixation through metabolic and enzyme engineering. Catalysts 2022, 12, 399. [Google Scholar] [CrossRef]
  22. Kusian, B.; Bowien, B. Operator binding of the CbbR protein, which activates the duplicate cbb CO2 assimilation operons of Alcaligenes eutrophus. J. Bacteriol. 1995, 177, 6568–6574. [Google Scholar] [CrossRef] [PubMed] [Green Version]
  23. Yuan, H.Z.; Ge, T.D.; Zou, S.Y.; Wu, X.H.; Liu, S.L.; Zhou, P. Effect of land use on the abundance and diversity of autotrophic bacteria as measured by ribulose-1,5-biphosphate carboxylase/oxygenase (RubisCO) large subunit gene abundance in soils. Biol. Fert. Soils 2013, 49, 609–616. [Google Scholar] [CrossRef]
  24. Cao, X.B.; Lin, D.; Cai, L.; Jiang, Y.M.; Zhu, D. Effects of different vegetation communities on soil carbon fraction, rubisco activity and cbbl genes in Nanjishan wetland of poyang lake. Acta Pedol. Sin. 2017, 54, 1269–1279. [Google Scholar]
  25. Wu, X.H.; Ge, T.D.; Yuan, H.Z.; Li, B.Z.; Zhu, H.H.; Zhou, P. Changes in bacterial CO2 fixation with depth in agricultural soils. Appl. Microbiol. Biot. 2014, 98, 2309–2319. [Google Scholar] [CrossRef]
  26. Rui, Y.C.; Murphy, D.V.; Wang, X.L.; Hoyle, F.C. Microbial respiration, but not biomass, responded linearly to increasing light fraction organic matter input: Consequences for carbon sequestration. Sci. Rep. UK 2016, 6, 35496. [Google Scholar] [CrossRef] [Green Version]
  27. Song, X.D.; Fan, Y.; Bing, J.; Li, D.C.; Zhao, Y.G.; Yang, J.L.; Zhang, G.L. The influence of the conversion of grassland to cropland on changes in soil organic carbon and total nitrogen stocks in the Songnen Plain of Northeast China. Catena 2018, 171, 588–601. [Google Scholar] [CrossRef]
  28. Tan, Z.; Lal, R.; Owens, L.; Izaurralde, R.C. Distribution of light and heavy fractions of soil organic carbon as related to land use and tillage practice. Soil Till. Res. 2007, 92, 53–59. [Google Scholar] [CrossRef]
  29. Fang, J.; Dong, J.; Li, C.; Chen, H.; Wang, L.; Lyu, T.; He, H.; Liu, J. Response of microbial community composition and function to emergent plant rhizosphere of a constructed wetland in northern China. Appl. Soil Ecol. 2021, 385, 114884. [Google Scholar] [CrossRef]
  30. Ye, C.; Guo, Z.L.; Cai, C.F.; Wang, J.G.; Deng, J. Effect of water content, bulk density, and aggregate size on mechanical characteristics of Aquults soil blocks and aggregates from subtropical China. J. Soil Sediment. 2017, 17, 210–219. [Google Scholar] [CrossRef]
  31. Dong, J.Y.; Quan, Q.; Zhao, D.; Li, C.C.; Zhang, C.; Chen, H.; Fang, J.F.; Wang, L.F.; Liu, J. A combined method for the source apportionment of sediment organic carbon in rivers. Sci. Total Environ. 2021, 752, 141840. [Google Scholar] [CrossRef] [PubMed]
  32. Yuan, H.Z.; Ge, T.D.; Wu, X.L.; Liu, S.L.; Tong, C.L.; Qin, H.L.; Wu, M.N.; Wei, W.X.; Wu, J.S. Long-term field fertilization alters the diversity of autotrophic bacteria based on the ribulose-1,5-biphosphate carboxylase/oxygenase (RubisCO) large-subunit genes in paddy soil. Appl. Microbiol. Biot. 2012, 95, 1061–1071. [Google Scholar] [CrossRef]
  33. Walker, R.; Walker, R. Trust between primary health care organizations. Health Promot. J. Aust. 2001, 11, 43–47. [Google Scholar]
  34. Feng, M.; Xu, L.; Gao, M.; Jiao, Y.; Wei, X.; Jin, L.; Cheng, S.; Li, X.; Feng, S. Optical Properties Research of Bacillus Subtilis Spores by Fourier Transform Infrared Spectroscopy. Spectrosc. Spect. Anal. 2012, 32, 3193–3196. [Google Scholar]
  35. Jiang, H.H.; Sun, Z.G.; Wang, L.L.; Sun, W.L.; Sun, W.G.; Song, H.L. A preliminary study on methane production potential of soil in tidal wetlands of the yellow river estuary and its responses to organic matter and nitrogen import. Wetland Sci. 2012, 10, 451–458. [Google Scholar]
  36. Wei, Y.; Cui, L.; Zhang, M.; Liu, W.; Wang, D.; Yang, S.; Xiao, H. Effects of exogenous carbon input on soil organic carbon mineralization and temperature sensitivity of cropland and wetland in the North China Plain. Chinese J. Eco-Agri. 2019, 27, 1463–1471. [Google Scholar]
  37. Chuks, C.A.; Solomon, B.A.; Olisa, O. Response of Sarotherodon Melanotheron Rüppell (1852) in the Niger Delta wetland, Nigeria to changes in pH. Rev. Científica UDO Agrícola 2008, 8, 143–153. [Google Scholar]
  38. Chen, Z.; Lee, S.Y. Contribution of microplastics to carbon storage in coastal wetland sediments. Environ. Sci. Technol. Lett. 2021, 8, 1045–1050. [Google Scholar] [CrossRef]
  39. Sawada, K.; Funakawa, S.; Kosaki, T. Soil microorganisms have a threshold concentration of glucose to in-crease the ratio of respiration to assimilation. Soil Sci. Plant Nutr. 2008, 54, 216–223. [Google Scholar] [CrossRef]
  40. Islam, M.R.; Singh, B.; Dijkstra, F.A. Microbial carbon use efficiency of glucose varies with soil clay content: A meta-analysis. Appl. Soil Ecol. 2023, 181, 104636. [Google Scholar] [CrossRef]
  41. Apek, P.; Choma, M.; Tahovská, K.; Kaňa, J.; Antrková, H. Coupling the resource stoichiometry and microbial biomass turnover to predict nutrient mineralization and immobilization in soil. Geoderma 2021, 385, 114884. [Google Scholar]
  42. Chuckran, P.F.; Fofanov, V.; Hungate, B.A.; Morrissey, E.M.; Schwartz, E.; Walkup, J.; Dijkstra, P. Rapid response of nitrogen cycling gene transcription to labile carbon amendments in a soil microbial community. mSystems 2021, 6, 1–15. [Google Scholar] [CrossRef]
  43. Zhao, Y.H.; Wang, N.; Yu, M.K.; Yu, J.G.; Xue, L.H. Rhizosphere and straw return interactively shape rhizosphere bacterial community composition and nitrogen cycling in paddy soil. Front. Microbiol. 2022, 13, 945927. [Google Scholar] [CrossRef]
  44. Zhu, B.; Bimueller, C.; Porras, R.; Curtis, B.; Chafe, O.; Abramoff, R.; Bill, M.; Torn, M. Soil Mesocosm CO2 Emissions after 13C-Glucose Addition, Soil Physical and Chemical Characteristics, and Microbial Biomass, Barrow, Alaska, 2014–2016; Next Generation Ecosystem Experiments Arctic Data Collection, Oak Ridge National Laboratory, U.S. Department of Energy: Oak Ridge, TN, USA, 2019. [Google Scholar]
  45. Mao, R.; Zhang, X.; Song, C. Effects of nitrogen addition on plant functional traits in freshwater wetland of sanjiang plain, northeast china. Chinese Geogr. Sci. 2014, 24, 674–681. [Google Scholar] [CrossRef]
  46. Krumböck, M.; Conrad, R. Metabolism of position-labelled glucose in anoxic methanogenic paddy soil and lake sediment. Fems. Microbiol. Ecol. 1991, 85, 247–256. [Google Scholar] [CrossRef]
  47. Dunham-Cheatham, S.M.; Zhao, Q.; Obrist, D.; Yang, Y. Unexpected mechanism for glucose-primed soil organic carbon mineralization under an anaerobic–aerobic transition. Geoderma 2020, 376, 114535. [Google Scholar] [CrossRef]
  48. Giudicianni, P.; Cardone, G.; Ragucci, R. Cellulose, hemicellulose and lignin slow steam pyrolysis: Thermal decomposition of biomass components mixtures. J. Anal. Appl. Pyrol. 2013, 100, 213–222. [Google Scholar] [CrossRef]
  49. Donnelly, P.K.; Entry, J.A.; Crawford, D.L.; Cromack, K.J. Cellulose and lignin degradation in forest soils: Response to moisture, temperature, and acidity. Microb. Ecol. 1990, 20, 289–295. [Google Scholar] [CrossRef]
  50. Jin, X.B.; Wang, S.M.; Zhou, Y.K. Dynamic of organic matter in the heavy fraction after abandonment of cultivated wetlands. Biol. Fert. Soils 2008, 44, 997–1001. [Google Scholar] [CrossRef]
  51. Dan, Z.A.; Chao, G.B.; Wz, B.; Hao, Z.B.; Jing, Z.C.; Cs, B. Labile carbon addition alters soil organic carbon mineralization but not its temperature sensitivity in a freshwater marsh of Northeast China. Appl. Soil Ecol. 2021, 160, 103844. [Google Scholar]
  52. Du, C.W.; He, Z.Q.; Zhou, J.M. Characterization of soil humic substances using mid-infrared photoacoustic spectroscopy. In Functions of Natural Organic Matter in Changing Environment; Zhejiang University Press: Zhejiang, China; Springer Science Business Media Dordrecht: Berlin, Germany, 2013. [Google Scholar]
  53. Fultz, L.M.; Jennifer, M.K.; Francisco, C.; Veronica, A.M. Using fourier-transform mid-Infrared spectroscopy to distinguish soil organic matter composition dynamics in aggregate fractions of two agroecosystems. Soil Sci. Soc. Am. J. 2014, 78, 1940–1948. [Google Scholar] [CrossRef]
  54. Xu, X.B.; Du, C.W.; Ma, F.; Shen, Y.Z.; Wu, K.; Liang, D.; Zhou, J.M. Detection of soil organic matter from laser-induced breakdown spectroscopy (LIBS) and mid-infrared spectroscopy (FTIR-ATR) coupled with multivariate techniques. Geoderma 2019, 35, 113905. [Google Scholar] [CrossRef]
  55. Tian, P.; Liu, S.G.; Wang, Q.K.; Sun, T.; Blagodatskaya, E. Organic N deposition favours soil C sequestration by decreasing priming effect. Plant Soil 2019, 445, 439–451. [Google Scholar] [CrossRef]
  56. Han, Y.; Chen, G.; Wang, Z. The progresses of studies on rubisco activase. Chin. Bull. Bot. 2000, 17, 306–311. [Google Scholar]
  57. Jones, D.L.; Murphy, D.V. Microbial response time to sugar and amino acid additions to soil. Soil Bio. Biochem. 2007, 39, 2178–2182. [Google Scholar]
  58. Chowdhury, S.; Farrell, M.; Bolan, N. Priming of soil organic carbon by malic acid addition is differentially affected by nutrient availability. Soil Bio. Biochem. 2014, 77, 158–169. [Google Scholar] [CrossRef]
  59. Lesak, I.; Lesak, H. The activity of RubisCO and energy demands for its biosynthesis. Comparative studies with CO2-reductases. J. Plant Physiol. 2020, 257, 153337. [Google Scholar]
Figure 1. Diagram of the four constructed wetland pots. Image (a) shows the variables, and (b) shows the scene picture.
Applsci 12 10239 g001
Figure 2. (a) Changes of glucose (mg·g−1), and (b) pH during the experiment in the four wetland pots.
Applsci 12 10239 g002
Figure 3. The changes of C and N fractions. Among which, (a,b) indicated the light fraction organic carbon (LFOC) and nitrogen (LFON), and (c,d) showed the heavy fraction organic carbon (HFOC) and nitrogen (HFON) in the wetland pots (mg·g−1).
Applsci 12 10239 g003
Figure 4. Transmittance at wavelengths within the Fourier-transform mid-infrared spectra (400–4000 cm−1) of LFOM at the 8th h and 24th h. The (a) presented the BS and BSG pots, (b) showed the RS and RSG pots.
Applsci 12 10239 g004
Figure 5. (a) Changes of RubisCO (ribulose-1,5-biphosphate carboxylase/oxygenase) activity and (b) the power function curves between cbbL gene abundance and RubisCO activity based on the cbbL gene abundance at the 8th, 16th, 24th, and 45th h of glucose degradation in the four pots.
Applsci 12 10239 g005
Figure 6. Composition of cbbL-containing bacteria at the phylum (a) and genus (b) levels. Principal component analysis (PCA) of the variables based on the genus composition (c) and PCA of main orders and soil properties (d).
Applsci 12 10239 g006
Publisher’s Note: MDPI stays neutral with regard to jurisdictional claims in published maps and institutional affiliations.

