Article

Study of Drilled Holes after a Cryogenic Machining in Glass Fiber-Reinforced Composites

Department of Construction and Manufacturing Engineering, Universidad Nacional de Educación a Distancia (UNED), 28040 Madrid, Spain
*
Author to whom correspondence should be addressed.
Appl. Sci. 2022, 12(20), 10275; https://doi.org/10.3390/app122010275
Submission received: 7 August 2022 / Revised: 3 October 2022 / Accepted: 10 October 2022 / Published: 12 October 2022
(This article belongs to the Special Issue Precision Machining and Manufacturing)

Abstract

:
Glass fiber-reinforced composites are widely used in industry, with machining operations frequently performed, drilling, in particular, for later assembly. Although there is a smaller increase in temperature during drilling in composites than in metals, further cooling of the tool can produce improvements in some variables, such as thrust force, diameter, or surface roughness. This has been seen in studies where lower temperatures were achieved by cooling compressed air, reaching around −20 °C in plates of polyether-ether-ketone and polyamide, reinforced with glass fiber at 30% (PEEK-GF30 and PA-GF30, respectively). This paper analyzes the results of cryogenic drilling in plates of PEEK-GF30 and PA-GF30, specifically assessing thrust forces, diameter, and average surface roughness. The experimental methodology was carried out by monitoring thrust forces during cryogenic drilling using a piezoelectric dynamometer, measuring diameters with a coordinate measurement machine, and assessing surface quality with a roughness profilometer. During the cutting, the temperature of the cutting tool achieved a temperature near −120 °C from cooling with liquid nitrogen. Conducting an analytical and statistical study allowed us to determine the relationships between the measured variables and cutting conditions. Our results showed that cooling the tool during the drilling processes improved results of the cutting process.

1. Introduction

Glass fiber-reinforced composites have been widely used in industry for a long time, so their behavior under different situations are continued to be studied. Polymeric compounds, such as polyether-ether-ketone and polyamide, reinforced with 30% glass fibers (PEEK-GF30 and PA66-GF30, respectively), are two such composites, both used in the aeronautical and automotive industries. Glass fiber-reinforced plastic usually presents good machinability, although the performance of certain operations must be individually analyzed, due to the influence of multiple factors [1].
The drilling process is frequently performed as the previous operation to parts assembly. For this reason, the literature shows studies related to surface quality, finding that roughness after drilling in PEEK-GF30 is dependent on the relationship between the rotational speed of the drill and feed rate [2], and in PA66-GF30, employing a low feed rate [3,4] with lower values of spindle speed results in minimum surface roughness [4] or minimum circularity [5] in the range considered. Vigneshwaran et al. [6], in their literature review, found that the rate of spindle speed, feed rate, and drill geometry were the most influential parameters on drilling fiber-reinforced polymers.
The search for better results using different variables has led to testing in colder environments during cutting, such as those obtained by cooling compressed air using a Ranque–Hilsch vortex tube or cryogenic cooling using liquid nitrogen (LN2) or liquid carbon dioxide (CO2). Temperatures down to −40 °C can be reached by cooling compressed air. In tapping operations, forces can decrease for a particular tool in PA66-GF30 at temperatures near −20 °C [7]. In drilling operations of PEEK-GF30, thrust forces can also decrease at temperatures close to −20 °C and oversized holes can be avoided [8]. In a review on the cooling process using compressed cold air by vortex tube in machining, it was concluded that improvements in surface quality and tool life were also achieved [9].
On the other hand, cryogenic machining is another method of cooling that is considered, first, because this avoid using refrigerants in the cutting process of alloys; thus, this process is considered sustainable and safe, without health risks [10]. Pimevov et al. [11], in their literature review, found that the cryogenic LN2-assisted machining process was economically sustainable, but proximity between LN2 production and the machining workshop would be convenient to reduce the carbon footprint generated by its transport. In general, cryogenic cooling improves machinability, reducing the cutting temperature [12] to temperatures that can reach below −100 °C. Benefits have also been found in terms of improved machinability under high performance conditions, albeit in metals, particularly in 42CrMo4 steel [13]. Besides the improvements in machinability of composites, cutting forces and tool life have been shown to improve in Kevlar fiber composites [14]. In addition, the cutting forces [15] or surface roughness [16] can be reduced compared with dry milling in carbon fiber composites; in general, the mechanical proprieties in these composites are lower after cryogenic drilling than after a conventional drilling, although this is not due to damage [17]; variables such as surface quality or tool wear are better in cryogenic drilling than in dry drilling, particularly with 4 mm diameter drill bits [18]. In carbon fiber-reinforced polymers, factors such as the resin used can affect the results, with epoxy showing good results for the hole diameter [19]. With these fibers, a lower delamination factor and higher thrust forces have been found in cryogenic drilling, compared with dry drilling [20]. However, lower thrust forces have also been reported, but with better surface quality and lower specific cutting energy consumption [21].
In fiberglass-reinforced composites, such as an S2 glass fiber with epoxy matrix, cryogenic drilling, with 6 mm diameter bits, achieves diameter deviations greater than the tolerances between ±20 and ±40 μm that exceeds recommendations in aeronautical structures for hole size [22].
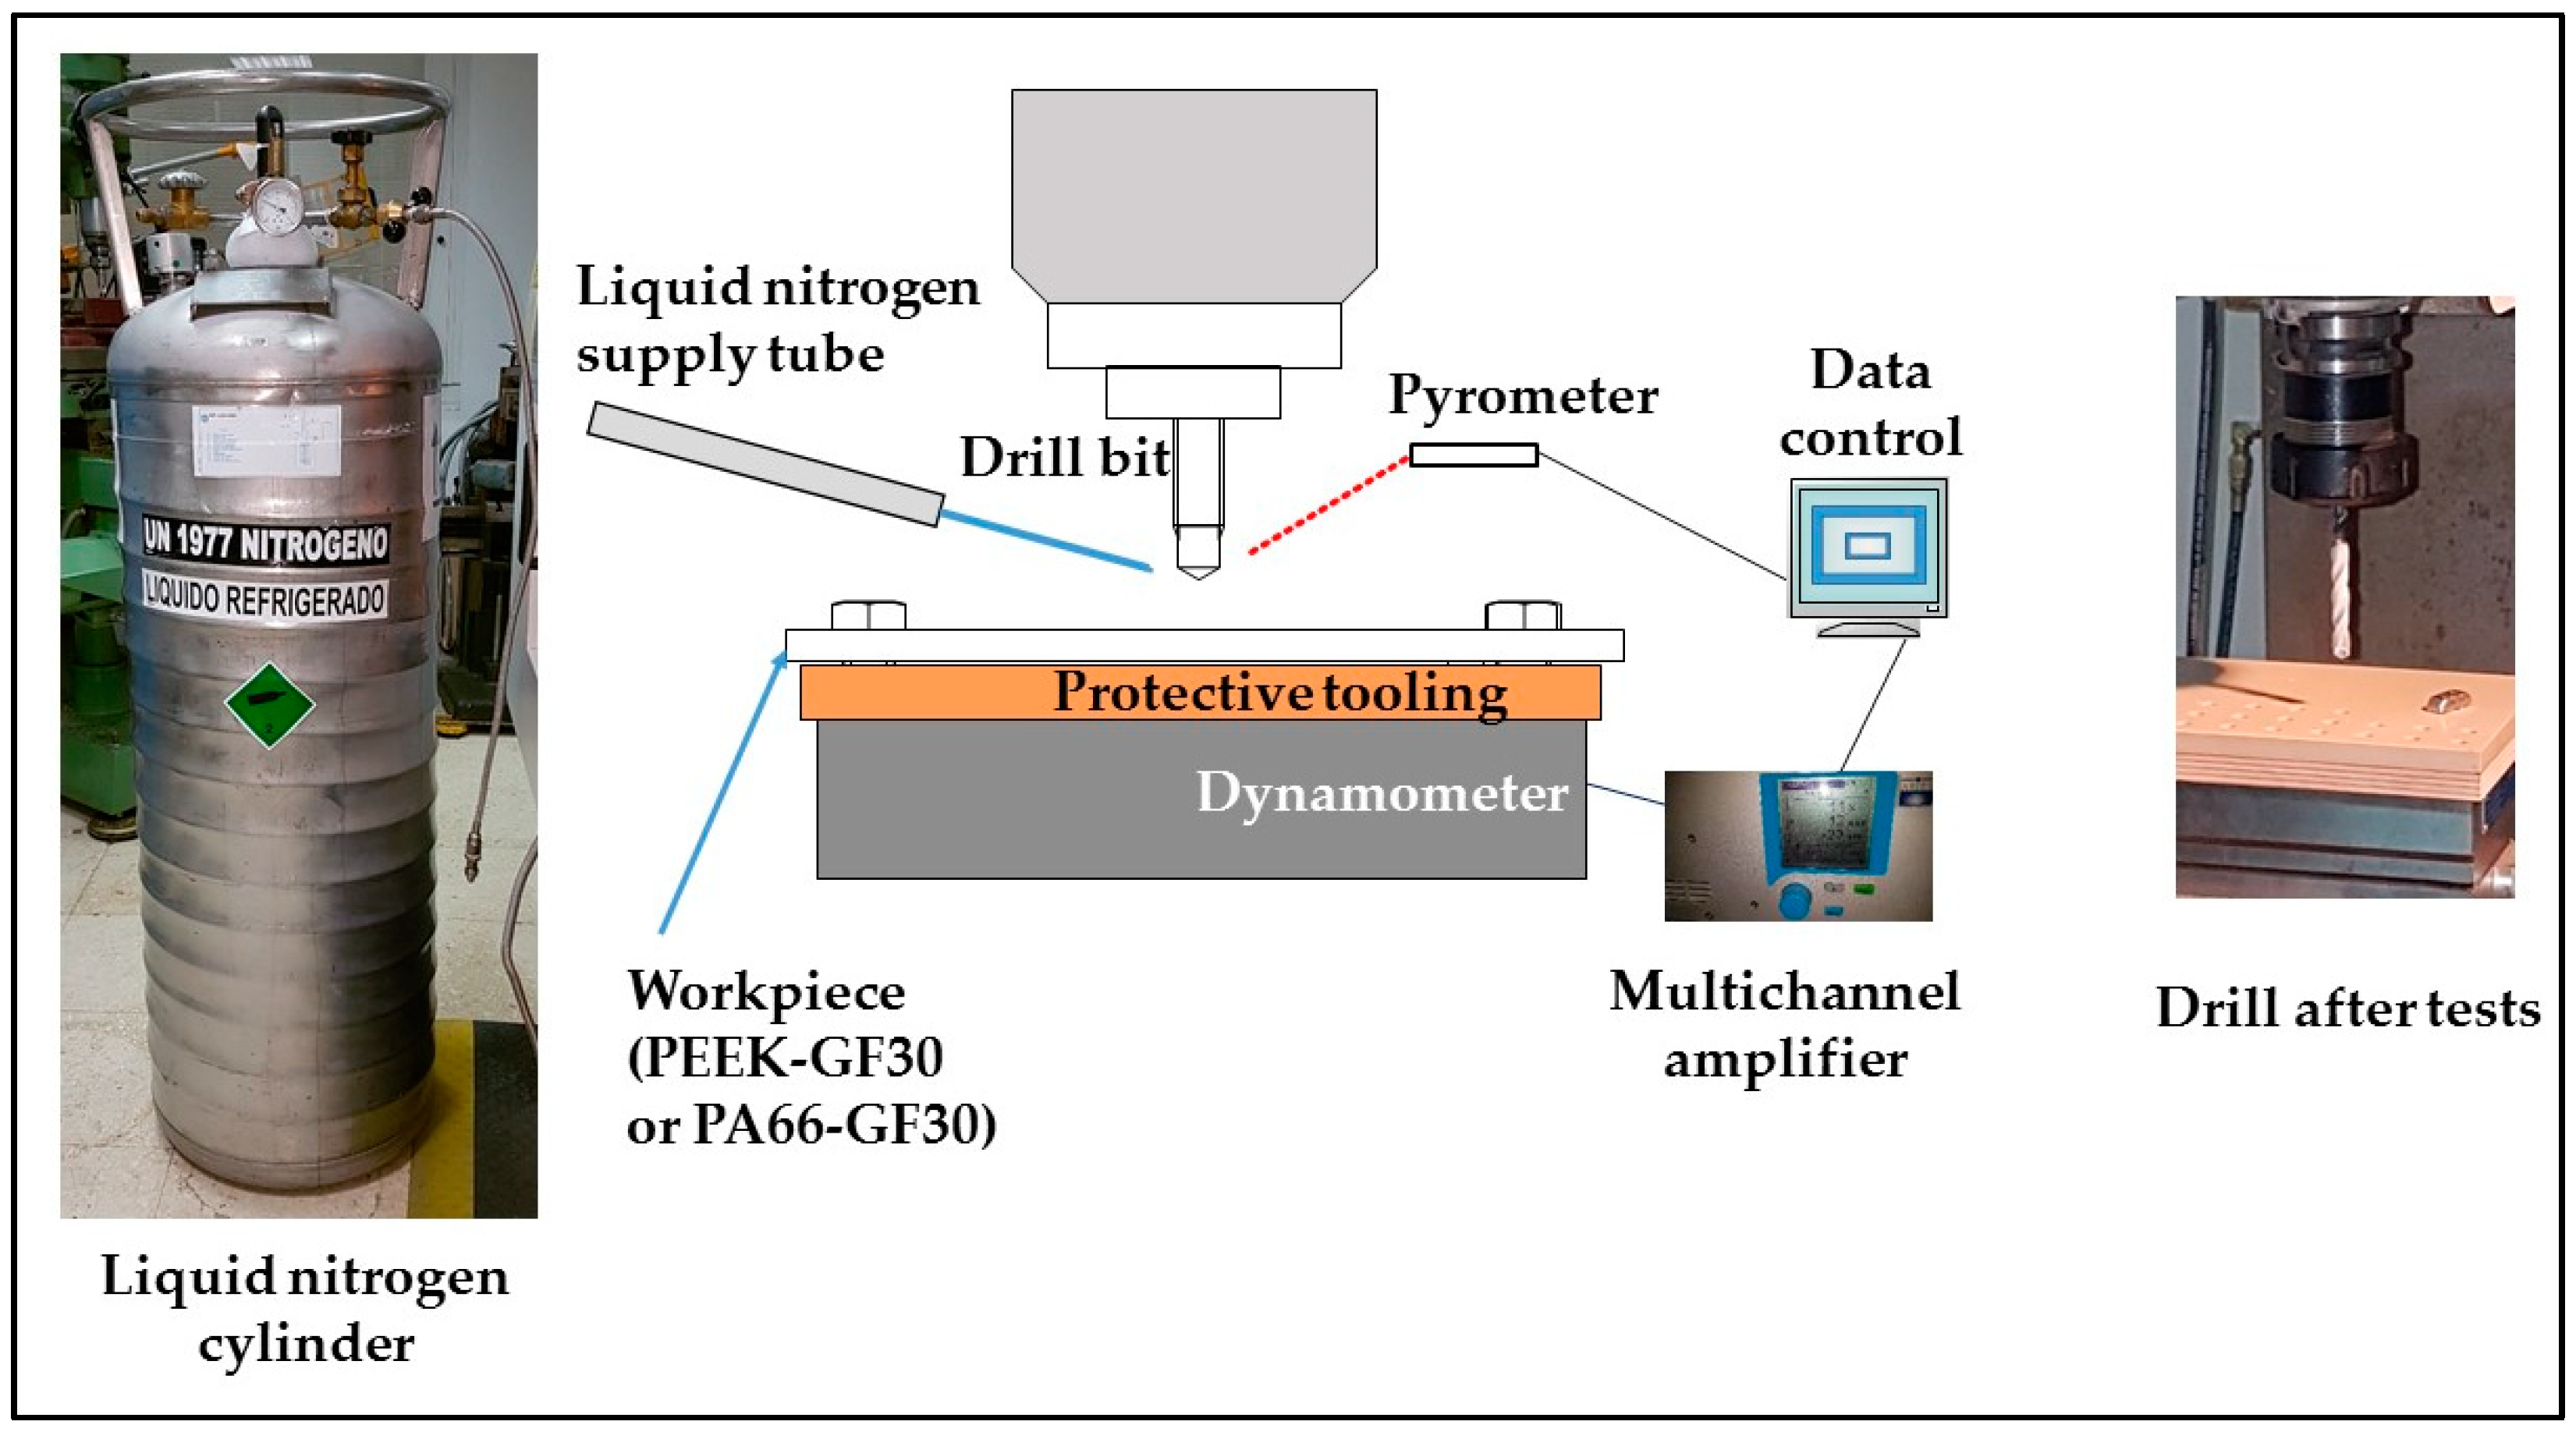
An increasing interest in cryogenic machining of polymer matrix composites has been observed, and some advantages have been found for drilling, regardless of the material being used; however, the results depend on cutting conditions and tools. Thus, the main goal of this paper was to contribute to this field of research, using glass fiber-reinforced composites and high performance conditions, aspects that are not yet found in the academic literature. Therefore, our objectives were focused on the feasibility of cryogenic drilling in composites, such as PEEK-GF30 and PA66-GF30, through the analysis of thrust forces, surface roughness, and diameter of the hole in high performance conditions for cutting. These three variables were chosen because thrust forces are responsible for process stability, and variations in roughness and diameter can reduce the need for additional finishing operations before assembly.

2. Materials and Methods

This section is devoted to the experimental setup and statistical methodology.

2.1. Experimental Setup

Two composites, manufactured by Ensinger (Ensinger, Nufringen, Germany), were evaluated. PEEK-GF30 plates were made by a VictrexTM (Victrex, Thornton, UK) polyether-ether-ketone polymer and 30% E-glass fiber, and produced by extrusion and machined; it is a high purity material with values of total mass loss, collected volatile condensable material, and regained water vapor close to 0.2, 0, and 0.08%, respectively. PA66-GF30 with 30% of E-glass fiber was also manufactured by extrusion and machined; it had 2.4% total mass loss, 0% collected volatile condensable material, and 0.26% of water vapor regained. All these data were provided by the supplier. PEEK-GF30 and PA66-GF30 composite plates (see main proprieties in Table 1) that had a thickness of 6.5 mm were drilled in a Manga Tongtai TMV-510 (Tong-tai Machine and Tool Co., Ltd., Kaohsiung Hsien, Taiwan) machining center, using a 6 mm diameter drill bit provided by FMT Tooling Systems (FMT Tooling Systems Company, Trofa, Portugal), specifically designed for composites and high feed rates. The main characteristics of the drill bit can be observed in Table 2. This type of drill bit is considered adequate to achieve low roughness in drilling composites [23].
The cutting conditions were 5000, 6000, and 7000 rpm for the drill rotation speed (N) and 0.5, 0.75, and 1 mm/rev for its feed rate (f). These cutting conditions were selected because they had been previously used for these composites in dry drilling and drilling by cooling compressed air with good outcomes.
The tests were performed in a cryogenic environment impacting liquid nitrogen directly on the tool through a nozzle with a 2 mm diameter outlet; the liquid nitrogen provided by AirLiquid in refillable cylindrical tanks of 158 L, reached −128 °C and 0.2 MPa pressure. The academic literature uses the term cryogenic to refer to temperatures below 0 °C [10]. The temperature was controlled by an infrared pyrometer, Optris (Optris Infrared Sensing, Portsmouth, NH, USA). Thrust forces developed during the drilling process were measured using a Kistler 9257B piezoelectric dynamometer connected to a Kistler 5070A multichannel amplifier (Kistler Group, Winterthur, Switzerland). Figure 1 shows a scheme of experimental setup.
The superficial quality was measured in roughness using a Mitutoyo SJ-400 surface roughness tester and variations in input diameter by a coordinate measuring machine, Mitutoyo BX 303 (Mitutoyo Corp., Kawasaki-shi, Japan). The diameters were measured using the least squares method and according to ISO 4291 standard [24]. The difference between the nominal value and the average of the eight measured values, taken along the circumference of each hole, was established as the variation under study; therefore, this deviation was a circularity error.

2.2. Statistical Procedure

Experimental results were statistically processed. A 3 × 2 design of experiments (DoE) was performed, with two factors (N and f) at three levels and three variables (thrust force Fz, average roughness Ra, and diameter variation ΔD). Cutting conditions were selected to determine their influence on variables that defined process stability and hole quality. Three levels were considered sufficient to be able to later validate results within that range.
In this data arrangement, response surface methodology (RSM) was applied. With it, an analysis of variance (ANOVA) for each variable was expressed by a standardized Pareto chart, where the dimensionless standardized effects or factors, significant or not, could be identified at a 95 or 90% confidence interval [25]. Although a 95% confidence interval is commonly used in statistics, a 90% interval can be acceptable in production environments, where variability can be high [8,25]. A second-order model was used to determine the influence of each factor and their interactions, generated by RSM, as shown in Equation (1),
X = β 0 + i = 1 k β i x i + i = 1 k β i i x i 2 + i < j β i j x i x j
where X is the response or dependent variable (i.e., thrust force, average roughness, and diameter deviation), β0 is a constant, βi, βii, and βij are the coefficients of the linear, quadratic, and interaction terms, and xi are input parameters (drill rotation speed and feed rate).
When the coefficient of determination, R2, was not considered high enough, the study of the variable was completed with the analysis of means according to Tukey’s honestly significant difference (Tukey HSD) test; this test finds means that are significantly different from each other [26]. Moreover, RSM identified values for the speed of rotation and feed rate that optimized the values of the variables. The optimization was carried out with the objective of minimizing the thrust force and average roughness and keeping the diameter deviation value at 0.
To validate the predicted results, RSM was allowed to generate a path of steepest ascent or descent with new cutting conditions. This path was automatically generated, with the criterion of selecting a region where the estimated response changed the most rapidly with the smallest change in experimental factors. The analysis was conducted using Statgraphics Plus 5.0 software (Statgraphics Technologies, Inc., The Plains, VA, USA) [27].

3. Results

This section presents experimental results and statistical analysis.

3.1. Experimental Results in Cryogenic Environments

Experimental results can be seen in Table 3. Thrust forces were higher in PEEK-G30 than in PA66-GF30, as was expected through the higher mechanical proprieties of both materials in hardness, density, inter alia (see Table 1). As the same fiber was used, this increase was likely due to the PEEK polymeric matrix. These forces increased with rotation speed and feed rate, in the considered range. In PEEK-GF30, thrust forces were higher than those achieved at room temperature or −20 °C, as seen in Domingo et al. [8].
With respect to average roughness and diameter deviation, they were also higher in PEEK-GF30 than in the reinforced polyamide. Roughness reached the maximum value at 6000 rpm and 1 mm/rev in the two materials, with a value of 1.6 in PEEK-GF30 and 1.37 in PA66-GF30. Diameter deviation was really low in both materials; all measurements were less than 40 μm in PA66-GF30 and PEEK-GF30, except one measurement of 62.5 μm at 6000 rpm and 0.75 mm/rev in the latter material. Note that 40 μm is the maximum deviation recommended for aeronautical structures [22], which is very strict for obvious safety reasons.

3.2. Statistical Results in Cryogenic Environments

The experimental data averages for the ANOVA were calculated and considered in these analyses, as is usual in the literature, for example [5,8]; the degrees of freedom in Table 4, Table 5, Table 6 and Table 7 verify this point.

3.2.1. Thrust Forces

The results of an analysis of variance for the data shown in Table 3, allows us to observe the detailed statistical results (Table 4 and Table 5) and standardized Pareto charts (see Figure 2a,b). The results were similar in both materials, and this was expected due to their similar mechanical properties (see Table 1). The cutting conditions were statistically significant at a 95% confidence level, and had a very high percentage of contribution to the results (46.97% for f and 49.30% for N in PEEK-GF30 and 48.87% for f and 48.74% for N in PA66-GF30). Besides f2 and f × N are significant for reinforced PEEK and f × N for reinforced PA66. These results could be expected due to the similar mechanical proprieties of these composites. Note that the percentage of contribution assigned to total residual was very low (0.27 and 0.33%).
An analysis of the RSM means showed the relationship between variable and parameter, represented by Equations (2) and (3), and predicting the values of these variables. The second-order model may be valid because the coefficient of determination, R2, had values of 99.73 and 99.67% for PEEK-GF30 and PA66-GF30, respectively. Moreover, these relationships are shown in Figure 3a,b, where very similar behavior of the two compounds is observed.
Fz_PEEK-GF30 = 91.61 − 0.0106 × N − 438.44 × f + 202.67 × f2 + 0.0557 × N × f − 0.0000017 × N2
Fz_PA66-GF30 = −139.426 + 0.0439 × N − 185.556 × f + 78.22 × f2 + 0.0397 × N × f − −0.0000026 × N2
From a theoretical point of view, the corresponding increase in forces with feed rate is expected. However, some studies have found that these forces can be reduced by increasing the rotational speed of the drill bit, but in lower ranges [4], because they begin increasing again from 5000 rpm in reinforced polyamides [5]; in reinforced PEEK, extreme cooling causes forces to increase [8]. Thus, for thrust forces and PEEK-GF30, the optimal values were 50.7 N for N = 5000 rpm and f = 0.5 mm/rev. In PA66-GF30, the optimal force was 41.1 N for the same cutting conditions. Note that in each case, the minimum was reached for high cutting conditions.

3.2.2. Average Surface Roughness

Table 6 and Table 7 show ANOVA results for average roughness. Feed rate was the only significant factor in roughness for the two materials, at a 90% confidence level (see p-value in Table 6 and Table 7 and standardized Pareto chart in Figure 4a,b).
Their percentage contributions were 67.05% in PEEK-GF30 and 50.37% in PA66-GF30. The friction appeared to be increase with f. The relationship between the parameters and roughness are shown in Equations (4) and (5), and are considered acceptable because R2 was superior to 70% (78.16 and 73.5%). Note that the contribution of residuals was 21.84 and 26.42% for reinforced PEEK and reinforced PA66, respectively. As they are high percentages and could be caused by third order interactions beyond the machining process, it is important to validate the results.
Figure 5a,b represent the estimated response surfaces.
Ra_PEEK-GF30 = −3.502 − 0.0015 × N − 0.4 × f + 0.347 × f2 + 0.000137 × N × f − 1.38 × 10⁻⁷ × N2
Ra_PA66-GF30 = 1.996 − 0.00037 × N − 0.084 × f + 0.17 × f2 + 0.00001 × N × f + 3.22 × 10⁻⁸ × N2
The optimal value for roughness in PEEK-GF30, 0.6881 μm, was obtained for N = 7000 rpm and f = 0.5 mm/rev. With respect to PA66-GF30, the optimal roughness was 1.0134 μm for the same feed rate and 5522 rpm.

3.2.3. Diameter Variation

The standardized Pareto charts show that there were no significant factors at a 90% confidence level (see Figure 6a,b). Moreover, data from R2 showed a low value (63.7 and 62.15%, respectively). Due to the values of R2 and the absence of significant factors, the second order model was omitted. For these reasons, an analysis of means was carried out according to Tukey’s HSD test. For PEEK-GF30, the test by feed rate indicated that the pairs of means showed statistically significant differences at a 95% confidence level; the contrast between 0.5–0.75, 0.5–1, and 0.75–1 showed differences of −0.2133, −0.47, and −0.2567, respectively. On the other hand, the test by N showed the differences of −0.0956, 0.0856, and 0.1811 for the pairs of means 5000–6000, 5000–7000, and 6000–7000, respectively, which were all statistically significant.
For the PA66-GF30 composite, the differences between the pairs were statistically significant at a 95% confidence interval, according to Tukey’s HSD test, and with values of −0.0467 (pair 0.5–0.75), −0.1144 (pair 0.5–1), and −0.0678 (pair 0.75–1) for f, and with values of −0.0011 (pair 5000–6000), −0.0667 (pair 5000–7000), and −0.0656 (pair 6000–7000) for N. Although a specific model for ΔD prediction has not been found, ΔD values met high tolerance requirements after cryogenic drilling and within the considered range.
The results of interaction between N and f in diameter deviation is shown in Figure 7a–d.
The optimal diameter variation in PEEK-GF30, 0.0055 mm, was obtained for N = 6000 rpm and f = 0.5 mm/rev. With respect to PA66-GF30, the optimal value, 0.0004 mm, was also found for N = 6000 rpm and f = 0.5 mm/rev. These predictions indicated that values of N close to 6000 rpm were the most suitable to achieve a lower deviation at a feed rate of 0.5.

3.2.4. Optimization

As seen in the PEEK-GF30 and PA66-GF30 composites, the same feed rate was required to obtain the optimum value for thrust force, surface roughness, and diameter variation. This feed rate (0.5 mm/rev) was very high compared with others used in the academic literature or recommended by manufacturers; this suggested that cryogenic machining facilitates a high production rate in drilling.
Respect to rotation speed, in reinforced PEEK, each variable requires different values of N, so a multiple response would only give a sub-optimization. In reinforced polyamide, an N value between 5000 and 6000 rpm provides a good results for the three variables.

3.3. Validation of Results

The validation of results for thrust forces and average roughness was carried out by selecting cutting conditions and results using the path of steepest ascent or descent, and comparing predicted values from Equations (2)–(5) with new experimental results. The experimental data represents the average of three measurements. The values obtained are shown in Table 8 and Table 9.
As shown in Table 8, the minimum and maximum differences between the predicted and experimental data ranged from 1.3 to 7.7 N, in absolute values, for PEEK-GF30 and from 1.7 to 4.2 N for PA66-GF30. Similar data can be found in Gaitonde et al. [5] in the dry drilling of PA66–GA66. These values are negligible from a technological perspective. Consequently, the fittings could be considered adequate.
For average roughness, different cutting conditions were automatically selected for each composite. In reinforced PEEK, the paths were ascending for N and descending for f, whereas, for reinforced PA66, both N and f followed ascending paths (see Table 9). This was expected because the behavior of the estimated response in regions greater than 6000 rpm was very different (see Figure 5a,b). The observed differences, in absolute values, between the predicted and experimental roughness ranged from 0.01 to 0.14 for PEEK-GF30 and from 0 to 0.06 for PA66-GF30. These results were consistent with others found in the literature [3].

4. Conclusions

This paper analyzed the results of cryogenic drilling in plates of PEEK-GF30 and PA-GF30, specifically assessing thrust forces, diameter variation with respect to nominal or circularity error, and average surface roughness, carried out at −128 °C. The experimental data were statistically analyzed, using RSM for thrust forces and roughness analysis of means for diameter, due to a low coefficient of determination.
A second-order model was identified for thrust forces in both composites, with a great influence of N and f on the results, but also an f2 and f × N interaction in PEEK-GF30 and the same interaction in PA66-GF30, significant factors at the 95% confidence level. Another second-order model was developed for average roughness, with the influence of feed rate on the results, which was the only significant factor at the 90% confidence level.
The low coefficient of determination did not recommend the use of a specific model for ΔD, but an analysis of means by the Tukey test provided adequate values of N and f to get a low ΔD. Although a model could not be identified, the experimental results complied with strict restrictions, and cryogenic drilling was highly recommended.
The results show that the cooling of the tool during drilling processes can improve the results of cutting condition variables because the use of a PCD drill bit is very suitable for this method. For future works, other types of drills should be investigated for this method.

Author Contributions

Conceptualization, R.D.; methodology, R.D., B.d.A. and J.A.; validation, R.D., B.d.A. and J.A.; formal analysis, R.D. and B.d.A.; investigation, R.D., B.d.A. and J.A.; resources, R.D. and J.A.; writing—original draft preparation, R.D., B.d.A. and J.A.; writing—review and editing, R.D., B.d.A. and J.A.; supervision, R.D.; project administration, R.D.; funding acquisition, R.D. All authors have read and agreed to the published version of the manuscript.

Funding

This research was funded by the Spanish Ministry of Science, Innovation and Universities, RTI2018-102215-B-I00 project.

Institutional Review Board Statement

Not applicable.

Informed Consent Statement

Not applicable.

Data Availability Statement

Not applicable.

Acknowledgments

The authors would like to thank the College of Industrial Engineers of UNED for supporting them through the 2022-ETSII-UNED-08 project.

Conflicts of Interest

The authors declare no conflict of interest. The funders had no role in the design of the study; in the collection, analyses, or interpretation of data; in the writing of the manuscript; or in the decision to publish the results.

References

  1. Gemi, L.; Morkavuk, S.; Köklü, U.; Gemi, D.S. An experimental study on the effects of various drill types on drilling performance of GFRP composite pipes and damage formation. Compos. Part B-Eng. 2019, 172, 186–194. [Google Scholar] [CrossRef]
  2. Domingo, R.; García, M.; Sánchez, A.; Rosa Gómez, R. A Sustainable Evaluation of Drilling Parameters for PEEK-GF30. Materials 2013, 6, 5907–5922. [Google Scholar] [CrossRef] [PubMed] [Green Version]
  3. Gaitonde, V.N.; Karnik, S.R.; Campos-Rubio, J.; Abrao, A.M.; Esteves-Correia, A.A.; Davim, J.P. Surface roughness analysis in high-speed drilling of unreinforced and reinforced polyamides. J. Compos. Mater. 2012, 46, 2659–2673. [Google Scholar] [CrossRef]
  4. Demirsöz, R.; Yasar, N.; Korkmaz, M.E.; Günay, M.; Giasin, K.; Pimenov, D.Y.; Aamir, M.; Unal, H. Evaluation of the Mechanical Properties and Drilling of Glass Bead/Fiber-Reinforced Polyamide 66 (PA66)-Based Hybrid Polymer Composites. Materials 2022, 15, 2765. [Google Scholar] [CrossRef] [PubMed]
  5. Gaitonde, V.N.; Karnik, S.R.; Campos-Rubio, J.C.; de Oliveira-Leite, W.; Davim, J.P. Experimental studies on hole quality and machinability characteristics in drilling of unreinforced and reinforced polyamides. J. Compos. Mater. 2014, 48, 21–36. [Google Scholar] [CrossRef]
  6. Vigneshwaran, S.; Uthayakumar, M.; Arumugaprabu, V. Review on Machinability of Fiber Reinforced Polymers: A Drilling Approach. Silicon 2018, 10, 2295–2305. [Google Scholar] [CrossRef]
  7. Domingo, R.; de Agustina, B.; Marin, M.M. A Multi-Response Optimization of Thrust Forces, Torques, and the Power of Tapping Operations by Cooling Air in Reinforced and Unreinforced Polyamide PA66. Sustainability 2018, 10, 889. [Google Scholar] [CrossRef] [Green Version]
  8. Domingo, R.; de Agustina, B.; Marin, M.M. Study of Drilling Process by Cooling Compressed Air in Reinforced Polyether-Ether-Ketone. Materials 2020, 13, 1965. [Google Scholar] [CrossRef] [PubMed]
  9. Swain, S.; Patra, S.K.; Roul, M.K.; Sahoo, L.K. A short review on cooling process using compressed cold air by vortex tube in machining. Mater. Today Proc. 2022, 64, 382–389. [Google Scholar] [CrossRef]
  10. Jawahir, I.S.; Attia, H.; Biermann, D.; Duflou, J.; Klocke, F.; Meyer, D.; Newman, S.T.; Pusavec, F.; Putz, M.; Rech, I.; et al. Cryogenic manufacturing processes. CIRP Ann. Manuf. Technol. 2016, 65, 713–736. [Google Scholar] [CrossRef]
  11. Pimenov, D.Y.; Mia, M.; Gupta, M.K.; Machado, A.R.; Pintaude, G.; Unune, D.R.; Khanna, N.; Khan, A.M.; Tomaz, I.; Wojciechowski, S.; et al. Resource saving by optimization and machining environments for sustainable manufacturing: A review and future prospects. Renew. Sustain. Energy Rev. 2022, 166, 112660. [Google Scholar] [CrossRef]
  12. Shokrani, A.; Dhokia, V.; Muñoz-Escalona, P.; Newman, S.T. State-of-the-art cryogenic machining and processing. Int. J. Comput. Integr. 2013, 26, 616–648. [Google Scholar] [CrossRef] [Green Version]
  13. Dix, M.; Wertheim, R.; Schmidt, G.; Hochmuth, C. Modeling of drilling assisted by cryogenic cooling for higher efficiency. CIRP Ann. Manuf. Technol. 2014, 63, 73–76. [Google Scholar] [CrossRef]
  14. Bhattacharyya, D.; Allen, M.N.; Mander, S.J. Cryogenic Machining of Kevlar Composites. Mater. Manuf. Process. 1993, 8, 631–651. [Google Scholar] [CrossRef]
  15. Domingo, R.; de Agustina, B.; Marín, M.M. An analysis of the forces in the cryogenic peripheral milling of composites reinforced with carbon fiber. Procedia Manuf. 2019, 41, 423–429. [Google Scholar] [CrossRef]
  16. Domingo, R.; Marín, M.M.; de Agustina, B. Study of the roughness of carbon fiber-reinforced composite plates in peripheral cryogenic milling. AIP Conf. Proc. 2019, 2113, 080013. [Google Scholar] [CrossRef]
  17. Wang, H.; Zhang, X.; Duan, Y. Investigating the Effect of Low-Temperature Drilling Process on the Mechanical Behavior of CFRP. Polymers 2022, 14, 1034. [Google Scholar] [CrossRef]
  18. Basmaci, G.; Yoruk, A.S.; Koklu, U.; Morkavuk, S. Impact of Cryogenic Condition and Drill Diameter on Drilling Performance of CFRP. Appl. Sci. 2017, 7, 667. [Google Scholar] [CrossRef] [Green Version]
  19. Ferreira-Batista, M.; IgorBasso, I.; Toti, F.A.; Rodrigues, A.R.; Tarpani, J.R. Cryogenic drilling of carbon fibre reinforced thermoplastic and thermoset polymers. Compos. Struct. 2020, 251, 112625. [Google Scholar] [CrossRef]
  20. Balan, A.S.S.; Kannan, C.; Jain, K.; Chakraborty, S.; Joshi, S.; Rawat, K.; Alsanie, W.F.; Thakur, V.K. Numerical Modelling and Analytical Comparison of Delamination during Cryogenic Drilling of CFRP. Polymers 2021, 13, 3995. [Google Scholar] [CrossRef]
  21. Iqbal, A.; Zhao, G.; Zaini, J.; Gupta, M.K.; Jamil, M.; He, N.; Nauman, M.M.; Mikolajczyk, T.; Pimenov, D.Y. Between-the-Holes Cryogenic Cooling of the Tool in Hole-Making of Ti-6Al-4V and CFRP. Materials 2021, 14, 795. [Google Scholar] [CrossRef] [PubMed]
  22. Koklu, U.; Morkavuk, S.; Featherston, C.; Haddad, M.; Sanders, D.; Aamir, M.; Pimenov, D.Y.; Giasin, K. The effect of cryogenic machining of S2 glass fibre composite on the hole form and dimensional tolerances. Int. J. Adv. Manuf. Technol. 2021, 115, 125–140. [Google Scholar] [CrossRef]
  23. Xu, J.; Lin, T.; Davim, J.P. On the Machining Temperature and Hole Quality of CFRP Laminates when Using Diamond-Coated Special Drills. J. Compos. Sci. 2022, 6, 45. [Google Scholar] [CrossRef]
  24. ISO 4291; Methods for the Assessment of Departure from Roundness. Measurement of Variations in Radius. International Organization for Standardization: Geneva, Switzerland, 1985.
  25. Montgomery, D.C. Design and Analysis of Experiments, 8th ed.; John Wiley & Sons Inc.: New York, NY, USA, 2012. [Google Scholar]
  26. Kutner, M.H.; Natchtsheim, C.J.; Neter, J.; Li, W. Applied Linear Statistical Models, 5th ed.; McGraw-Hill Irwin: New York, NY, USA, 2005. [Google Scholar]
  27. Statgraphics. Available online: Statgraphics.net (accessed on 20 May 2022).
Figure 1. Scheme of experimental setup.
Applsci 12 10275 g001
Figure 2. Standardized Pareto chart for thrust forces at a 95% confidence level: (a) standardized effect for Fz_PEEK-GF30 [dimensionless] and (b) standardized effect for Fz_PA66-GF30 [dimensionless].
Applsci 12 10275 g002
Figure 3. Estimated response surface for thrust forces: (a) for Fz_PEEK-GF30 and (b) for Fz_PA66-GF30.
Applsci 12 10275 g003
Figure 4. Standardized Pareto chart for roughness at a 90% confidence level: (a) standardized effect for Ra_PEEK-GF30 [dimensionless] and (b) standardized effect for Ra_PA66-GF30 [dimensionless].
Applsci 12 10275 g004
Figure 5. Estimated response surface for roughness: (a) for Ra_PEEK-GF30 and (b) for Ra_PA66-GF30.
Applsci 12 10275 g005
Figure 6. Standardized Pareto chart for diameter variation, at a 90% confidence level: (a) standardized effect for ΔD_PEEK-GF30 [dimensionless] and (b) standardized effect for ΔD_PA66-GF30 [dimensionless].
Applsci 12 10275 g006
Figure 7. Interaction plots for diameter variation: (a) for ΔD_PEEK-GF30 and N; (b) for ΔD_PA66-GF30 and N; (c) for ΔD_PEEK-GF30 and f; and (d) for ΔD_PA66-GF30 and f.
Applsci 12 10275 g007
Table 1. Main proprieties of PEEK-GF30 and PA66-GF30 composites.
ProprietiesPEEK-GF30PA66-GF30
Density (kg/m3)14901350
Rockwell hardness M10375
Tensile strength (MPa)15793.1
Tensile modulus (GPa)9.69954.65
Flexural modulus (GPa)10.3094.48
Compressive strength (MPa)215124
Melting temperature (°C)343260
Table 2. Main features of the drill bit.
Tip MaterialTotal Length of the BitHelix LengthPoint AngleHelix AngleTip Tolerance
Polycrystalline Diamond (PCD)93 mm57 mm120°30°m7
Table 3. Experimental results for PEEK-GF30 and PA66-GF30 with respect to thrust forces, average roughness, and diameter deviation.
PEEK-GF30PA66-GF30
Test NumberN [rpm]f [mm/rev]Fz [N]Ra [μm]ΔD [mm]Fz [N]Ra [μm]ΔD [mm]
150000.5490.860.0163451.050.0134
250000.5480.820.0028481.080.0142
350000.5531.060.0127391.030.0075
450000.75831.430.0385701.130.0036
550000.75730.860.0003651.080.0083
650000.75780.890.0098630.860.0047
7500011191.140.00081010.990.0166
8500011161.110.00821071.160.0056
9500011231.150.00231101.280.0057
1060000.5750.670.0082730.950.0002
1160000.5830.720.0005720.90.0029
1260000.5910.740.0078771.060.0005
1360000.751281.370.00951051.050.0014
1460000.751200.980.06251191.190.0006
1560000.751261.070.00751121.150.0018
16600011871.50.00411711.020.0049
17600011901.60.00251550.980.0078
18600011871.530.00331691.370.0027
1970000.51300.940.00421081.140.0006
2070000.51280.70.00471071.090.0034
2170000.51290.790.00481011.080.0012
2270000.751610.730.00641571.10.0042
2370000.751710.830.00041661.220.0246
2470000.751811.060.00631511.020.0102
25700012741.210.01132071.230.0010
26700012481.190.00572031.170.0204
27700012401.10.00022111.210.0040
Table 4. Analysis of variance for Fz_PEEK-GF30.
SourceSum of SquaresDfMean SquareF-Ratiop-ValueContribution (%)
f14,933.4114,933.4511.410.000246.97
N15,674.1115,674.1536.770.000249.30
f2320.891320.8910.990.04521.01
f × N774.691774.6926.530.01422.44
N25.5615.560.190.69220.017
Total residual87.6329.2 0.27
Total 31,793.28
Table 5. Analysis of variance for Fz_PA66-GF30.
SourceSum of SquaresDfMean SquareF-Ratiop-ValueContribution (%)
f10,809.2110,809.2438.520.000248.87
N10,780.9110,780.9437.370.000248.74
f247.8147.81.940.25800.22
f × N393.361393.3615.960.02811.78
N213.63113.630.550.51100.062
Total residual73.95324.65 0.33
Total 22,118.88
Table 6. Analysis of variance for Ra_PEEK-GF30.
SourceSum of SquaresDfMean SquareF-Ratiop-ValueContribution (%)
f0.331310.33139.210.056167.05
N0.01110.0110.310.61912.23
f20.0009410.000940.030.88190.19
f × N0.0046710.004670.130.74250.94
N20.038210.03821.060.37827.73
Total residual0.107930.036 21.84
Total 0.49418
Table 7. Analysis of variance for Ra_PA66-GF30.
SourceSum of SquaresDfMean SquareF-Ratiop-ValueContribution (%)
f0.0196410.019645.690.097150.37
N0.006710.00671.930.258817.18
f20.0002210.000220.060.81590.56
f × N0.00002510.0000250.010.93710.06
N20.002110.00210.600.49455.39
Total residual0.010330.0034 26.42
Total 0.038998
Table 8. Validation of results for thrust forces, Fz.
PEEK-GF30PA66-GF30
N [rpm]f [mm/rev]Predicted [N]Experimental [N]Predicted [N]Experimental [N]
60000.75123.4124.7113.7112.0
62000.80144.6139.6131.0126.8
64000.85167.2170.2148.6150.3
66000.90191.3186.5166.7163.9
68000.95217.0224.7185.4188.8
Table 9. Validation of results for average roughness, Ra.
PEEK-GF30PA66-GF30
N [rpm]f [mm/rev]Predicted [μm]Experimental [μm]N [rpm]f [mm/rev]Predicted [μm]Experimental [μm]
60000.751.121.1460000.751.071.13
62000.600.971.1162000.801.091.14
64000.530.871.0164000.901.121.14
66000.480.790.8566000.951.151.15
68000.440.700.7168001.001.181.15
Publisher’s Note: MDPI stays neutral with regard to jurisdictional claims in published maps and institutional affiliations.

