Abstract
An automatic quality assessment of stitched images is an essential task in image analysis and is particularly useful not only in the creation of general-purpose panoramic images but also in terrain exploration and mapping made by mobile robots and drones. In Visual Simultaneous Localization and Mapping (VSLAM) solutions, the environment maps acquired by cameras mounted on the mobile robots may be captured in dynamically changing lighting conditions and subject to some other distortions influencing the final quality of the panoramic images representing the robot’s surroundings. Such images may also be used for motion planning and visual navigation for other robots, e.g., in follow-the-leader scenarios. Another relevant application area of panoramic imaging is Virtual Reality (VR), particularly head-mounted displays, where perceived image quality is even more important. Hence, automatic quality evaluations of stitched images should be made using algorithms that are both sensitive to various types of distortions and strongly consistent with subjective quality impression. The approach presented in this paper extends the state-of-the-art metric known as the Stitched Image Quality Evaluator (SIQE) by embedding it with some additional features using the proposed new combination scheme. The developed combined metric based on a nonlinear combination of the SIQE and additional features led to a substantially higher correlation with the subjective quality scores.
1. Introduction
Image stitching is typically defined as a method for creating panoramic images from a set of constituent images or, more generally, a combination of multiple images into a larger image with a wider field of view. It may be applied for various purposes including popular smartphone applications, where such panoramas may be constructed directly during the acquisition of an image series by the smartphone camera. Nevertheless, the application areas of stitched images are much wider, including in mobile robotics and robot vision [1,2], non-destructive testing and surface inspections [3,4], civil engineering construction [5], as well as medical X-ray imaging [6].
The main idea of image stitching is based on the application of feature extraction methods, making it possible to identify some pairs of small image fragments (features) present in two constituent images that represent the same physical objects or their fragments, e.g., corners. For this purpose, several methods may be applied from the classical Harris corner detector and Difference of Gaussians (DoG) to the use of feature detectors and descriptors, such as the Scale Invariant Feature Transform (SIFT) [7], Speeded-Up Robust Features (SURF) [8], Features from Accelerated Segment Test (FAST) [9], as well as some more advanced ones such as BRIEF (Binary Robust Independent Elementary Features) [10], ORB (Oriented FAST and Rotated BRIEF) [11], BRISK (Binary Robust Invariant Scalable Keypoints) [12], or FREAK (Fast Retina Keypoint) [13]. Having determined the interest points (keypoints), the next step is to find their matches and use affine transformations. Typically, the homography estimation is made using the Random Sampling Consensus (RANSAC) algorithm [14], which is used for the outliers’ removal, and then each image is projected onto the same surface and blended. Image blending can also be conducted using several techniques, including alpha blending and gain compensation, influencing the final quality of the stitched image. Hence, by using more images partially overlapping each other, it is possible to construct a single high-resolution image representing a larger scene.
Such methodology can be useful in many applications related to mobile robotics from target recognition [1,15] to robot-based inspection systems, where the 3D point clouds can also be stitched with additional texture projection helping to calculate the sensor’s movement [3]. Another interesting application is related to crack detection during concrete bridge inspections by combining point and line features. During a typical inspection process, thousands of individual images are collected so the detection of cracks on them would take a lot of time. More reliable and comprehensive results may be obtained for images representing the surface as a whole. Such a system constructed for the inspection of the bottom surfaces of bridges has been presented by Xie et al. [5]. Similar methods may be useful in industrial applications for video inspection of many types of large, particularly long, elements, as well as in electrical engineering for the inspection of power lines using drones.
Recently, Schlagenhauf et al. [4] utilized image-stitching methods for the automated surface inspection of rotationally symmetric parts, e.g., ball screw drives or cylinder walls of a combustion engine, particularly for images obtained using line-scan cameras. An interesting method for stitching video sequences from a fisheye camera and a wide-angle lens camera was presented by Dong et al. [16]. The typical assumed scenario was a telepresence robot, where the quality of the stitched image frames obtained after the final blending played an important role, similar to mobile robotics. In this case, the detected low-quality images might have been removed from the analysis, influencing the robot’s motion control to prevent its improper steering. Some other image- and video-stitching applications that require high-quality images, and preferably some reliable metrics for their quality monitoring, include virtual reality (VR) and digital entertainment [17,18] as well as video surveillance [19]. Obviously, such methods may be applied for stitching images captured by drones; however, in this case, an additional source of the potentially degraded quality may have been the wind turbulence.
The rest of the paper is organized as follows: in Section 2, some state-of-the-art solutions for the quality assessment of stitched images are discussed together with methods for their verification. The proposed approach is presented in Section 3, whereas Section 4 contains the results of the experimental verification with the ablation study. Section 5 concludes the paper.
2. The Quality Evaluation of Stitched Images
2.1. The Verification Methodology of the Developed Metrics
The quality of stitched images depends on several factors, although these are different to those of the general-purpose image quality assessment (IQA). Some other types of distortions may also be expected that may be caused by the improper choice of image features, incorrect blending and interpolation, differing lighting conditions in constituent images, etc., rather than, e.g., the presence of noise or lossy compression. Some other sources of visible errors may be geometrical distortions as a result of lens imperfections, or an overlapping region that is too small leading to a small number of detected keypoints. Capturing the constituent images during camera motion may result in motion blur or ghosting artifacts. These types of artifacts can be found in the images from the Indian Institute of Science Stitched Image Quality Assessment (ISIQA) dataset [20] used in our experiments. Nevertheless, general-purpose IQA metrics developed for natural images cannot be efficiently applied to panoramic images and new metrics dedicated to stitched images are necessary.
Although great progress in image quality assessment has been made during recent years, one of its limitations has been the availability of image quality datasets containing reference images and their degraded versions together with the results of subjective evaluations by human observers, which are usually expressed as Mean Opinion Score (MOS) values. The use of several such databases makes it possible to conduct a cross-database validation for the newly proposed metrics. A further development in larger datasets additionally allows the use of deep Convolutional Neural Networks (CNNs) for this purpose. Nevertheless, the development of new quality evaluation methods for stitched images is limited by the availability of databases that require a lot of effort related to the preparation of images and collection of subjective evaluation scores. Therefore, the applicability of popular data-driven CNN methods for this purpose is significantly limited, as stated by Hou et al. [21], who emphasized the necessity of training using a great number of images to avoid potential overfitting.
A relatively large-scale dataset for omnidirectional image quality assessment known as OIQA was proposed by Duan et al. [22], which contains 16 source images and 320 distorted images assessed by twenty subjects. They have been degraded by four commonly met distortion types: JPEG compression, JPEG2000 compression, Gaussian blur, and Gaussian noise. Nevertheless, these types of distortions are not specific for stitched images, and therefore most general-purpose IQA metrics demonstrate good performance for this dataset. Another example of an image dataset containing panoramic images was recently proposed, that is, the Color Correction-based Stitched Image Database (CCSID), containing 10 stitched images generated from 10 source panoramic image pairs with consistent colors, 400 stitched images generated from 50 panoramic image pairs with inconsistent colors, and 350 panoramic image pairs with color correction [23]. Nevertheless, this database focused only on color distortions and therefore its universality and diversity are substantially limited. Additionally, the experimental results obtained for this database presented in [23] demonstrate the different performances of various metrics in comparison to those obtained for the ISIQA dataset, which is discussed further.
The two other datasets proposed previously, which also contain images degraded with limited types of distortions, were the Stitched Image Quality Assessment (SIQA) database proposed in [24] containing 816 stitched samples with perspective variations obtained from 12 different 3D scenes assessed by 28 viewers and the Compressed VR Image Quality Database (CVIQD2018) containing 6 source images and 528 compressed ones using three coding technologies (JPEG, H.264/AVC and H.265/HEVC) and assessed by 20 observers [25]. Another dataset known as the Multi-Distortions Visual Attention Quality Dataset (MVAQD) containing 15 high-quality uncompressed omnidirectional images and their distorted versions obtained with five distortion types at four distortion levels, respectively, namely Gaussian blur, HEVC intra coding, JPEG compression, JPEG2000 compression, and white noise, was presented in [26]. All the images were assessed by 26 independent observers, leading to MOS values being provided in the MVAQD dataset. Nevertheless, similar to previous datasets, the distortions present in the images were not specific to panoramic images and can be found in many types of images. Hence, many “traditional” IQA methods demonstrate relatively good performance also for them. Therefore, such datasets were not used in the experiments presented in our paper.
The most comprehensive dataset developed by Madhusudana and Soundararajan [20] is known as the Indian Institute of Science Stitched Image Quality Assessment (ISIQA). It contains 264 stitched images obtained from 26 sets of 4 or 5 constituent images representing various scenes, together with the aggregated results of 6600 subjective assessments. The observers used head-mounted displays and then around 25 human opinion scores were obtained for each image, further averaged, and expressed as MOS values for each of the 264 stitched images. One of the most important advantages of this database is the choice of distortions that are specific to stitched images, such as ghosting and blur, color distortion, and geometric distortion. It is the most relevant difference in comparison to lossy compression and was mainly considered in earlier studies for omnidirectional images, where some of the general-purpose IQA metrics and their modifications were verified for such types of images.
One of the assumptions of the ISIQA database is the lack of motion; therefore, only static scenes representing buildings, gardens, and indoor and public places are included in the dataset. Therefore, it focuses on the evaluation of horizontal stitching and modeling the distortions introduced during the stitching process. The inventors of the dataset excluded potential issues during image capture since the Samsung S7 Edge smartphone camera was used for this purpose to ensure reasonably high quality of constituent images [20]. Hence, the horizontal resolution of the obtained stitched images is around 8000–10,000 pixels, and the vertical resolution is about 2000 pixels. Sample stitched images from 2 of 26 sets together with the constituent images are shown in Figure 1 and Figure 2.
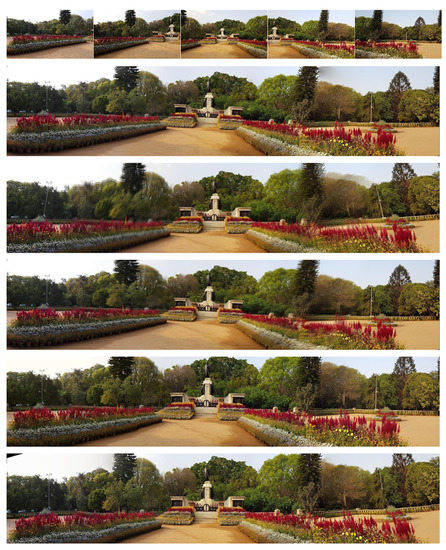
Figure 1.
Sample constituent (top row) and stitched images from set #1 of ISIQA database with various types of distortions.
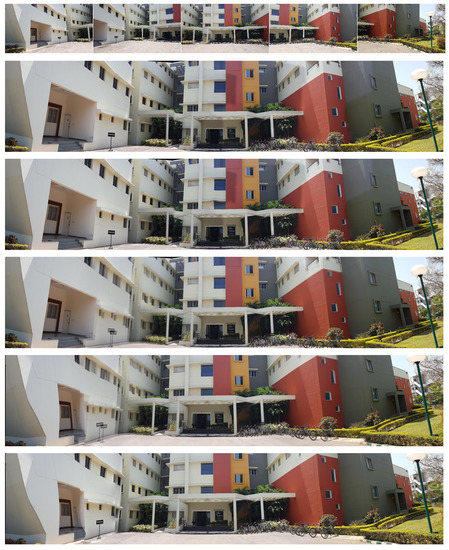
Figure 2.
Sample constituent (top row) and stitched images from set #3 of ISIQA database with various types of distortions.
Similar to the other types of images and video sequences where the datasets containing the subjective quality scores are available, the verification of the newly developed metrics is based on the calculation of the three main correlation coefficients between two 264-element sequences of scores (objective and subjective), i.e., calculated metrics and MOS values for all 264 images from the ISIQA dataset. The most popular correlation coefficient that reflects prediction accuracy is known as Pearson’s r or PLCC (Pearson’s Linear Correlation Coefficient). Assuming the objective metric Q, it may be defined as
being the covariance to the product of the standard deviation ratio.
The two other popular rank-order correlations, namely Spearman Rank-Order Correlation Coefficient (SROCC), referred to as , and Kendall Rank-Order Correlation Coefficient (KROCC), denoted as , reflect the prediction monotonicity. SROCC may be expressed as
where n stands for the number of images and is the difference between the ranks of the same images in two sequences sorted according to their objective (Q) and subjective (MOS) quality scores. Kendall’s is defined as
where and are the numbers of pairs of images ordered in the same way and reversely (concordant and discordant, respectively).
Although in many papers related to image-quality assessment, the additional use of nonlinear regression with a logistic function is postulated, as recommended by the Video Quality Experts Group (VQEG), to linearize the relationship between the subjective and objective scores [27,28], the nonlinear combination of multiple metrics, as proposed in this paper, makes it possible to skip this step. As verified for all versions of the metrics considered in the paper, the differences in the obtained PLCC values were negligible (less than 0.0001). Additionally, from a practical point of view, the direct applicability of the metric linearly correlated with the subjective evaluation without additional tuning would be much more anticipated. Additional verification of the newly proposed metrics may also be conducted by the calculation of the Root Mean Squared Error (RMSE) and Outlier Ratio (OR); however, they lead to the same conclusions as the PLCC.
2.2. The Overview of Quality Metrics
Methods for stitched image quality assessment proposed before the development of the ISIQA dataset focused mainly on the lossy compression artifacts and partial distortions specific to panoramic images. Unlike in general-purpose IQA, reference-stitched images without any distortions are often unavailable; hence, the most typical full-reference (FR) approach, which is based on the comparison of two images (“pristine” image and the distorted one), cannot be directly applied. On the other hand, a purely no-reference (NR) approach may also be troublesome, as such metrics are usually less correlated with MOS values. Nevertheless, a reasonable approach for the quality evaluation of stitched images may be the comparison of some features extracted for the constituent and finally stitched images. Such an approach may be considered a compromise between the FR and NR IQA methods.
One such method known as the Multi-view Image Quality Measure (MIQM), which was proposed by Solh and AlRegib [29,30], consists of luminance, contrast, spatial motion, and edge-based structure components. A simplified version of some parts of this metric, namely the luminance and contrast index, and the edge-based structural index, was used in the construction of the combined metric and experiments presented in a later section of the paper (Section 3). A more detailed description of this simplified implementation can be found in [31].
Qureshi et al. [32] proposed the HFI_SSIM metric utilizing the popular Structural Similarity (SSIM) method [33] for comparisons of the high-frequency data in the overlapping regions of constituent and stitched images together with low-frequency information used for the assessment of the photometric panorama quality using the intensity magnitude ratio measures and spectral angle mapper. Bellavia and Colombo [34] combined the Feature Similarity (FSIM) metric [35] and the improved Color Image Difference (iCID) measure [36] in their classification framework of color correction methods for image stitching. The problem of color balancing and correction in image and video stitching was examined in [37]. Yu et al. [38] proposed a no-reference metric called the NRQQA (No-Reference Quantitative Quality Assessment), which was composed of three features: a multi-directional gradient, phase congruency, and saliency. This method focused on the automatically located overlapping regions assuming the presence of structural discontinuity and ghosting only in those areas. Unfortunately, its authors did not present an analysis of its agreement with the subjective evaluations of the use of the available image datasets.
The authors of the ISIQA dataset also proposed an interesting quality metric for panoramic images, referred to as the Stitched Image Quality Evaluator (SIQE) [20]. This metric was based on the use of 36 features designed to capture the differences and deviations in the statistics of images as a result of degraded quality. The first group of features is sensitive to structural changes observed as changed, added, or removed edges as well as the presence of blur. The second group represents the ghosting artifacts caused by the variations in the spatial correlations. Then, the weighted average of features calculated for the constituent and stitched image 100 × 100 pixel patches is determined and the final quality prediction is conducted for feature differences using support vector regression.
The three main groups of features that are the inputs for the SVM regressor are the 12 shape parameters of the subband coefficients obtained by fitting a Generalized Gaussian Distribution (GGD), 12 eigenvalues of the bivariate distribution obtained from the horizontal neighbors by fitting a bivariate Gaussian Mixture Model (GMM) to the horizontally adjacent subband coefficients, and 12 eigenvalues of the bivariate distribution obtained from the vertical neighbors by fitting a bivariate GMM to the vertically adjacent subband coefficients. Each of the three groups of 12 parameters is obtained for two scales and six orientations using steerable pyramids for decomposition into subbands.
One of the advantages of the SIQE metric is its relatively high correlation with the MOS values available in the ISIQA dataset equal to 0.8393, considering the Pearson’s Linear Correlation Coefficient (PLCC) and Spearman Rank-Order Correlation Coefficient (SROCC) equal to 0.8318. However, the results provided in [20] were achieved using 80% of images for training and 20% for testing (assuming median performance for 1000 iterations and the use of additional nonlinear fitting using the logistic function for the PLCC). Nevertheless, as reported in our previous paper [31], the calculation of these correlations for the whole dataset leads to a PLCC = 0.7488 and an SROCC = 0.7057, which are much worse results. Hence, there remains a gap for the further extension of this metric, as proposed in the paper, particularly by its nonlinear combination with some other metrics and features using methodologies similar to those successfully applied in the combined metrics for the general-purpose IQA [39,40,41].
Some other previously proposed methods for the quality assessment of stitched images mentioned earlier demonstrated a much lower correlation with the subjective quality scores; however, they may be partially helpful in a combination as individual metrics or features, as described in Section 3. As presented in [20], the PLCC values obtained for the ISIQA dataset did not exceed 0.6. An interesting overview of some other methods for the perceptual quality assessment of panoramic stitched images can be found in the recent survey paper [42].
3. The Proposed Approach
The main idea of the proposed approach was an extension of the SIQE metric using some additional features that may be sensitive to some other types of distortions leading to an increase in the correlations between the developed combined metric and subjective scores (the MOS values available from the ISIQA dataset used in the experiments). Since the original SIQE implementation utilized 36 features based on statistical data (GGD and GMM models) for the subbands, a substantial increase in the correlation between the developed combined metric and the MOS values may be expected by utilizing some additional features of a different “nature”.
Considering the experiences related to the general-purpose IQA, the presence of image distortions usually leads to some changes in entropy and variance in the degraded image (higher values may be expected); hence, the first experimental results provided in earlier papers [31,43], contained the effects of applying two models based on the weighted product and weighted sum of the SIQE, entropy-based features, and simplified implementation of two features originating from the MIQM [29,30]. In comparison to the original correlation values for the SIQE metric (PLCC = 0.7488, SROCC = 0.7057, and KROCC = 0.5308), the “best” combinations led to a PLCC = 0.8338, SROCC = 0.8341, and KROCC = 0.6432. Some other competitive results can be found in the paper written by Liu and Mo [44], where the fusion of global and local features was proposed. Nevertheless, the authors randomly divided the dataset into training and testing sets, achieving a PLCC = 0.8432 and SROCC = 0.8013 for the proposed method based on the extension of the BRISQUE metric [45], compared to the median SIQE performance reported in [44], with a PLCC = 0.8030 and SROCC = 0.7820 for the train/test split 80/20 with an additional SVR score fitting. All these values may be considered the starting point for the further extensions provided in this paper.
The approach to the design of the combined metric proposed in this paper was based on the joint application of the weighted sum and the weighted product of the same set of metrics. Therefore, the additional memory resources were not necessary for storing the additional values of the features, and the advantages of both combination methods may demonstrate the synergy effect. The general formula for the designed combined metric based on the SIQE and additional features can be defined as
where weight w and exponents a and b are subject to optimization. The list of additional features used in Formula (4) contains the following (in this study, features have been used in aggregate):
- —differential entropy;
- —average local entropy for the stitched image;
- —differential variance of the local entropy;
- —median edge-based structural index (—a part of the MIQM [29,30]);
- —median luminance and contrast index (K—a part of the MIQM [29,30]);
- —variance of the edge-based structural index (var());
- —variance of the luminance and contrast index (var(K));
- —absolute difference of standard deviations.
The entropy-based features (–) can be determined, calculating the local and global entropy values for the constituent and stitched images. The global entropy can be calculated independently for each stitched image () and as the average for four or five constituent images (), and then the differential entropy is determined as the difference of these two values. The local entropy values can be determined for the fragments of the stitched () and constituent images () in a similar way, assuming the use of the 9 × 9 pixel sliding window for the calculation of the local entropy for each pixel’s neighborhood. They are further averaged for all positions of the sliding window to obtain the average features ( and ). After the numerical experiments, it was found that the differential local entropy and the average local entropy determined for the constituent images did not increase the metric’s performance. Therefore, the average local entropy of the stitched image is used as the feature . Nevertheless, the differential variance of the local entropy values is used as the feature , determined as
Two sub-metrics ( and K) incorporated from the MIQM [29,30], used as features and , reflect the distortion level; hence, their values close to 1 indicate high quality, whereas their small values denote strongly distorted images. The sub-metric K is sensitive to sharp local changes in luminance and contrast around the structured regions in the 21 × 21 pixel macroblocks. This is based on the comparison of mean intensities and standard deviations similar to the well-known Structural Similarity (SSIM) metric [33]. Then, the weighted average of the luminance and contrast index of each macroblock is calculated with weights dependent on the texture randomness index of the reference image (the constituent image in our case) for each macroblock. The calculated texture randomness is also the basis for the edge-based structural index . Both sub-metrics are calculated for regions of interest (ROIs), selected from each of the constituent images and the corresponding ROIs detected in the stitched images, and are subject to quality evaluation. Since the third component of the MIQM—spatial motion index—is partially dependent on the local entropy, it was not utilized in our study due to the use of three entropy-based features. The next two features ( and ) are the variances of these sub-metrics ( and K).
The last feature () included in the developed combined CombSIQE metric, is the absolute difference of standard deviations calculated for the stitched and respective constituent images (obviously the values are averaged for 4 or 5 constituent images, depending on the number of them available in the ISIQA dataset). The optimization procedure of the parameters (weights and exponents) of the combined metric was conducted in a MATLAB environment using the Nelder–Mead method implemented in the fminsearch function. Some additional experiments, however, leading to worse results (PLCC = 0.8425, refer to Table 1 for comparison), were also conducted using neural networks. The illustration of the experimental procedure is presented in Figure 3.

Table 1.
Correlations with subjective scores obtained for the ISIQA database using the proposed combined metric and previously proposed methods. The best results are presented in bold.
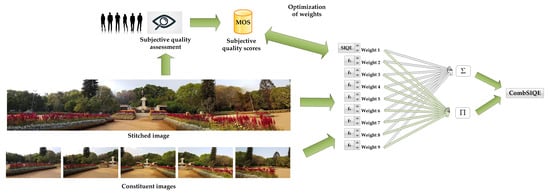
Figure 3.
Illustration of the experimental procedure used in the paper.
4. The Experimental Results
In the original paper [20], the ISIQA database was randomly divided into 80% training and 20% testing sets (21 and 5 scenes, respectively) to train the SIQE so it led to an obvious increase in correlation due to the smaller testing set. Significantly lower values were obtained by testing the SIQE metric on the whole dataset, which is a typical approach in the general-purpose IQA. Hence, the results of the experiments obtained for all 264 images from the ISIQA dataset using the proposed approach and a comparison of these results with the previously proposed methods are presented in Table 1. To illustrate the necessity and influence of each feature and each part of the model on the obtained performance, the results of the ablation study are presented in Table 2.
Table 2.
The results of the ablation study—correlations with the subjective scores obtained for all 264 images from ISIQA database using the proposed combined metric and its simplified versions. The results of the proposed metrics are presented in bold.
As can be seen in the results presented in Table 2, due to the choice of the PLCC as the optimization criterion, in some cases, the removal of individual features led to a small increase in the rank-order correlation coefficients. This was partially caused by the repetition of the optimization procedure during the ablation study for each configuration of features.
An additional illustration of the linearity of the correlation of the proposed metric with the subjective MOS values provided for all images from the ISIQA database is presented in Figure 4. It contains the scatter plot obtained for the proposed CombSIQE metric, presented in comparison to the original SIQE metric. Each dot visible in the scatter plot represents a single image and in an ideal case (PLCC equal to 1), all these dots should form a straight line.
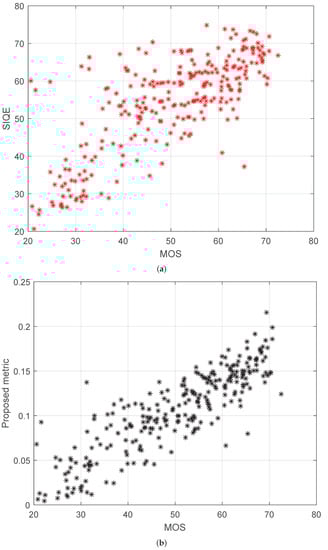
Figure 4.
Scatter plots for SIQE (a) and the proposed metric (b) obtained for the whole ISIQA dataset.
As can be clearly observed, the fundamental role of the SIQE metric in the proposed approach is certain. Comparing the results obtained for the weighted sum of the nine features and the weighted product of the same nine features, some advantages of the weighted sum can be observed. These result from the higher flexibility of this model, with 18 coefficients subjected to optimization: 9 weights (–) and 9 exponents (–). Nevertheless, only the joint application of both models aggregated into the proposed CombSIQE metric makes it possible to achieve much better performance with PLCC and SROCC values of nearly 0.87.
Some of the clearly visible outliers on the SIQE scatter plot removed using the proposed method can be observed in Figure 4, e.g., for images no. 177, 182, and 193 (MOS from 20.5896 to 24.6378 and SIQE from 57.5504 to 60.0336), images no. 168, 178, and 194 (MOS from 31.2171 to 32.8717 and SIQE from 63.1936 to 66.3105), or images no. 61 (MOS = 60.7633, SIQE = 40.8954) and 229 (MOS = 65.4083 and SIQE = 37.2225). The last two images (shown in Figure 5g,h) have many small details, whereas the six low-quality images with MOS < 35 (Figure 5a–f) contain some clearly visible ghosting artifacts, which may be easier to detect using the additionally proposed features, e.g., based on local entropy and detection of edges. In the presence of ghosting artifacts, more edges may be detected in the images and the local entropy also increases so a combination of features based on them and the SIQE leads to a significantly better correlation with the MOS values provided in the ISIQA dataset.
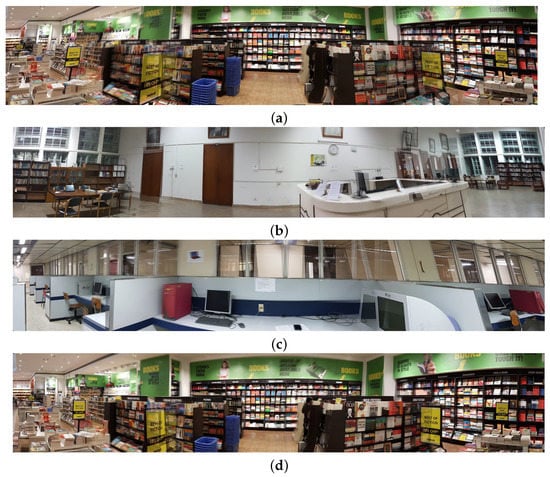
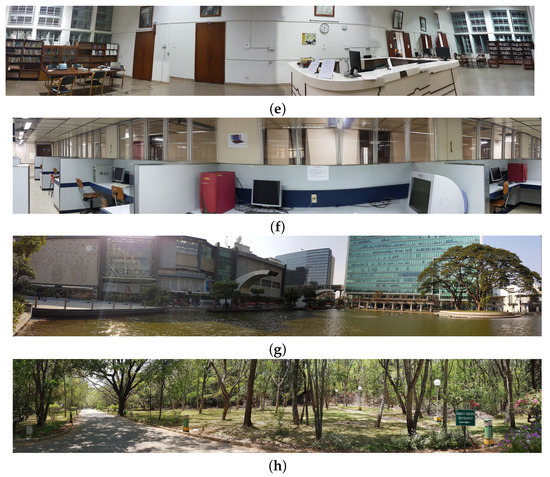
Figure 5.
Sample images from the ISIQA database representing the outliers on the scatter plot for the SIQE metric presented in Figure 4a—from (a–h): no. 177, 182, 193, 168, 178, 194, 61, and 229.
It is also worth noting that the calculation of all additional features was about 16 times faster than the calculation of the SIQE metric; hence, the overall computation cost of the designed CombSIQE metric is only about 6% higher than for the original SIQE, even with the use of parallel GPU computations using 8 cores. The experiments were conducted in a MATLAB® environment using a laptop with a 3.3 GHz AMD Ryzen 9 5900HX processor and 32 GB of RAM.
5. Conclusions
We proposed a novel quality assessment metric by combining two models based on the weighted product and weighted sum of features, which was an extension of the state-of-the-art Stitched Image Quality Evaluator [20]. The proposed metric was very effective in the automatic quality assessment of stitched images due to the novel combination of two models based on the weighted product and weighted sum of features. Considering the obtained high prediction accuracy, which linearly correlated with the subjective quality evaluation, it outperformed the state-of-the-art metric. Analyzing the correlation with the MOS values in the ISIQA database, high prediction monotonicity was also obtained, which was measured by two rank-order correlation coefficients (SROCC and KROCC).
The conducted experiments confirmed the relevance of the SIQE metric, which played a fundamental role in the designed solution. Nevertheless, the additional features were useful as extensions of this metric, particularly due to the different “nature” of the image data. Contrary to the SIQE metric itself, by using the additional features it was also possible to obtain a significantly better correlation with the MOS values provided in the ISIQA dataset for images containing ghosting artifacts or small details as illustrated in Figure 5.
Considering the directions of further research, attempts to aggregate the proposed metric with some other metrics are planned. The additional verification of some other databases would be helpful in the design of an even more universal solution that is useful for the assessment of stitched images.
Author Contributions
Conceptualization, K.O.; methodology, K.O.; software, K.O. and M.K.; validation, K.O. and M.K.; formal analysis, K.O.; investigation, K.O.; resources, K.O. and M.K.; data curation, K.O. and M.K.; writing—original draft preparation, K.O.; writing—review and editing, K.O.; visualization, K.O.; supervision, K.O. All authors have read and agreed to the published version of the manuscript.
Funding
This research is partially supported by the ZUT Highfliers School (Szkoła Orłów ZUT) project within the framework of the program of the Minister of Education and Science (Grant No. MNiSW/2019/391/DIR/KH, POWR.03.01.00-00-P015/18), co-financed by the European Social Fund.
Institutional Review Board Statement
Not applicable.
Informed Consent Statement
Not applicable.
Data Availability Statement
Not applicable.
Conflicts of Interest
The authors declare no conflict of interest. The funders had no role in the design of the study; in the collection, analyses, or interpretation of data; in the writing of the manuscript; or in the decision to publish the results.
Abbreviations
The following abbreviations are used in this manuscript:
| AMD | Advanced Micro Devices |
| AVC | Advanced Video Coding |
| BRIEF | Binary Robust Independent Elementary Features |
| BRISK | Binary Robust Invariant Scalable Keypoints |
| CCSID | Color Correction-based Stitched Image Database |
| CNN | Convolutional Neural Network |
| CVIQD | Compressed VR Image Quality Database |
| DoG | Difference of Gaussians |
| FAST | Features from Accelerated Segment Test |
| FREAK | Fast Retina Keypoint |
| FR IQA | Full-Reference Image Quality Assessment |
| FSIM | Feature Similarity |
| GGD | Generalized Gaussian Distribution |
| GMM | Gaussian Mixture Model |
| HEVC | High-Efficiency Video Coding |
| HMD | Head-Mounted Displays |
| iCID | improved Color Image Difference |
| ISIQA | Indian Institute of Science Stitched Image Quality Assessment (dataset) |
| JPEG | Joint Photographic Experts Group |
| KROCC | Kendall Rank Order Correlation Coefficient |
| MIQM | Multi-view Image Quality Measure |
| MOS | Mean Opinion Scores |
| MVAQD | Multi-Distortion Visual Attention Quality Dataset |
| NR IQA | No-Reference Image Quality Assessment |
| NRQQA | No-Reference Quantitative Quality Assessment |
| OIQA | Omnidirectional Image Quality Assessment |
| OR | Outlier Ratio |
| ORB | Oriented FAST and Rotated BRIEF |
| PLCC | Pearson’s Linear Correlation Coefficient |
| RAM | Random Access Memory |
| RANSAC | RANdom SAmpling Consensus |
| RMSE | Root Mean Squared Error |
| ROI | region of interest |
| SIFT | Scale Invariant Feature Transform |
| SIQE | Stitched Image Quality Evaluation |
| SROCC | Spearman Rank Order Correlation Coefficient |
| SSIM | Structural Similarity |
| SURF | Speeded-Up Robust Features |
| SVM | Support Vector Machine |
| SVR | Support Vector Regression |
| UAV | unmanned aerial vehicle |
| VQEG | Video Quality Experts Group |
| VSLAM | Visual Simultaneous Localization and Mapping |
| VR | Virtual Reality |
References
- Liu, L.; Guo, L.; Dong, N.; Tian, W.; Li, C.; Zhang, F. The Research and Application of Image Stitching in the Robot Target Recognition. In Lecture Notes in Electrical Engineering; Springer: Berlin/Heidelberg, Germany, 2012; pp. 105–111. [Google Scholar] [CrossRef]
- Zhou, L.; Tian, Y.; Lu, G.; Wu, X.; Zhang, Q. Linear Protection Grid Optimized Image Stitching for Mobile Robots. In Proceedings of the 2019 IEEE International Conference on Real-time Computing and Robotics (RCAR), Irkutsk, Russia, 4–9 August 2019. [Google Scholar] [CrossRef]
- Ulrich, M.; Forstner, A.; Reinhart, G. High-accuracy 3D image stitching for robot-based inspection systems. In Proceedings of the 2015 IEEE International Conference on Image Processing (ICIP), Quebec City, QC, Canada, 27–30 September 2015. [Google Scholar] [CrossRef]
- Schlagenhauf, T.; Brander, T.; Fleischer, J. A stitching algorithm for automated surface inspection of rotationally symmetric components. CIRP J. Manuf. Sci. Technol. 2021, 35, 169–177. [Google Scholar] [CrossRef]
- Xie, R.; Yao, J.; Liu, K.; Lu, X.; Liu, Y.; Xia, M.; Zeng, Q. Automatic multi-image stitching for concrete bridge inspection by combining point and line features. Autom. Constr. 2018, 90, 265–280. [Google Scholar] [CrossRef]
- Samsudin, S.; Adwan, S.; Arof, H.; Mokhtar, N.; Ibrahim, F. Development of Automated Image Stitching System for Radiographic Images. J. Digit. Imaging 2012, 26, 361–370. [Google Scholar] [CrossRef] [PubMed]
- Lowe, D. Object recognition from local scale-invariant features. In Proceedings of the Seventh IEEE International Conference on Computer Vision, Kerkyra, Greece, 20–27 September 1999. [Google Scholar] [CrossRef]
- Bay, H.; Tuytelaars, T.; Gool, L.V. SURF: Speeded Up Robust Features. In Computer Vision—ECCV 2006; Springer: Berlin/Heidelberg, Germany, 2006; pp. 404–417. [Google Scholar] [CrossRef]
- Rosten, E.; Drummond, T. Fusing points and lines for high performance tracking. In Proceedings of the Tenth IEEE International Conference on Computer Vision (ICCV’05), Beijing, China, 17–21 October 2005; Volume 1. [Google Scholar] [CrossRef]
- Calonder, M.; Lepetit, V.; Strecha, C.; Fua, P. BRIEF: Binary Robust Independent Elementary Features. In Computer Vision—ECCV 2010; Springer: Berlin/Heidelberg, Germany, 2010; pp. 778–792. [Google Scholar] [CrossRef]
- Rublee, E.; Rabaud, V.; Konolige, K.; Bradski, G. ORB: An efficient alternative to SIFT or SURF. In Proceedings of the 2011 International Conference on Computer Vision, Barcelona, Spain, 6–13 November 2011. [Google Scholar] [CrossRef]
- Leutenegger, S.; Chli, M.; Siegwart, R.Y. BRISK: Binary Robust invariant scalable keypoints. In Proceedings of the 2011 International Conference on Computer Vision, Barcelona, Spain, 6–13 November 2011. [Google Scholar] [CrossRef]
- Alahi, A.; Ortiz, R.; Vandergheynst, P. FREAK: Fast Retina Keypoint. In Proceedings of the 2012 IEEE Conference on Computer Vision and Pattern Recognition, Providence, RI, USA, 16–21 June 2012. [Google Scholar] [CrossRef]
- Huang, W.; Han, X. An Improved RANSAC Algorithm of Color Image Stitching. In Lecture Notes in Electrical Engineering; Springer: Berlin/Heidelberg, Germany, 2013; pp. 21–28. [Google Scholar] [CrossRef]
- Guo, L.S.; Dong, N.Q.; Tian, W.; Li, C.X.; Zhang, F.Z. The Application of Image Stitching in the Robot Target Recognition. Adv. Mater. Res. 2011, 327, 149–152. [Google Scholar] [CrossRef]
- Dong, Y.; Pei, M.; Zhang, L.; Xu, B.; Wu, Y.; Jia, Y. Stitching Videos from a Fisheye Lens Camera and a Wide-Angle Lens Camera for Telepresence Robots. Int. J. Soc. Robot. 2021, 14, 733–745. [Google Scholar] [CrossRef]
- Lee, W.T.; Chen, H.I.; Chen, M.S.; Shen, I.C.; Chen, B.Y. High-resolution 360 Video Foveated Stitching for Real-time VR. Comput. Graph. Forum 2017, 36, 115–123. [Google Scholar] [CrossRef]
- Limonov, A.; Yu, X.; Juan, L.; Lei, C.; Jian, Y. Stereoscopic realtime 360-degree video stitching. In Proceedings of the 2018 IEEE International Conference on Consumer Electronics (ICCE), Las Vegas, NV, USA, 12–14 January 2018. [Google Scholar] [CrossRef]
- Meng, X.; Wang, W.; Leong, B. SkyStitch: A Cooperative Multi-UAV-based Real-time Video Surveillance System with Stitching. In Proceedings of the 23rd ACM International Conference on Multimedia, Brisbane, Australia, 26–30 October 2015. [Google Scholar] [CrossRef]
- Madhusudana, P.C.; Soundararajan, R. Subjective and Objective Quality Assessment of Stitched Images for Virtual Reality. IEEE Trans. Image Process. 2019, 28, 5620–5635. [Google Scholar] [CrossRef]
- Hou, J.; Lin, W.; Zhao, B. Content-Dependency Reduction With Multi-Task Learning In Blind Stitched Panoramic Image Quality Assessment. In Proceedings of the 2020 IEEE International Conference on Image Processing (ICIP), Abu Dhabi, United Arab Emirates, 25–28 October 2020. [Google Scholar] [CrossRef]
- Duan, H.; Zhai, G.; Min, X.; Zhu, Y.; Fang, Y.; Yang, X. Perceptual Quality Assessment of Omnidirectional Images. In Proceedings of the 2018 IEEE International Symposium on Circuits and Systems (ISCAS), Florence, Italy, 27–30 May 2018. [Google Scholar] [CrossRef]
- Wang, X.; Chai, X.; Shao, F. Quality assessment for color correction-based stitched images via bi-directional matching. J. Vis. Commun. Image Represent. 2021, 75, 103051. [Google Scholar] [CrossRef]
- Cheung, G.; Yang, L.; Tan, Z.; Huang, Z. A Content-Aware Metric for Stitched Panoramic Image Quality Assessment. In Proceedings of the 2017 IEEE International Conference on Computer Vision Workshops (ICCVW), Venice, Italy, 22–29 October 2017. [Google Scholar] [CrossRef]
- Sun, W.; Gu, K.; Ma, S.; Zhu, W.; Liu, N.; Zhai, G. A Large-Scale Compressed 360-Degree Spherical Image Database: From Subjective Quality Evaluation to Objective Model Comparison. In Proceedings of the 2018 IEEE 20th International Workshop on Multimedia Signal Processing (MMSP), Vancouver, BC, Canada, 29–31 August 2018. [Google Scholar] [CrossRef]
- Zheng, X.; Jiang, G.; Yu, M.; Jiang, H. Segmented Spherical Projection-Based Blind Omnidirectional Image Quality Assessment. IEEE Access 2020, 8, 31647–31659. [Google Scholar] [CrossRef]
- VQEG. Final Report from the Video Quality Experts Group on the Validation of Objective Models of Video Quality Assessment Phase II; Technical Report; Video Quality Experts Group, 2003; Available online: https://vqeg.org/VQEGSharedFiles/Publications/Validation_Tests/FRTV_Phase2/FRTV_Phase2_Final_Report.pdf (accessed on 10 July 2022).
- Sheikh, H.; Sabir, M.; Bovik, A. A Statistical Evaluation of Recent Full Reference Image Quality Assessment Algorithms. IEEE Trans. Image Process. 2006, 15, 3440–3451. [Google Scholar] [CrossRef]
- Solh, M.; AlRegib, G. MIQM: A novel Multi-view Images Quality Measure. In Proceedings of the 2009 International Workshop on Quality of Multimedia Experience, San Diego, CA, USA, 29–31 July 2009. [Google Scholar] [CrossRef]
- Solh, M.; AlRegib, G. MIQM: A Multicamera Image Quality Measure. IEEE Trans. Image Process. 2012, 21, 3902–3914. [Google Scholar] [CrossRef] [PubMed]
- Okarma, K.; Chlewicki, W.; Kopytek, M.; Marciniak, B.; Lukin, V. Entropy-Based Combined Metric for Automatic Objective Quality Assessment of Stitched Panoramic Images. Entropy 2021, 23, 1525. [Google Scholar] [CrossRef] [PubMed]
- Qureshi, H.; Khan, M.; Hafiz, R.; Cho, Y.; Cha, J. Quantitative quality assessment of stitched panoramic images. IET Image Process. 2012, 6, 1348–1358. [Google Scholar] [CrossRef]
- Wang, Z.; Bovik, A.; Sheikh, H.; Simoncelli, E. Image Quality Assessment: From Error Visibility to Structural Similarity. IEEE Trans. Image Process. 2004, 13, 600–612. [Google Scholar] [CrossRef] [PubMed]
- Bellavia, F.; Colombo, C. Dissecting and Reassembling Color Correction Algorithms for Image Stitching. IEEE Trans. Image Process. 2018, 27, 735–748. [Google Scholar] [CrossRef] [PubMed]
- Zhang, L.; Zhang, L.; Mou, X.; Zhang, D. FSIM: A Feature Similarity Index for Image Quality Assessment. IEEE Trans. Image Process. 2011, 20, 2378–2386. [Google Scholar] [CrossRef]
- Preiss, J.; Fernandes, F.; Urban, P. Color-Image Quality Assessment: From Prediction to Optimization. IEEE Trans. Image Process. 2014, 23, 1366–1378. [Google Scholar] [CrossRef]
- Xu, W.; Mulligan, J. Performance evaluation of color correction approaches for automatic multi-view image and video stitching. In Proceedings of the 2010 IEEE Computer Society Conference on Computer Vision and Pattern Recognition (CVPR), San Francisco, CA, USA, 13–18 June 2010. [Google Scholar] [CrossRef]
- Yu, S.; Li, T.; Xu, X.; Tao, H.; Yu, L.; Wang, Y. NRQQA: A No-Reference Quantitative Quality Assessment Method for Stitched Images. In Proceedings of the ACM Multimedia Asia, Beijing, China, 15–18 December 2019; pp. 1–6, Article No. 14. [Google Scholar] [CrossRef]
- Okarma, K. Combined image similarity index. Optical Rev. 2012, 19, 349–354. [Google Scholar] [CrossRef]
- Okarma, K.; Lech, P.; Lukin, V.V. Combined Full-Reference Image Quality Metrics for Objective Assessment of Multiply Distorted Images. Electronics 2021, 10, 2256. [Google Scholar] [CrossRef]
- Oszust, M. Decision Fusion for Image Quality Assessment using an Optimization Approach. IEEE Signal Process. Lett. 2016, 23, 65–69. [Google Scholar] [CrossRef]
- Ullah, H.; Afzal, S.; Khan, I.U. Perceptual Quality Assessment of Panoramic Stitched Contents for Immersive Applications: A Prospective Survey. Virtual Real. Intell. Hardw. 2022, 4, 223–246. [Google Scholar] [CrossRef]
- Okarma, K.; Kopytek, M. Application of Image Entropy Analysis for the Quality Assessment of Stitched Images. In Progress in Image Processing, Pattern Recognition and Communication Systems; Choraś, M., Choraś, R.S., Kurzyński, M., Trajdos, P., Pejaś, J., Hyla, T., Eds.; Springer International Publishing: Cham, Switzerland, 2022; pp. 125–132. [Google Scholar] [CrossRef]
- Liu, Z.; Mo, Z. Combining Local and Global Features for Quality Assessment of Stitched Images in Virtual Reality. In Proceedings of the 2021 9th International Conference on Information Technology: IoT and Smart City, Guangzhou, China, 22–25 December 2021. [Google Scholar] [CrossRef]
- Mittal, A.; Moorthy, A.K.; Bovik, A.C. No-Reference Image Quality Assessment in the Spatial Domain. IEEE Trans. Image Process. 2012, 21, 4695–4708. [Google Scholar] [CrossRef] [PubMed]


Publisher’s Note: MDPI stays neutral with regard to jurisdictional claims in published maps and institutional affiliations. |
© 2022 by the authors. Licensee MDPI, Basel, Switzerland. This article is an open access article distributed under the terms and conditions of the Creative Commons Attribution (CC BY) license (https://creativecommons.org/licenses/by/4.0/).