Featured Application
With the development of cold chain logistics in recent years, the market of refrigerated cabinets has developed rapidly, the demand for intelligent refrigerated cabinets has increased significantly, and the demand for refrigerated cabinets has grown greatly in the household and commercial markets. However, the differences in temperature and humidity between different layers of refrigerated display cabinets are large, so it is difficult to ensure the consistency of meat quality on different layers of display cabinets, which may affect the health of consumers. In order to improve the refrigeration effect of the open refrigerated display cabinet, five kinds of shelf structures with different opening rates are designed. The experimental results show that different aperture ratio have significant influence on the temperature distribution of each layer in the cabinet.
Abstract
(1) Background: With the development of cold chain logistics in recent years, the demand for refrigerated display cases has greatly increased in the home and commercial markets. However, the difference of temperature and humidity between each layer of refrigerated display cabinet is great, which affects the health of consumers. In order to reduce the temperature difference for each layer in a cabinet and to improve the temperature uniformity inside the cabinet, an open-hole shelf is designed according to the principle of aerodynamics. (2) Methods: The influence of different shelf aperture ratios on the periodic temperature fluctuation, average temperature, temperature non-uniformity coefficient, and temperature maintenance coefficient inside the cabinet is studied by means of experiments with pork. (3) Results: The results show that when the aperture ratio increases from 0% to 90%, the average maximum temperature in a single cycle in the cabinet shows a trend of first decreasing and then increasing. The minimum temperature difference in the cabinet is 4.3 °C, and the corresponding aperture ratio is 25%. (4) Conclusions: The results show that 25% is the optimal aperture ratio for a shelf in the refrigerated display cabinet. The results provide a better reference for optimization of the structure and temperature in an open refrigerated display cabinet.
1. Introduction
Refrigerated display cases effectively prevent food spoilage and prolong the sales time of food [1]. Open display cases have the advantages of a good display effect and convenience for customers looking to buy, and they are widely used in supermarkets [2,3]. From the current research situation, the display cabinet performance research capacity mainly includes the three aspects of heat load, air curtain, and energy savings. Studies have shown that the latent heat load caused by wet air accounts for 11%, which has a great influence on the performance of the display cabinet. By studying the influence of wind speed, environmental humidity, and radiation on the wind curtain, an optimal value of air supply velocity was found, and radiation was considered to be closer to the experimental value. Researchers have compared experimental data and simulation results to find the key factors affecting the air curtain and put forward efficient and energy-saving measures to improve the air curtain. Adding fog flow to the turbulence model could improve the performance of the display cabinet. In the calculations made in most of the studies above, the display cabinet was in a no-load state, and the distribution of food temperature under a load state was not considered [2].
Vertical refrigerated display cabinets adopt a multilayer shelf design to increase the space for storing food, resulting in inconsistent temperature distribution across the different layers and a trend of gradually increasing temperature in the vertical direction from top to bottom [4,5]. How to improve the uniformity of this temperature distribution in the cabinet has become a hot research topic for experts and scholars in recent years. The temperature distribution in a refrigerated display cabinet is not uniform. In the vertical direction, there is a temperature difference between different shelves, with the temperature from the top to the bottom shelf of the refrigerated display cabinet displaying a rising trend and the bottom shelf area temperature being the highest. In the direction of the transverse, the temperature gradient at the front end of each shelf of the leeward board and refrigerated display cabinet is relatively large.
The design of the structure, such as the board, shelf, and wind curtain, is unreasonable. The problems of uneven temperature distribution and high energy consumption in vertical refrigerated display cabinets have been studied by a large number of researchers. These studies mainly focused on four aspects: improving the defrosting formula, optimizing the air curtain, optimizing the cooling system, and optimizing the structure. In terms of improving defrosting methods, defrosting with refrigerant liquid after condensation is beneficial to improving the refrigeration efficiency of the refrigeration system as compared with defrosting by electric heating. Moreover, the temperature fluctuation of food in the cabinet is smaller, which is conducive to ensuring the quality of refrigerated food, and the frost layer easily falls off. In terms of air curtain optimization, studies have optimized the speed ratio of the double-layer air curtain of a vertical refrigerated display cabinet. The optimization scheme of the double-layer air curtain velocity was determined by the method of testing and modeling. When the velocity of the outer-layer air curtain is 0.455 m/s and the velocity of the inner-layer air curtain is 0.717 m/s, it can meet the requirements of low temperature in the cabinet and minimize the cold air spill-over [4].
The optimization of the display cabinet air curtain [6,7,8,9,10], air outlet [11,12], leeward plate [8,13], and shelf [14,15,16,17] is an important measure to improve the temperature distribution uniformity in the cabinet. Feng Xin et al. [18] designed a double-layer air curtain and found through CFD simulation that setting a baffle at the return air outlet of the display cabinet could effectively reduce the return air temperature of the air curtain, thus reducing the thermal load of the display cabinet. Axell et al. [19] analyzed the flow and heat transfer of air outlets with different aspect ratios, and the results showed that the performance of the air curtain improved with decreasing aspect ratio of the air outlet—the wider the air curtain outlet, the better the performance. Wu et al. [13] studied the influence of the leeward plate structure on the flow and heat transfer performance of the display cabinet through experiments and simulations; the results showed that when the aperture ratio of the backplane was 2−3%, the outlet air volume of the leeward plate was 30%, which could effectively resist the air intrusion of the end environment and improve the performance of the refrigerated display cabinet. In the case of a certain number of opening holes, the influence of the opening position on the flow and heat transfer characteristics in the cabinet should be considered. Jouhara et al. [14] studied the influence of heat pipe racks on the temperature distribution in cabinets, and the results showed that heat pipe racks could improve the heat transfer between racks in cabinets and products, so the energy efficiency of heat pipes could improve the uniformity of the temperature distribution in cabinets. Sun [15] et al. showed that installing air guide strips on the shelf mountain could reduce the temperature of food in the cabinet and improve the temperature uniformity. Li Weiping [16] proposed to fill the cold storage shelf with phase-change material to reduce temperature fluctuation in order to solve the problem of large temperature rise in the cabinet during defrosting. According to the movement law of hot and cold air flow [20], the sinking of cold air and the rising of hot air can improve the uniformity of the temperature distribution in the cabinet to a certain extent. Therefore, the shelf can be designed to be open, but with an increase in the aperture ratio, the stability of the wind curtain will be reduced. Based on the above reasoning, it was necessary to put aside the size of the aperture ratio in studies.
In this paper, based on the sales demand of livestock, poultry, and aquatic products, shelves with different aperture ratios were designed to explore the influence of different aperture ratios on the temperature field in refrigerated display cabinets, providing a certain reference for the optimization of this temperature field.
2. Materials and Methods
2.1. Structure of the Display Cabinet
The structure of the display cabinet is shown in Figure 1a. The display cabinet was produced by Guangzhou Guangxiang Refrigeration Equipment Co., Ltd. (Guangzhou, China), with a single cooling capacity of 3000 W and two compressors.
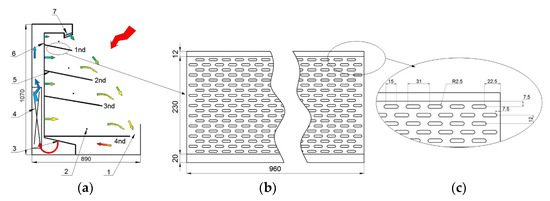
Figure 1.
Display cabinet structure and shelf schematic diagram: (a) display cabinet structure drawing; (b) shelf structure diagram; (c) shelf local diagram. 1. Return air port; 2. Temperature and humidity sensor; 3. Fan; 4. Vaporator; 5. Shelf; 6. Backplane air outlet; 7. Wind curtain outlet.
The length, width, and height of the refrigerated space of the display cabinet were 1920 mm × 890 mm × 1070 mm. There were four shelves in the cabinet, which were the first, second, third, and fourth layers, respectively, from top to bottom. On each layer, 3 temperature and humidity integrated sensors (AQ3020, Temperature measurement range −20~80 °C, accuracy ±0.3%; humidity measurement range of 0~100%, accuracy ±3%, Guangzhou Aosong Electronics Co., Ltd., Guangzhou, China) were evenly placed. All the sensors were connected through two digital recorders (model: SIN-R9600, accuracy 2%, Hangzhou Joint Measurement Automation Technology Co., Ltd., Hangzhou, China), and the data were recorded and displayed on the recorders with a recording interval of 1 s.
2.2. Test Levels
China is the largest pork consumer in the world [21], but recently, due to African Swine fever, domestic pork prices have remained high [22]. Pork is a fresh agricultural product with high perishability and vulnerability [23], so it is necessary to study the preservation of pork. In this experiment, fresh pork purchased at the market was taken as the test object to study the temperature field distribution in the open refrigerated display cabinet when pork was used as the filling product.
In this paper, five different shelf openings were designed with respective aperture ratios of 0%, 12.5%, 25%, 50%, and 90% (as shown in Figure 1b,c and Appendix A). The shelves with 0% aperture ratio were the shelves that came with the refrigerated display cabinet. The 12.5%, 25%, and 50% aperture ratio shelves were custom-made using 2 mm-thick 201 iron plate punching processing, with the surface then covered with black baking paint. The 90% open aperture shelf was also customized, but because its open aperture ratio is larger, iron plate punching processing could not be used. Instead, 3 mm diameter 304 stainless steel welding was used to produce the shelf, and the surface was covered with black baking paint. The fourth layer (as shown in Figure 1) is below the return air duct, so the use of an open shelf in this layer would lead to airflow disorder, affecting the wind curtain structure; therefore, in the test, the aperture ratio was changed for only the layer 1–3 shelves to change the display cabinet shelf aperture ratio.
2.3. Test Method
2.3.1. Processing Steps
The test was carried out in an air-conditioned room on 14 August 2020. The air conditioner was set at 25 °C, the temperature near the display cabinet was measured to be 27 ± 1 °C, and the research route is shown in Figure 2a. The display cabinet was run for 1 day before the test to reduce the influence of the first refrigeration on the temperature field in the cabinet, and the temperature should be set to 0–4 °C. Fresh pork (60 kg) was purchased at the Changban wet market (Tianhe District, Guangzhou, China) at 7:00 a.m. on the day of the experiment, and it was divided into several pieces with a mass of 0.5–1 kg for each piece. The pieces were transported back to the laboratory within 15 min and evenly placed on the shelves of the display cabinet on the 4th floor (as shown in Figure 2b). After the pork was placed, the display cabinet continued to run until 9:00 a.m., and the refrigeration unit of the display cabinet was closed to reduce the influence of frost caused by the evaporator. When the temperature rose to 4 °C, the test began. During the test, the start-stop time of the refrigeration unit and the temperature in the display cabinet were recorded, and three consecutive start-stop cycles were recorded. With the completion of a level of the open aperture ratio test, the open aperture shelves were replaced with another kind, the refrigeration unit was once again shut down until the temperature rose to 4 °C, and the next group of tests began.
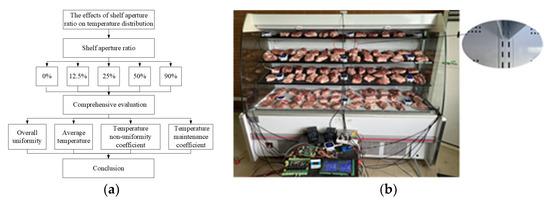
Figure 2.
Test methods and equipment. (a) The research route; (b) photograph of the setup for the pork cold storage test.
2.3.2. Statistical Methods
In order to reveal the rule of the influence of each aperture ratio of the display cabinet shelf on the temperature distribution in the cabinet, the average temperature, the overall uniformity and non-uniformity coefficient, and the temperature maintenance coefficient are introduced as comprehensive evaluation indices [24,25].
The overall uniformity is expressed by the following formula:
where R is the overall uniformity, °C; Tmax is the max temperature in the cabinet, °C; and Tmin is the min temperature in the cabinet, °C.
The non-uniformity coefficient can be expressed by the following formula:
In the formula, S is the non-uniformity coefficient; the smaller its value, the more uniform the temperature distribution. ti is the temperature of the ith measurement point, °C; tn is the average temperature of n measuring points, °C. In this paper, n = 12.
The temperature maintenance coefficient can be expressed as follows:
where α is the temperature maintenance coefficient; Ts is the heating time within a single period, s; and Tj is the cooling time within a single cycle, s.
3. Results
3.1. Temperature Distribution in the Cabinet (0%)
Figure 3 shows the temperature distribution of each layer over time when the shelf aperture ratio was 0% (i.e., the original shelves). As can be seen from Figure 3, the lowest temperature in the cabinet, 2.2 °C, occurred at the first floor. The highest temperature, 10.9 °C, occurred in the fourth layer. The shelf temperature in the cabinet showed a trend of layer-by-layer increase from the first layer to the fourth layer, and the temperature stratification phenomenon was more serious, with a maximum temperature difference of 7.4 °C.
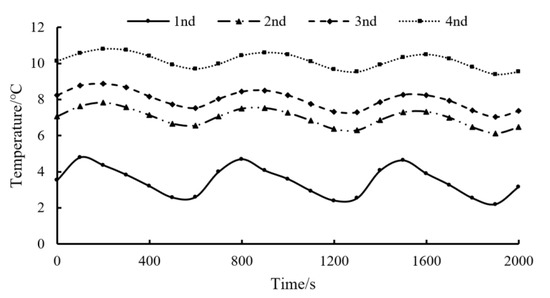
Figure 3.
Periodic variation in the temperature on each shelf (0% aperture ratio).
As shown in Figure 3, each layer temperature did not immediately fall but first rose after a period of time to a peak when the refrigeration compressor was turned on. Then, each layer temperature began to drop. This may be due to the start-up process of the refrigeration unit. First, the unit reduces the temperature of the working medium itself, then reduces the temperature of the evaporator before the final heat exchange with the hot air, reducing the temperature of the air. This time in the cooling process is called the cooling lag time. As can be seen from the figure, the cooling lag times of the shelves in each layer were not consistent; from the first layer to the fourth layer, the lag times were 115 s, 183 s, 202 s, and 241 s, respectively. This may be because the temperature of the first floor is mainly affected by the air from the leeward plate and the wind curtain, so its cooling lag time is short. For each other layer, the wind curtain effects gradually abate but they still receive the influence of outside hot air; thus, as the position is lower, the wind curtain effect is poorer, and the influence of hot air is greater, so the temperature lag time is longer. In order to reduce the temperature overshoot caused by the opening of the refrigeration unit, the strategy of opening the refrigeration unit in advance can be adopted; optimization of this control strategy will be studied in the future.
3.2. Influence of Different Aperture Ratios on the Temperature in the Cabinet
Figure 4 shows the temperature distribution of each layer in the cabinet for shelves of different aperture ratios (average temperature in a single cycle). It can be seen from the graph that with increasing open porosity, the cabinet temperature first presented a drop, followed by a rising trend; the highest temperature fell from 10.2 °C to 5.6 °C and then increased to 10.9 °C.
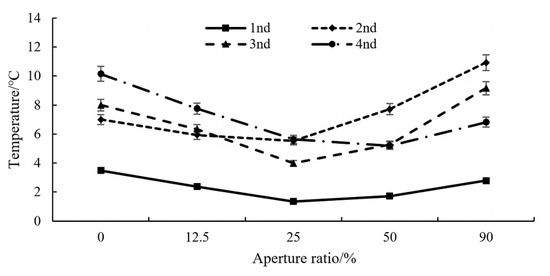
Figure 4.
The influence of different aperture ratios on the temperature of each shelf inside the cabinet.
In order to represent the overall temperature conditions in the cabinet, the overall uniformity and average temperature were used to evaluate them, and the results are shown in Figure 5. The overall uniformity and average temperature first decreased and then increased with the increasing aperture ratio. At the different aperture ratios, the respective overall uniformity values were 6.7 °C, 5.4 °C, 4.6 °C, 3.8 °C, and 6.8 °C, and the minimum corresponding aperture ratio was 25%. The average temperature in the cabinet changed with the aperture ratio to 7.2 °C, 5.6 °C, 4.1 °C, 5.0 °C, and 7.4 °C; these values are consistent with the overall uniformity. It can be seen from the graph that for a frame aperture ratio of 50%, when the average temperature inside the cabinet was a barely suitable preservation temperature (0–4 °C) for animal, poultry, and aquatic products, the corresponding temperature difference was 3.8 °C only. The quality difference in each layer of product due to temperature inside the cabinet would thus decrease.
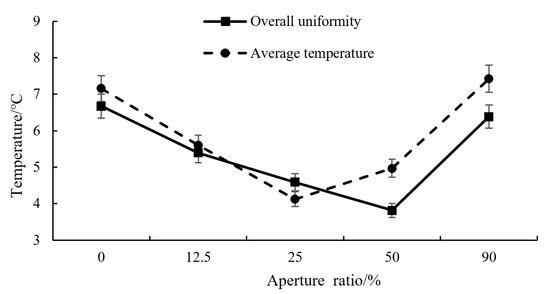
Figure 5.
The influence of different aperture ratios on the average temperature inside the cabinet.
The non-uniformity coefficient is often used as an important indicator to evaluate spatial differences [24,25]. The temperature non-uniformity coefficients in the refrigerated display cabinet are shown in Table 1. When the shelf aperture ratio was 0%, the temperature non-uniformity coefficient was 3.7, and the quality difference of each product area inside the cabinet was smaller. However, as the porosity increased from 12.5% to 90%, the unevenness coefficient fluctuated little, indicating that the increased porosity had little influence on the uniformity of the temperature distribution. From Table 1, it can be seen that, except for the small non-uniformity coefficient at a 0% aperture ratio, the difference in the non-opening coefficient of other aperture ratios was not large, which indicates that the difference between shelf openings was significant.

Table 1.
The temperature inhomogeneity coefficients under different shelf aperture ratios.
The electricity consumption of refrigerated display cabinets accounts for about 50% of the total electricity consumption of supermarkets [26]. Therefore, the energy savings and environmental protection aspects of refrigerated display cabinets are particularly important. Figure 6 presents a comparison of the cooling times and heating times with different aperture ratios in a single period. The corresponding cooling times were 505 s, 427 s, 336 s, 329 s, and 373 s. The corresponding heating times were 162 s, 160 s, 200 s, 204 s, and 185 s. The longest heating time was 204 s, and the corresponding aperture ratio was 50%. The cooling time and heating time reflect the ability to maintain the temperature in the display cabinet, and they can represent the energy conservation and environmental protection status of the refrigerated display cabinet to a certain extent. Therefore, in this paper, we evaluate the cabinet’s environmental performance through the temperature maintenance coefficient, obtained as the ratio of the cooling time and heating time; the results are shown in Table 1. It can be seen from Table 1 that the maximum temperature maintenance coefficient was 0.62, corresponding to a porosity of 50%, but there was little difference in the temperature maintenance coefficient for a porosity of 25%. Considering the temperature of each layer in the cabinet, the average temperature, the overall uniformity, the non-uniformity coefficient, the temperature maintenance coefficient, and other indicators, an aperture ratio of 25% can be considered to result in better overall performance of the refrigerated display cabinet.
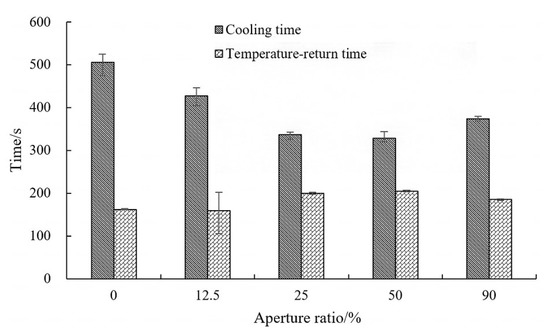
Figure 6.
The influence of different aperture ratios on the cooling and temperature-return times.
3.3. Temperature Distribution inside the Cabinet (25%)
When the shelf aperture ratio was 25%, the temperature of each layer in the cabinet changed with time as shown in Figure 7. As can be seen from Figure 7, the temperature of the four shelves and the temperature of each layer in the cabinet still presented a stratification phenomenon; however, compared with the temperature distribution for a 0% aperture ratio, there was a great improvement. The highest temperature in the cabinet decreased from the original 10.9 °C to 6.5 °C (as shown in Figure 8), and the temperature difference decreased from the original 7.4 °C to 5.4 °C. Figure 8 shows a comparison of the temperature distributions in the cabinet with 0%, 25%, and 50% shelf openings. When the aperture ratio was 0%, the temperature of layers 1–4 in the cabinet showed a trend of increasing layer by layer (as shown in Figure 8a), and the high-temperature area was wide; the temperature was highest on the right-hand side of the fourth layer. When the aperture ratio was 25% or 50%, the temperature field distribution was similar, but the highest temperature for an aperture ratio of 25% was for layer 2 in the middle, whereas when the aperture ratio was 50%, the high-temperature area on the left of the second layer was larger, which is unfavorable for food cold storage. Thus, at an aperture ratio of 25%, the regional temperature distribution inside the ark was superior to that at an aperture ratio of 50%.
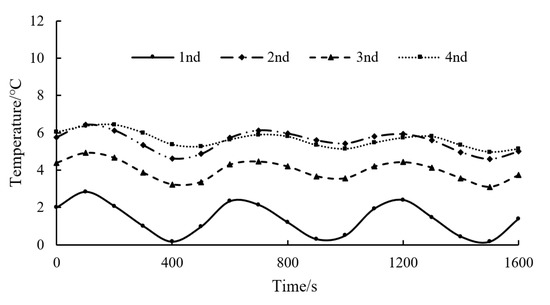
Figure 7.
The effect of a 25% aperture ratio on the temperature of each layer in the cabinet.
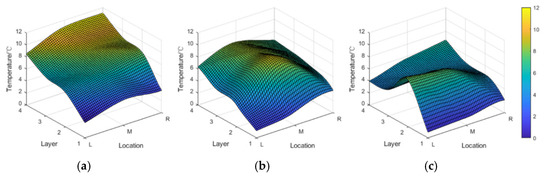
Figure 8.
Temperature distributions in the cabinet. (a) 0%. (b) 25%. (c) 50%.
4. Discussion
In order to improve the refrigeration effect of an open refrigerated display cabinet, five kinds of shelf structures with different aperture ratios were designed, and the influence of the different aperture ratios on the temperature field of each layer in the cabinet was studied through experiments.
The reason for the difference in Figure 3 may be that most of the cold air from the evaporator was distributed to the outlet of the air curtain, which reached the first to fourth layers successively. With increasing distance, the heat insulation effect of the air curtain was weakened, and the heat exchange with the outside world increased, finally leading to the phenomenon of temperature stratification.
As we can see from Figure 4, when the frame aperture ratio increased from 0% to 25%, the export from the lee plate and wind curtain blowing out cold air passed through the shelf holes down to the lower layers of constantly rising higher-temperature gas; through heat exchange, a more uniform temperature field was formed in the cabinet, so the average temperature in the cabinet was lower. However, when the shelf aperture ratio increased from 25% to 50%, most of the cold air blown from the leeboard reached the bottom of the cabinet through the shelf holes, thus weakening the gathering effect of the two air flows (as shown in Figure 1a) and reducing the effect of the wind curtain, which caused an increase in external heat and eventually led to a temperature rise in the cabinet. This is similar to the findings of Evans et al. [27,28,29].
It can be seen from the Figure 7 that each layer had a generally high temperature in the central position; this may have been due to the middle of the back being in an airtight state (as shown in Figure 2). Therefore, cold air could not flow from the lee plate into the ark, leading to the middle temperature being generally on the high side. In subsequent studies, we can consider putting an extra lee plate in the middle of the wind hole quantity to solve the problem of high temperature inside the ark.
Since the number of holes in the leeward plate and the size and angle of the air curtain air outlet can affect the temperature distribution of each layer in the cabinet, the project team will conduct further in-depth research on these factors.
5. Conclusions
This paper mainly studies the distribution of temperature distribution in an refrigerated display cabinet with different aperture ratios and obtains some parameters which are helpful to optimize the design. The results show the following:
- (1)
- When the shelf aperture ratio was 0%, the lowest temperature in the cycle operation cabinet appeared in the first layer at 2.2 °C; the highest temperature occurred in the fourth layer at 10.9 °C. The first-layer to fourth-layer shelf temperatures inside the cabinet showed a trend of layer-by-layer increase. The temperature stratification phenomenon was more serious, and the maximum temperature difference in the cabinet was 7.4 °C.
- (2)
- As the aperture ratio increased from 0% to 90%, the average maximum temperature in the cabinet decreased from 10.2 °C to 5.6 °C and then rose to 10.9 °C. The minimum temperature difference in the cabinet was 4.3 °C, and the corresponding aperture ratio was 25%. At this time, the average temperature in the cabinet was 4.1 °C, the average temperature difference was 4.3 °C, the non-uniformity coefficient was 4.9, and the temperature maintenance coefficient was 0.59. Through comprehensive evaluation, 25% was determined to be the optimum aperture ratio for the open refrigerated display cabinet shelf.
- (3)
- For the 25% shelf aperture ratio compared with 0%, the temperature distribution in the cabinet showed a great improvement. The highest temperature in the cabinet decreased from the original 10.9 °C to 6.5 °C, and the temperature difference decreased from the original 7.4 °C to 5.4 °C.
Author Contributions
Conceptualization, J.X. and E.L.; methodology, J.G.; software, X.W.; validation, Z.Z. and E.L.; writing—original draft preparation, J.X.; writing—review and editing, J.X.; visualization, J.G.; supervision, E.L.; project administration, J.G.; funding acquisition, J.G. All authors have read and agreed to the published version of the manuscript.
Funding
The authors acknowledge the Guangdong Provincial Agricultural Science and Technology Innovation and Extension Project (No. 2021KJ101), the Common Technical Innovation Team of Guangdong Province on Preservation and Logistics of Agricultural Products (No. 2022KJ145), Independent Research and Development Projects of Maoming Laboratory (2021ZZ003), and the National Key R&D Program of China (2018YFD0701002-2).
Institutional Review Board Statement
Not applicable.
Informed Consent Statement
Not applicable.
Conflicts of Interest
The authors declare no conflict of interest.
Appendix A. Shelf Design Drawing of Different Aperture Ratio

References
- Qiu, X.; Zhao, Y.; Fan, B.; Meng, Q. Research Progress on Open Refrigerated Display Cabinets. J. Refrig. Technol. 2020, 43, 55–59. [Google Scholar]
- Yanli, L.; Cao, X.; Wu, X.; Meng, Z. Numerical simulation of temperature distribution of food packages on open-type horizontal display cabinet. J. Zhengzhou Univ. Light Ind. Nat. Sci. 2013, 28, 1–6. [Google Scholar]
- Xiadong, J. Honeycomb Design Optimization of Multi-deck Refrigerated Display Cabinet Using CFD Simulation. Intern. Combust. Engine Parts 2018, 16, 200–203. [Google Scholar]
- Pei, Y.; Liu, J.; Liu, Z.; Lv, Y. Influence of shelf’s length on performance of refrigerated display cabinet. Refrig. Air-Cond. 2018, 18, 10–14. [Google Scholar]
- Gill, C.O.; Jones, T.; Houde, A. The temperature and ages of packs of beef displayed in multi-shelf retail cabinets. Food Control. 2003, 14, 145–151. [Google Scholar] [CrossRef]
- Bahman, A.; Rosarlo, L.; Rahman, M. Analysis of energy savings in a supermarket refrigeration System. Appl. Energy 2012, 98, 11–21. [Google Scholar] [CrossRef]
- Xiao, Y.; Liu, X. The analysis and research on energy efficiency standards and energy-saving technology for commercial refrigerator. Refrig. Technol. 2015, 4, 8–12. (In Chinese) [Google Scholar]
- Meng, X.; Yu, B.; Wang, F. A mathematical model of air curtain and air flow and heat transfer in vertical multi-shelf display cabinet. Fluid Mach. 2001, 2, 50–52. [Google Scholar]
- Stribling, D.; Tassou, S. A two-dimensional CFD model of a refrigerated display case. Ashrae Trans 1997, 104, 88–94. [Google Scholar]
- Foster, A.M.; Swain, M.J.; Barrett, R.; D’agaro, P.; James, S.J. Effectiveness and optimum jet velocity for a plane jet air curtain used to restrict cold room infiltration. Int. J. Refrig. 2006, 29, 692–699. [Google Scholar] [CrossRef]
- Rossetti, A.; Minettoo, S.; Marinetti, S. Numerical modelling and validation of the air flow maldistribution in the cooling duct of a horizontal display cabinet. Appl. Therm. Eng. 2015, 87, 24–33. [Google Scholar] [CrossRef]
- Zhen, B.; Wang, L. Optimization of design parameters of air outlets for horizontal open food refrigerated display cabinets. Sci. Technol. Food Ind. 2016, 37, 273–276. (In Chinese) [Google Scholar]
- Wu, X.; Chang, Z.; Yuan, P.; Lu, Y.; Ma, Q.; Yin, X. The optimization and effect of back panel structure on the performance of refrigerated display cabinet. Food Control 2014, 40, 278–285. [Google Scholar] [CrossRef]
- Jouhara, H.; Nannou, T.; Ghazal, H.; Kayyali, R.; Tassou, S.; Lester, S. Temperature and energy performance of open refrigerated display cabinets using heat pipe shelve. Enegry Procedia 2017, 123, 273–280. [Google Scholar] [CrossRef]
- Sun, J.; Tsamos, K.M.; Tassou, S.A. CFD comparisons of open type refrigerated display cabinets with without air guiding strips. Energy Procedia 2017, 123, 54–61. [Google Scholar] [CrossRef]
- Li, W. Study on Cold Storage and Heat Transfer Characteristics of a Composite Shelf Filled with Phase Change Materials. Ph.D. Thesis, Zhengzhou Institute of Light Industry, Zhengzhou, China, 2016. [Google Scholar]
- Lu, Y.L.; Zhang, W.H.; Yuan, P.; Xue, M.D.; Qu, Z.G.; Tao, W.Q. Experimental study of heat transfer intensification by using a novel combined shelf in food refrigerated display cabinets (Experimental study of a novel cabinets). Appl. Therm. Eng. 2010, 30, 85–91. [Google Scholar] [CrossRef]
- Feng, X.; Chen, J.; Mu, J. CFD optimization of double air Curtain in vertical display cabinet. J. Refrig. 2001, 2, 32–36. [Google Scholar]
- Axell, M.; Fahlen, P. Design Criteria for Energy Efficient Vertical Air Curtains in Display Cabinets. In Proceedings of the 21st International Congress of Refrigeration, Washington, DC, USA, 17–22 August 2003; International Institute of Refrigeration: Paris, France, 2003. [Google Scholar]
- Guo, Y.; Lu, S. Introduction to Fluid Mechanics; Science Press: Beijing, China, 2016. [Google Scholar]
- Li, Y.; Xue, W.; Jin, J.; Hu, J.; Qiu, Y.; Tao, F. Current status and development trend of cold chain logistics for pork of Hangzhou. J. Food Saf. Qual. 2017, 8, 1757–1762. [Google Scholar]
- Kang, H.; Xiao, H. The economic impacts of recent pork price increase in China caused by the African swine fever. Res. Agric. Mod. 2020, 41, 493–501. [Google Scholar]
- Cheng, X.; Liu, S. SWOT analysis of imported meat cold chain logistics development environment in Xi’an international land port. Econ. Res. Guide 2017, 315, 175–176. [Google Scholar]
- Xie, R.; Tang, H.; Tao, W.; Liu, G.; Liu, K.; Wu, J. Optimization of cold-plate location in refrigerated vehicles based on simulation and test of no-load temperature field. Trans. Chin. Soc. Agric. Eng. 2017, 33, 290–298, (In Chinese with English Abstract). [Google Scholar]
- Zeng, Z.; Wei, X.; Lü, E.; Liu, Y.; Yi, Z.; Guo, J. Numerical simulation and experimental verification of temperature and humidity in centralized ventilated delivery pigsty. Trans. Chin. Soc. Agric. Eng. 2020, 36, 210–217, (In Chinese with English Abstract). [Google Scholar]
- Chaomuang, N.; Flick, D.; Denis, A.; Laguerre, O. Influence of operating conditions on the temperature performance of a closed refrigerated display cabinet. Int. J. Refrig. 2019, 103, 32–41. [Google Scholar] [CrossRef]
- Evans, J.A.; Swain MV, L. Performance of retail and commercial refrigeration systems. In Proceedings of the IIR International Cold Chain Conference, Cambridge, UK, 29–31 March 2010. [Google Scholar]
- Laguerre, O.; Hoang, M.H.; Osswald, V.; Flick, D. Experimental study of heat transfer and air flow in a refrigerated display cabinet. J. Food Eng. 2012, 113, 310–321. [Google Scholar] [CrossRef]
- Gaspar, P.D.; Gonçalves, L.; Pitarma, R. Detailed CFD modelling of open refrigerated display cabinets. Model Simul. Eng. 2012, 2012, 9. [Google Scholar] [CrossRef]


Publisher’s Note: MDPI stays neutral with regard to jurisdictional claims in published maps and institutional affiliations. |
© 2022 by the authors. Licensee MDPI, Basel, Switzerland. This article is an open access article distributed under the terms and conditions of the Creative Commons Attribution (CC BY) license (https://creativecommons.org/licenses/by/4.0/).