
Probing Fast Enantio-Recognition of Drugs with Multiple Chiral Centers by Electrospray-Tandem Mass Spectrometry and Its Mechanism
 , and
, and
Abstract
:1. Introduction
2. Materials and Methods
2.1. Materials and Reagents
2.2. Solution Preparation
2.3. ESI-Q-Trap Mass Spectrometry Analysis
2.4. Computational Details
2.4.1. DFT Study
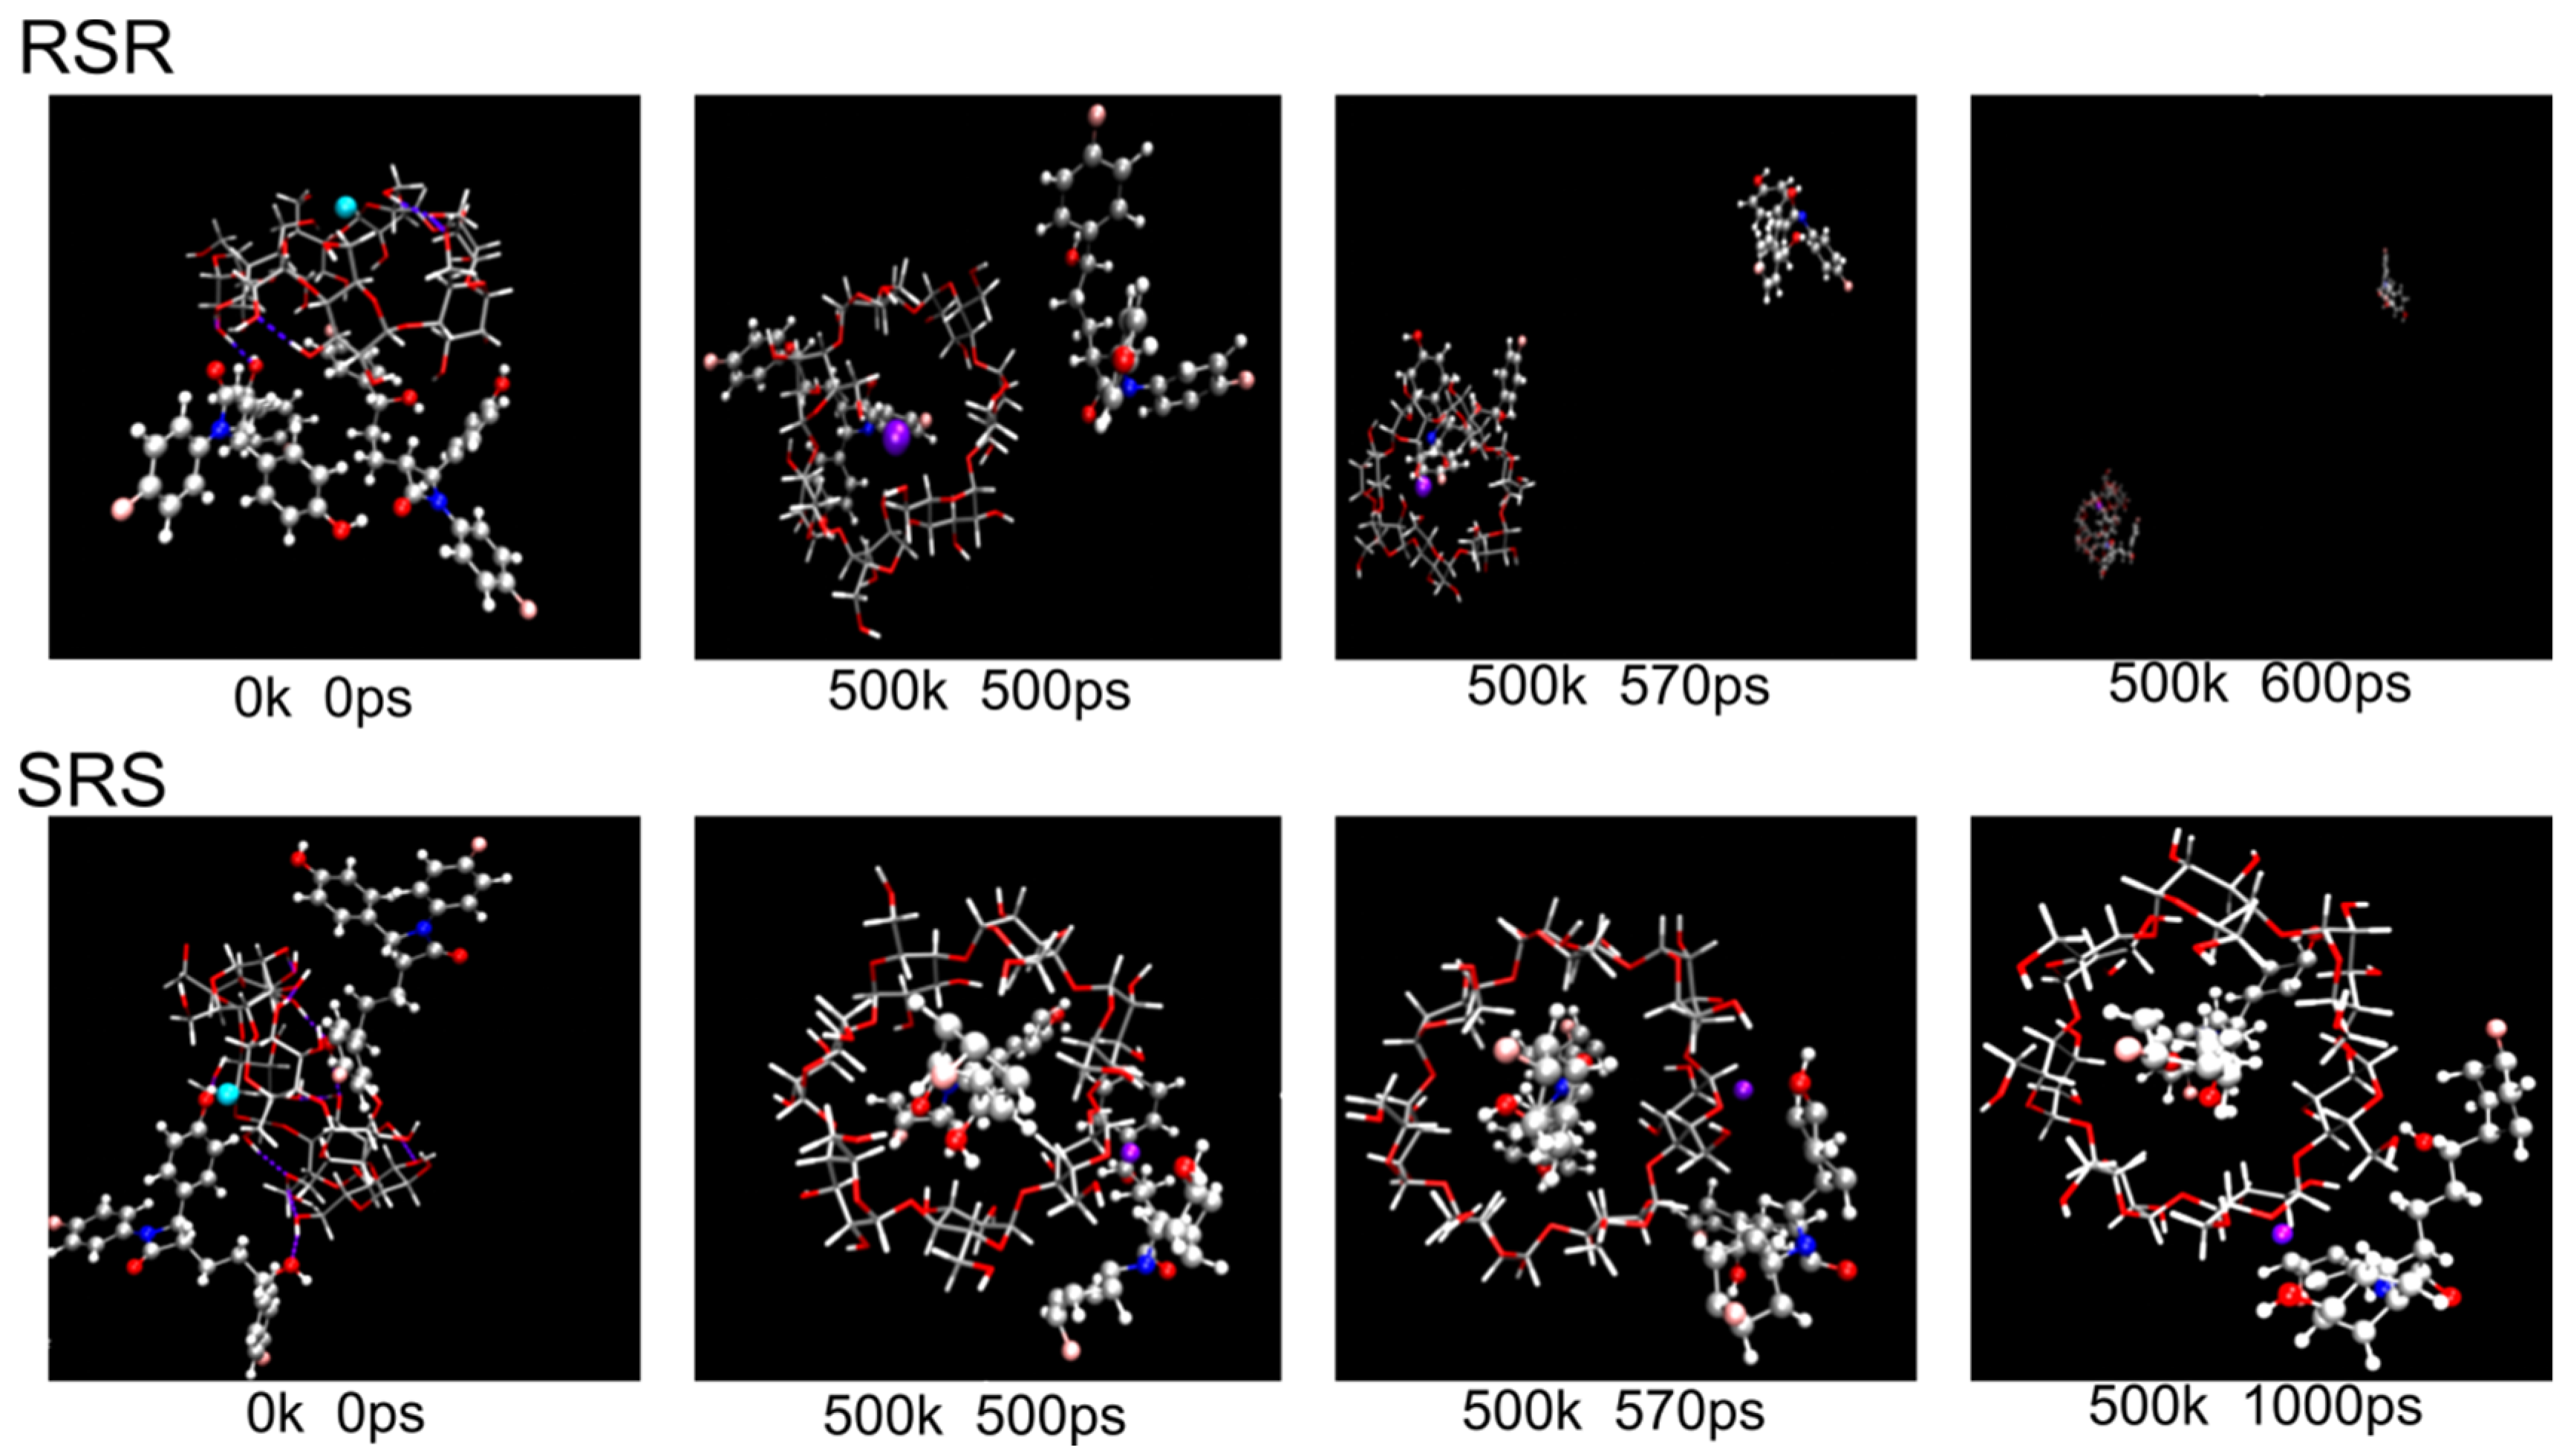
2.4.2. MD Simulation
3. Results and Discussion
3.1. ESI-MS Analysis
3.2. The Effect of Cu2+, Zn2+, Mg2+, Pb2+, Hg2+, Co2+ on Recognizing EZM Enantiomers
3.3. Cu2+ Distinguishing EZM Enantiomers
3.3.1. The Effect of CID Collision Energy to Ternary Complexes
3.3.2. The Binding Form of Ternary Complexes
3.4. Computational Calculations
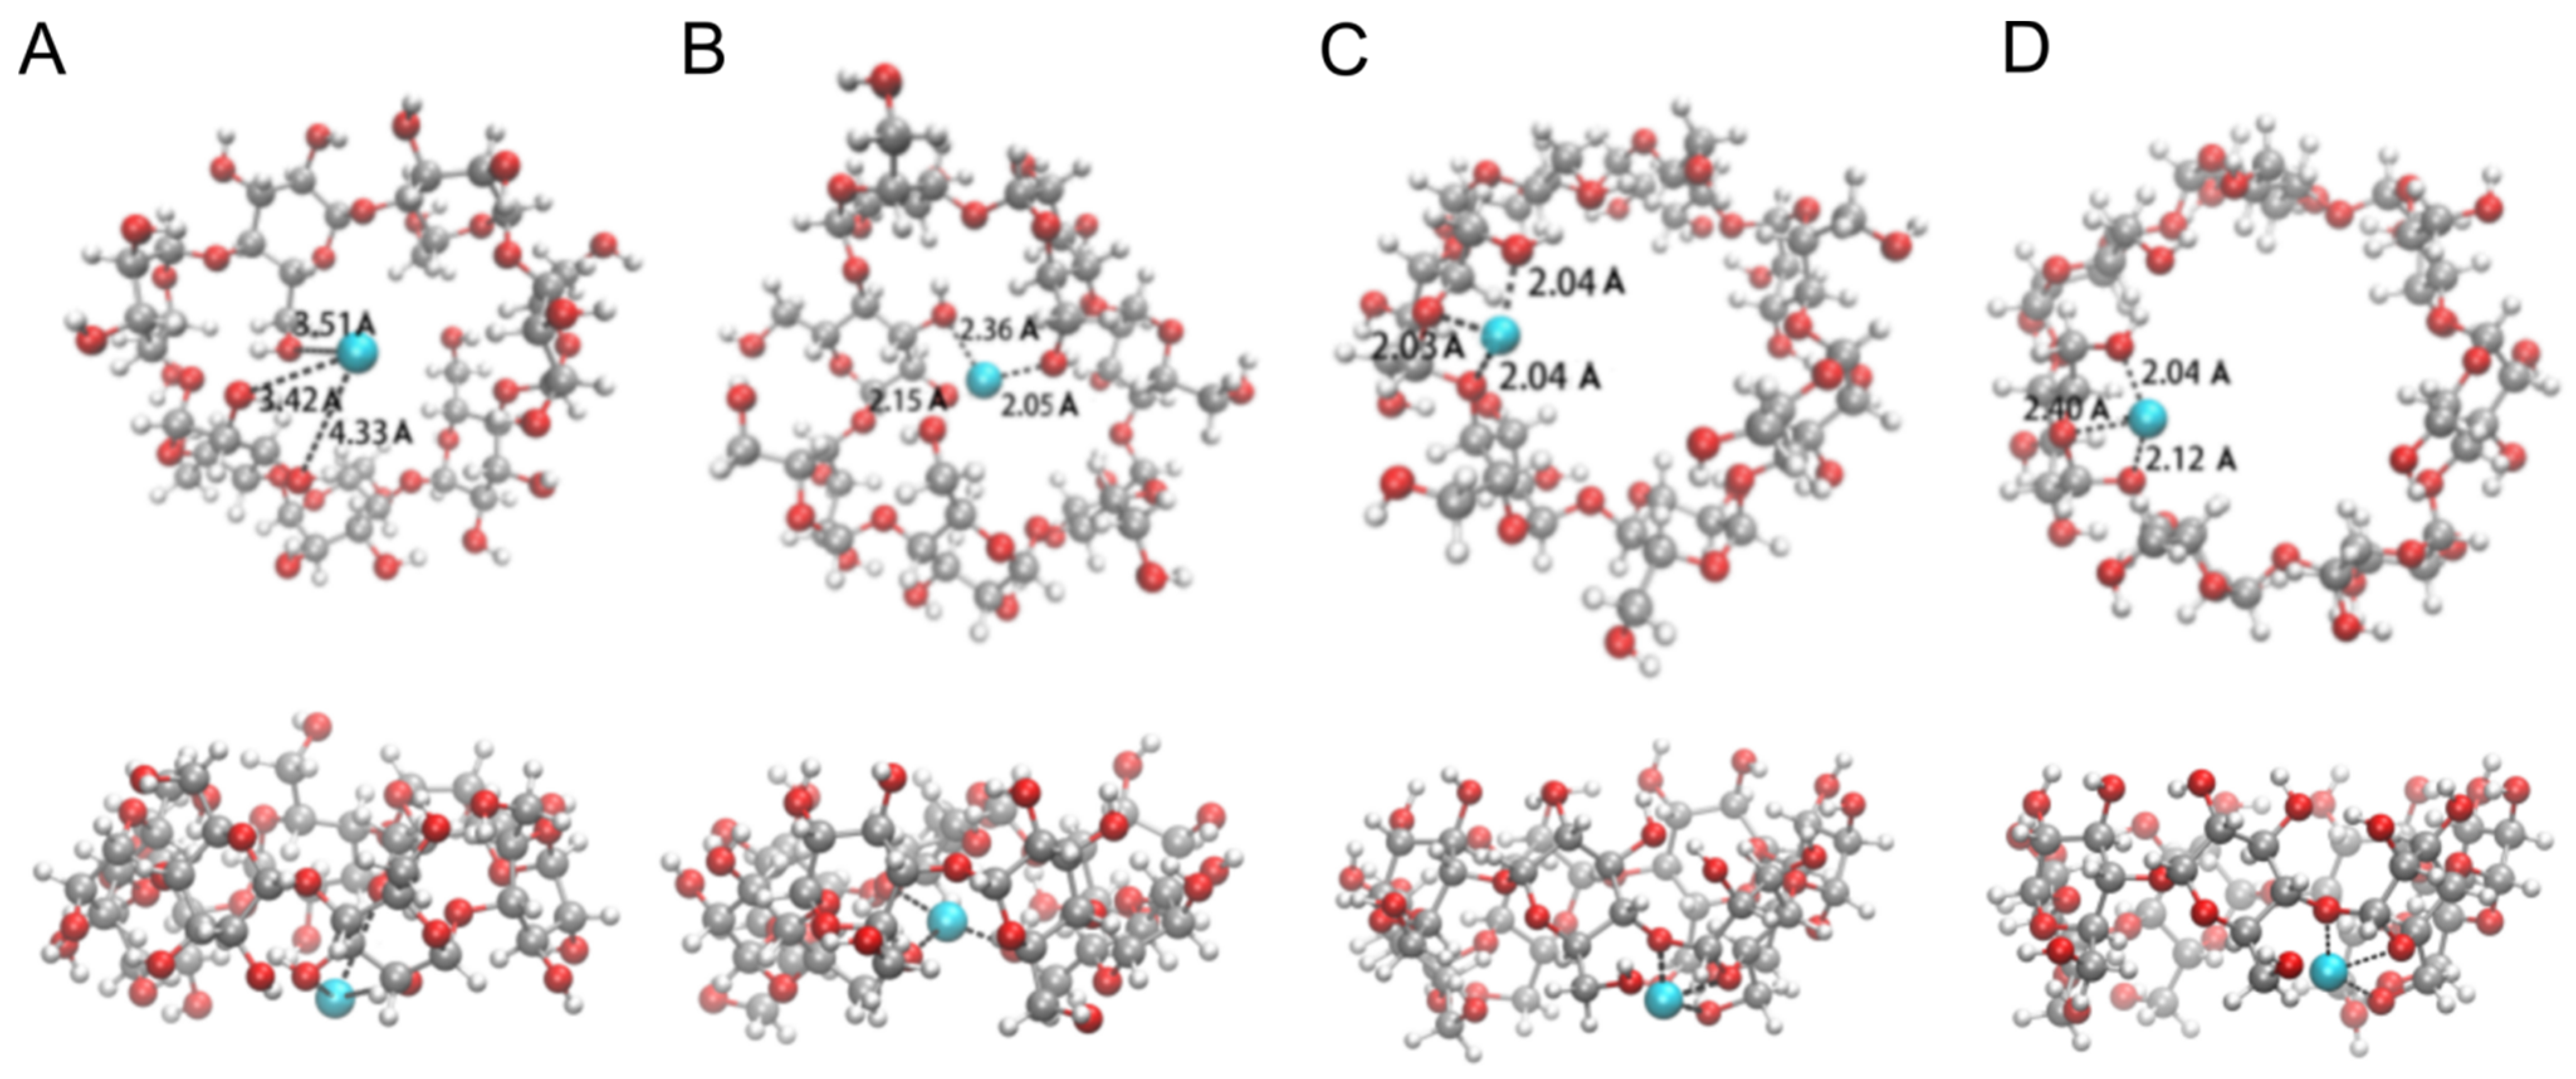
3.4.1. The [CuII(β-CD)]2+ Complex
3.4.2. The Complex of [CuII(β-CD)(EZM)]2+
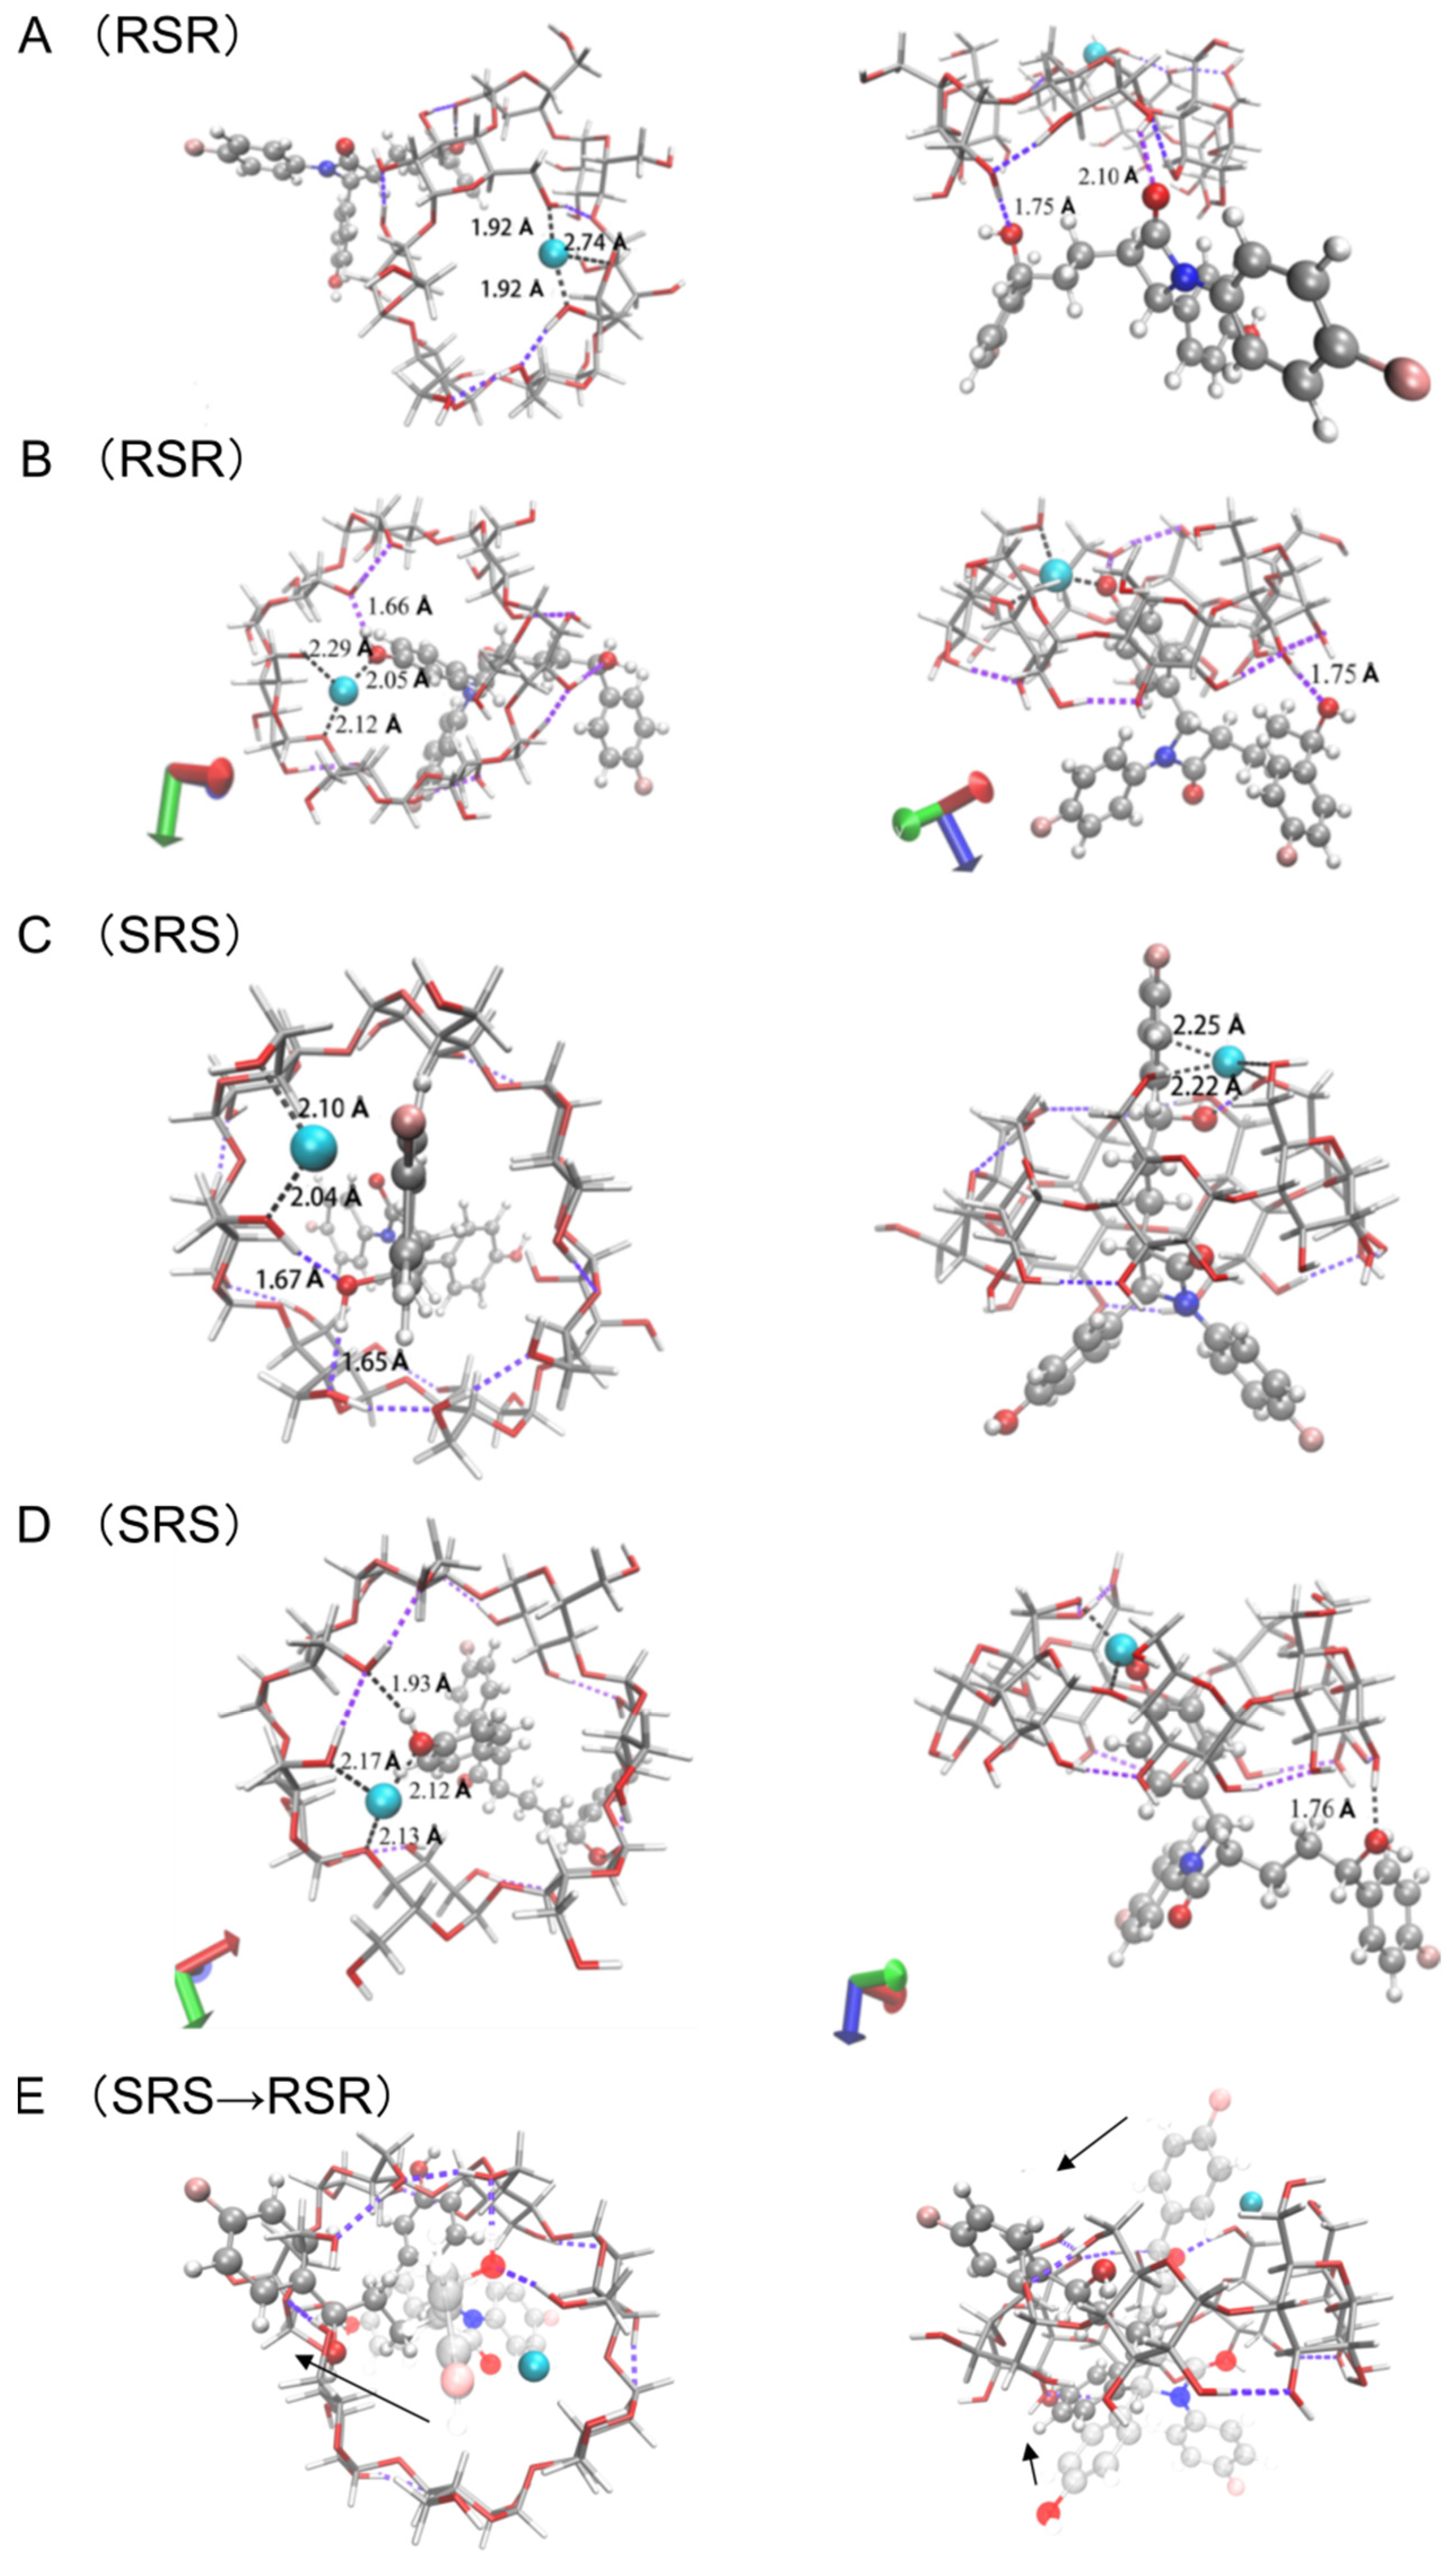
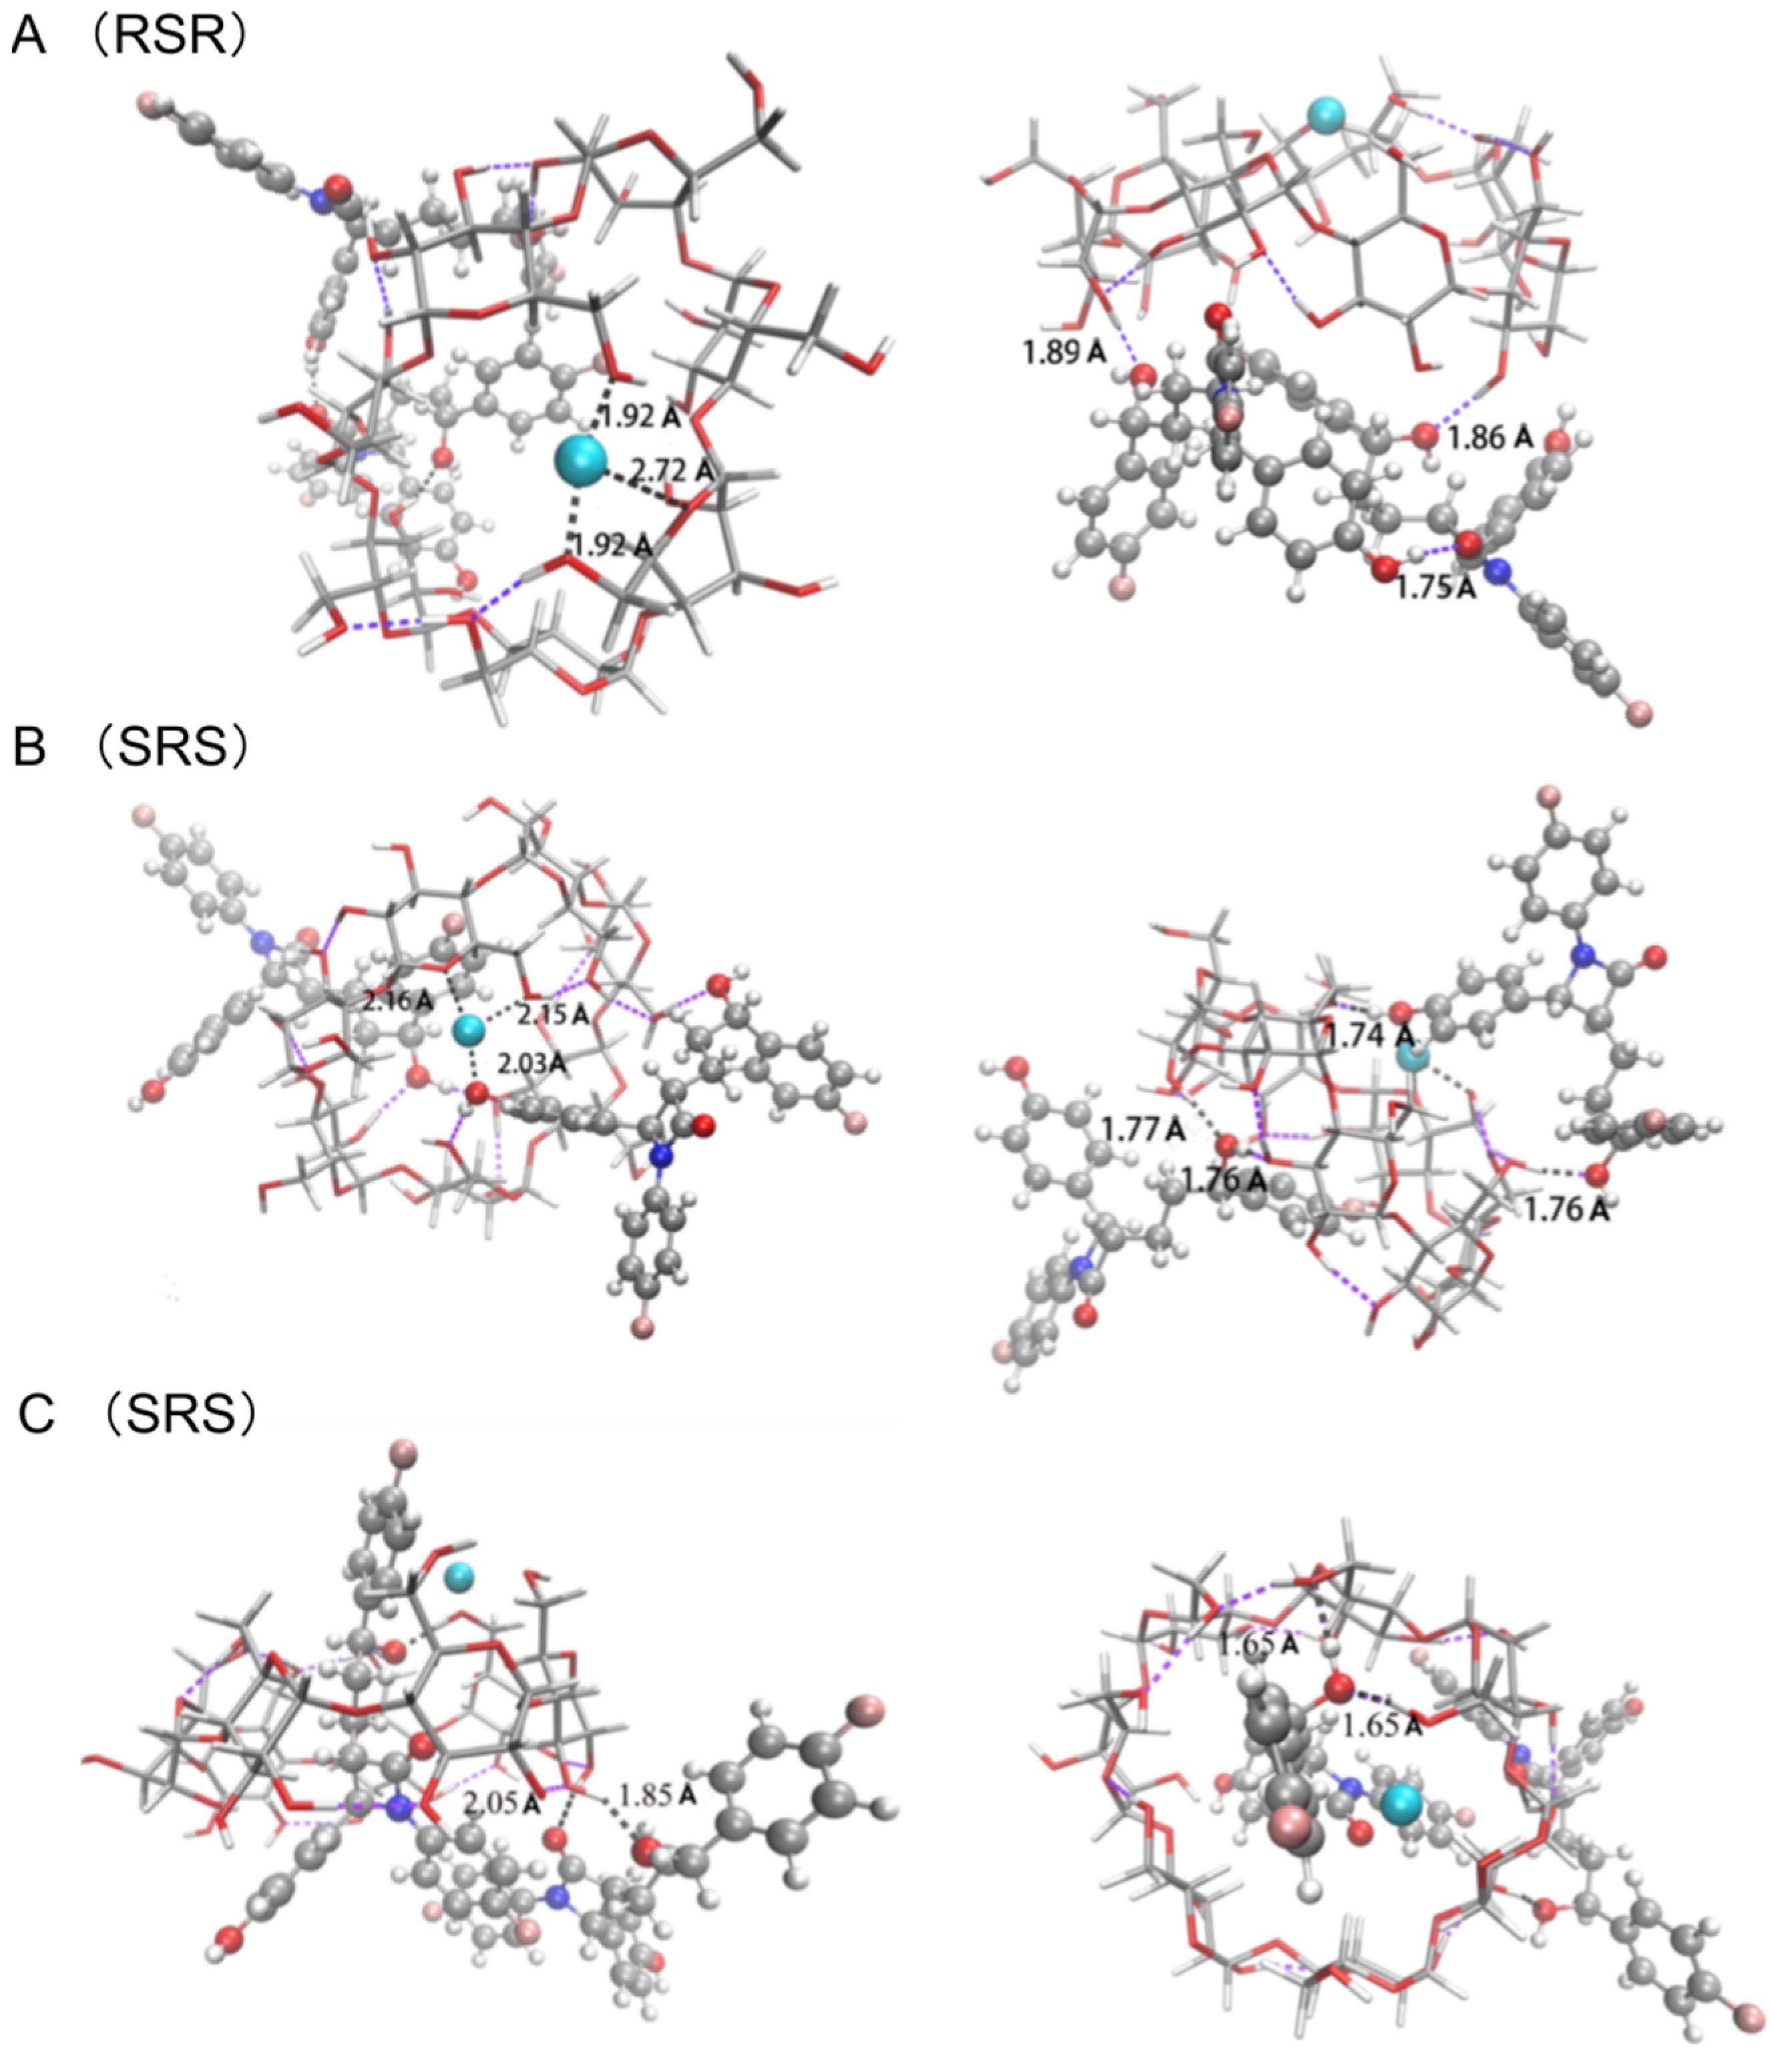
3.4.3. The Complex of [CuII(β-CD)(EZM)2]2+
4. Conclusions
Author Contributions
Funding
Institutional Review Board Statement
Informed Consent Statement
Data Availability Statement
Acknowledgments
Conflicts of Interest
References
- Kumari, V.; Kandula, J.S.; Radhakrishnan, P. Advances and challenges in the pharmacokinetics and bioanalysis of chiral drugs. Chirality 2022, 34, 1298–1310. [Google Scholar] [CrossRef] [PubMed]
- Pannala, R. Canada Minister of Health, Guidance for Industry: Stereochemical Issues in Chiral Drug Development, 2000. Am. J. Anal. Chem. 2018, 9, 4. [Google Scholar]
- Shen, Z.; Lv, C.; Zeng, S. Significance and challenges of stereoselectivity assessing methods in drug metabolism. J Pharm. Anal. 2016, 6, 1–10. [Google Scholar] [CrossRef] [Green Version]
- Hanpithakpong, W.; Day, N.P.J.; White, N.J.; Tarning, J. Simultaneous and enantiospecific quantification of primaquine and carboxyprimaquine in human plasma using liquid chromatography-tandem mass spectrometry. Malar. J. 2022, 2, 169. [Google Scholar] [CrossRef]
- Chen, X.; Kang, Y.; Zeng, S. Analysis of stereoisomers of chiral drug by mass spectrometry. Chirality 2018, 30, 609–618. [Google Scholar] [CrossRef] [PubMed]
- Nakakoji, T.; Sato, H.; Ono, D.; Miyake, H.; Mieda, E.; Shinoda, S.; Tsukube, H.; Kawasaki, H.; Arakawa, R.; Shizuma, M. One-pot analysis of enantiomeric excess of free amino acids by electrospray ionization mass spectrometry. RSC Adv. 2021, 11, 36237–36241. [Google Scholar] [CrossRef] [PubMed]
- Ou, F.; Zhou, Y.; Lei, J.; Zeng, S.; Wu, F.; Zhang, N.; Yu, L. Development of a UHPLC-MS/MS method for the quantification of ilaprazole enantiomers in rat plasma and its pharmacokinetic application. J Pharm. Anal. 2020, 10, 617–623. [Google Scholar] [CrossRef] [PubMed]
- Cédric, P.; Véronique, B.; Christine, C. Probing the common alkali metal affinity of native and variously methylated β-cyclodextrins by combining electrospray-tandem mass spectrometry and molecular modeling. Phys. Chem. Chem. Phys. 2015, 17, 19288–19305. [Google Scholar]
- Wang, Y.; Wang, L.; Chen, X.; Sun, C.; Zhu, Y.; Kang, Y.; Zeng, S. Chiral detection of entecavir stereoisomeric impurities through coordination with R-besivance and ZnII using mass spectrometry. J. Mass. Spectrom. 2018, 53, 247–256. [Google Scholar] [CrossRef] [PubMed]
- Tao, W.; Clark, R.L.; Cooks, R.G. Quotient Ratio Method for Quantitative Enantiomeric Determination by Mass Spectrometry. Anal. Chem. 2002, 74, 3783–3789. [Google Scholar] [CrossRef] [PubMed]
- Peluso, P.; Chankvetadze, B. Recognition in the Domain of Molecular Chirality: From Noncovalent Interactions to Separation of Enantiomers. Chem. Rev. 2022, 122, 13235–13400. [Google Scholar] [CrossRef]
- Szente, L.; Szemán, J. Cyclodextrins in analytical chemistry: Host-guest type molecular recognition. Anal. Chem. 2013, 85, 8024–8030. [Google Scholar] [CrossRef]
- Agathokleous, E.A.; Stavrou, I.J.; Kapnissi-Christodoulou, C. Comparison of cyclofructan-, cyclodextrin-, and polysaccharide-based chiral stationary phases for the separation of pharmaceuticals. Anal. Bioanal. Chem. 2022, 414, 1323–1333. [Google Scholar] [CrossRef] [PubMed]
- Aboushady, D.; Parr, M.K.; Hanafi, R.S. Quality-by-Design Is a Tool for Quality Assurance in the Assessment of Enantioseparation of a Model Active Pharmaceutical Ingredient. Pharmaceuticals 2020, 13, 364. [Google Scholar] [CrossRef] [PubMed]
- Chatziefthimiou, S.; Inclán, M.; Giastas, P.; Papakyriakou, A.; Yannakopoulou, K.; Mavridis, I. Molecular recognition of N-acetyltryptophan enantiomers by β-cyclodextrin. Beilstein J. Org. Chem. 2017, 13, 1572–1582. [Google Scholar] [CrossRef] [Green Version]
- Asahara, C.; Iwamoto, T.; Akashi, M.; Shigemitsu, H.; Kida, T. Effective Guest Inclusion by a 6-O-Modified β-Cyclodextrin Dimer in Organic Solvents. Chempluschem 2018, 83, 868–873. [Google Scholar] [CrossRef] [PubMed]
- Yang, S.; Gu, L.; Wu, F.; Dai, X.; Xu, F.; Li, Q.; Fang, X.; Yu, S.; Ding, C.F. The chirality determination of amino acids by forming complexes with cyclodextrins and metal ions using ion mobility spectrometry, and a DFT calculation. Talanta 2022, 243, 123363. [Google Scholar] [CrossRef] [PubMed]
- Ma, Q.; Cong, W.; Liu, Y.; Geng, Z.; Lin, Y.; Wang, Z. Experimental and computational study on the enantioseparation of four chiral fluoroquinolones by capillary electrophoresis with sulfated-β-cyclodextrin as chiral selector. Chirality 2021, 33, 549–557. [Google Scholar] [CrossRef] [PubMed]
- Mic, M.; Pîrnău, A.; Neamţu, S.; Palage, M.; Bogdan, M. Molecular interaction of β-CD with 3-carboxy-1-[(2-phenyl-1,3-thiazol-4-yl) methyl]pyridin-1-ium iodide analyzed by isothermal titration calorimetry and NMR spectroscopy. J. Incl. Phenom. Macrocycl. Chem. 2015, 83, 257–265. [Google Scholar] [CrossRef]
- Schneider, H.J.; Hacket, F.; Rudiger, V.; Ikeda, H. NMR Studies of Cyclodextrins and Cyclodextrin Complexes. Chem. Rev. 1998, 98, 1755–1784. [Google Scholar] [CrossRef] [PubMed]
- Li, R.; Niu, Y.; Zhao, N.; Yu, B.; Mao, C.; Xu, F. Series of new β-cyclodextrin-cored starlike carriers for gene delivery. ACS Appl Mater. Interfaces 2014, 6, 3969–3978. [Google Scholar] [CrossRef]
- Gao, J.; Hu, Y.; Li, S.; Zhang, Y.; Chen, X. Adsorption of benzoic acid, phthalic acid on gold substrates studied by surface-enhanced Raman scattering spectroscopy and density functional theory calculations. Spectrochim. Acta A Mol. Biomol. Spectrosc. 2013, 104, 41–47. [Google Scholar] [CrossRef]
- Stachowicz, A.; Styrcz, A.; Korchowiec, J.; Modaressi, A.; Rogalski, M. DFT studies of cation binding by β-cyclodextrin. Theor. Chem. Acc. 2011, 130, 939–953. [Google Scholar] [CrossRef] [Green Version]
- Thi, T.; Nauwelaerts, K.; Froeyen, M.; Baudemprez, L.; Van Speybroeck, M.; Augustijns, P.; Annaert, P.; Martens, J.; Van Humbeeck, J.; Van den Mooter, G. Comparison of the complexation between methylprednisolone and different cyclodextrins in solution by 1H-NMR and molecular modeling studies. J. Pharm. Sci. 2010, 99, 3863–3873. [Google Scholar] [CrossRef]
- Madan, J.; Gundala, R.; Baruah, B.; Nagaraju, M.; Yates, C.; Turner, T.; Rangari, V.; Hamelberg, D.; Reid, D.; Aneja, R. Cyclodextrin complexes of reduced bromonoscapine in guar gum microspheres enhance colonic drug delivery. Mol. Pharm. 2014, 11, 4339–4349. [Google Scholar] [CrossRef] [PubMed] [Green Version]
- Li, W.; Wang, S.; Hwang, T.; Chao, I. Substituent Effect on the Structural Behavior of Modified Cyclodextrin: A Molecular Dynamics Study on Methylated β-CDs. J. Phys. Chem. B. 2012, 116, 3477–3489. [Google Scholar] [CrossRef] [PubMed]
- Rizzarelli, E.; Vecchio, G. Metal complexes of functionalized cyclodextrins as enzyme models and chiral receptors. Coord. Chem. Rev. 1999, 188, 343–364. [Google Scholar] [CrossRef]
- Cai, Y.; Tarr, M.A.; Xu, G.; Yalcin, T.; Cole, R.B. Dication induced stabilization of gas-phase ternary beta-cyclodextrin inclusion complexes observed by electrospray mass spectrometry. J. Am. Soc. Mass. Spectrom. 2003, 14, 449–459. [Google Scholar] [CrossRef]


| [Cu(RSR-EZM)2(β-CD)]2+ | [Cu(SRS-EZM)2(β-CD)]2+ | Difference Value | |
|---|---|---|---|
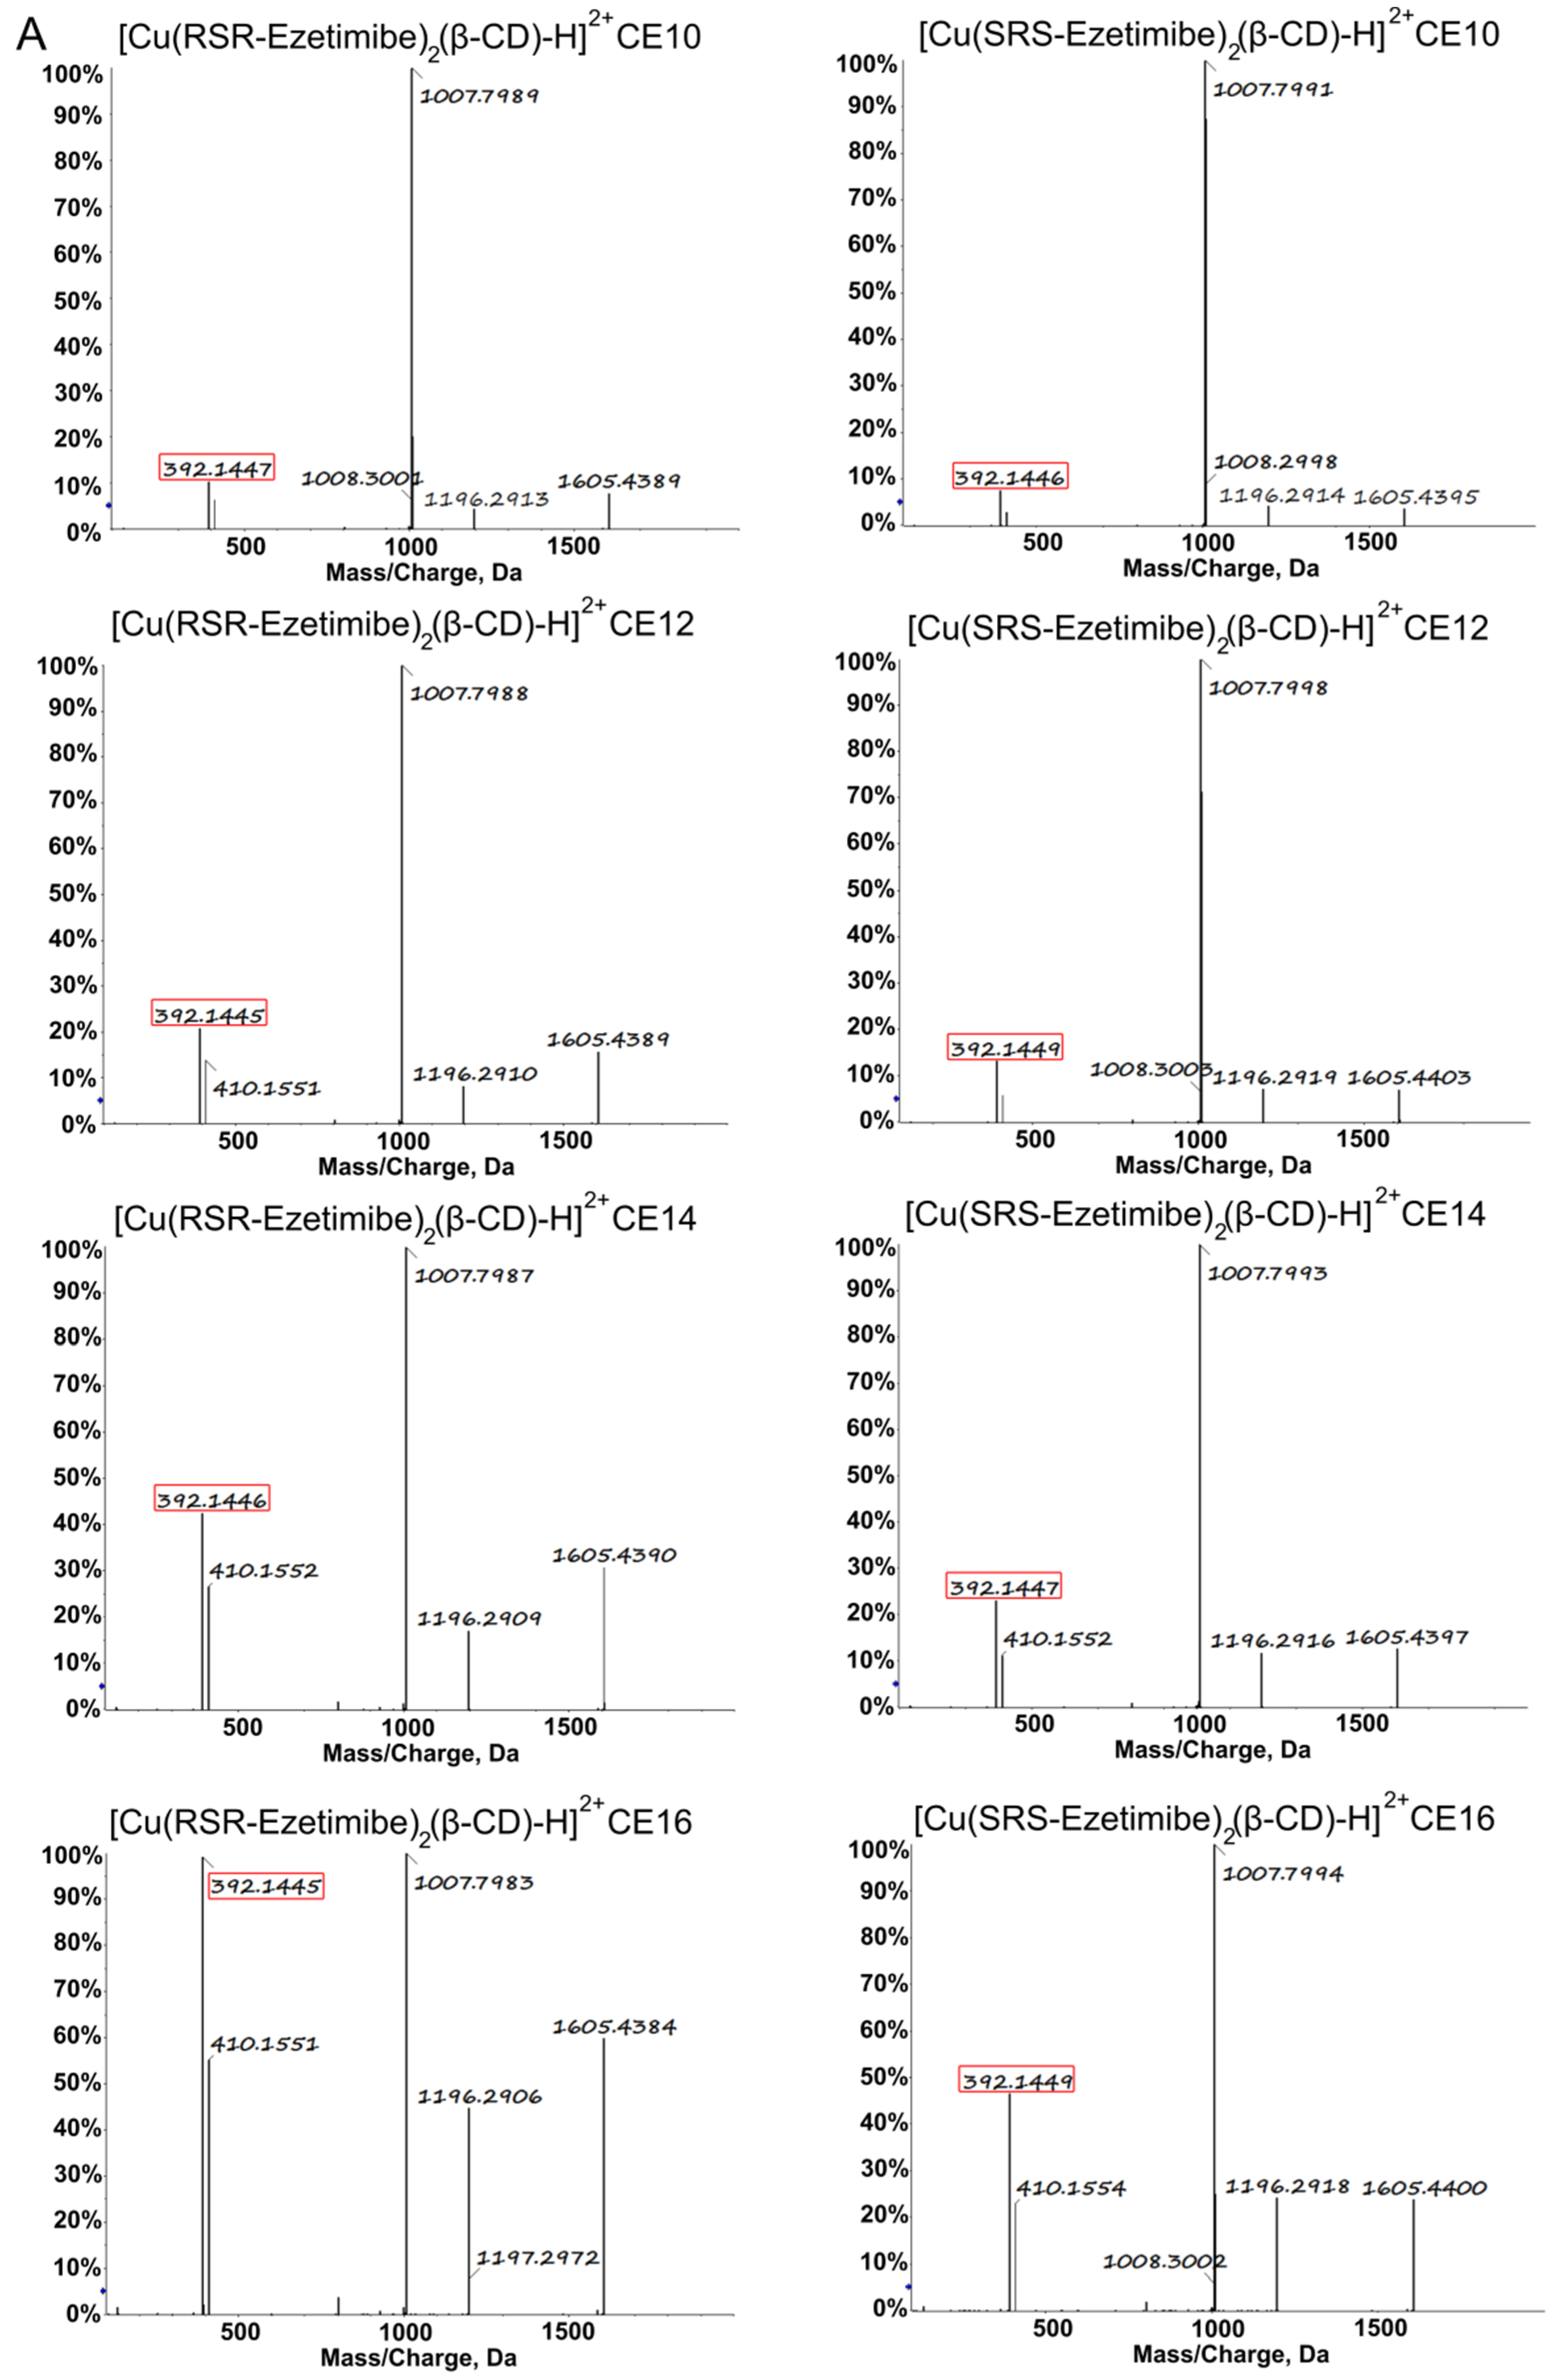
| CE10 | 12.4% | 8.2% | 4.2% |
| CE12 | 21.3% | 13.1% | 8.2% |
| CE14 | 43.2% | 23.6% | 19.6% |
| CE16 | 97.3% | 46.7% | 50.6% |
| CE18 | 99.4% | 99.2% | 0.2% |
| CE20 | 99.7% | 99.6% | 0.1% |
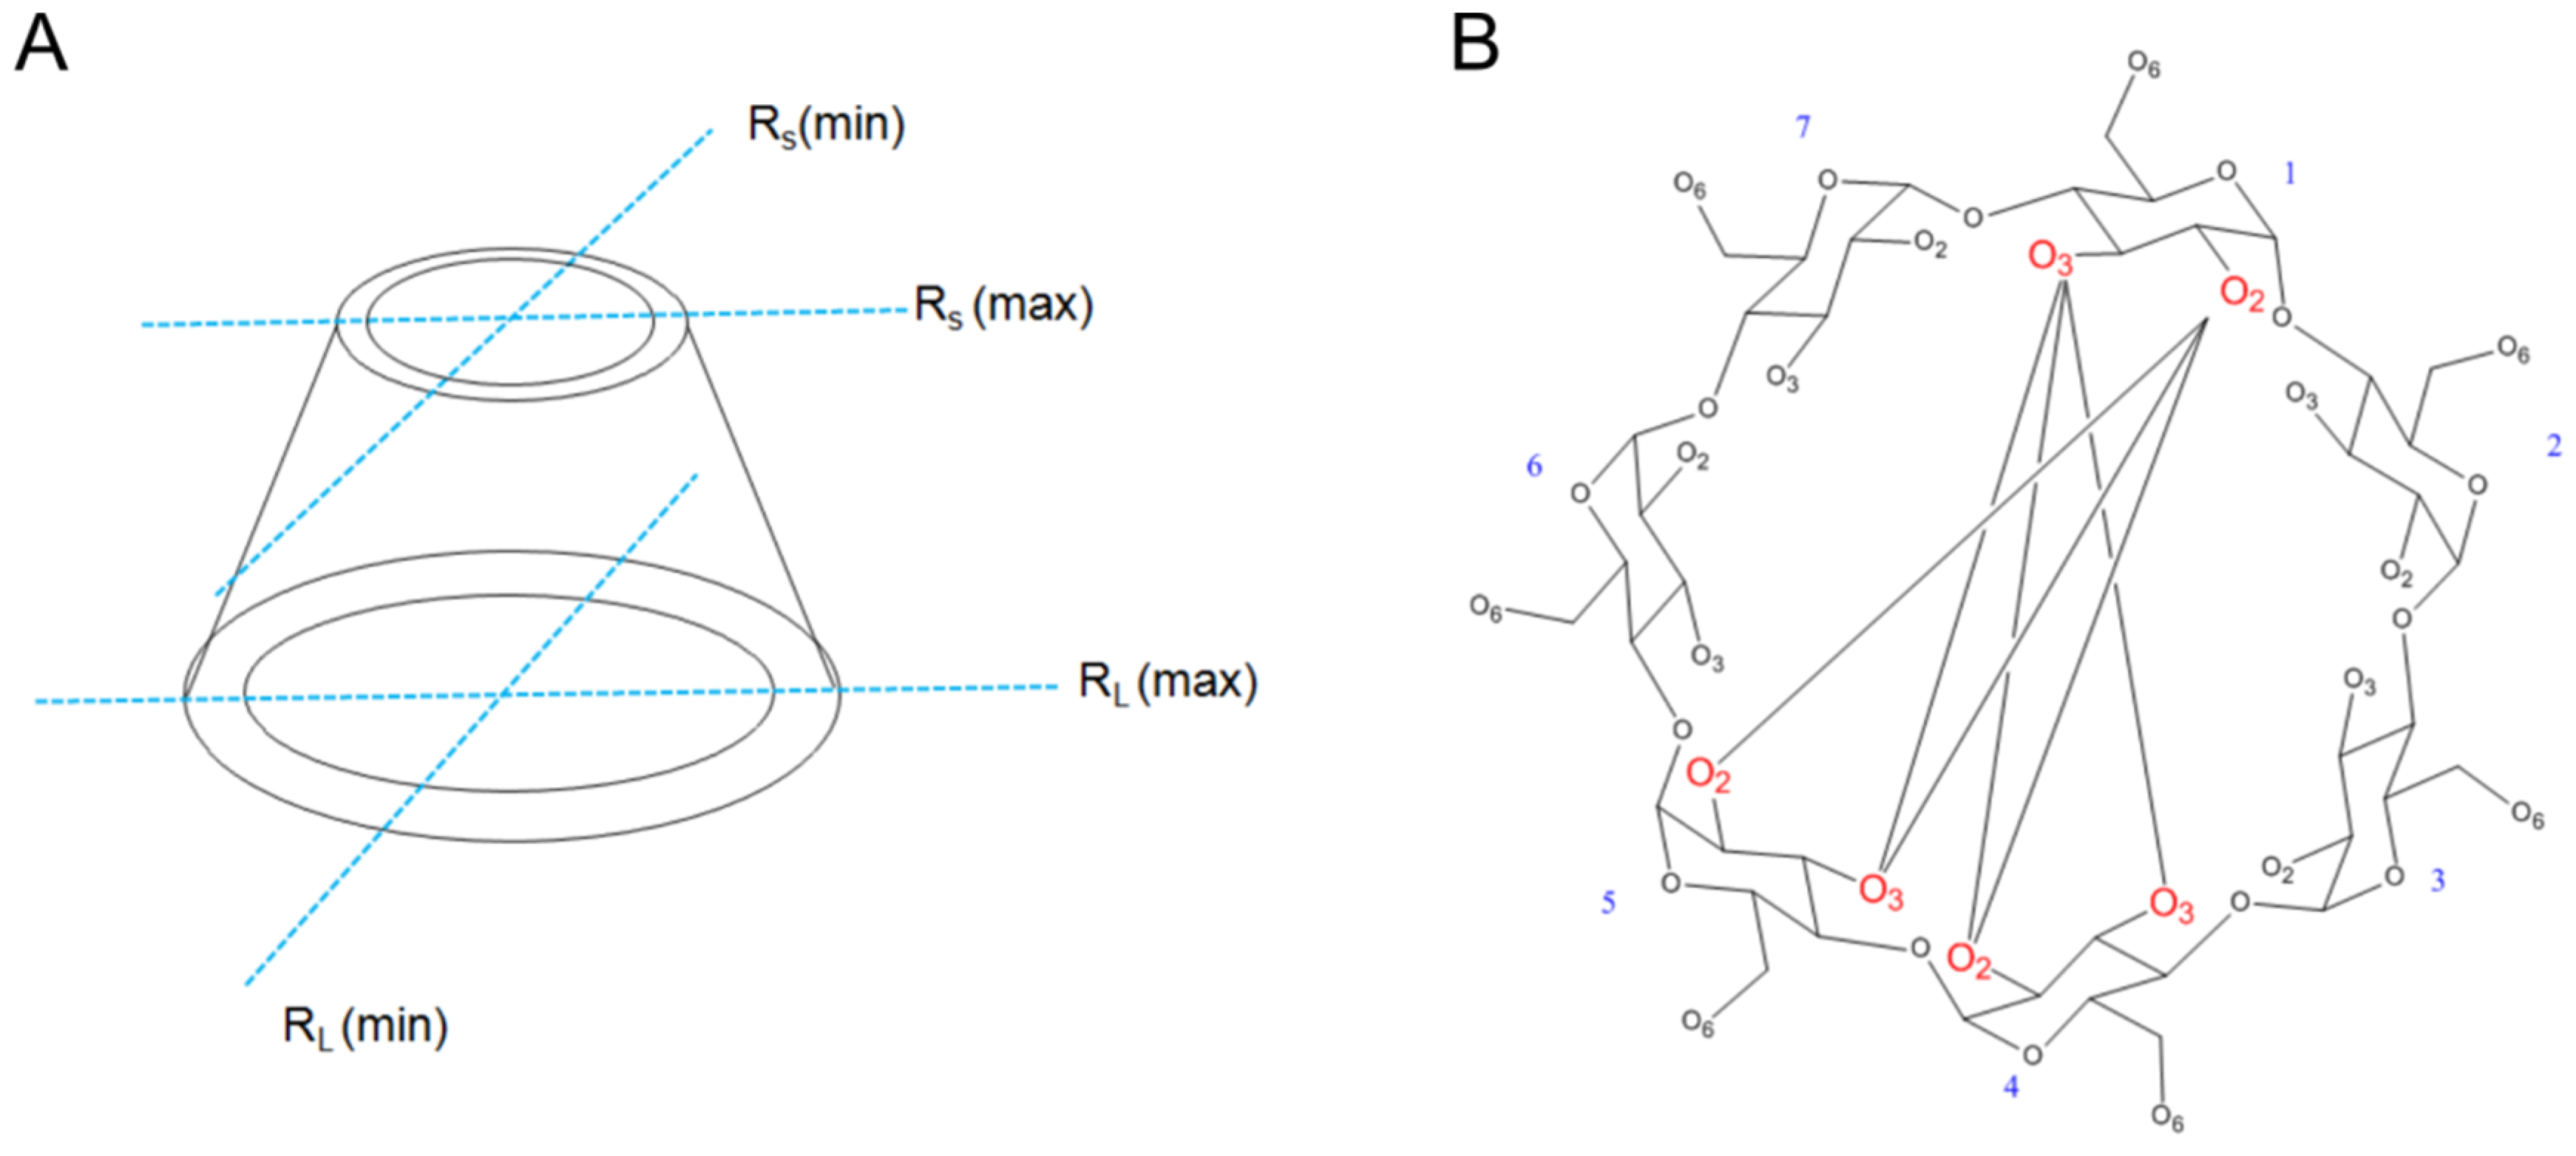
| RL (Max) | RL (Min) | △RL | Rs (Max) | Rs (Min) | △Rs | |
|---|---|---|---|---|---|---|
| β-CD | 11.11 | 10.25 | 0.86 | 13.03 | 8.62 | 4.41 |
| β-CD+Cu | 10.09 | 9.82 | 0.27 | 11.40 | 10.22 | 1.18 |
| β-CD+Cu+SRS | 13.91 | 12.44 | 1.47 | 10.94 | 8.78 | 2.61 |
| β-CD+Cu+RSR | 13.02 | 12.27 | 0.75 | 14.18 | 5.83 | 8.35 |
| β-CD+Cu+2SRS | 12.41 | 12.27 | 0.14 | 12.50 | 8.79 | 3.71 |
| β-CD+Cu+2RSR | 13.32 | 12.90 | 0.42 | 14.23 | 6.27 | 7.96 |
Publisher’s Note: MDPI stays neutral with regard to jurisdictional claims in published maps and institutional affiliations. |
© 2022 by the authors. Licensee MDPI, Basel, Switzerland. This article is an open access article distributed under the terms and conditions of the Creative Commons Attribution (CC BY) license (https://creativecommons.org/licenses/by/4.0/).
Share and Cite
Wang, H.; Chen, X.; Wang, Y.; Wang, L.; Gao, Z.; Hu, H.; Yu, L.; Zeng, S.; Kang, Y. Probing Fast Enantio-Recognition of Drugs with Multiple Chiral Centers by Electrospray-Tandem Mass Spectrometry and Its Mechanism. Appl. Sci. 2022, 12, 10353. https://doi.org/10.3390/app122010353
Wang H, Chen X, Wang Y, Wang L, Gao Z, Hu H, Yu L, Zeng S, Kang Y. Probing Fast Enantio-Recognition of Drugs with Multiple Chiral Centers by Electrospray-Tandem Mass Spectrometry and Its Mechanism. Applied Sciences. 2022; 12(20):10353. https://doi.org/10.3390/app122010353
Chicago/Turabian StyleWang, Hechen, Xiaolei Chen, Yali Wang, Lu Wang, Zhangzhao Gao, Haihong Hu, Lushan Yu, Su Zeng, and Yu Kang. 2022. "Probing Fast Enantio-Recognition of Drugs with Multiple Chiral Centers by Electrospray-Tandem Mass Spectrometry and Its Mechanism" Applied Sciences 12, no. 20: 10353. https://doi.org/10.3390/app122010353