1. Introduction
Probabilistic approaches (e.g., reliability analysis) have been commonly used for structural design, which requires an evaluation of distributions in loads and resistance. As more Weight-In-Motion (WIM) data become available, probabilistic approaches can aid the decision making process [
1] for transportation asset management. For example, bridge live loads (or vehicle weights) have increased over time whereas the capacities of bridge members decrease as they age as a result of natural forces and repeated load cycles. Bridge load rating requires multiple variables including bridge conditions and estimated live loads. Based on a section loss and/or condition rating available in an inspection report, the capacity of a bridge is generally more accurately evaluated than the live loads for load rating. On the other hand, the live loads are considered as one of the most uncertain elements when bridges are being reviewed for load-rating. Bridge owners and decision-makers do not have the information about live loads carried by bridges due to either not having access to the latest WIM data or sheer amount of data involved in analytics.
There have been numerous reliability-based bridge analyses which assume a distribution of live loads. Akgül and Frangopol [
2] and Frangopol et al. [
3] studied a reliability-based bridge assessment. Aloisio et al. [
4,
5] discussed the dynamic effects and how to reliably assess bridge resistance using vibration data. Lou et al. [
6] studied the effect of overweight trucks on bridge deck’s service life and associated economic impact. Sun et al. [
7] and Mitoulis et al. [
8] discussed risk and resilience of transportation infrastructure to support planning and design. In a recent study, Stawska et al. [
9] presented accelerated bridge deterioration due to increasing vehicle weights. In our previous study, Sinha et al. [
10] determined live load factors using WIM data, studied a distribution of live loads, and concluded that there are bridges subjected to significantly higher-than-expected live loads. Oyegbile et al. [
11] analyzed bridge condition ratings for the state of Georgia but did not correlate them with live loads. Nonetheless, there are few studies addressing both field-collected live load demands and capacities across an inventory of bridges. The National Bridge Inspection Standards (NBIS) requires load ratings be documented in the National Bridge Inventory [
12] database, and they are expected to reflect changes in structural conditions due to repairs, modifications, and/or natural forces and thus measures a bridge’s ability to carry live loads based on the latest conditions.
This study aims to investigate live loads observed in weigh-in-motion (WIM) systems and compare them with the maximum load carrying capacities (or operating rating) provided in the NBI database compiled between 1992 and 2021. While there are several reliability studies conducted using either the NBI data or WIM data, there are few studies that validate a positive relationship between bridge operating load ratings and condition ratings. This step is critically important to synthesize WIM and NBI data, conduct a reliability analysis for a large number of bridges in an inventory, and prioritize bridge monitoring, maintenance, rehabilitation, or replacement (MRR). Thus, the proposed reliability analysis aims to synthesize the past 3-year WIM and respective NBI operating load rating data for a reliability analysis, as well as to identify bridges with high risk, specifically those with a reliability index (RI) below a threshold level (2.0).
1.1. Background
Bridges are generally designed for an expected service life of 75 years and a reliability index of 3.5 for inventory level performance [
13] and 2.3~2.5 for operating level performance [
14]. However, due to uncertainties, a reliability index is expected to range between 2.0 and 4.0 [
8]. Additionally, uncertainties exist in the variables measured in WIM systems such as a vehicle weight measurement in a dynamic weight sensor and a dynamic amplification factor (1.25 or greater) due to moving vehicles. Therefore, in this study, a minimum threshold RI of 2.0 is selected. This is equivalent to observing a 1–2 in 100 chance of observing a structurally deficient bridge (or the probability of failure ranging between 0.01 and 0.02). A load rating is an important indicator for assessing the performance of bridge components such as deck, superstructure, and substructure. The load carrying capacity decreases over time due to the deterioration of bridge components as a result of natural forces, such as environmental, climatic, and hydraulic impacts. Additionally, heavy vehicular movements on bridge structures have a significant impact on bridge deterioration. Such bridge deterioration should be closely monitored by state highway agencies in conjunction with live loads for load rating. However, prioritization of bridges for monitoring based on risk remains a challenging task. This study proposes a data-informed risk quantification method using vehicle weight information obtained in WIM systems.
1.2. Asymmetric Information and Adverse Selection Problem in Bridge Maintenance
Asymmetric information, also known as information failure, occurs when two parties involved in a transaction do not have an equal level of knowledge about a product. Such unequal information leads to an adverse selection problem, a prevalent bias in behavioral economics, especially in the insurance industry [
15]. A problem of adverse selection exists in making bridge monitoring and maintenance, rehabilitation, and repair (MRR) decisions. Bridge owners or decision makers generally do not have information about the current live loads whereas state department of transportation (DOT) have access to the real-time WIM data, which leads to an asymmetric information problem. Asymmetric information can also lead to an overconfidence problem about capacities of bridges and vice versa, as well as posting of bridges which restrict transportation of goods and services in certain industries.
For example, if a group of bridges is identified as having a low reliability index, they can be further investigated for MRR decisions. Often, bridges in poor conditions are prioritized for bridge repairs. However, such bridges may not expect to carry heavy truck traffic. Thus, we opt for bridges with a lower reliability index even though they may be in fair-to-poor conditions. Conversely, there may be cases where a low reliability index may not translate to high impact to MRR decisions.
1.3. Research Significance and Objectives
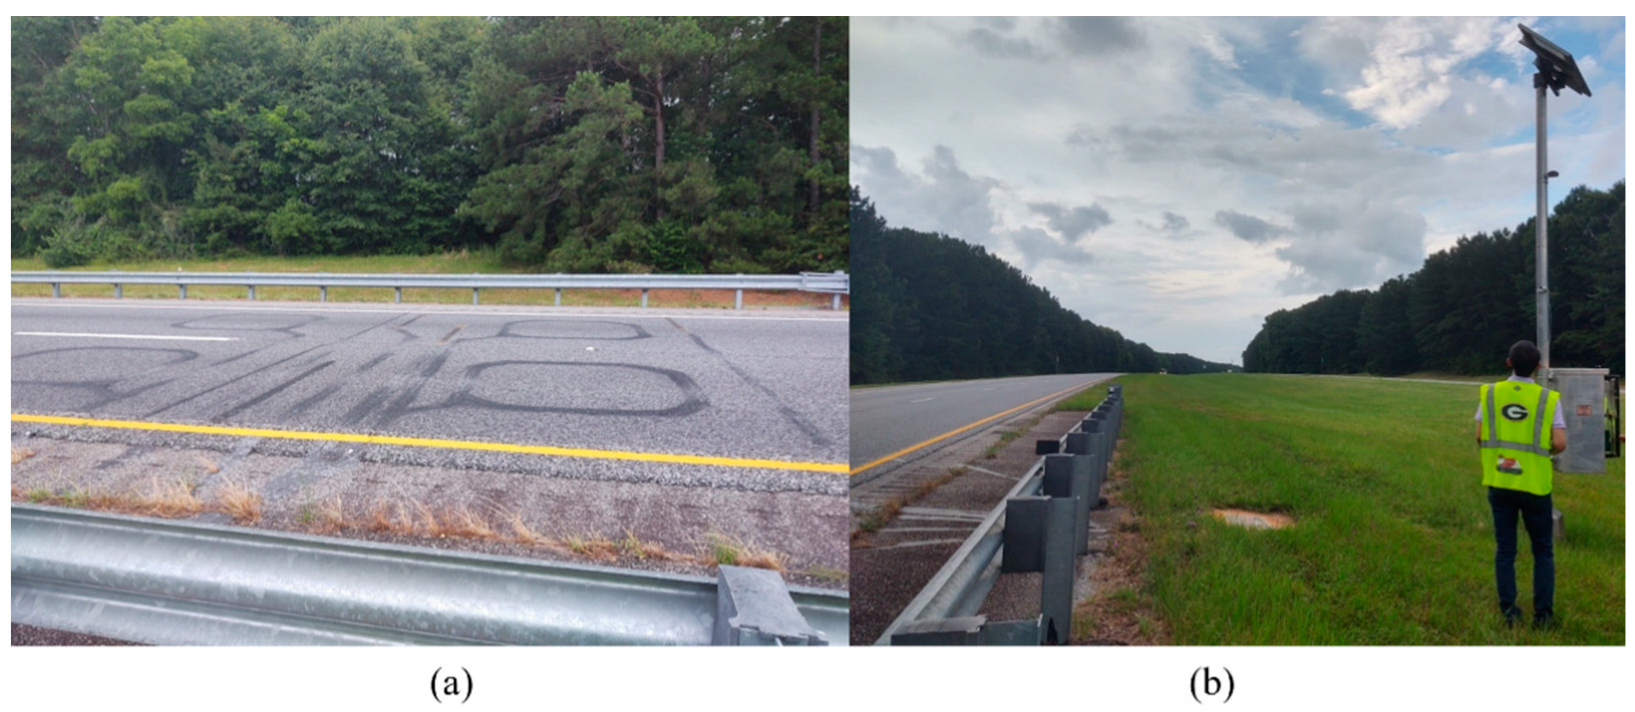
Figure 1a shows WIM systems consisting of quartz load sensors and magnetic loops installed on the roadway as well as a data acquisition system shown on the right. The load sensor is a piezoelectric device and thus involves electric polarization resulting from the application of vehicle weights. Transportation agencies and departments of public safety are expanding the WIM networks to better understand live load demands on bridges and roads and associated risks. WIM systems are capable of recording vehicle characteristics such as axle spacing, speed, axle weight, length, and number of axles and represents true traffic live loads on highways. Researchers around the world have started to realize the potential of WIM data and its application for bridge monitoring. Lou, Nassif, Su and Truban [
6] have used the NBI condition rating data and truck traffic from WIM data to derive a deterioration model for bridge deck. Stawska, Chmielewski, Nowak and Stallings [
9] have used WIM data and NBI database to predict the effect of heavy weight vehicle on the reduction of bridge fatigue life. Kong et al. [
16] have investigated the correlation between several bridge components from the NBI database using advanced machine learning algorithms. Several other studies emphasized the importance of determining vulnerability [
17,
18,
19,
20] of bridge elements such as a deck element due to aging and other environmental factors.
Although there have been several studies related to the reliability of bridges [
6,
14,
19], a reliability analysis of bridges using both WIM data and the NBI database for an analysis of a large inventory of bridges has not been conducted and used for monitoring bridges. In recent years, heavyweight traffic has been significantly growing on interstate and major state highways. This study aims to propose a live-load informed risk analytics method that can be used for assessing risk for a large number of bridges in a state inventory as state DOTs face the big data environment. Thus, the novelty of this paper is twofold: (1) implementation of a gradient boosting algorithm to verify a relationship between operating load ratings and NBI attributes including condition ratings and (2) provides bridge monitoring personnel and MRR decision makers with more complete information about live load demands, corresponding to the capacity of bridges, in the larger information and data discovery environment.
1.4. Research Questions
Specifically, this study aims to address the following research questions:
In recent years, truck traffic has grown significantly on the interstate and major state highways. Is there an effective way to continuously monitor the probabilities of failure or reliability of a large number of bridges using both evolving Big Data (e.g., vehicular weights) measured in WIM systems and operating bridge load ratings available in the NBI database annually?
It is hypothesized that bridge components’ (e.g., deck, superstructure, and substructure) condition ratings have a significant influence on the bridge’s load carrying capacity. To test the hypothesis, the following question is asked: Is the operating maximum load carrying capacity a fair indicator of bridge capacities that change over time based on condition ratings? In theory, it should. However, we ask if the past 10-year data support a positive relationship in an inventory. What are the other attributes in the NBI database that affect the operating load ratings?
As for monitoring bridges, how does one effectively communicate ever-changing reliability, risk, or probabilities of failure as a result of evolving traffic [or vehicle weights] and technologies on highway bridges with decision-makers and stakeholders (e.g., local governments, transportation agencies, and departments of public safety)?
Finally, how can we use Reliability Indices (RI) to monitor bridges and mitigate adverse selection problems for MRR decisions involving a large number of bridges in a state’s inventory?
1.5. Research Scope
Many studies have been conducted on condition predictions of bridge elements using various models. However, a major portion of previous studies only focused on selected bridge element types such as deck [
6,
17] or a small number of selected bridges located at a certain geographical location [
3]. Therefore, it is important and necessary to understand the interdependencies between NBI bridge attributes and respective bridge capacities, and determine a more generalized methodology for quantifying the reliability of bridges using live loads available in the WIM data. The scope of this paper includes conducting a reliability analysis of highway bridges in Georgia. To understand the correlation between NBI attributes and bridge capacities, modern machine learning algorithms [
17,
18,
19,
20] are employed. This study uses a XGBoost algorithm [
21] to understand the interdependencies between load ratings (LR) and several bridge element condition ratings (CR). XGBoost is known for its capability to handle imbalanced data and high prediction accuracy. However, such gradient boosting methods are not easy to interpret. Therefore, to enhance interpretability of results, Shapley additive explanation plots (SHAP) will be used to visualize the impact of predictors on a target variable. SHAP is a framework built on the game theory and determines the effects of attributes through local interpretability [
22].
Therefore, in this study, a correlation between selected NBI attributes and bridge capacities is evaluated by a XGBoost algorithm, and the results are compared with CatBoost [
23] algorithms. The aim of this exercise is to examine if the maximum load carrying capacity determined as a part of operating load rating is a consistent indicator which reflects bridge conditions. Furthermore, vehicle weight distributions observed between 2019 and 2021 are used to evaluate reliability indices of bridges using the maximum load carrying capacities available in the NBI database. It is observed that the number of heavyweight vehicles has been growing rapidly over the past few years. Yet, bridge owners are not provided with the live load data while making bridge maintenance decisions, which ultimately leads to an adverse selection problem, undermining the hidden risk of a bridge failure. The issue of adverse selection in bridge maintenance needs to be addressed as it is linked to the public safety and accessibility and thus needs to be mitigated by providing reliable information.
2. Proposed Method to Mitigate Adverse Selection in Bridge Monitoring and MRR
The proposed WIM and NBI data driven reliability analysis aims to evaluate probabilities of failure for a large number of bridges with the latest traffic or live load data. Any occurrences where a reliability index is less than the threshold reliability index (2.0) warrant further investigation. Bridge capacities are expected to decrease over time and should reflect changes in conditions. Live loads on the other hand are not expected to significantly change. However, within a 75-year bridge service life, it is possible for bridges to experience heavier-than-expected live loads. For example, rapid changes in autonomous vehicle technologies may change live load patterns. Additionally, advances in data analytics and sensing technologies are expected to provide more information about live loads more rapidly. Therefore, it is possible to synthesize two datasets and perform a reliability analysis of a large number of bridges while more accurately characterizing live load demands (i.e., vehicle weights) collected by WIM sensors and capacities obtained from the NBI’s operating load rating (LR) data. LR involves a reliability analysis of bridges to assess failure modes such as girder shear and moment, as well as an evaluation of uncertainties associated with material properties. Such process is tedious and thus is not ideal for assessing a reliability of bridges for a state’s inventory. Furthermore, the maximum load carrying capacities are available as a result of a routine LR process. However, LR engineers, who are often contractors to state agencies, tend to be conservative in load-rating because bridges are only becoming old and are associated with public safety and liability. Thus, in the proposed approach, we allow a small amount of uncertainty that may exist in the load rating (or estimating the bridge capacity) process and use field collected live load data to significantly reduce uncertainties in a reliability analysis. Such a tradeoff is expected to assist state agencies to minimize bridge postings which restrict the movement of goods or mobility.
2.1. Establishing a Fair Representation of Bridge Capacities from the NBI Data
This study hypothesizes that the NBI operating load rating (LR), as per the definition given in the NBI guidelines [
12], provides a fair representation of bridge capacity. To test this hypothesis and establish a relationship between bridge capacities and operating LR, a multivariable linear regression analysis is performed between NBI attributes including condition ratings (CR) and operating LR. The significance of the regression analysis is to observe the effect of changes in operating LR on the changes in bridge CR along with other NBI attributes (e.g., age, CR, structure length, no of lanes). The process is summarized in
Figure 2, on the bottom left part of a flowchart.
This hypothesis test will support the main assumption that changes in bridge load carrying capacity resulting from condition changes and deterioration are fairly represented by changes in the NBI’s operating LR. Machine learning methods, such as eXtreme Gradient Boosting (XGBoost) and CatBoost, are explored to search for a meaningful relationship. The main predictors include age, length, number of lanes, CR for deck, superstructure, and substructure, and the target variable is the bridge operating LR, which is hypothesized to represent bridge capacities. Machine learning model parameters such as tree depth and learning rate are tuned using a training data set (70% of the total dataset), and the performance is evaluated by multiple error estimation methods including the Root Mean Squared Error (RMSE), R-squared (R2) value, and K-fold cross validation [
24,
25].
2.2. Procedure for Determining a Reliability Index to Close the Information Gap
A reliability analysis uses WIM data and quantifies the risk of live loads exceeding structural load carrying capacities of bridges by calculating a reliability index. Therefore, the analysis outcome should provide decision-makers with a quantitative metrics regarding the associated risk for each bridge in Georgia and enable decision makers to mitigate overconfidence problems in measuring the bridge capacity or posting bridges due to conservativeness in LR. Furthermore, it should reduce the miscalculated risk which hinges on incomplete information resulting from uncertainties in predicting the rate of vehicle growth and bridge deterioration, ultimately reducing the likelihood of adverse selection problems.
The limit state function, g, that forms the basis for a reliability analysis is defined by Equation (1), where the strength of a bridge and load effect is represented by
R and
Q, respectively. It is noted that both
R and
Q are random variables, and thus it is assumed that their true value cannot be determined with absolute certainty.
Structural behavior is considered as satisfactory if the limit state, g, is greater than 0 or (
R −
Q) > 0, and unacceptable when (
R −
Q) ≤ 0. Since the probabilistic distribution of R and Q is not precisely known, a method known as the First Order Second Moment (FOSM) probabilistic analysis [
26,
27] is used employing the mean and standard deviation, R and Q, respectively. In the FOSM analysis, the probability of failure (
) is calculated by Equation (2), where
and
are the mean and standard deviation.
is the mean resistance of bridges and
is the mean WIM load. Similarly,
is the standard deviation of bridge resistance and
is the standard deviation of a WIM load distribution. The reliability Index (
β) is determined by Equation (3), and
is the inverse normal distribution function.
In this study, we assume that WIM truck weights and NBI capacities are random quantities, and a normal distribution is used to represent the weight data. A probabilistic distribution representing the capacity is determined by taking the operating LR as the mean of the distribution, and the standard deviation (
) is assumed to be within 10 percent of the mean value
[
14,
27]. This is a fairly conservative approach but recognizes that the load rating provided in the NBI is not an absolute measure but is expected to vary due to uncertainties associated with parameters used for bridge load rating.
Lastly, in this study, two main approaches are used for selecting bridges for a reliability analysis. In the first approach, each of 12 selected WIM sites is associated with interstate highway bridges along each of 4 selected routes (I-75, I-95, I-16, and I-20). In the second approach, a group of bridges in the vicinity of the Atlanta area is analyzed with WIM data obtained from each of 7 selected WIM sites. Additionally, a group of bridges in the vicinity of the Savannah area is analyzed with WIM data from each of 5 selected WIM sites.
3. Results Attained by Using the Proposed WIM and NBI Synthesis Method
3.1. Correlating Operating LR with Attributes Available in the NBI to Characterize Resistance
There is no strong linear relationship between the bridge CR and LR in the Georgia’s bridge inventory. The goodness of fit measure (or R2 value) is less than 0.5. Thus, a supervised Machine Learning (ML) algorithm implementing a XGBoost model [
21] is used to search for a relationship between the two variables—changes in CR and changes in the maximum load carrying capacity (or operating LR), in conjunction with other predictor variables—bridge attributes available in the NBI. This is achieved by predicting operating LR using the six variables shown in
Figure 3.
XGBoost is a decision-tree-based ensemble ML algorithm that uses a gradient boosting framework. This algorithm minimizes loss by employing the mean squared error between two iterative steps. The bridge inspection (or NBI) data collected between 1992 and 2021 are analyzed.
Figure 3 presents a plot showing SHAP values. The plot consists of solid dots showing data points, where each dot has three main characteristics. First, the vertical location shows the feature importance, ranked in downward descending order. Second, a different shade of gray exhibits whether the variable has high or low impact on the prediction outcome. Black and white dots indicate a high and low impact variable, respectively, and its position shows the strength of impact on the prediction of the target variable (i.e., the operating LR). Finally, the horizontal axis shows the positive and negative impact of the predictors (e.g., variables such as condition rating) on the target variable. Ultimately, a SHAP plot illustrates the impact of predictors on the target variable prediction.
The results shown in
Figure 3a are generated using the GridSearch and cross-validation methods to identify hyperparameters such as the maximum depth [of trees] of 7, the learning rate of 0.3, the estimator parameter of 150, alpha of 1.0, min_split_loss of 4.0, lambda of 1.0, subsample of 0.8, min_child_weight of 5.0 for the XGBoost model. For the CatBoost model, the maximum depth [of trees] of 7, num_trees of 2000, l2_leaf_reg of 0.2, and the learning rate of 0.1 are used. Two metrics are used to evaluate the model accuracy: The RMSE value is 8.16 and R2-score is 0.77 for the test data set for the XGBoost model, both of which are considered good scores for a regression model. The CatBoost yields an R2-score of 0.70 and an RMSE of 9.21.
Figure 3 shows that there is a strong relationship between the condition ratings (particularly substructure CR) and operating LR, and that older, wider, and longer bridges are more likely to drive the operating LR down. The gradient boosting regression analysis confirms that the operating LR well captures the changes in bridge conditions, and the probability of exposure to traffic and weathering. Verifying such correlation is significant to establish the maximum load capacity for a reliability analysis of bridges.
3.2. Reliability Analysis of Bridges in Georgia
A reliability analysis for 655 bridges along the major routes are conducted with truck traffic, which includes class 4 or greater vehicles. As shown in
Figure 4, bridges on major inter-state routes are associated with a WIM site based on the geographic information system (GIS) coordinates obtained from the NBI database [
12].
Figure 5 shows a histogram representing gross vehicle weight (GVW) distribution for site 0210378 with a reference resistance distribution. A plot representing distributions of 235 bridge load capacities is also shown in
Figure 6 for each bridge that is located along the routes shown in
Figure 4.
In
Figure 6, the thin dashed gray line shows the capacity of a group of bridges reported in 2021, and the thin solid black line shows the capacity when the bridge was initially constructed. The purpose of this plot is to show the reduction (or increase) in load carrying capacities over time. The blue solid (thick) line shows the live load on a bridge observed in the WIM data, and the red dashed (thick) line shows the bridge capacity when a reliability index of 2.5 is selected for the live load distribution observed in the WIM data. The Reliability Index (RI), along with the probability of failure, is calculated for each bridge using Equations (2) and (3). As shown in
Figure 4, a significant fraction of bridges have a RI less than 2.0, which means that the results require a review of either the operating load ratings or the vehicle weight data available in the WIM systems.
To observe the change in RI over time, coupled stacked bar charts are created for different routes shown in
Figure 7. The x-axis represents the year in which the WIM data were observed at multiple WIM sites. The y-axis represents the percentage of bridges with RIs in three different categories when analyzed with the associated WIM site data. The white stack represents the percentage of bridges with a RI less than 2.0, the gray stack represents the percentage of bridges with a RI greater than or equal to 2.0 and less than 5.0, and the black stack represents the percentage of bridges with a RI greater than or equal to 5.0. Additionally, to observe the relationship between the time of construction and bridge capacities,
Figure 8 is created.
The design vehicle used in this study is a HL-93 truck, which has a GVW of 80 kips (355.86 kN) as indicated as a horizontal line in
Figure 8. Some bridges at WIM site 0210378 on the I-75 route have a capacity less than 80 kips (355.86 kN) and were constructed before 1980. Some bridges have a capacity as low as 50 kips (222.41 kN) even after reconstruction. In
Figure 9, bridges with a low reliability (RI < 2.0) are presented by age groups in each route.
Notably, most of the bridges with a low RI are 40 years old or older, which attests to the use of operating LR for evaluating load carrying capacities and respective reliability indices. As anticipated, RI and bridge age are highly correlated.
4. Discussion
RIs for bridges in the vicinity of Atlanta and Savannah are also determined.
Figure 10 presents a map showing Atlanta- and Savannah-area bridges as well as the adjacent WIM sites. The highway bridges shown in
Figure 10a,b are paired with the WIM sites in the vicinity of Atlanta and Savannah, respectively. Some of the bridges in the Savannah area appear to be subjected to very high live loads, which are expected due to container terminals and hence are associated with bridges with a low RI. Both areas, Atlanta and Savannah, need further investigation into traffic logistics, such as the transportation of commercial goods and other factors, including the locations of distribution centers supporting e-commerce, in order to better assess the reliability of the bridges.
One of the bridges with a relatively low reliability index (see
Figure 11) is further investigated in this paper. The bridge’s operating LR has been significantly reduced in the NBI. The inspection report also indicates that there is slight beam movement onto caps under “heavier truck traffic-beams.” A beam-end crack is also observed. Additionally, erosion is occurring around piles. The study team has investigated other bridges with a relatively low RI and found similar deficiencies which support a decrease in CR and associated LR. However, this was not consistent across all bridges with a low reliability index. In some cases, live loads drive low (<2.0) reliability indices. In reviewing Georgia’s bridge inventory, the two ratings (CR and LR) are correlated in a nonlinear fashion. A gradient boosting algorithm and its intricacies involving multiple decision trees and neural networks are not a process that one can easily visualize. Thus, it is described as a “nonlinear” relationship herein. Artificial neural network models have hundreds of parameters and internal complexity because many transformations are used during training.
WIM sensors not only provide the weight information but provide information about motor vehicle demographics, which are used for a variety of decision-making purposes in planning and state policy making. Regardless, since the WIM sensors are already installed and maintained, the cost of installation/maintenance is considered as a sunk-cost. The cost of conducting the proposed reliability analysis is relatively minimal (<0.3 M). However, the proposed multisource data reliability analysis process is estimated to save $200 M (=$0.1 M/bridge × approx. 2000 bridges) from being able to better maintain physical assets alone. The economic and social benefits from providing more reliable infrastructure is significantly higher than the cost of conducting a reliability analysis (<$0.3 M). The benefits, including associated long-term returns, outweigh the project cost with a benefit–cost ratio of approximately 666 (=200 M/0.3 M), not including economic/social benefits.
Overall, there are significant benefits in predicting bridge load ratings in terms of condition ratings and comparing them with live loads observed in WIM sensors. Transportation agencies must load rate bridges, but the process is time-consuming and can be subject to errors. Thus, the gradient boosting model can help save time and avoid potential hazards. In addition to risk management and bridge health monitoring, the proposed reliability analysis employing WIM data is expected to enhance failure statistics and associated design process.
5. Summary of the Results and Associated Analysis
The WIM/NBI data-informed reliability analysis provides a dependable and beneficial approach for monitoring bridges. Bridges with a low reliability index are relatively older, and newer bridges with a low reliability index are exposed to larger-than-expected live loads. To close the information gap and mitigate the adverse selection problem in bridge MRR, the reliability indices (RI) are evaluated with a limit state using vehicle weights retrieved from WIM load sensors as load demands and the NBI’s maximum load carrying capacity as resistance.
Figure 4 shows the bridge locations as well as WIM sensor locations.
Figure 7 illustrates the results of the reliability analysis. It is observed that most of the bridges in Georgia have an acceptable range of RI (>2.0). However, some bridges have a relatively lower reliability index, which requires a careful review of vehicle weights and/or load ratings. Furthermore, the vehicle weights have been rapidly increasing over the recent years. Thus, it is more effective and salient to monitor bridges more frequently on critical routes using the WIM data as it provides the latest vehicle weight information at a WIM collection location closest to bridges. It is also observed from
Figure 4 that four sites (sites 2450214 and 2170218 on I-20, sites 217334 and 1750247 on I-16) with older bridges have a comparatively low RI. On the other hand, fewer bridges which are replaced or reconstructed recently (shown as stars in
Figure 4) have a reliability index under 2.0 (bridges on I-75 routes). Oddly, site 1270312 on route I-95 shows a very high number of newer bridges with a low reliability index. This may indicate potential errors such as equipment malfunction in collecting the vehicle weight data and/or vehicle imports at Brunswick, a port in the south of Savannah, may be affecting the north bound route (I-95) towards Atlanta.
The relationship between the changes in the ‘Substructure CR’ and changes in Operating load rating indicates that the LR is affected by multiple factors including the substructure condition ratings and age. A XGBoost machine learning model shows a high R-squared value of 0.77 and a low RMSE value (8.16). The regression analysis indicates that nonlinear machine learning algorithms can accurately predict the operating rating and support the assumption that the maximum load carrying capacities (in the Georgia’s inventory) in the NBI well reflect ultimate bridge capacities in conjunction with the variables available in the NBI. However, such relationship must be verified for other states’ inventory.
Figure 7 shows the output of reliability analysis expressed using the percentage of bridges analyzed with live loads obtained from a selected WIM site. Many bridges in Georgia have a reliability index greater than 5.0. In this study, bridges with a reliability index ranging from 2.0 to 5.0 are considered to be within an acceptable safety margin and thus less prone to failure. On the other hand, bridges with a reliability index less than 2.0 are considered possessing a greater risk to the aging bridges in Georgia. Coincidentally, WIM sites with a lower percentage of bridges with a low RI are associated with older bridges (e.g., see Site 2450214 on the I-20 route in
Figure 7). Therefore, in such a situation, the stakeholders or the decision-makers may selectively approach the bridges for monitoring and/or MRR decisions. Nonetheless, the WIM/NBI data-driven reliability assessment of bridges should be the new normal in bridge maintenance and health monitoring. The advantage of the proposed data-driven bridge risk assessment is that it increases the transparency about bridge safety between owners and users by providing symmetric information. It also provides information about the influence of growing heavy-weight traffic on highways and bulk freight between port and distribution centers/intermodal rail facilities. As a whole, symmetric live load information eliminates the possibility of not acting on MRRs because of overconfidence of owners and/or helps asset managers reduce the risk of adverse selection.
6. Conclusions
This study proposes a data-driven reliability analysis of interstate highway bridges and conducts a risk analysis of bridges in Georgia, which requires a representation of the live load demands and capacities of bridges. The live load demands are determined from vehicle weight data observed in WIM systems. However, the capacity is expected to change over time and thus is more challenging to be determined for a large number of bridges. It is proposed to characterize the capacity by using bridge operating load ratings (Item No. 64) available in the NBI. This approach should be validated by establishing a strong relationship between the operating load ratings and bridge condition ratings which change over time. Reliability indices are determined for a large number of bridges on major routes. Lastly, bridges are divided into three categories based on risk level. The following conclusions are made based on the results of this study:
It is concluded that a robust nonlinear relationship exists between NBI bridge attributes (including condition ratings) and operating load ratings to estimate capacities of a large number of bridges in an inventory. A gradient boosting method is effective for validating a positive correlation between the two for monitoring a large number of bridges in a state’s inventory. Such relationship, if exists, is used to support the assumption that bridge operating ratings can be used to statistically represent bridge capacities varying over time.
In the growing Big Data environment, the proposed WIM and NBI data-driven reliability analysis is an efficient way of monitoring bridge health, evaluate probabilities of failure, and communicate associated risks with bridge owners. It reduces the information asymmetry by providing both the demand and capacity of bridges and thus can help mitigate adverse selection (e.g., opt for repairs in an old bridge purely based on the age and condition) problems in making MRR decisions.
Bridges with a reliability index (RI) less than 2.0 are expected to pose a higher risk to public safety, as well as mobility, although the threshold RI should be determined based on a review of both operating load rating and WIM data. As expected, bridges with a low RI are relatively older. Therefore, WIM data associated with bridges with a low RI need to be closely monitored and/or evaluated more frequently to increase the reliability of the input live load data and avert the risk associated with bridges.
It is concluded that a multi-source reliability-driven data analysis provides an efficient process for mitigating adverse selection problems in bridge maintenance. It involves using both WIM and NBI operating rating data for a reliability analysis, as well as verifying bridge conditions relative to changes in the maximum load carrying capacities and vehicular live loads imposed on bridges.
7. Future Work and Recommendations
In our future work, additional factors such as bridge types and inspectors’ bias for mitigating adverse selection problems must be considered, particularly when the reliability analysis results may not assure a MRR action (or match the proposed model).
Author Contributions
Formal analysis, investigation, visualization, A.S.; conceptualization and methodology, validation, A.S., M.G.C., J.J.Y., S.S.K. and S.D.; resources, data curation, writing—original draft preparation, A.S. and M.G.C.; writing—review and editing, supervision, project administration, funding acquisition, M.G.C., J.J.Y., S.S.K. and S.D. All authors have read and agreed to the published version of the manuscript.
Funding
This research was funded by the Georgia Department of transportation, grant number RP20-04.
Institutional Review Board Statement
Not applicable.
Informed Consent Statement
Not applicable.
Data Availability Statement
Some or all data, models, or code that support the findings of this study are available from the corresponding author upon reasonable request.
Acknowledgments
The study presented in this paper was conducted by the University of Georgia under the auspices of the Georgia Department of Transportation [
28] (RP 20-04). The opinions, findings, and conclusions may not reflect the views of the funding agency or other individuals.
Conflicts of Interest
The funders had no role in the design of the study; analyses, or interpretation of data; in the writing of the manuscript; or in the decision to publish the results.
References
- Caprani, C.C.; OBrien, E.J.; McLachlan, G.J. Characteristic traffic load effects from a mixture of loading events on short to medium span bridges. Struct. Saf. 2008, 30, 394–404. [Google Scholar] [CrossRef]
- Akgül, F.; Frangopol, D.M. Time-dependent interaction between load rating and reliability of deteriorating bridges. Eng. Struct. 2004, 26, 1751–1765. [Google Scholar] [CrossRef]
- Frangopol, D.M.; Strauss, A.; Kim, S. Bridge reliability assessment based on monitoring. J. Bridge Eng. 2008, 13, 258–270. [Google Scholar] [CrossRef]
- Aloisio, A.; Rosso, M.M.; Alaggio, R. Experimental and Analytical Investigation into the Effect of Ballasted Track on the Dynamic Response of Railway Bridges under Moving Loads. J. Bridge Eng. 2022, 27, 04022085. [Google Scholar] [CrossRef]
- Aloisio, A.; Pasca, D.P.; Di Battista, L.; Rosso, M.M.; Cucuzza, R.; Marano, G.C.; Alaggio, R. Indirect assessment of concrete resistance from FE model updating and Young’s modulus estimation of a multi-span PSC viaduct: Experimental tests and validation. Structures 2022, 37, 686–697. [Google Scholar] [CrossRef]
- Lou, P.; Nassif, H.; Su, D.; Truban, P. Effect of overweight trucks on bridge deck deterioration based on weigh-in-motion data. Transp. Res. Rec. 2016, 2592, 86–97. Available online: https://journals.sagepub.com/doi/abs/10.3141/2592-10 (accessed on 20 September 2022). [CrossRef]
- Sun, W.; Bocchini, P.; Davison, B.D. Resilience metrics and measurement methods for transportation infrastructure: The state of the art. Sustain. Resilient Infrastruct. 2020, 5, 168–199. [Google Scholar] [CrossRef]
- Mitoulis, S.A.; Domaneschi, M.; Cimellaro, G.P.; Casas, J.R. Bridge and transport network resilience—A perspective. Proc. Inst. Civ. Eng.-Bridge Eng. 2022, 175, 138–149. [Google Scholar] [CrossRef]
- Stawska, S.; Chmielewski, J.; Nowak, A.S.; Stallings, M. Bridge life consumption by permit vehicles. Struct. Infrastruct. Eng. 2022, 1–13. [Google Scholar] [CrossRef]
- Sinha, A.; Chorzepa, M.G.; Yang, J.J.; Sonny Kim, S.; Durham, S.A. Cognitive Approaches to Hyperbolic Discounting of High-Impact Low-Probability Bridge Overload Events and Live-Load Factors. J. Perform. Constr. Facil. 2022, 36, 04022009. [Google Scholar] [CrossRef]
- Oyegbile, O.B.; Chorzepa, M.G.; Durham, S.A.; Kim, S.S. Novel Prioritization Mechanism to Enhance Long-Term Performance Predictions for Bridge Asset Management. J. Perform. Constr. Facil. 2021, 35, 04020133. [Google Scholar] [CrossRef]
- USDOT; National Bridge Inventory; Fedaral Highway Administration. Washington, DC, USA, 2020. Available online: https://www.fhwa.dot.gov/bridge/nbi.cfm (accessed on 20 September 2022).
- Moses, F. Calibration of Load Factors for LRFR Bridge Evaluation; Transportation Research Board: Washington, DC, USA, 2001; Project C12-46 FY’97; Available online: https://trid.trb.org/view/692975 (accessed on 20 September 2022).
- Estes, A.C.; Frangopol, D.M. Load rating versus reliability analysis. J. Struct. Eng. 2005, 131, 843–847. [Google Scholar] [CrossRef] [Green Version]
- Sandroni, A.; Squintani, F. Overconfidence and asymmetric information: The case of insurance. J. Econ. Behav. Organ. 2013, 93, 149–165. [Google Scholar] [CrossRef]
- Kong, X.; Li, Z.; Zhang, Y.; Das, S. Bridge Deck Deterioration: Reasons and Patterns. Transp. Res. Rec. 2022, 2676, 03611981221080140. [Google Scholar] [CrossRef]
- Das, S.; Kong, X. Quantifying bridge element vulnerability over time. Transp. Res. Rec. 2022, 2676, 460–471. [Google Scholar] [CrossRef]
- Fiorillo, G.; Nassif, H. Application of machine learning techniques for the analysis of national bridge inventory and bridge element data. Transp. Res. Rec. 2019, 2673, 99–110. [Google Scholar] [CrossRef]
- Li, J.; Li, A.; Feng, M.Q. Sensitivity and reliability analysis of a self-anchored suspension bridge. J. Bridge Eng. 2013, 18, 703–711. [Google Scholar] [CrossRef]
- Fiorillo, G.; Ghosn, M. MPI parallel Monte Carlo framework for the reliability analysis of highway bridges. J. Comput. Civ. Eng. 2018, 32, 04017087. [Google Scholar] [CrossRef]
- Chen, T.; Guestrin, C. Xgboost: A scalable tree boosting system. In Proceedings of the 22nd ACM SIGKDD International Conference on Knowledge Discovery and Data Mining, San Francisco, CA, USA, 13–17 August 2016; pp. 785–794. [Google Scholar]
- Meng, Y.; Yang, N.; Qian, Z.; Zhang, G. What makes an online review more helpful: An interpretation framework using XGBoost and SHAP values. J. Theor. Appl. Electron. Commer. Res. 2020, 16, 466–490. [Google Scholar] [CrossRef]
- Prokhorenkova, L.; Gusev, G.; Vorobev, A.; Dorogush, A.V.; Gulin, A. CatBoost: Unbiased boosting with categorical features. Adv. Neural Inf. Process. Syst. 2018, 31. Available online: https://proceedings.neurips.cc/paper/2018 (accessed on 20 September 2022).
- Anguita, D.; Ghelardoni, L.; Ghio, A.; Oneto, L.; Ridella, S. The ‘K’in K-fold cross validation. In Proceedings of the 20th European Symposium on Artificial Neural Networks, Computational Intelligence and Machine Learning (ESANN), Bruges, Belgium, 25–27 April 2012; pp. 441–446. [Google Scholar]
- Jootoo, A.; Lattanzi, D. Bridge type classification: Supervised learning on a modified NBI data set. J. Comput. Civ. Eng. 2017, 31, 04017063. [Google Scholar] [CrossRef]
- Galambos, T.V.; Ravindra, M. Load and resistance factor design. Eng. J. AISC 1981, 18, 78–84. [Google Scholar]
- Nowak, A.S. System reliability models for bridge structures. Bull. Pol. Acad. Sci. Tech. Sci. 2004, 52, 321–328. [Google Scholar]
- GDOT. Georgia’s Traffic Monitoring Program; Office of Transportation Data: Atlanta, GA, USA, 2018.
| Publisher’s Note: MDPI stays neutral with regard to jurisdictional claims in published maps and institutional affiliations. |
© 2022 by the authors. Licensee MDPI, Basel, Switzerland. This article is an open access article distributed under the terms and conditions of the Creative Commons Attribution (CC BY) license (https://creativecommons.org/licenses/by/4.0/).


