1. Introduction
Food security directly determines the stability of the country and society at large. In the grain storage process, the distribution of temperature and humidity in the grain pile changes because of environmental changes, grain respiration, and the presence of microorganisms [
1]. Large differences in the grain storage pressure at different depths of a grain pile lead to an uneven distribution of porosity in the grain pile. Further, the change in grain contact area affects heat transfer. Heat accumulation in grain pile results in high local temperature that can cause grain fever, mildew, and the infestation of pests. If not handled in time, it will hamper the quality of large grain piles [
2,
3]. Therefore, it is very important to study the effect of vertical pressure on the temperature distribution in grain piles for their safe storage.
At present, field measurement and numerical simulation are the main research methods for investigating the pressure field and temperature field distributions of grain piles. To access the pressure field distribution, Janssen [
4] proposed a formula for the calculation of the vertical and horizontal pressures of barrel storage materials through experimentation. This formula has been obtained under the assumption that the vertical pressure at any given depth is uniformly distributed along the horizontal plane and that the external friction coefficient along the vertical direction is constant Therefore, the spatial pressure inside the grain pile cannot be calculated. Considering the uneven vertical pressure along the same horizontal plane inside the grain pile, Horabik et al. [
5,
6] simulated and measured the spatial pressure field of a bulk grain pile in silos. They obtained the influencing mechanism of the grain pile pressure at the bottom of the storage structure along the radial direction. The researchers also proposed the relationship between the depth of the grain pile and its porosity [
7,
8,
9,
10]. The porosity of a grain pile varies significantly with the pressure and depth of the grain pile. The influence of the change of physical parameters caused by the height of the grain pile on heat transfer should be considered when analyzing the grain storage safety in large storage structures [
11,
12,
13].
There are many studies on the distribution of the temperature field in grain piles. Thorpe [
14] established a mathematical model that considers the effect of solar radiation on the heat transfer during grain storage. However, the air temperature between the grain piles and the grain temperature were considered separately, and the changes in latent heat and the momentum in the process of air flow were ignored. The energy balance equation was simplified to an enthalpy equilibrium equation that considered only one-dimensional cases and was, therefore, not applicable to complex conditions. Some authors [
15,
16,
17,
18,
19,
20] studied the variation of temperature and moisture content of stored wheat and paddy with change in external environment through theoretical analysis and numerical simulation. However, the adsorption and desorption characteristics of grain were ignored, and the influence of the change in moisture content of the grain pile on the temperature field distribution was not considered. Considering the effect of grain respiration, Barreto et al. [
21] and Jian et al. [
22] established a two-dimensional finite element model and a three-dimensional transient heat, mass, and momentum coupling model, respectively, to predict the temperature transfer of grain piles stored in cylindrical plastic bag warehouses with changes in the external environment. The predicted results of the model were in good agreement with the measured data. Jian et al. [
23,
24] conducted the long-term monitoring of the temperature and moisture distribution of a bulk wheat grain pile and analyzed the its moisture and heat transfer characteristics in different seasons. They concluded that the temperature gradient at 1.6 m from the bottom of the storage structure could reach 32.4 °C/m. Based on the multi-field coupling theory, Wang et al. [
25,
26] studied the variation in the temperature and humidity of a grain pile with a built-in heat source and self-heating caused by mildew. However, they did not consider the influence of the grain pile pressure on the heat transfer.
Currently, most of the studies on the multi-field coupling focus mainly on the pressure field and temperature field of the grain pile. There are very few studies that consider the influence of grain pile pressure on the distribution of grain temperature field based on the changes in porosity and thermal conductivity. Therefore, it is difficult to conceptualize the grain storage environment accurately with various physical factors influencing it simultaneously.
To solve the problem of the grain pile pressure affecting the porosity, and in turn affecting the heat transfer of the grain pile, a small grain pile test platform was built. In this study, an air bag was used to simulate the effect of vertical pressure on the bulk grain pile. The effect of vertical pressure on porosity of the bulk grain pile was studied through heat transfer test, and then the effect of vertical pressure on temperature gradient at different points in the bulk grain pile was obtained. The temperature field of the bulk grain pile under different vertical pressures was simulated and analyzed by using the multi-field coupling software platform COMSOL. The effectiveness of the method and accuarcy of the parameter values were verified by comparing the simulation data with the experimental results. The distribution law of the temperature and velocity fields of grain pile was analyzed in detail, and the relationship between the area of the increased grain temperature region and storage duration was obtained. This can provide theoretical support for the multi-field coupling theory of grain pile in warehouse and facilitate future research on grain storage safety. According to the distribution law of temperature field and micro-airflow field, the state change can be predicted and analyzed, facilitating the formulation of effective control measures to reduce grain spoilage during storage, and maintain grain quality.
2. Materials and Methods
2.1. Test Equipment
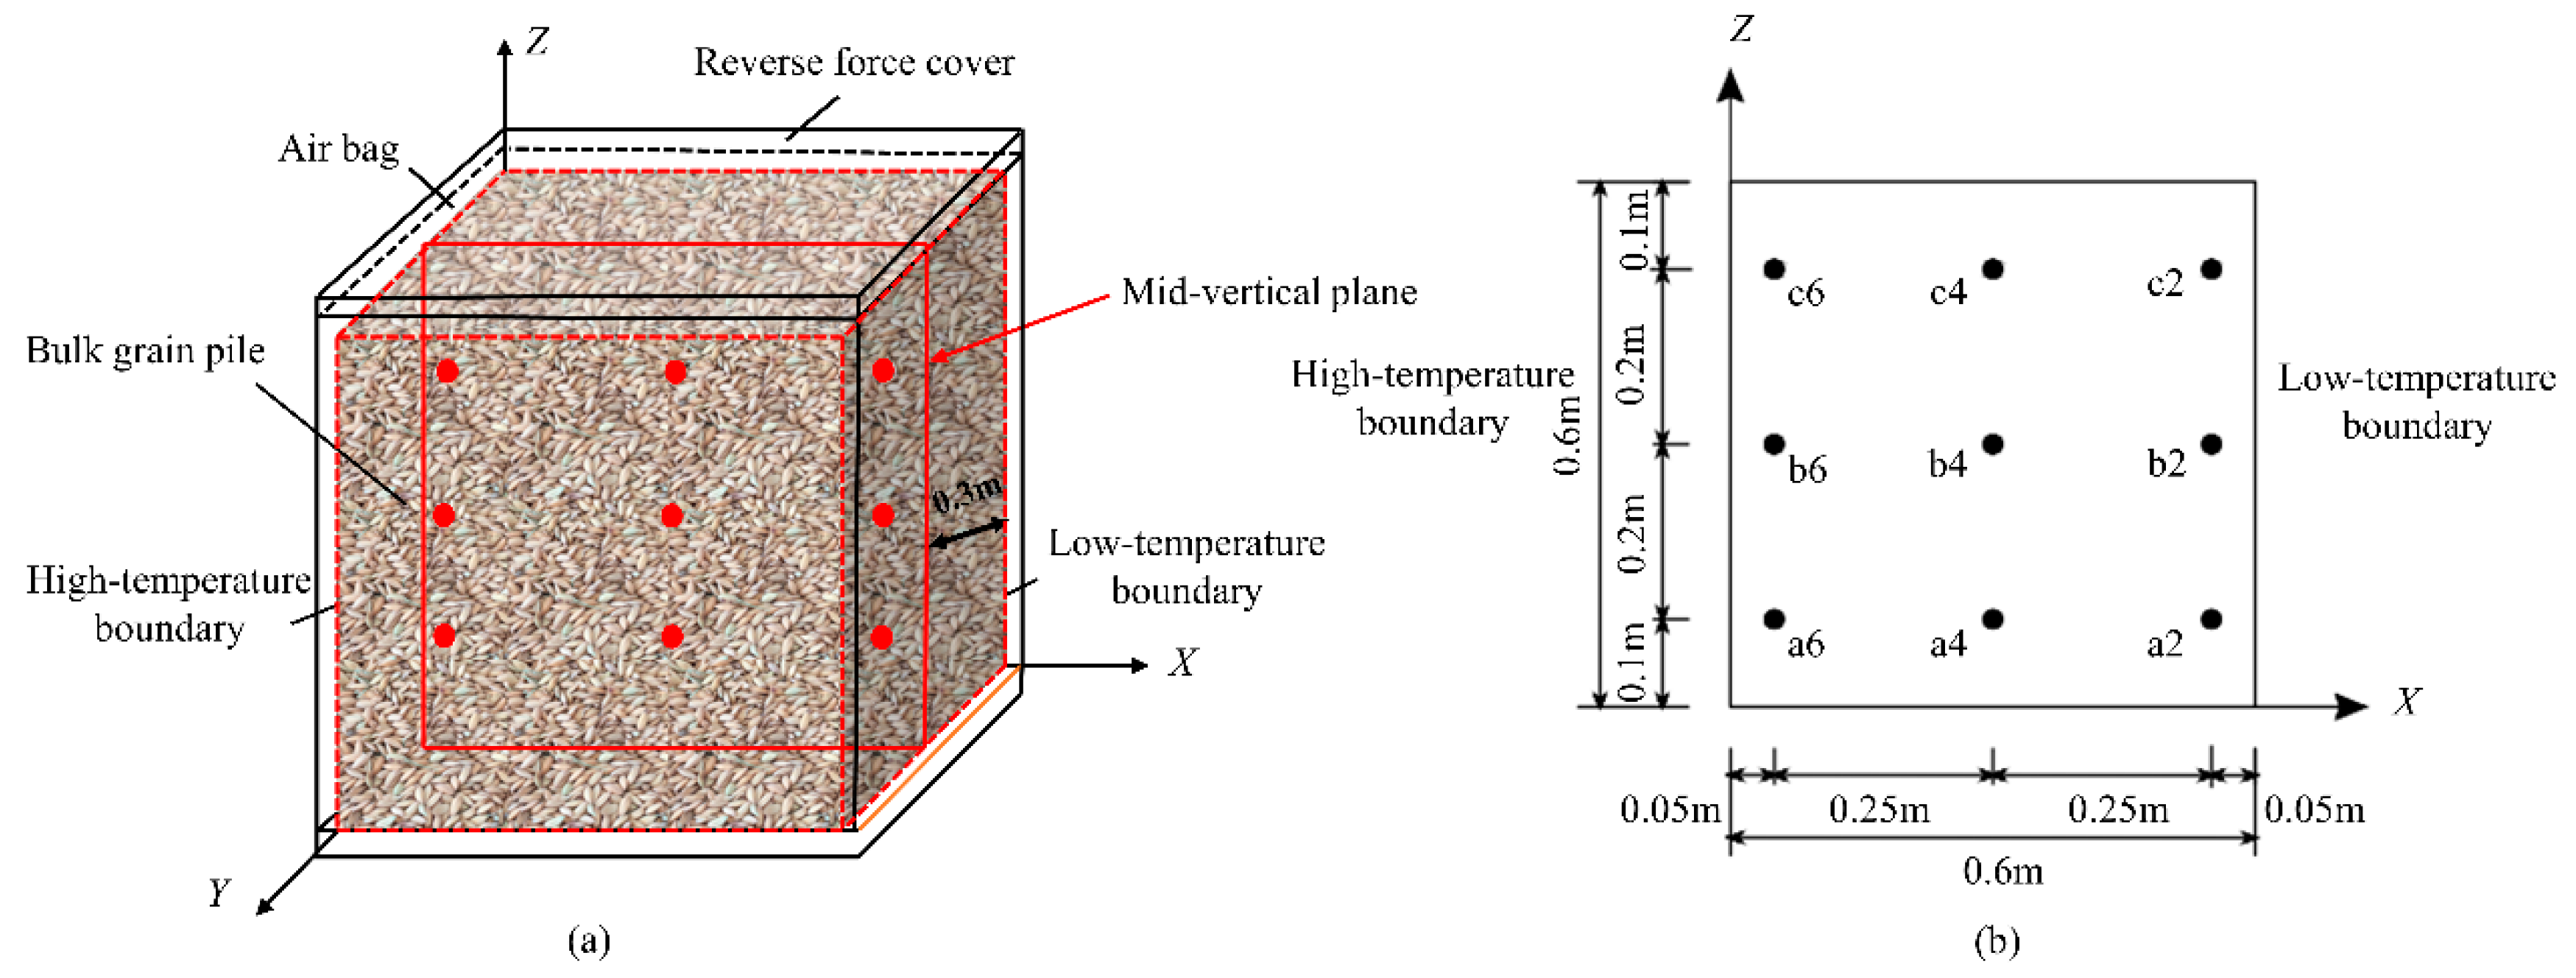
For the experiment, a test chamber with inner wall dimensions of 0.6 m × 0.6 m × 0.6 m (length × width × height) was built. The walls of the test chamber are made up of stainless steel metal plate, and the outer wall of the test chamber is filled with an insulation layer that exhibits effective thermal insulation. The inner walls of the test chamber form a cavity, where water pipes are arranged evenly. A constant-temperature water-flow control system with a stable temperature control is connected externally. The top of the test chamber is a stainless steel reaction cover plate with high rigidity. The layout of the temperature measurement points of the bulk grain pile in the test chamber is shown in
Figure 1. The temperature sensors are arranged in three layers,
Z = 0.1 m, 0.3 m, and 0.5 m along the height, where
Z is the vertical height from bottom plane of the test chamber. The measurement points on the vertical plane along the temperature gradient direction of the grain pile are 0.05 m, 0.30 m, and 0.55 m away from the high-temperature boundary. The central measurement point (b4) is located in the geometric center of the test chamber and is convenient for the evaluation of the unidirectional heat transfer [
27]. Temperature sensors was placed along a measurement plane (
X-
Z plane in
Figure 1). The sensors were spaced in the
X- (lateral) and the
Z- (vertical) directions to continuously record the temperature distributions in the grain pile (
Figure 1). A temperature sensor is set up at each measurement point.
2.2. Materials
China’s northeast japonica rice (early-maturing, Longjing-21) was selected for the study. The initial moisture content of the chosen rice (hereinafter referred to as bulk grain pile) was 11.34% [
28]. To avoid the influence of the uneven initial moisture content in the test, the bulk grain pile was tempered before the test. It was kept in a temperature-controlled room at 25 °C for 10 days, ensuring uniform temperature and moisture content. The moisture content of the bulk grain pile after conditioning was 13.02%. The relative humidity of the bulk grain pile was 67.3%.
2.3. Test Instruments
The following instruments were used in this study:
A 101 electric blast drying oven: Beijing Ever Bright Medical Treatment Instrument Co., Ltd. (Beijing, China); 2638A-60-DC Fluke all-around data collector: FLUKE company, (Everett, WA, USA);
Multi-field coupling experimental device for bulk grain pile: Henan University of Technology (Zhengzhou, China);
Servo flexible loading control system: Jianhu Huitong Machinery Co., Ltd. (Yancheng, China);
HX-08 temperature control system: Jiangsu Tianlin Instrument Co., Ltd. (Wuxi, China);
PT100 high precision platinum resistance probe: OMEGA company (La Chaux-de-Fonds, Switzerland).
2.4. Methods
To study the interaction of the various physical factors and the influence of the vertical pressure on heat transfer in large-scale storage structures, a test chamber as shown in
Figure 1 was built. The temperature boundary conditions and the pressure of the test chamber were controlled to study the effect of the vertical pressure on the temperature field distribution of the grain pile. The temperature range of 0–100 °C is simulated by applying uniform temperature boundary on the left and right sides of the grain pile unit with an accuracy of ±0.05 °C. To ensure heat conservation and heat transfer in the plane perpendicular to the Y-axis of the test chamber, stiff nanoplate insulation pads placed at the uncontrolled temperature boundary walls. The top of the unit is a flexible rubber air bag that is similar to the storage environment. The side wall of the air bag is coated with a thin layer of Vaseline to eliminate friction between the air bag and the top wall and help in the application of uniform pressure to the bulk grain pile in the test chamber. This facilitates the good simulation of the mechanical properties of the bulk grain pile.
2.5. Test Scheme
To study the effect of grain storage pressure on heat transfer of grain piles, a model test was conducted on bulk paddy grain piles. For the experiment, a paddy sample with a moisture content of 13.02% was evenly loaded into the test chamber, and the temperature sensors were arranged, as illustrated in
Figure 1. The total height of the test chamber was 0.6 m. To simulate the pressure ranges of the grain pile in a large-scale granary, the vertical pressure values of 50, 100, and 200 kPa were selected, and the servo flexible loading control system was used to apply pressure on the bulk grain pile in steps of 25 kPa. The initial conditions of each test group were the same. Because the thermal conductivity of the grain pile is low, the heat transfer caused by a small temperature difference is slow. To observe the influence of the vertical pressure on moisture and heat transfer of the bulk grain pile, which in turn changes its porosity, the high-temperature and low-temperature boundaries were set at 35 °C and 10 °C, respectively. This is based on the research results obtained by Jian et al. [
23] regarding the temperature gradient in grain pile and heat transfer at different depths of the grain layer. The objective here is to use the temperature difference to induce heat transfer in the grain pile. The test chamber is placed in a constant-temperature and constant-humidity environment, where the indoor temperature is set at 25 °C. Considering the randomness of the grain arrangement and the discreteness of the experimental data collected, the experiment was repeated three times under the same conditions, and the average value was considered for the study.
2.6. Physical Model and Governing Equation
The storehouse used in this experiment is a three-dimensional physical model with the dimensions of 0.6 m × 0.6 m × 0.6 m (length × width × height). To save the calculation time, the mathematical model of paddy storage without manual intervention was simplified. The main assumptions are as follows: (1) a continuous medium paddy; (2) incompressible ideal air; (3) interconnected pores of the grain pile; (4) negligible thermal radiation between grain particles or between grain and air (ignored); and (5) negligible shrinkage or deformation of grain particles (ignored). In addition, a paddy is a living organism with water absorption and desorption features.
Momentum conservation Equation:
Energy conservation Equation:
Water conservation Equation:
In the above Equations, , , , and uj (j = 1, 2, 3) is the air flow rate in the direction xj, u1 = u, u2 = u3 = v. In the rectangular Cartesian coordinate system, x1 = x, x2 = y, x3 = z, ф is the porosity of paddy bulk grain pile; t is the time (s); p is the air flow pressure (Pa); β is the coefficient of air expansion; ρa and ρb are the air density and bulk grain density, respectively (kg/m3); μ is aerodynamic viscosity (Pa·s); K is permeability(m2); g is the acceleration of gravity (m2/s); T is the temperature of grain pile (K); Ca and Cb are the specific heat capacity of the air and bulk grain pile, respectively (J·kg−1·K); hfg is the heat of evaporation from the grain pile (J/mg); Wg is the moisture content of the grain pile (g/kg); qh is the heat released by the respiration of grains (J/mg); qw is the respiratory water yield of the grain pile (kg/mg); YH2o is the amount of water released by the grain pile in a day; YCo2 is the release rate of co2 in one day; Dv is the diffusion coefficient of moisture in the air (m2/s); and ω is the moisture content of air, τ is tortuosity.
2.7. Model Parameters and Boundary Conditions
The correct setting of the simulation parameters is an important factor affecting the accuracy of numerical simulation. The grain pile pressure affects the temperature field distribution by changing the porosity of the grain pile. First, the vertical pressure and porosity model of the bulk grain pile were obtained through experimentation, and subsequently, the temperature field distribution of the grain pile under different vertical pressures was simulated using COMSOL. The high-temperature and the low-temperature boundary walls of the of the test chamber were set at 35 °C and 10 °C, respectively, and all the other four walls were insulated. The relevant parameters of the grain pile and air are presented in
Table 1.
4. Numerical Simulation Results and Analysis
4.1. Verification of Simulated Temperature of Grain Pile under Different Vertical Pressures
To verify the accuracy of the numerical simulation and parameter values, the simulation data and experiment data under the same conditions were compared and analyzed.
Figure 6 shows the comparison between the simulated and experimental values of the bulk grain pile under different pressures at the height of 300 mm on the middle vertical surface of the test chamber. The simulated value and test value are essentially the same under different pressures. However, there are differences in the temperature of the grain pile measured at the same instant. The maximum temperature difference is 1.45 °C, and the relative error is 4.9%. This error is attributed to the difficulty in realizing the absolute heat insulation boundary condition in the test. There is a particular amount of heat exchange between the upper and lower ends of the temperature control boundary of the test device and the environment. In numerical simulation, the boundary conditions and parameters can be set to achieve an ideal heat insulation that makes the simulation value of the high-temperature boundary wall higher than the experimental value, and the simulation value of low-temperature boundary wall lower than the experimental value. In general, it is clear that there was a high agreement between the simulation results and the experimental data. In all cases, the coefficients of determination (R
2) between the experimental and simulated temperatures were >0.95, as shown in
Figure 6, indicating the good performance of the model in predicting temperature profiles of grain pile under different vertical pressures. Overall, the numerical results appropriately reflect the experimental law, thereby confirming the effectiveness and credibility of the numerical simulation method.
4.2. Simulation Results of Temperature Field
To clarify the temperature change of stored grain pile, the distribution of the temperature field in the bulk grain pile at different time points was studied and analyzed.
Figure 7 shows the middle plane temperature distribution nephogram of the bulk grain pile at different time points with a vertical pressure of 50 kPa. The temperature distribution of the bulk grain pile in the model warehouse is uniform when the simulated storage time is 1 h. Due to the combined effect of heat conduction and natural convection, the temperature of the grain pile is redistributed. The temperature of the bulk grain pile near the high-temperature boundary wall is higher than the initial temperature and forms a high-temperature region, and the temperature of the bulk grain pile near the low-temperature boundary wall forms a low-temperature region. The results show that the isotherm was nearly vertical, and the wall temperature exhibited a rectangular distribution around the control temperature for 24 h. With the increase in the storage time and heat transfer from the high-temperature region to the low-temperature region, the area of the high-temperature region increases, and the area of the low-temperature region decreases. The simulated grain storage (for 72 h) isotherm is almost “s”-shaped, and the temperature distribution of the high and low-temperature regions is trapezoidal. Considering the 23.75 °C isotherm as an example, the dotted line in
Figure 7 is the vertical line where the temperature difference between the top of the storage structure and the bottom of the storage structure is the largest, and the abscissa of the vertical line is at the top of the storage structure. The main reason for the temperature difference at each point on the vertical line is the influence of natural convection on the heat transfer of the bulk grain pile. The temperature difference between the top and bottom of the storage structure is 1.0 °C for 24 h. With increase in storage time, the influence of natural convection on the heat transfer of the bulk grain pile increases, and the temperature difference increases. At 48 h, the temperature difference is 1.87 °C, and at 72 h, the temperature difference is 2.75 °C.
In the process of the solid heat conduction in an ideal state, heat is transferred from the high-temperature to the low-temperature region in parallel. A grain pile is typically a porous medium. Under static storage conditions, the temperature gradient causes natural convection. The hot air near the high-temperature boundary wall diffuses from the bottom to the top of the grain pile, while the heat is transferred upward simultaneously. The area of the high-temperature region exhibits a wide top and narrow bottom, while the area of the low-temperature region exhibits a narrow top and wide bottom.
4.3. Effect of Vertical Pressure on Temperature Field of Grain Pile
To reveal the influence of pressure on the temperature field distribution of grain pile, the temperature field of grain pile at the same time under different pressures was simulated.
Figure 8 shows the middle plane temperature distribution of the grain pile under different vertical pressures for 72 h. The temperature change trend of the bulk grain pile is essentially the same under different vertical pressures. When the pressure is 50 kPa, the temperature field distribution of the grain pile is uneven, and the isotherm curve is large. With the increase in vertical pressure, the porosity of the bulk grain pile decreases, the contact area between the grains increases, and the convection heat transfer is hindered. When the vertical pressure is 200 kPa, the temperature distribution in the bulk grain pile is uniform, and the isotherm does not exhibit a large bend. Considering the isotherm of 23.75 °C as an example, the dotted line in
Figure 8 is the vertical line where the temperature difference between the top and bottom of the storage structure is the largest. When the vertical pressure is 50 kPa, the temperature difference between the top and bottom of the storage structure is the largest at 2.75 °C. With increase in vertical pressure, the convection heat transfer is hindered, and the temperature difference decreases. When the vertical pressure is 100 kPa, the temperature difference is 1.57 °C, and the minimum temperature difference is 0.82 °C at 200 kPa. When the vertical pressure increases from 50 kPa to 200 kPa, the rate of change of temperature at the top and bottom of the silo decreases from 11.58% to 3.43%. With increase in the vertical pressure, the transfer path is reduced, the transfer speed is accelerated, and the temperature distribution becomes more uniform. Pressure has an obvious effect on the temperature distribution and heat transfer of the grain pile.
4.4. Change in Area of High-Temperature Region
In the process of long-term grain storage, due to grain and microbial respiration, the heat in the grain pile accumulates, leading to the rise in the local temperature of the grain pile. If the grain is exposed to the high-temperature region for a long time, mildew is formed, resulting in the decline of seed vigor, the decrease of germination rate, and even the loss of seed value. The temperature of the test chamber is 25 °C, and the region with the temperature higher than 25 °C is defined as the high-temperature region. The temperature value of each point in the bulk grain pile was obtained by numerical simulation, and the area of the high-temperature region in the grain pile was calculated.
Figure 9 shows the change in the area of the high-temperature region with increase in storage duration under different pressures. The results show that the proportion of the area of the high-temperature region decreases linearly with the storage time under different pressures. It is expressed as:
where
ηT is the proportion of the area of the high-temperature region (%),
T is the storage duration (h),
η0 is the proportion of the area of the high-temperature region of the grain pile initially under various pressures (%), and
a is the reduction coefficient of the area of the high-temperature region of the grain pile with the storage duration. For parameter
a, when the vertical pressure is 50 kPa,
a is the minimum with a value of 0.0003 (R
2 = 0.99). With the increase in the vertical pressure, the value of
a increases. When the vertical pressure is 100 kPa,
a is 0.0005 (R
2 = 0.98), and at 200 kPa, it is 0.0007 (R
2 = 0.98). When R
2 is not less than 0.95, it is indicative that the mathematical model selected is suitable for the fitting of the area of the high-temperature region of the bulk grain pile under the simulated conditions when the vertical pressure range is approximately 50–200 kPa.
It can be seen from
Figure 9 that under different vertical pressures, the change trend of the areas of the high-temperature region is essentially the same, and there are differences in the of the areas of the high-temperature region under different pressures calculated at the same time instant. When the grain storage for 72 h under a vertical pressure of 50 kPa was simulated, the proportion of the areas of the high-temperature region decreased from 50.77% to 48.21%, with a change rate of 5.04%. When the vertical pressure increased to 200 kPa, the proportion of the area of the high-temperature region decreased from 49.21% to 43.41% and the change rate was 11.79%. With the increase in the vertical pressure, the proportion of the area of the high-temperature region decreases. As the pressure changes, the porosity of the bulk grain pile and subsequently affects the heat transfer rate, and with the change in the storage time, the change in the area of the high-temperature region is significantly affected by the pressure.
4.5. Simulation Results of Micro-Airflow Velocity Field in Grain Pile
The main driving force of the micro-airflow between the pores of the grain pile is the temperature gradient of the grain pile that affects the temperature transfer and water migration of the grain pile.
Figure 10 shows the nephogram of the vertical velocity field distribution in the bulk grain pile at different time points when the vertical pressure is 50 kPa.
The velocity of the micro-airflow in the storage structure is extremely low and is of the order of 10−4 m/s. Grain storage for 24 h was simulated. Under constant temperature difference, a clockwise rotating air flow was generated in the test chamber. The temperature gradient near the temperature control wall was large. In this area, the micro-airflow velocity was high, with a maximum value of 6.75 × 10⁻⁴ m/s. The internal micro-airflow was weak. The internal micro-airflow area with the flow rate of 10−5 m/s accounted for 41.6%. With the increase in the storage duration, the rotating airflow gradually affected the entire experimental storage structure. After 72 h of simulated grain storage, the micro-airflow velocity near the temperature-control wall decreased slightly. Its maximum value was 6.2 × 10⁻⁴ m/s. The airflow velocity near the top and bottom of the storage structure increased, while the angle between the top of the storage structure and the area of the low-speed airflow decreased gradually. The proportion of the micro-airflow area with the velocity order of 10−5 m/s was 28.75%. Under a constant temperature difference, clockwise rotating airflow was generated inside the test chamber. When the temperature gradient in the bulk grain pile was maximum, the velocity of the micro-airflow reached a maximum value. The micro-airflow affects the temperature transfer of the bulk grain pile and forms an uneven temperature distribution in the test storage structure, leading to a higher temperature at the top of the storage structure than that at the bottom.


