Article

Seismic Response of Immersed Tunnel Subject to Oblique Incidence of SV Wave

1
School of Civil Engineering and Transportation, South China University of Technology, Guangzhou 510640, China
2
CCCC Highway Consultants Co., Ltd., Beijing 100088, China
*
Author to whom correspondence should be addressed.
Appl. Sci. 2022, 12(20), 10440; https://doi.org/10.3390/app122010440
Submission received: 5 September 2022 / Revised: 4 October 2022 / Accepted: 13 October 2022 / Published: 16 October 2022

Abstract

:
In view of the near-field seismic action, considering that oblique incidence of seismic waves is more realistic than vertical incidence, the seismic response of the Hong Kong–Zhuhai–Macao immersed tunnel subjected to an obliquely incident SV wave is investigated. Using the finite element method and time-domain wave method, the seismic input is transformed into an equivalent node load with a viscous–spring artificial boundary, and a three-dimensional simulation technology for SV waves of oblique incidence is presented. A half-space numerical example is given to demonstrate the accuracy of the proposed simulation technology. Taking the stress field formed by the self-weight stress and hydrostatic pressure as the initial state of the dynamic response analysis, the static–dynamic coupling numerical simulation of the seismic response of a soil-immersed tunnel system is realized. The results show that the amplification in the vertical and longitudinal response of the tunnel, due to the oblique incidence, reaches maximum when the incident angle is close to the critical angle. Furthermore, the horizontal response and incident angle show the inverse relation and tend to be stable. In addition, the oblique incidence also causes asymmetric shearing in symmetric parts of the tunnel. The root of the shear key easily produces tensile cracks, while the end angle of the shear key is prone to stress concentration and local damage. Thus, the impact of oblique incidence should be considered in the seismic design, and attention should be paid to the optimization of the end angle of the shear key and the configuration of anti-crack reinforcement at the root of shear key to meet the seismic requirements.

1. Introduction

The immersed tunnel has the characteristics of good adaptability to stratum conditions and high water tightness of prefabricated construction. At present, it is more and more used in cross-river and cross-sea tunnels. With the continuous construction of infrastructure, the underwater immersed tunnel is likely to be built near the earthquake zone, which may lead to disastrous consequences in the event of earthquake damage. Therefore, it is of great significance for the safety evaluation and reasonable design to study the seismic response of immersed tunnels.
Immersed tunnels are usually built in weak strata, with long lengths and shallow burial depths. Under the action of an earthquake, there are dynamic interactions between soil and structure, the coupling of water and structure, etc. These make the seismic analysis of immersed tunnels a complex problem. Numerical methods (NM) such as the finite element method (FEM), finite difference method, and boundary element method are widely used in the dynamic analysis of immersed tunnels due to their versatility and reliability. NM can effectively solve the seismic response problem under actual working conditions [1]. Researchers often use a simplified calculation method [2,3,4] and two-dimensional (2D) cross-section model [5,6] to analyze the dynamic performance of immersed tunnels. The simplified calculation method is to introduce the mass–spring model [7] into the finite element (FE) model, and cut the soil around the tunnel into several slices. The mass of each slice is concentrated in a lumped mass point, and the lumped points are connected with each other and connected to the tunnel beam. Meanwhile, the bedrock is connected to the lumped points of soil. These connections are composed of springs and viscous dampers in parallel, and the parameters of each slice are calculated by the basic shear mode of the soil layer. However, vertical shear cannot be transmitted between adjacent slices, and the model cannot properly simulate the dual role of soil as both the propagation medium of the seismic wave and the supporting medium of the structure. Hence, considering the soil–structure interaction (SSI) is essential to check the seismic performance of the underground structure by using a global model. During an earthquake, the dynamic response of underground structures is controlled by the deformation of surrounding soil [8,9], and the type and strength of soil [10,11,12] and the selection of the soil–structure interface [12,13] have significant effects. Furthermore, the SSI factor can even be used to evaluate the parameter values in the design [14]. In addition, models considering SSI can reduce the peak acceleration of the soil surface [15], allowing more accurate results to be obtained for seismic response studies of underground structures [16,17,18,19]. The 2D global model simplifies the tunnel into a 2D plane and simply decomposes the dynamic response of the tunnel into in-plane and out-of-plane for solution. This model cannot effectively simulate the cooperative work among various components of the tunnel, and it is difficult to fully reflect the structural performance, which subjects the tunnel structure to potential safety hazards in the service process. Thus, it is appropriate and desirable to utilize a three-dimensional (3D) FE numerical model of SSI that consider the most comprehensive factors.
The traveling wave effect is one of the characteristics of the spatial variation of ground motion. For buried structures with large dimensions such as long tunnels, the impact of the traveling wave effect should be properly considered, and the oblique incidence of seismic waves is the main physical mechanism of the traveling wave effect. Most of the existing studies on seismic action assume that earthquakes are vertically incident. In fact, when the distance between the epicenter and the structural engineering site is short, the incident angle of the ground motion is usually oblique, which has been confirmed in the statistics of many seismic observation records [20]. Several studies have been carried out on the seismic analysis of underground structures under oblique incident seismic waves. Li et al. [21] developed a numerical method to study the longitudinal seismic performance of tunnels by using the nonuniform input of oblique incidence seismic SH, P, and SV waves. Huang et al. [22,23] proposed a method to realize the oblique incidence of the plane P wave, and studied its influence on long-lined tunnels and normal fault underground tunnels. Wang et al. [24,25] studied the damage evolution process of an underground powerhouse with an obliquely incident seismic wave, and found the coherence between the results of a numerical simulation and field observations. He et al. [26] analyzed the influence of SV wave incident angle on the Nanchang Honggu immersed tunnel using time-domain FEM and a viscous–spring artificial boundary (VSAB), and the results showed that the seismic response of the immersed tunnel under oblique incidence of the SV wave was significantly different from that under vertical incidence. Zhang et al. [27] proposed a 2D structure–water–sediment–rock interaction model to evaluate the seismic response of submarine immersed tunnel under an oblique incident wave, with the result showing that the larger incident angle of P wave is more likely to cause large deformation of the tunnel. As mentioned above, the 2D plane model cannot fully reflect the performance of tunnel structure, especially the cooperative work of shear keys in an immersed tunnel. Zhou et al. [28] established the 3D FE model of Tianjin Haihe immersed tunnel, and studied the seismic variation law of the tunnel under the oblique incidence of an SV wave using the dynamic stiffness matrix of soil layer and half-space [29]. However, this method was performed in the frequency domain, it could not be used directly with timestep integration techniques to solve complex seismic problems, and the influence of hydrodynamic pressure was not considered. Under the action of a vertical incident wave, the hydrodynamic pressure has a greater impact on the stress of an immersed tunnel [30], and the obliquely incident seismic wave contains the seismic excitation of the vertical component.
In light of this, the present study aims to establish a 3D time-domain numerical model under oblique incidence of a seismic SV wave using FEM and analyze the seismic response of an immersed tunnel. The model assumes that the ground is a half-space with uniform elasticity and starts with the calculation of the free field ground motion. The equivalent nodal load based on VSAB is obtained by programming with FORTRAN language, and then imported into the ABAQUS FE software to realize the input of the seismic wave into the finite region to be analyzed, so as to carry out a 3D simulation of an elastic half-space site response under an oblique plane SV wave. The accuracy of this simulation is verified using a free-field numerical example. On this basis, a 3D SSI model is established to simulate the seismic response of an immersed tunnel with obliquely incident SV wave, which provides a reference for the seismic design.

2. Computational Simulation for Oblique Incidence of SV Waves

In this section, the time-domain FE simulation technology for oblique incidence of a seismic SV wave is studied. When the FEM is used to solve the problem of seismic wave propagation, seismic waves are reflected at the truncated boundary of the finite calculation area, which requires the artificial boundary to eliminate the reflection of seismic waves. In order to correctly simulate the oblique incidence of seismic waves, the free-field ground motion of oblique incidence must be correctly solved.

2.1. Free-Field Ground Motion

As shown in Figure 1, the plane SV wave with an incident angle α is reflected on the free surface, forming a plane SV wave and a plane P wave with the reflection angle of α and β, respectively. The particle vibration direction of the medium propagating SV wave is perpendicular to the forward direction of the SV wave, and shear deformation of the medium occurs when the SV wave passes through. However, the particle vibration direction of the medium propagating P wave is consistent with the forward direction of the P wave, and the passing of the P wave causes the volume expansion and contraction of the medium. According to the stress balance and displacement continuity, the angle and amplitude amplification factor of reflected wave can be expressed as shown in Equation (1).
β = arcsin ( c p sin α c s ) A 1 = c s 2 sin 2 α sin 2 β c p 2 cos 2 2 α c s 2 sin 2 α sin 2 β + c p 2 cos 2 2 α A 2 = 2 c p c s sin 2 α cos 2 α c s 2 sin 2 α sin 2 β + c p 2 cos 2 2 α ,
where A1 and A2 are the amplitude amplification factors of the reflected SV wave and reflected P wave, respectively. The reflection angle β is smaller than π/2, such that there is a critical value for the incident angle of the plane SV wave, i.e.,
α < arcsin ( c s / c p ) .
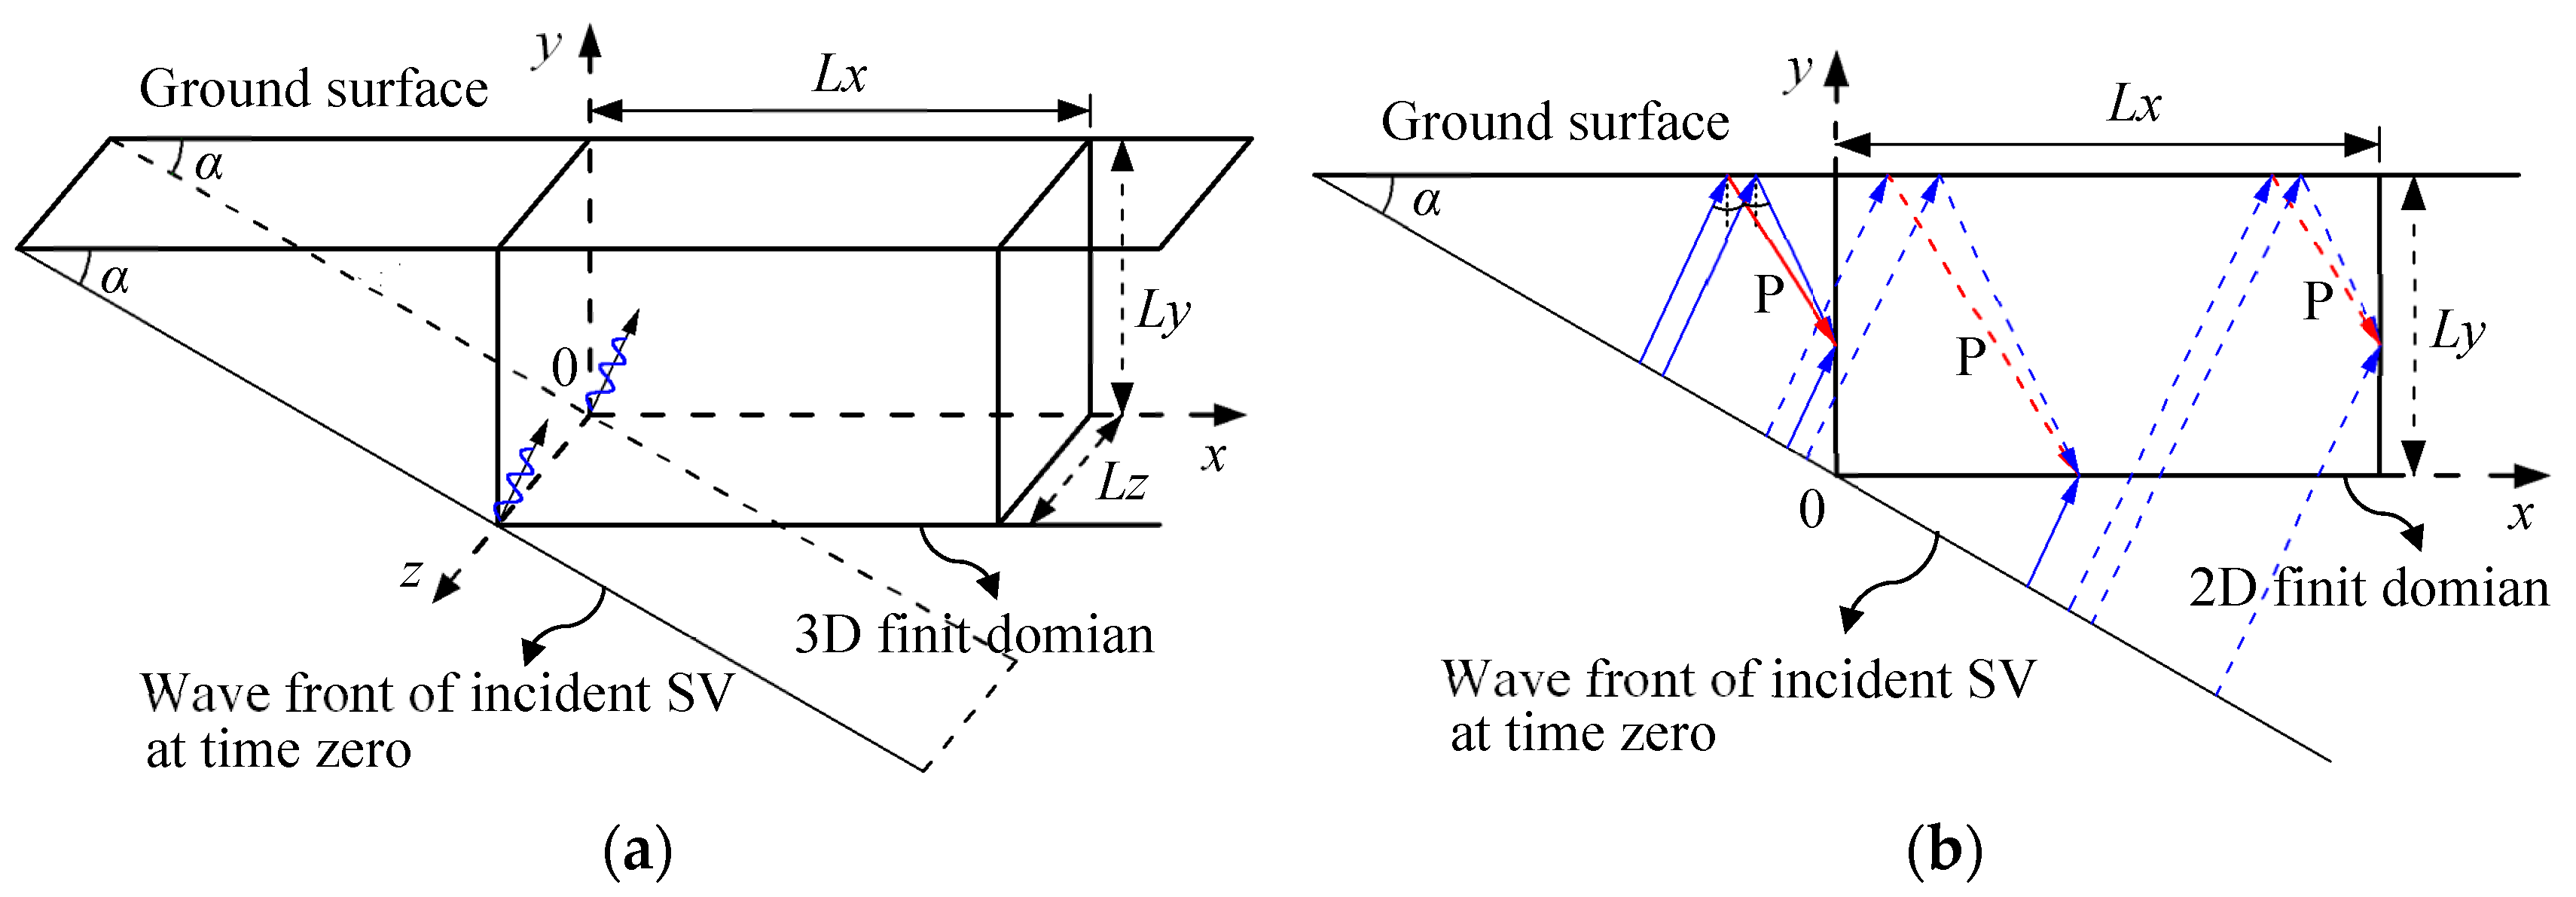
A cube soil region is intercepted, which is subjected to a plane SV wave with an oblique incidence angle α. Assuming that the wave front of the incident SV wave at time zero passes through the z-axis and forms an angle α with the ground (Figure 2a). The length, width, and height of the truncated region are Lx, Ly, and Lz, respectively, while the coordinates of a node l in the truncated region are (x, y, z). Figure 2b is the corresponding 2D model, which shows the wave field acting on each truncated boundary. The wave field of the truncated boundary consists of the directly incident SV wave, the SV wave reflected by the ground surface and the P wave reflected by the ground surface generated by wave type conversion.
Considering the time delay of the wave in the propagation process, the time of the incident SV wave, reflected SV wave, and reflected P wave propagation to the node l are set as ∆t1, ∆t2, and ∆t3, respectively; the expressions for ∆t1, ∆t2, and ∆t3 are as follows:
Δ t 1 = x sin α + y cos α c s Δ t 2 = x sin α + ( 2 L y y ) cos α c s Δ t 3 = x sin α + y cos α c s + ( L y y ) cos ( α + β ) c s cos β + L y y c p cos β ,
where cs and cp are the shear and compression wave velocities of the medium, respectively.
Assuming that the displacement time history of input seismic SV wave is u0(t), then the wave field on each truncated boundary is composed of an incident SV wave u0(t − ∆t1), a reflected SV wave u0(t − ∆t2), and a reflected P wave u0(t − ∆t3). The displacement of the wave field can be written as
u l 1 f ( t ) = u 0 ( t Δ t 1 ) cos α A 1 u 0 ( t Δ t 2 ) cos α + A 2 u 0 ( t Δ t 3 ) sin β u l 2 f ( t ) = u 0 ( t Δ t 1 ) sin α A 1 u 0 ( t Δ t 2 ) sin α A 2 u 0 ( t Δ t 3 ) cos β .
The displacement u l 3 f (t) in the z-direction on each truncated boundary surface is zero, where u l 1 f (t), u l 2 f (t), and u l 3 f (t) are the displacement of the wave field of node l in the x-, y-, and z-directions respectively.
According to the stress state of plane wave propagation [31], the stress of node l on the left boundary is obtained as follows:
σ l 1 f = G c s sin 2 α ( u ˙ 0 ( t Δ t 1 ) A 1 u ˙ 0 ( t Δ t 2 ) ) + A 2 λ + 2 G sin 2 β c p u ˙ 0 ( t Δ t 3 ) σ l 2 f = G c s cos 2 α ( u ˙ 0 ( t Δ t 1 ) + A 1 u ˙ 0 ( t Δ t 2 ) ) A 2 G sin 2 β c p u ˙ 0 ( t Δ t 3 ) σ l 3 f = 0 ,
where σ l 1 f (t), σ l 2 f (t), and σ l 3 f (t) are the stress of the wave field of node l in the x-, y-, and z-directions, respectively; λ and G are the media Lamé constants.
The stress of node l on the front boundary is
σ l 1 f = 0 σ l 2 f = 0 σ l 3 f = A 2 λ c p u ˙ 0 ( t Δ t 3 ) .
For the bottom boundary surface, the free-field stress is
σ l 1 f = G c s cos 2 α ( u ˙ 0 ( t Δ t 1 ) + A 1 u ˙ 0 ( t Δ t 2 ) ) A 2 G sin 2 β c p u ˙ 0 ( t Δ t 3 ) σ l 2 f = G c s sin 2 α ( u ˙ 0 ( t Δ t 1 ) + A 1 u ˙ 0 ( t Δ t 2 ) ) + A 2 λ + 2 G cos 2 β c p u ˙ 0 ( t Δ t 3 ) σ l 3 f = 0 .
The free-field stress on the back boundary of truncated region is opposite to that on the front boundary. The same is true for the right boundary, i.e., the stress on the right boundary is opposite to that on the left boundary.

2.2. Seismic Input Method

2.2.1. VSAB Condition

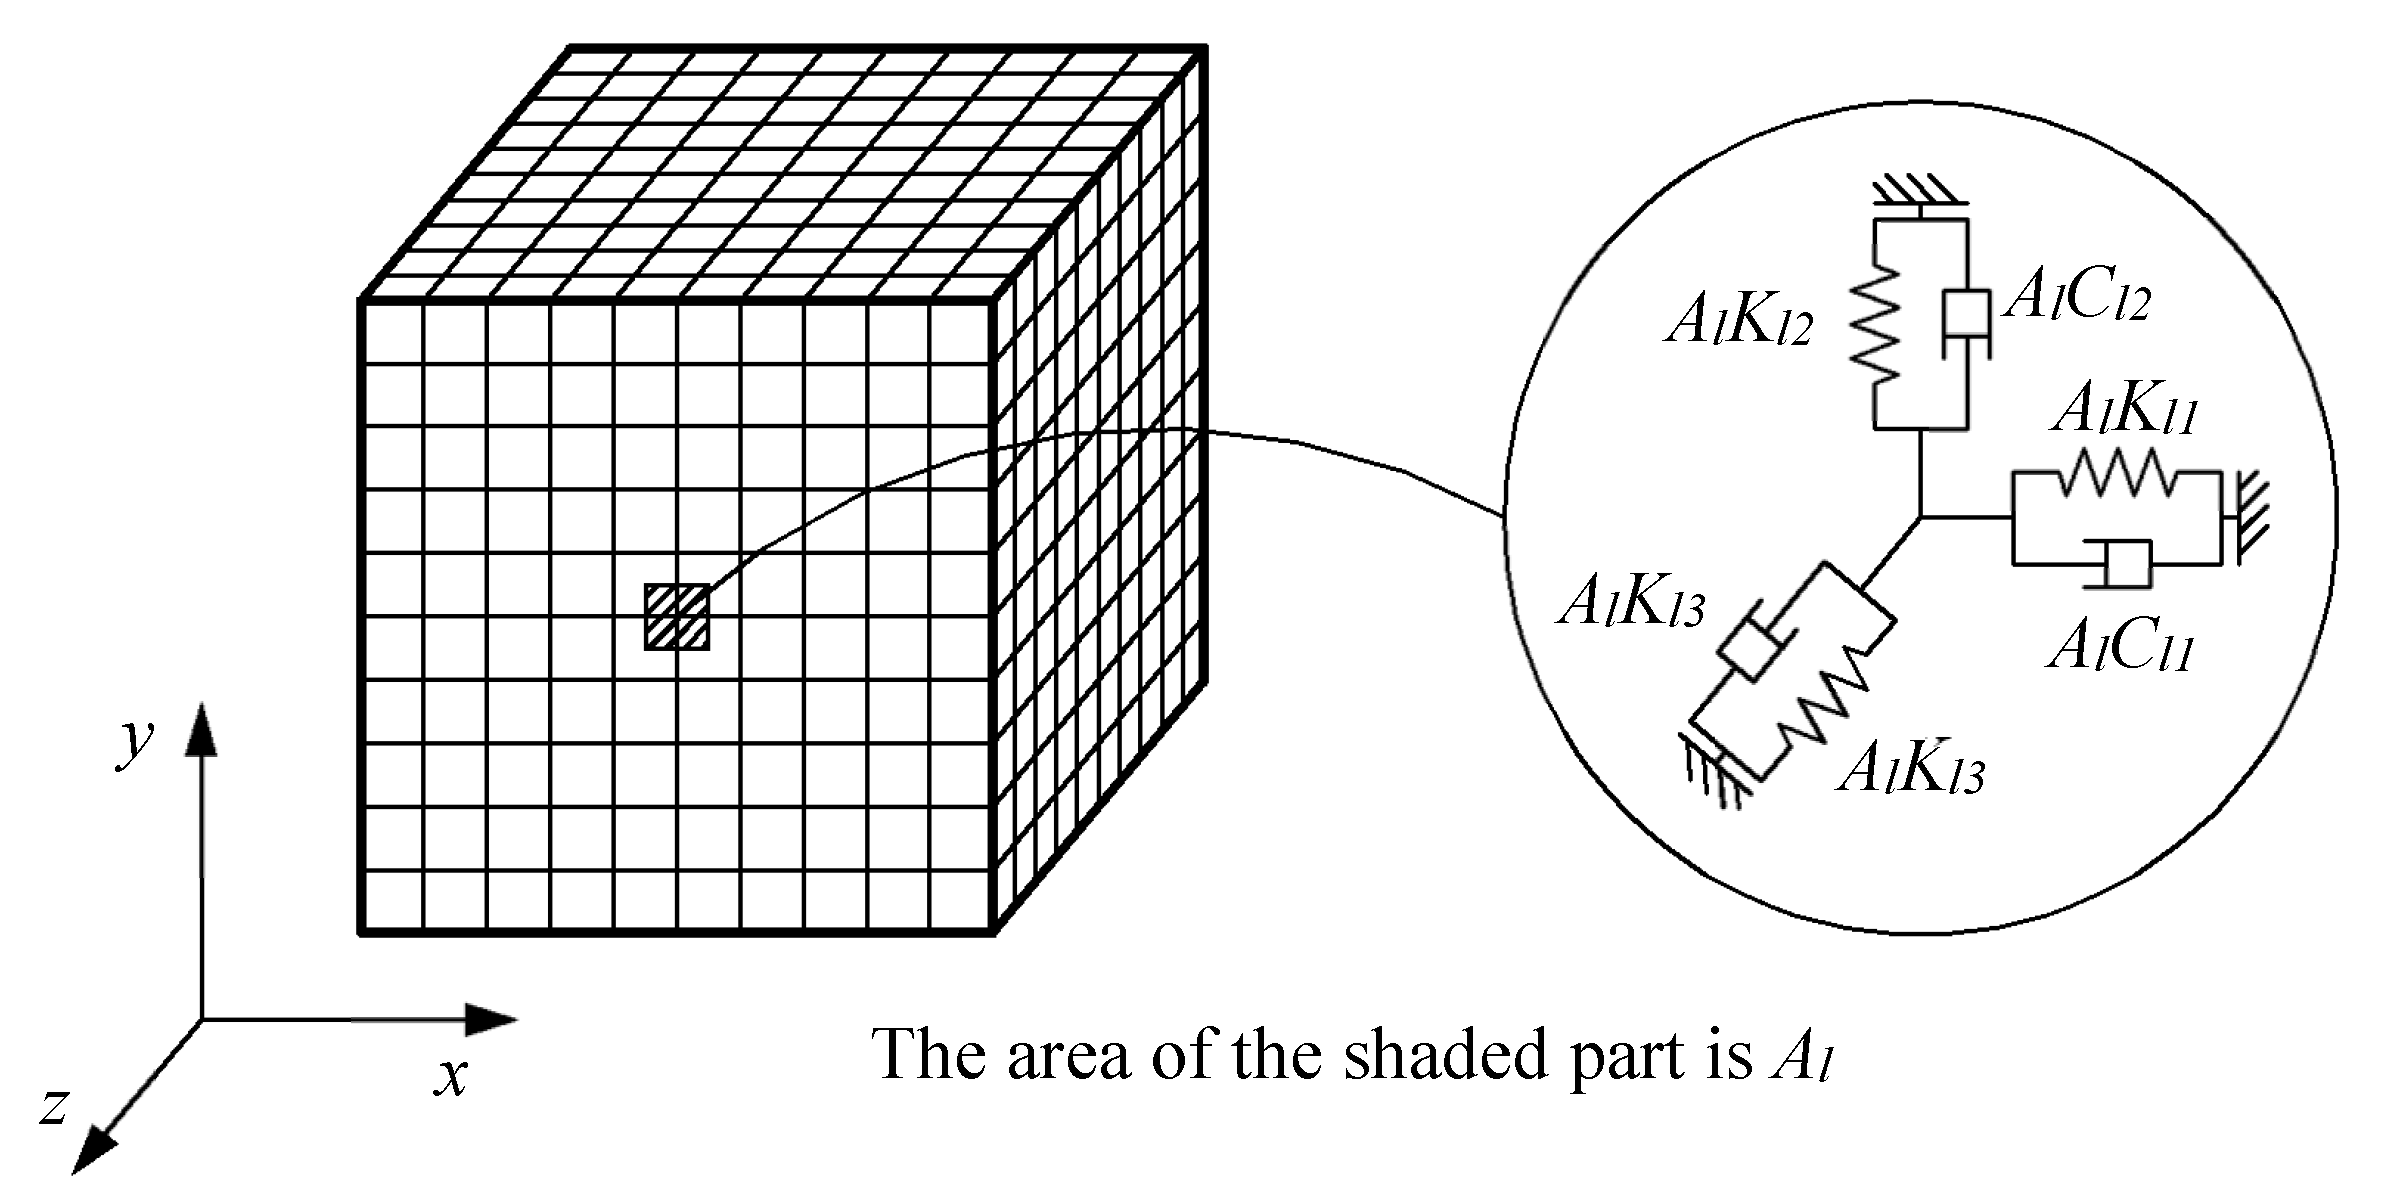
In the semi-infinite space field, seismic waves produce reflected waves on the free surface and propagate to the infinite distance of the foundation. Numerical simulations can only simulate the finite space, and the reflected wave generated by the free surface is again reflected at the truncated boundary, which is inconsistent with the actual half-space wave field. The VSAB is used to eliminate wave reflection and simulate wave transmission [32]. As shown in Figure 3, the VSAB consists of a spring and a damper in parallel [33]. According to Equations (8) and (9), the lumped spring stiffness K and the lumped damping coefficient C are calculated.
K N = A l α N G R , C N = A l ρ c p ,
K T = A l α T G R , C T = A l ρ c s ,
where G and ρ are the shear modulus and density of the medium, respectively, R is the distance from the wave source to the artificial boundary, Al is the equivalent area of node l, αN and αT are the correction coefficients of normal and tangential VSAB, respectively, and the recommended values for 3D problems are 1.33 and 0.67 [33]; the subscript N represents the normal direction, and the subscript T represents the tangential direction.

2.2.2. Equivalent Input Load

When the intercepted finite calculation area and artificial boundary are used to simulate the entire infinite domain foundation, the stress and displacement of the artificial boundary must be consistent with those in the original free wave field when the equivalent load is applied on the artificial boundary, so as to achieve accurate ground motion input. To deal with the structure–foundation dynamic interaction, Liu and Lu [34] proposed a wave input method which was suitable for VSAB. The equivalent load to be applied is as follows:
F l ( t ) = A l σ 0 ( x l , y l , t ) + K u 0 ( x l , y l , t ) + C u ˙ 0 ( x l , y l , t ) ,
where K and C are the artificial boundary parameters of node l, and the specific values are obtained according to the method of realizing VSAB. σ0(xl,yl,t) is the stress of the free wave field at the truncated boundary of node l, which can be calculated using Equations (5)–(7); u0(xl,yl,t) and u ˙ 0 ( x l , y l , t ) are the displacement and velocity of node l, respectively, which can be calculated using Equation (4).

2.3. Numerical Verification

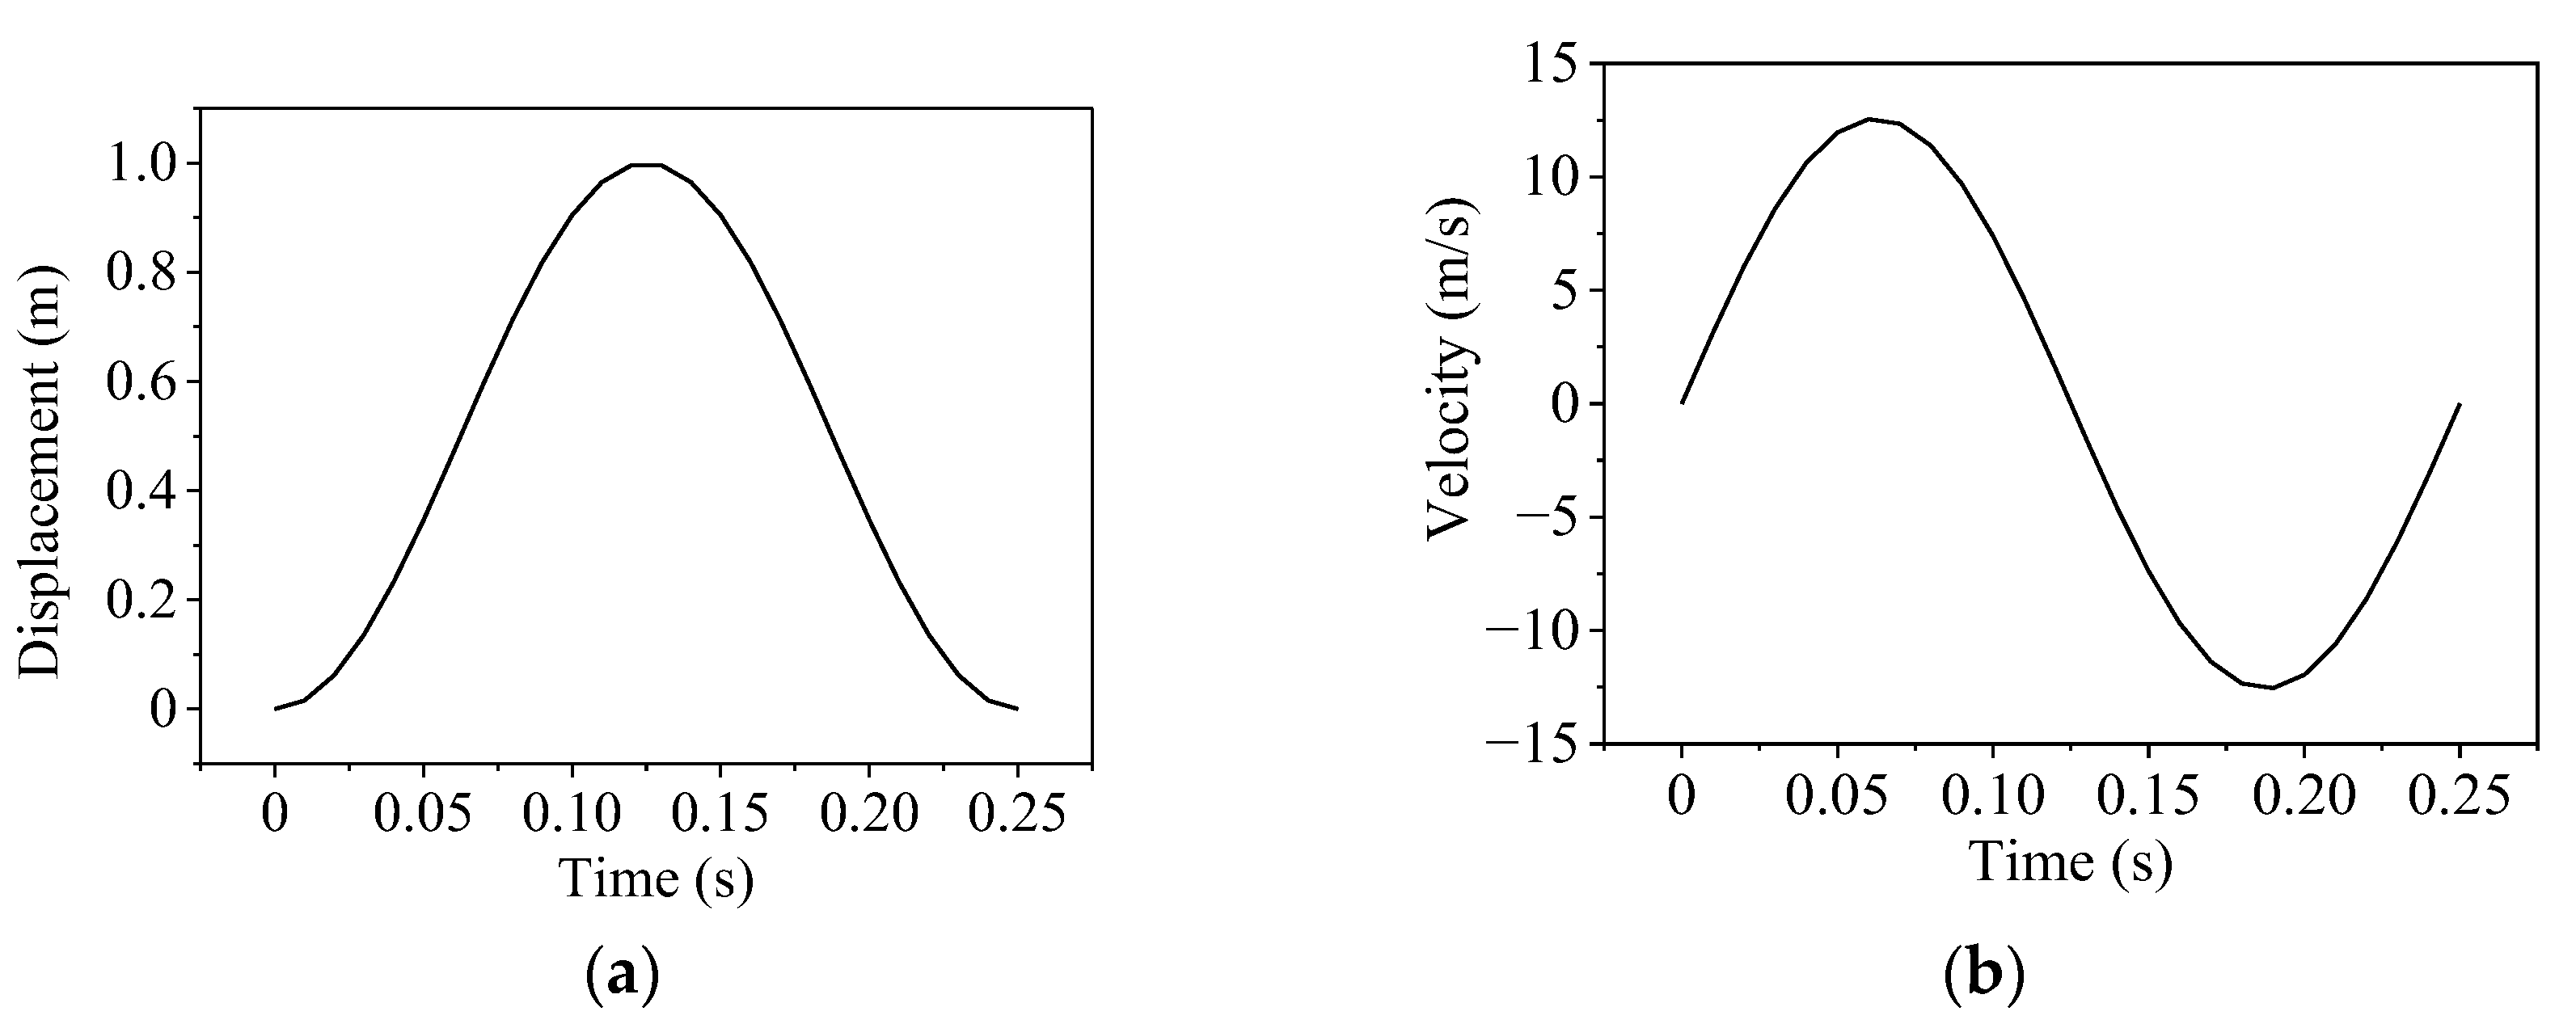
An FE model of 400 × 400 × 400 m3 was established to verify the precision of the proposed oblique incidence simulation technology. The solid cube element with a side length of 8 m which satisfies the FE precision was used [35]. Meanwhile, the timestep length of the FE equation is 0.001 s and the cutoff frequency is 15 Hz. The mass density of the half-space medium is 2000 kg/m3, the Poisson’s ratio is 0.3, and the elastic modulus is 1 GPa. Figure 4 shows the waveform of the incident SV wave with a displacement amplitude of 1 m. The displacement equation is expressed in Equation (11).
u ( t ) = 1 2 1 cos ( 8 π t ) ,
where 0 ≤ t ≤ 0.25 s.
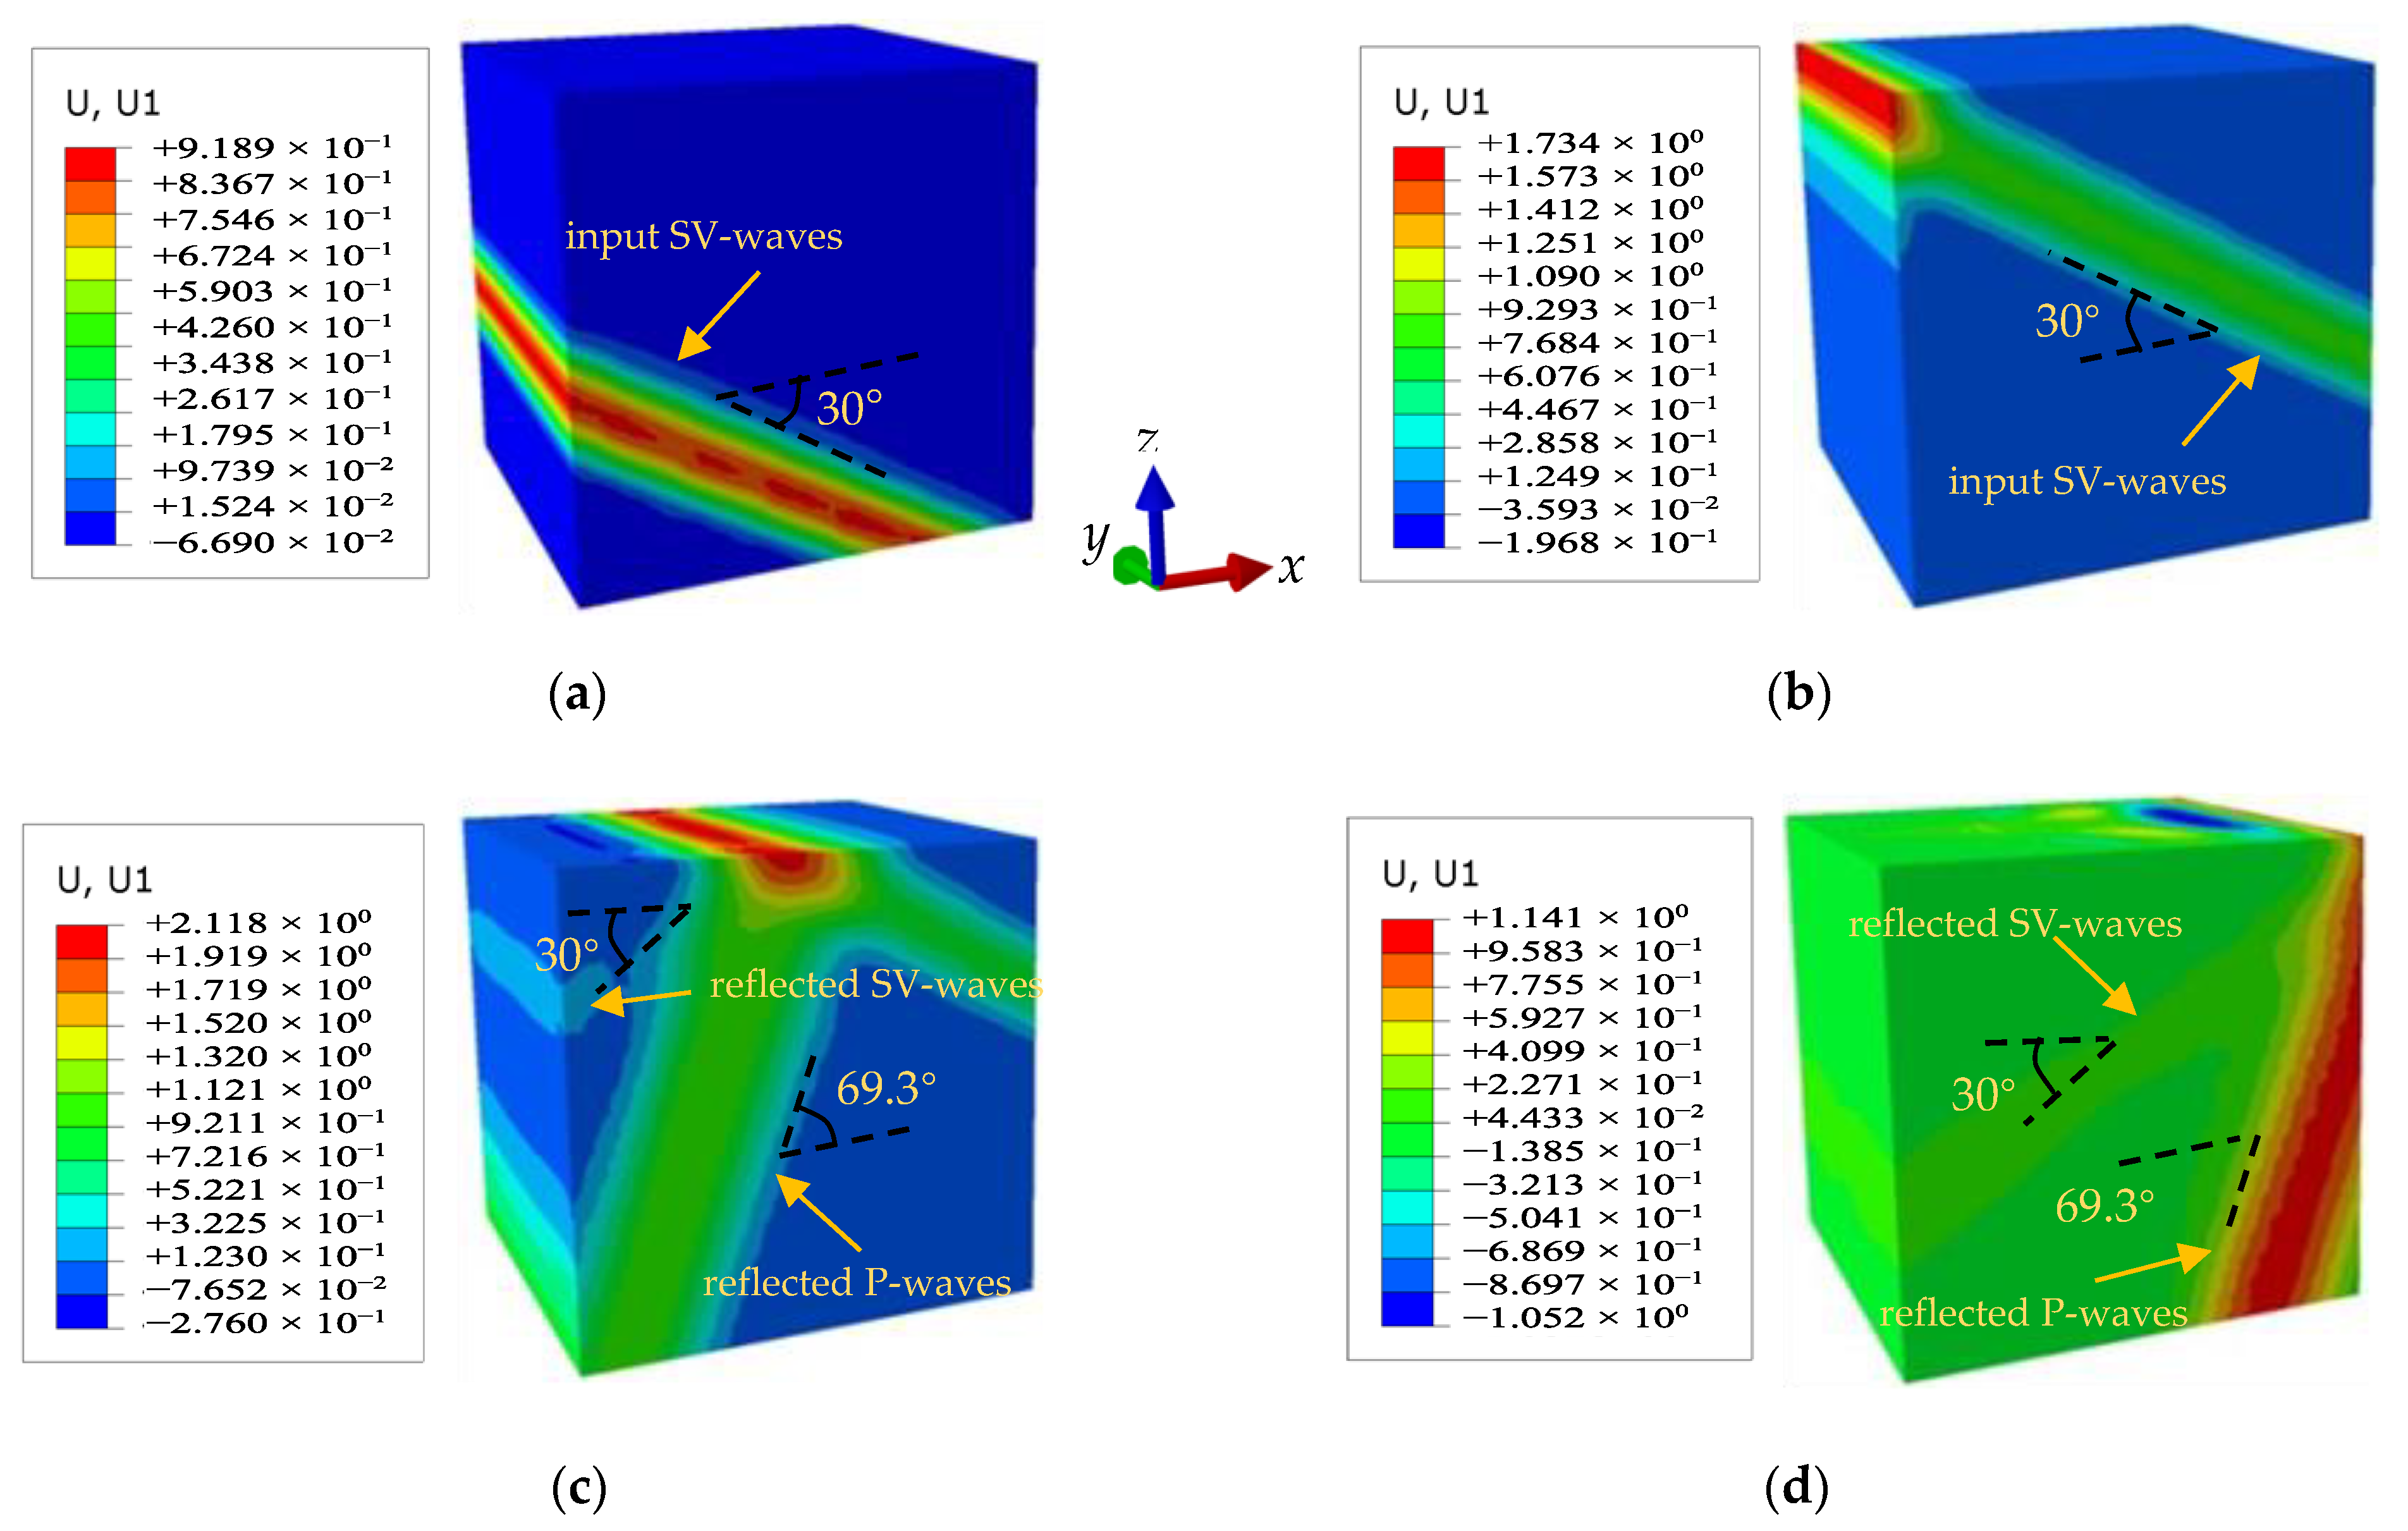
The model sets the SV wave as obliquely incident into the cube area at 30°, and the SV wave front passes through the y-axis at time zero. Figure 5 shows the cloud map of the displacement field in the horizontal direction of the cube. After 0.46 s of propagation, the wave front of incident SV wave can be well displayed in the cloud image, and the angle between the wave front and the horizontal plane is 30°; when t = 1.13 s, the SV wave propagates to the ground surface. At this time, three wave fronts appear in the cloud image. In addition to the wave front of incident SV wave, there are also wave fronts of the reflected SV wave and reflected P wave, in which included angles with the horizontal plane are 30° and 69.3°, respectively; When t = 1.45 s, only the wave fronts of the reflected SV wave and reflected P wave are left in the cloud image, indicating that the action area of the incident SV wave has exceeded the truncated cube area.
Figure 6 is a horizontal displacement time history tie course of the center point of the surface corresponding to the incident angle. It can be seen that the analytical solution is in good agreement with the numerical solution. The traveling wave effect and waveform superposition are well shown in the diagram. In summary, the numerical simulation for oblique incidence of SV wave has good accuracy [36,37].

3. Application to Immersed Tunnel

3.1. Project Overview

The Hong Kong–Zhuhai–Macao (HZM) Bridge, which spans the Lingding Bay in Pearl River Estuary, is a large-scale cross-sea passage connecting Hong Kong, Zhuhai City of Guangdong Province, and Macao in China. However, the Dangan Islands area outside the Pearl River Estuary is located at the intersection of the Littoral Fault Zone and the NW Pearl River Estuary Fault Zone, which is a potential source area of strong earthquakes [38]. The seismic safety evaluation report of the HZM Bridge engineering site also classifies the area as a Chinese basic seismic intensity zone of VIII. Hence, it is necessary to conduct seismic analysis on the HZM immersed tunnel.
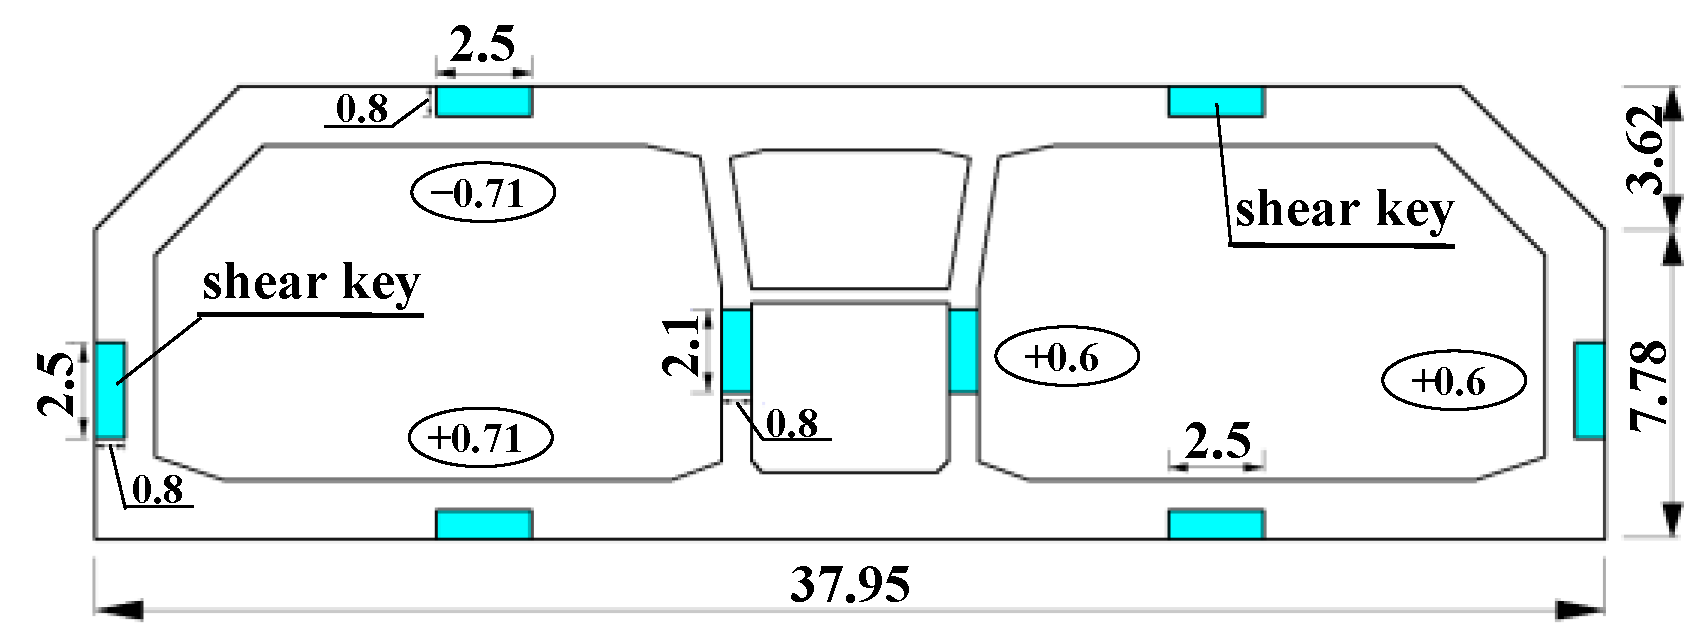
The main project of the HZM Bridge is about 29.6 km long, and the length of the submarine immersed tunnel is about 5990 m, consisting of 33 sections. Each section is assembled with five or eight segments, for a total of 252 segments. The length of each standard section is 180 m, with the maximum buried depth being about 43.6 m. The length, width, height, and lining thickness of the segment are 22.5 m, 37.95 m, 11.4 m, and 1.5 m, respectively. Horizontal shear keys are arranged on the roof and floor of immersed tunnel. The length of horizontal shear key is 2.5 m, the height is 0.8 m, and the extension length is 0.71 m. Vertical shear keys are arranged on the side wall and middle wall, where the height of the side-wall shear key is 2.5 m, the height of the middle-wall shear key is 2.1 m, and the width and extension length of the vertical shear key are 0.8 m and 0.6 m, respectively (Figure 7).

3.2. Calculation Model

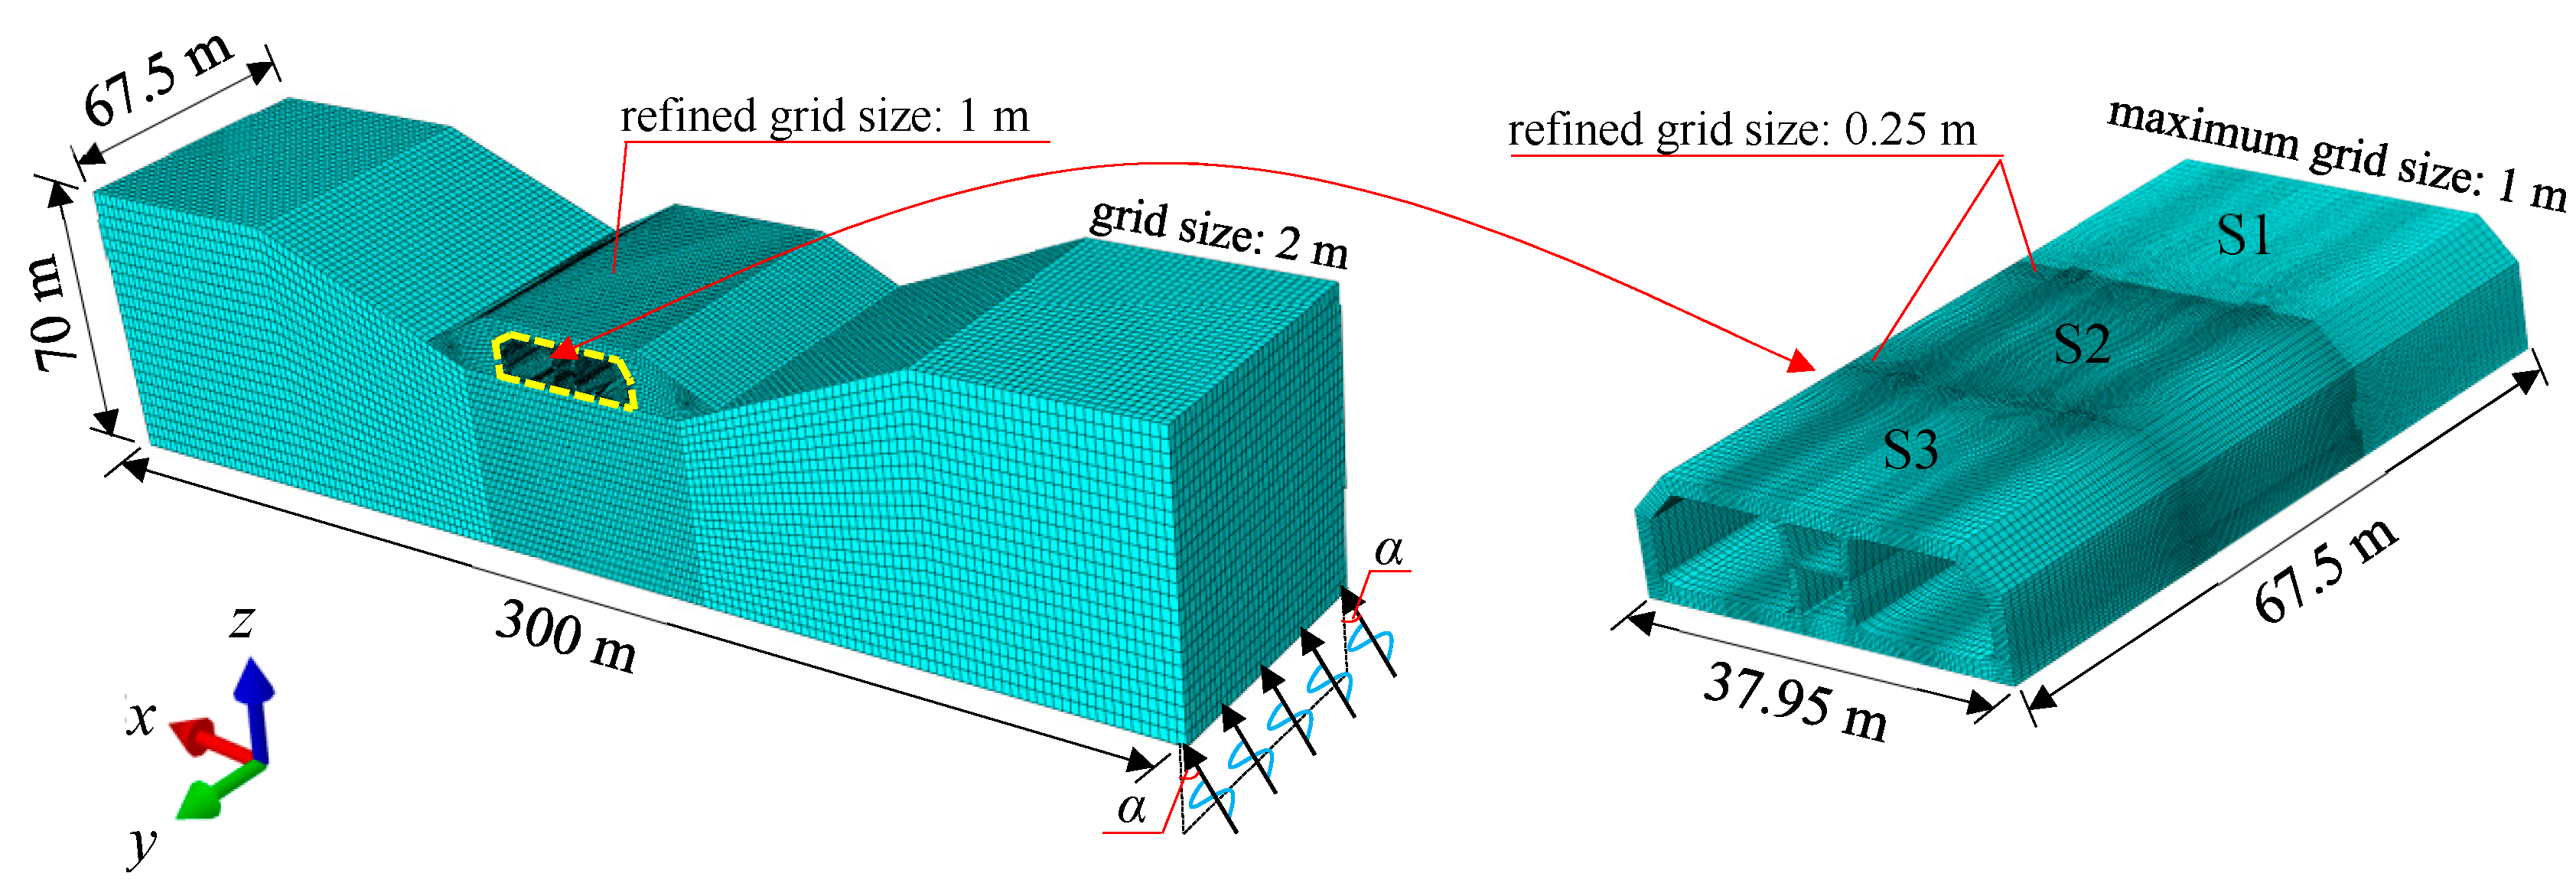
ABAQUS [39] was used to establish a 3D HZM immersed tunnel model of 300 × 67.5 × 70 m3 (Figure 8), and an overall model including three segments (S1–S3), soil, and overlying soil was established. The thickness of the gravel layer above the tunnel was 3.0 m, and the clay layer in the HZM immersed tunnel was defined as the soil layer of the model. Table 1 shows the material properties of the model, and the critical incident angle of SV wave was 34°. Hexagonal reduced integration elements with eight nodes (C3D8R) were used to simulate the soil and immersed tunnel, and springs were used to simulate the rubber bearing between shear keys of segment joints. The conventional grid size of the soil was 2 m, and the soil grid near the immersed tunnel was locally refined with a size of 1 m. The maximum grid size of the immersed tunnel was 1 m. Meanwhile, the grid size near the joint of immersed tunnel was locally refined, with a grid size of 0.25 m. Relative slip and detachment may occur between the tunnel and soil under an earthquake; the penalty function contact algorithm [39] in ABAQUS was used to simulate the dynamic interaction, which can alleviate the difficulties in numerical calculation and improve the solving efficiency. Since the error of the pore pressure ratio between the single-phase media and two-phase media of clay under earthquake action is less than 5% [40], only single-phase media are considered in this paper.

3.3. Boundary Conditions and Input Load

3.3.1. Boundary Conditions

This model adopted VSAB for dynamic calculation. The seismic response of the immersed tunnel is a static–dynamic coupling problem; the static calculation (i.e., in situ stress balance and hydrostatic pressure) should be carried out before calculating the dynamics such as seismic load and hydrodynamic pressure load. In the static analysis, the static boundary is imposed on the bottom and four sides of the model in Figure 8. On the other hand, the conversion of static boundary to dynamic boundary should be considered before the calculation of dynamics. For this purpose, the static constraints of the five boundary surfaces are removed, and the corresponding restraining force is applied [41]. Secondly, ground springs and dampers are added to the boundary surface nodes to set VSAB. The spring stiffness and damping coefficient can be calculated using Equations (8) and (9).

3.3.2. Input Seismic Load

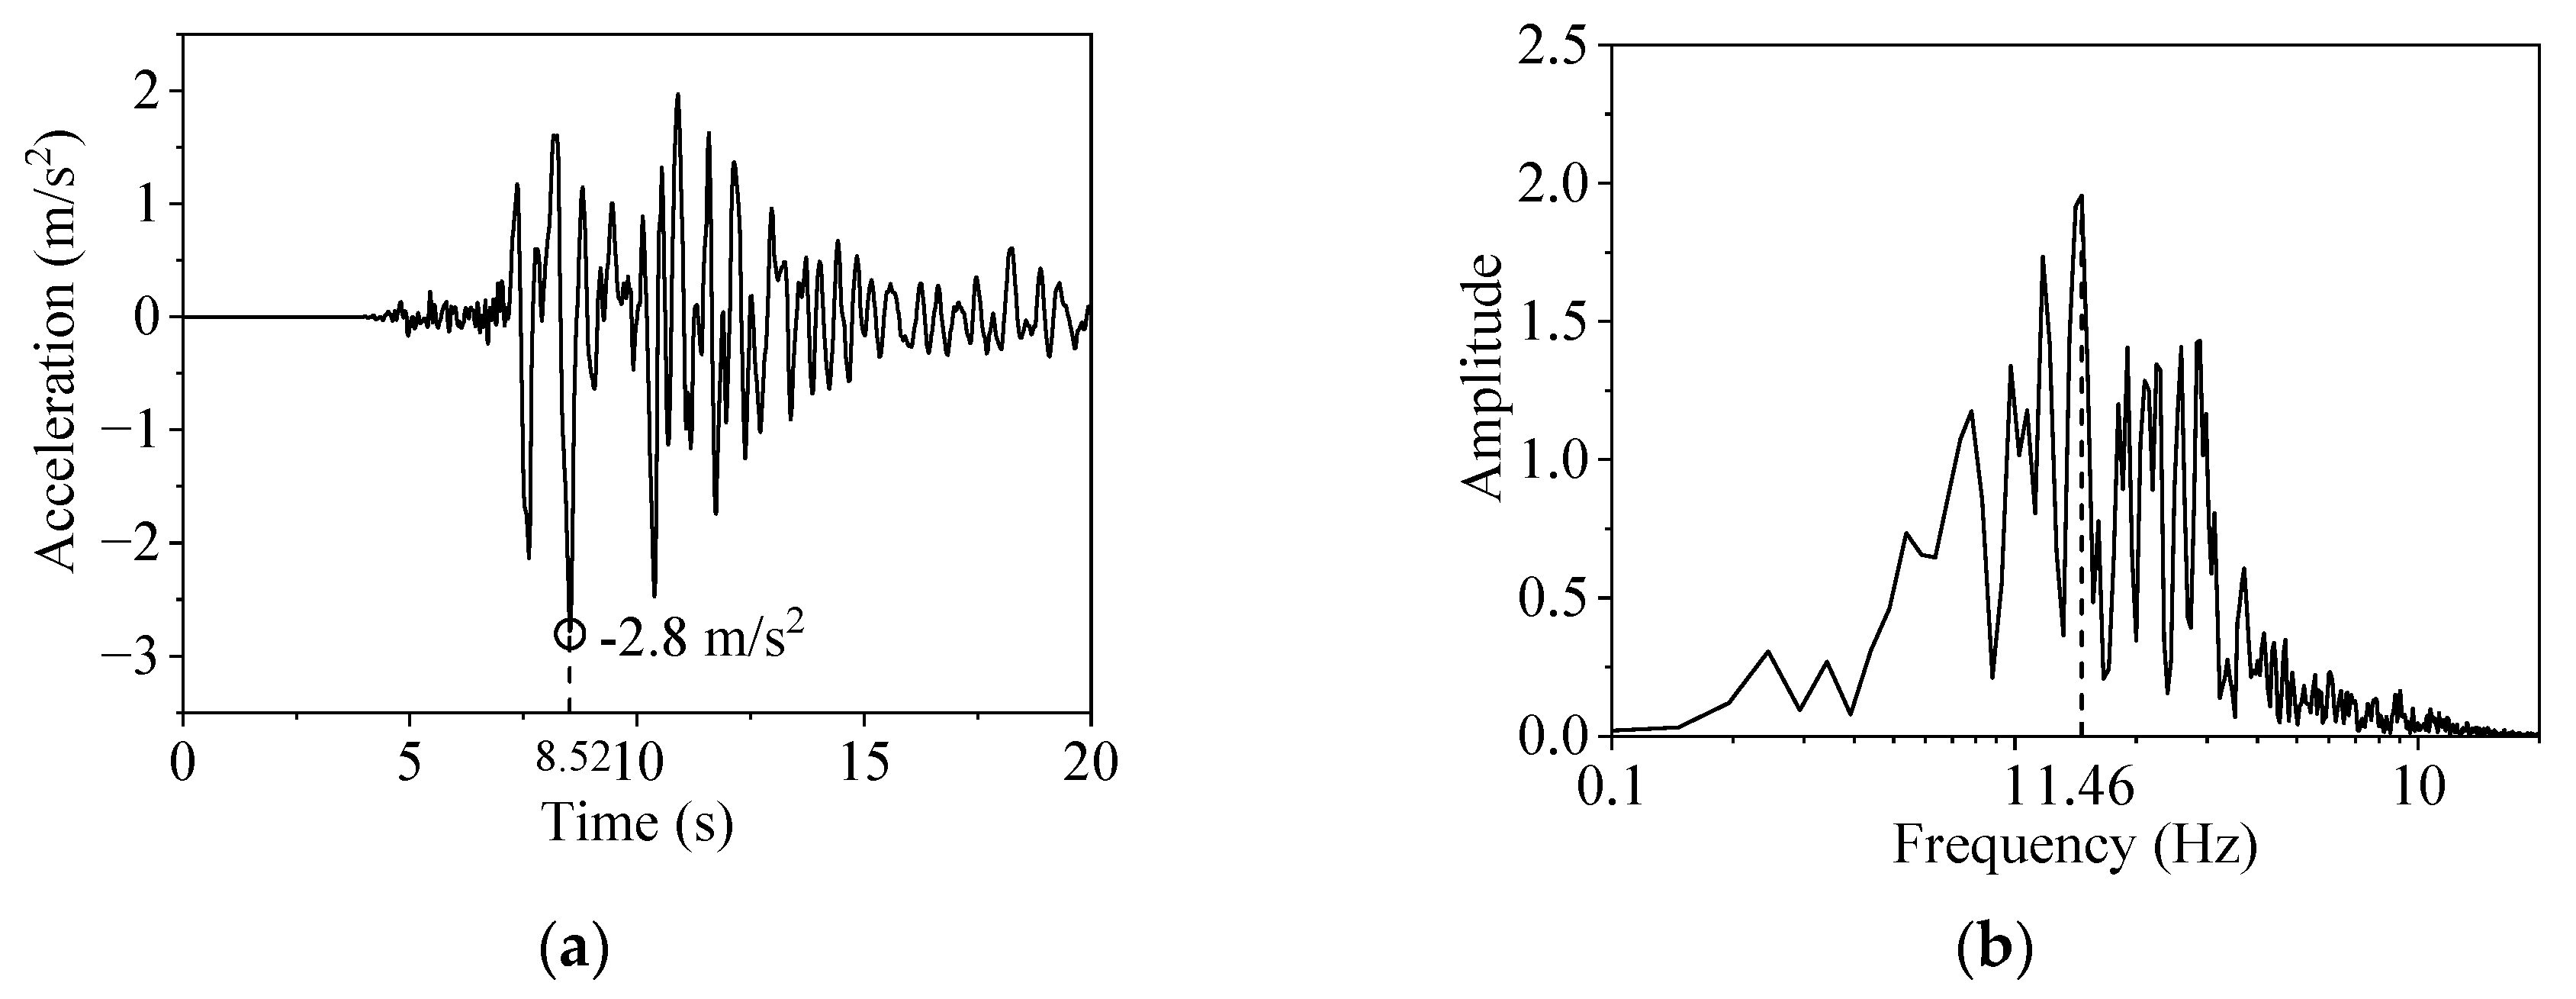
Large numbers of underground structures were seriously damaged by the 1995 Kobe earthquake in Japan. Since then, people have begun to pay attention to the seismic problem of underground structures. The representative Kobe wave was selected from the Cosmos Virtual Data Center as the input seismic wave, which was recorded by the Japan Meteorological Agency, and the closest distance to the fault was only 1 km. According to the seismic safety evaluation of the engineering site in the area of the HZM Bridge, the peak acceleration of the wave was modulated to −2.8 m/s2 at 8.52 s, with the predominant frequency of 1.46 Hz. To save computing time, the first 20 s of time history reflecting the Kobe wave characteristics was taken as input (Figure 9).
The incident direction of the seismic wave is parallel to the xz plane and forms an angle α of 0° (vertical incidence), 15°, and 30° with the yz plane. According to the direction of the axes in Figure 8, the x-, y-, and z-axes refer to the transverse, longitudinal, and vertical directions of the tunnel, respectively.
The displacement and velocity time history of the seismic wave can be obtained by integral calculation of the acceleration time history shown in Figure 9, and the corresponding free-field stress can be calculated using Equations (5)–(7). Then, the equivalent nodal force based on VSAB can be obtained by substituting the calculated free-field stress into Equation (10), and the input of seismic load based on VSAB can be realized by applying the amplitude function in ABAQUS. Since there are many nodes in the model boundary, the setting of VSAB and the calculation and application of the equivalent node force can be realized by programming with FORTRAN language.

3.3.3. Hydrodynamic Pressure

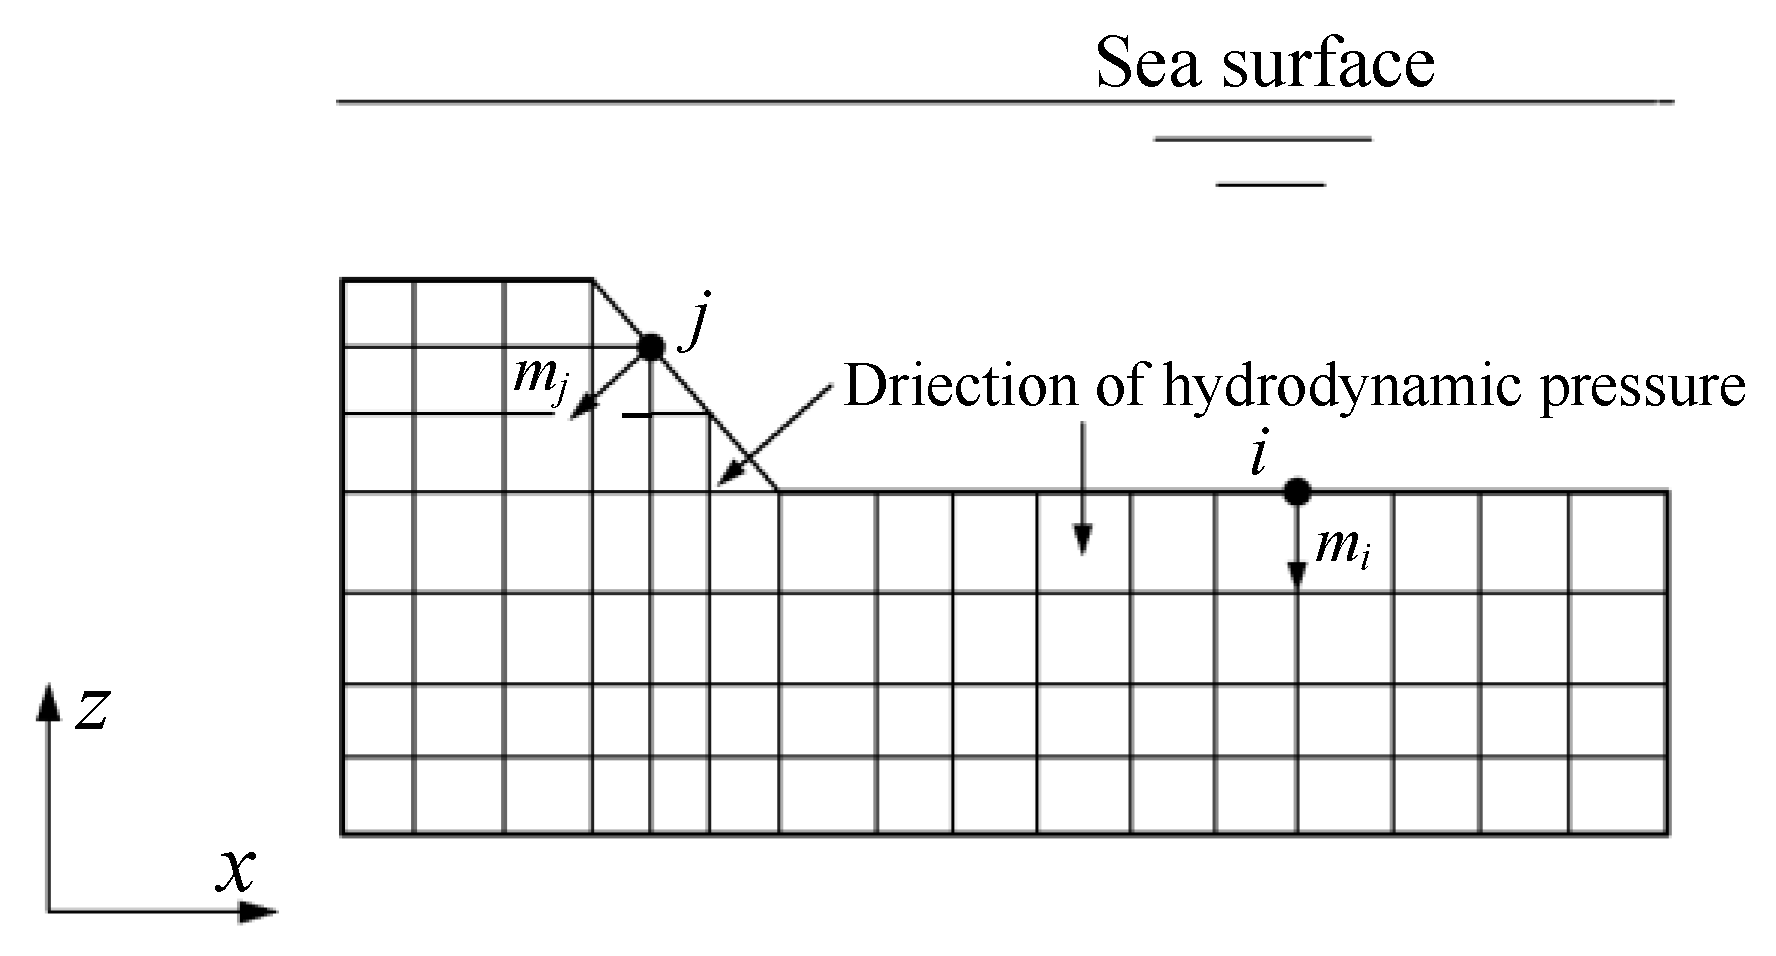
When an immersed tunnel is vibrated by an earthquake, there is an interaction between the seawater and immersed tunnel. At this time, the seawater generates dynamic water pressure on the immersed tunnel; thus, the seismic response analysis of the immersed tunnel is actually a 3D fluid–solid coupling dynamic calculation problem of the structure–soil–fluid interaction system, but the calculation scale considering fluid–solid interaction is huge. In this paper, the additional mass method is used instead of the fluid FEM to simulate the hydrodynamic action of the overlying water. The hydrodynamic pressure of the fluid acting on the surface of the site or immersed tube is approximately equal to the product of the fluid mass per unit area and the acceleration at the active surface, i.e., the additional mass is equal to the mass of the water column above the active area [42]. The direction of the additional mass is the normal direction of the acting surface. As shown in Figure 10, the additional mass acting on the i-node on the horizontal plane is the z-direction, and the additional mass acting on the j-node on the slope is the normal direction of the slope.
ABAQUS uses the additional mass element to simulate the hydrodynamic pressure through the additional mass method. Firstly, the additional mass on the action surface is calculated. The surface pressure of the additional mass field distribution is applied on the action surface, and the reaction force of each node on the action surface is inversely calculated. Then, the mass matrix is assembled by the node reaction force, and the additional mass element is customized by combining the user element provided in ABAQUS. Finally, the additional mass element is coupled with each node of the action surface, and the simulation of additional mass in ABAQUS can be realized.

3.4. Damping Setting

Combined with the implicit FEM, the Rayleigh damping matrix is used to consider the energy dissipation under earthquake. The mathematical expression of the Rayleigh damping matrix is shown in Equation (12).
[ C ] = θ [ M ] + ϕ [ K ] ,
where [C] is the damping matrix of the soil, [M] and [K] are the mass and stiffness matrix of the soil, respectively, θ is the damping constant proportional to the mass, and φ is the damping constant proportional to the stiffness.
When the vibration damping ratios of the various modes of the calculation system are the same,
θ ϕ = 2 ξ ω m + ω n ω m ω n 1 ,
where ξ is the mode damping ratio, ωm and ωn are the two reference mode shape angular frequencies of the calculation system, and the subscripts m and n represent the order of the corresponding mode shape, respectively.
Since the fundamental frequency of the soil-immersed tunnel interaction system often differs greatly from the main seismic excitation frequency, the determination of the proportional coefficient in the damping matrix has a great influence on the seismic response calculation results. According to the conclusion of Lou et al. [42], the two reference frequencies are taken as f1 and fr, respectively, where f1 is the first-order mode frequency of the soil-immersed tunnel during horizontal seismic excitation, and fr is the frequency corresponding to the peak of the spectrum in the input seismic acceleration response spectrum. Here, the values of f1 and fr are 0.505 Hz and 2.778 Hz, respectively, and ωm and ωn can be calculated using Equation (14).
ω m ω n = 2 π f 1 f r .

3.5. Numerical Implementation

According to the oblique incidence numerical simulation technology in Section 2, the artificial boundary setting and the input of equivalent node load on the boundary can be completed by writing an auxiliary program, so as to realize the simulation of oblique incidence of seismic waves in ABAQUS. Thus, the dynamic interaction of a soil-immersed tunnel under seismic SV wave incidence can be studied. Figure 11 is a flowchart of the entire numerical simulation process. The specific steps are as follows:
Step 1: Set the static boundary of the model and apply static load for static calculation, and then export the model boundary node information.
Step 2: Calculate the free-field stress and equivalent nodal force of model boundary nodes by programming with FORTRAN language.
Step 3: Convert the static boundary to dynamic boundary, and set damping and contact conditions while developing an additional mass element to simulate hydrodynamic pressure.
Step 4: On the basis of the static field obtained in step 1, the equivalent nodal force calculated in step 2 is imported into the modified model in step 3 for static–dynamic coupling calculation.

4. Results and Discussion

4.1. Time–Frequency Analysis of Monitoring Points

4.1.1. Acceleration Time History

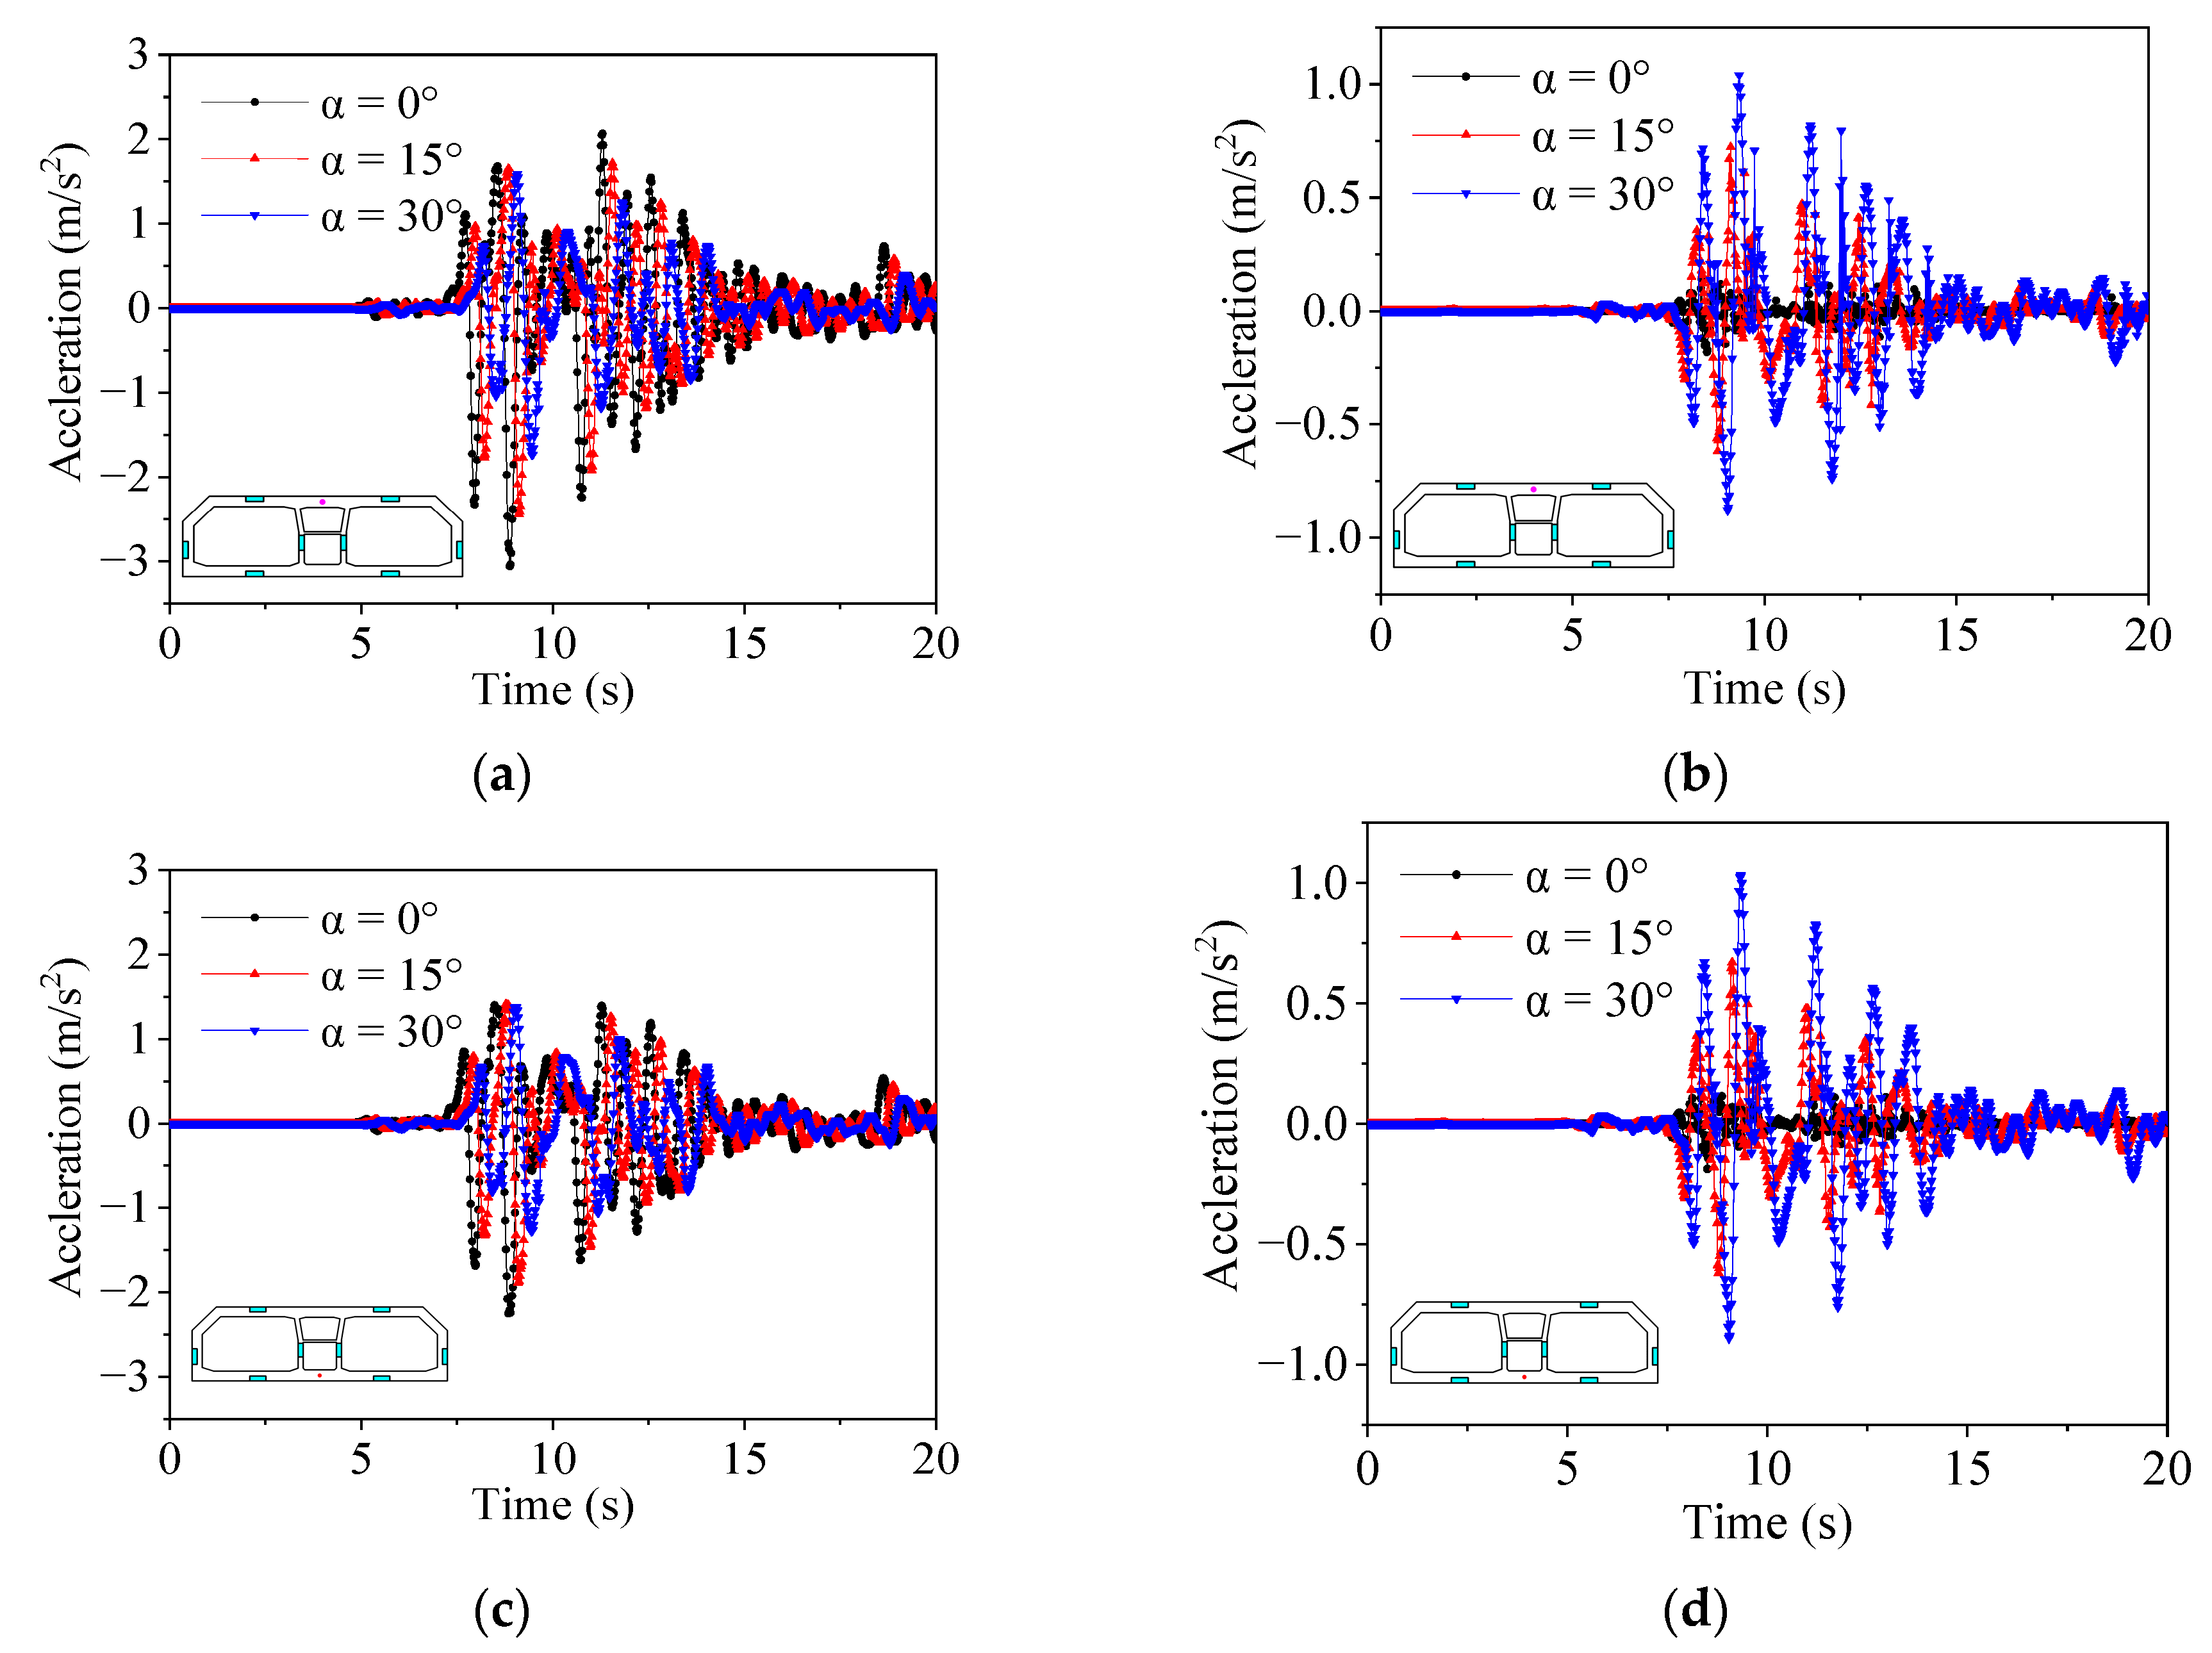
We first compare the acceleration time history of the roof and floor of the immersed tunnel. The roof midpoint and floor midpoint are selected as monitoring points to analyze the acceleration time history (Figure 12).
The horizontal peak acceleration of the roof midpoint is about 1.3 times that of the floor under the same incident angle, indicating that the seismic response of the roof of immersed tunnel is greater than that of the floor, which is mainly caused by the inconsistency of the constraint effect. The bottom of the immersed tunnel is greatly constrained by the surrounding medium, which is conducive to the stability of the tunnel structure, while the top of the tunnel has only a thin cover layer, which is more prone to slip and damage. When the SV wave changes from vertical incidence to oblique incidence, the horizontal peak acceleration of the monitoring point decreases, while the vertical peak acceleration increases significantly. The vertical peak acceleration at the roof midpoint increases from 0.34 m/s2 (vertical incidence) to 1.04 m/s2 (incident angle of 30°), which is approximately three times larger. That is, the oblique incident wave has a greater amplification effect on the vertical response of the tunnel structure, and the closer the incident angle is to the critical angle, the more significant the impact will be. The effect on the horizontal direction is relatively small, which is related to the change in horizontal and vertical component under oblique incidence. When the SV wave is incident at a certain angle, the horizontal component decreases compared with the vertical incident, while the vertical component increases. This amplification effect may increase the damage of structural members and increase the risk of tunnel structures during earthquakes.

4.1.2. Fourier Spectrum

Fast Fourier transform was performed on the acceleration time history of monitoring point to analyze the change in the frequency domain. Figure 13 shows the Fourier spectrum of roof midpoint at different incident angle. The variation law of the spectrum peak amplitude of the monitoring point at different incident angles is the same as the acceleration response. With the increase in incident angle, the horizontal spectrum peak amplitude decreases, and the vertical spectrum peak amplitude increases significantly. Oblique incidence makes the vertical energy increase sharply. When the incident angle changes from 15° to 30°, the dominant frequency of the monitoring point decreases from 1.46 Hz to 0.78 Hz, which may be caused by the decrease in the elastic effect of soil-immersed tunnel system due to oblique incidence. The reduced dominant frequency is closer to the fundamental frequency of the soil-immersed tunnel system, which is unfavorable from the perspective of tunnel seismic resistance and deserves attention.
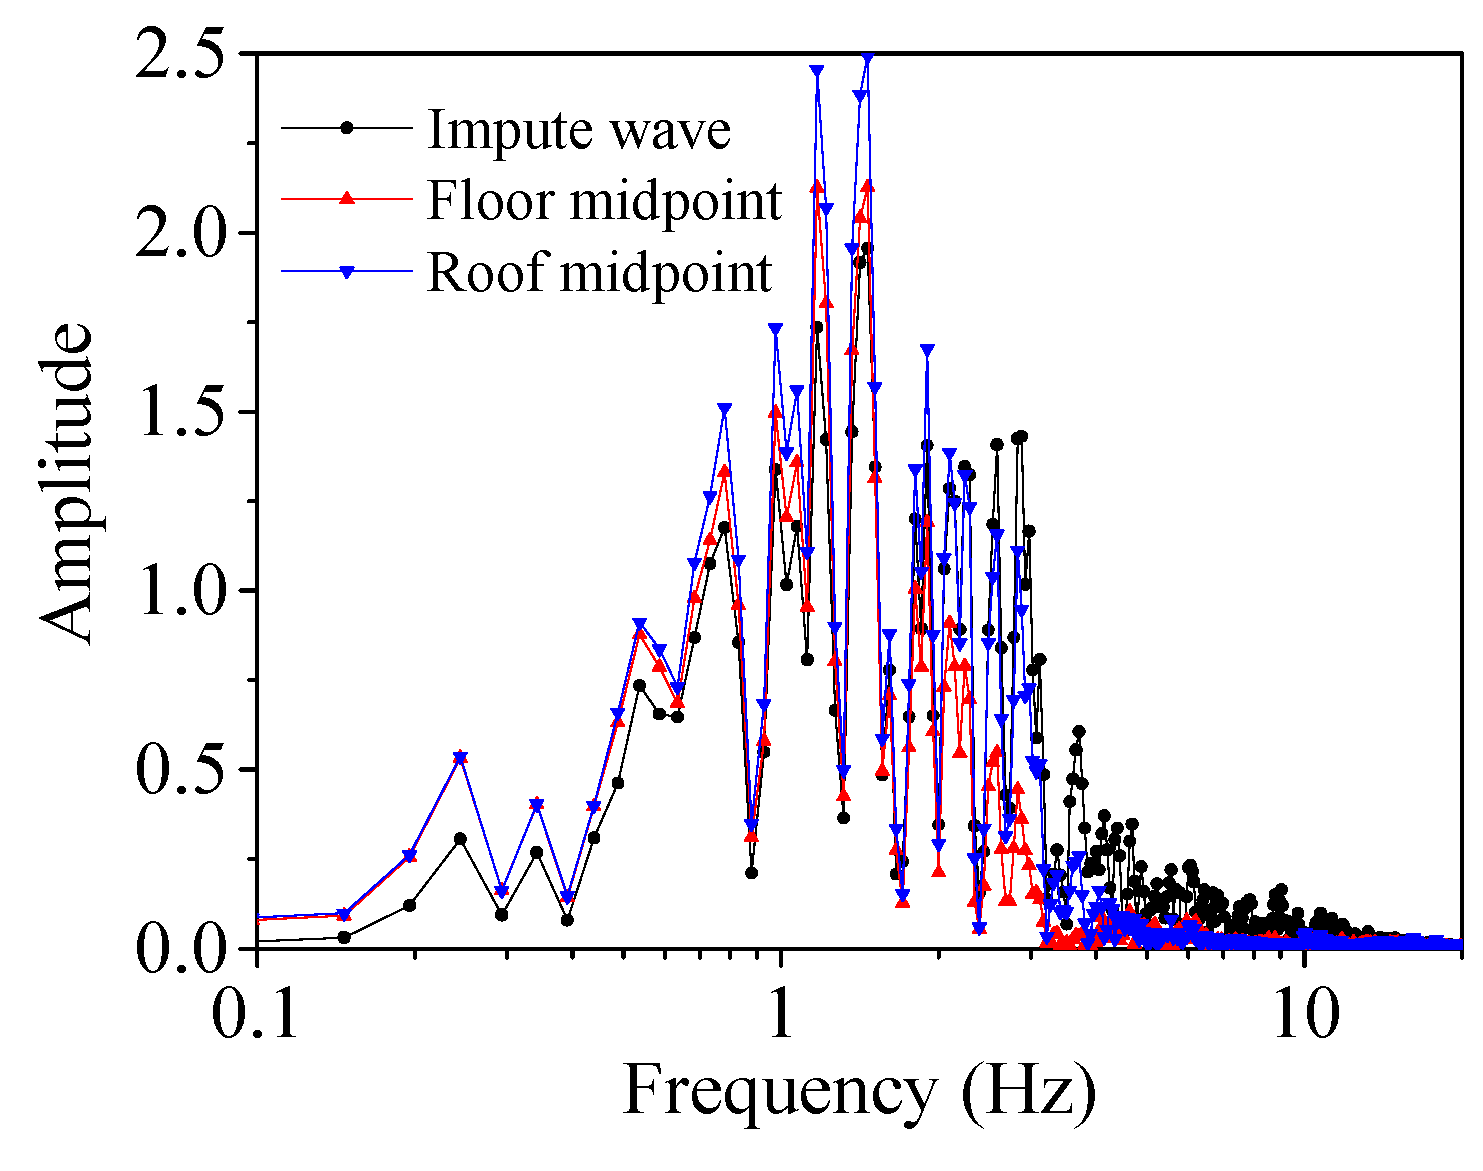
Comparing the Fourier spectrum of the monitoring point with the input seismic wave (Figure 14), it can be seen that the spectrum peak amplitude of monitoring point is amplified, and the spectrum peak amplitude of roof midpoint is greater than that of the floor. The spectrum peak amplitude of roof midpoint is larger than that of the input seismic wave when the frequency is less than 2 Hz, but smaller than that of the input seismic wave when the frequency is greater than 2 Hz. The spectrum peak amplitude of floor midpoint is also the same, but the critical frequency appears at 1.5 Hz. This means that the seismic response of the roof and floor in the frequency domain is similar, but the frequency range at different locations is different. Therefore, seismic design should pay attention to checking the strength of the tunnel roof, as well as consider the impact of oblique incidence of seismic waves to avoid underestimating the seismic response of the tunnel, resulting in damage to the tunnel structure.

4.2. Displacement Response of Immersed Tunnel

4.2.1. Maximum Relative Horizontal Displacement of Wall

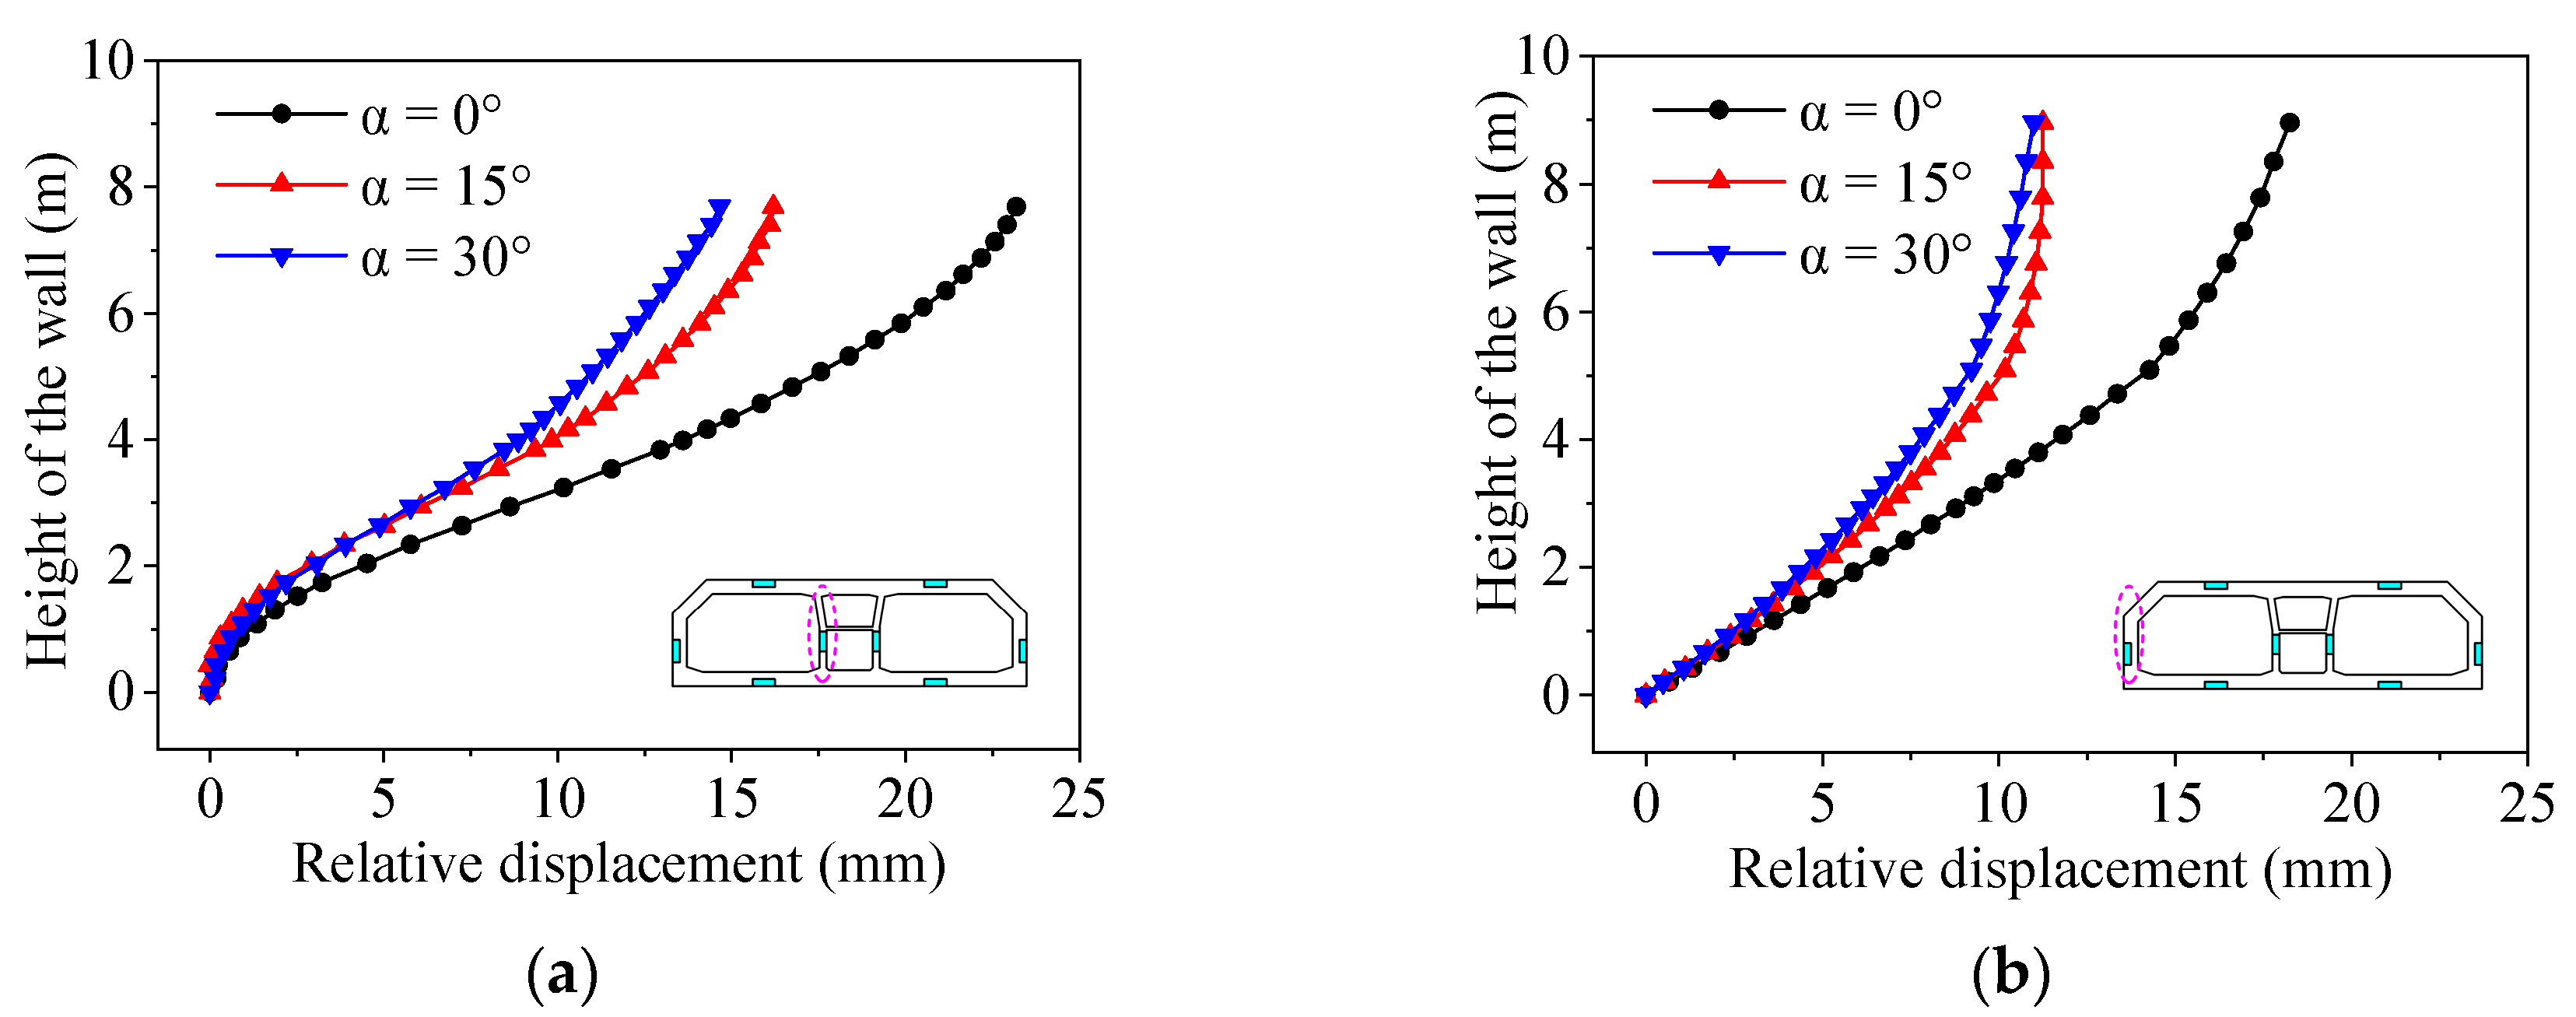
The maximum relative horizontal displacements of the middle wall and side wall with the height of the wall are plotted in Figure 15.
Figure 15 shows that the relative horizontal displacement of middle wall and side wall increases with the increase in wall height, which is consistent with the discussion in Section 4.1.1 that the top of immersed tunnel is more affected than the bottom by earthquake. The relative horizontal displacement of the wall increases more quickly in the middle and more slowly at the upper and lower ends. This may be caused by the fact that the upper and lower ends of the wall are connected with the roof and floor, respectively, which limits the deformation of the wall. The relative horizontal displacement of the middle wall is about 1.2 times that of the side wall under the same incident angle. This is mainly because one side of side wall is affected by the surrounding medium, which restricts the displacement of the side wall, while one side of the middle wall is connected with another middle wall, and the constraint effect is relatively weaker. In addition, the thickness of the middle wall of the immersed tunnel is smaller than that of the side wall, such that the overall stiffness of the middle wall is weaker than that of the side wall, resulting in a larger seismic response of the middle wall than that of the side wall. As the incident angle increases, the relative horizontal displacement of the middle wall and side wall decreases, which is caused by the reduction in horizontal component due to the oblique incidence of the SV wave. When the incident angle increases from 0° to 15°, the relative horizontal displacement of the wall decreases by more than 30%. As the angle continues to increase, the relative horizontal displacement of the wall decreases less, and the reduction value is less than 10%. Thus, the upper part of the middle wall of the immersed tunnel is one of the weak links in earthquake resistance, and the connection between the middle wall and roof should be strengthened in the seismic design. If the deformation of the middle wall is too large, it can be considered to hinge the middle wall and roof, whereby only the middle wall bears the vertical load, so as to facilitate the seismic performance of the immersed tunnel

4.2.2. Relative Displacement of Segment Joint

The joint of immersed tunnel needs sufficient deformation capacity to ensure the water tightness of the tunnel; therefore, the joint deformation of immersed tunnel is an important indicator to judge whether a tunnel can continue to be used. Figure 16 offers the relative deformation of the S2–S3 joint under SV wave incidence. The longitudinal opening is basically positive, indicating that the tunnel segment is in a long-term tensile state, and the vertical dislocation is mostly positive, which indicates that the soil may have settled. An increase in the incident angle of SV wave leads to a decrease in horizontal dislocation, an increase in longitudinal opening, and vertical dislocation. When the incident angle is 30°, the longitudinal opening of the segment joint is 1.07 mm, which is about 70% higher than the vertical incidence, and the vertical displacement is 2.49 mm, which is about 1.4 times that of the vertical incidence. On the other hand, the vertical and longitudinal relative displacements are maximized when the incident angle is close to the critical angle. The maximum of relative displacement appears in the horizontal dislocation, with a value of −3.93 mm in the vertical incidence, which is related to the incident direction of SV wave (Figure 8). The vertical incidence makes the model vibrate in the horizontal direction; hence, the displacement of the joint in the horizontal direction has the greatest effect. The oblique incidence also causes vibration in the vertical direction, such that the soil and the tunnel structure bear the vertical inertial force, which increases the vertical deformation, resulting in increased vertical dislocation. Hence, the oblique incidence has a great impact on the deformation of the segment joint, and the influence of the incident angle on seismic checking cannot be ignored.

4.2.3. Global Deformation of Immersed Segments

Seismic action may cause global bending or torsion of immersed tunnel, resulting in global tensile deformation and shear deformation of segments, thereby affecting the safety of the tunnel. The central axis node in the three segments of the immersed tunnel was selected to draw the vertical and horizontal displacement curves, as shown in Figure 17. It can be seen that the displacements of segment S1 and S3 are symmetrically distributed. When the incident angle is 30°, the vertical displacements at two ends of S1 are −1.68 cm and −2.04 cm, respectively, which completely correspond to the vertical displacements at both ends of S3. When the incident angle of the SV wave increases, the vertical and horizontal global displacements of the immersed segments increase accordingly. The maximum global displacement in the horizontal direction can reach 3.5 cm (incident angle of 30°), which is 20% higher than the vertical direction, while the maximum vertical global displacement is five times that in the vertical incidence, with the value of −2.04 cm. The global displacement in the vertical direction increases rapidly due to the increase in vertical component caused by the oblique incidence of the SV wave. The vertical and horizontal displacement difference between the two ends of S1 and S3 increase with the increased incident angle, causing the immersed tube to bend vertically and horizontally as a whole. The global bending of the tunnel increases the longitudinal opening on one side of the segment joint, resulting in axial tensile deformation. However, the longitudinal opening of joints needs to be within the deformation range; thus, the joint limit device should be considered in seismic design.

4.3. Internal Force of Immersed Tunnel

4.3.1. Axial Force and Bending Moment of Immersed Segments

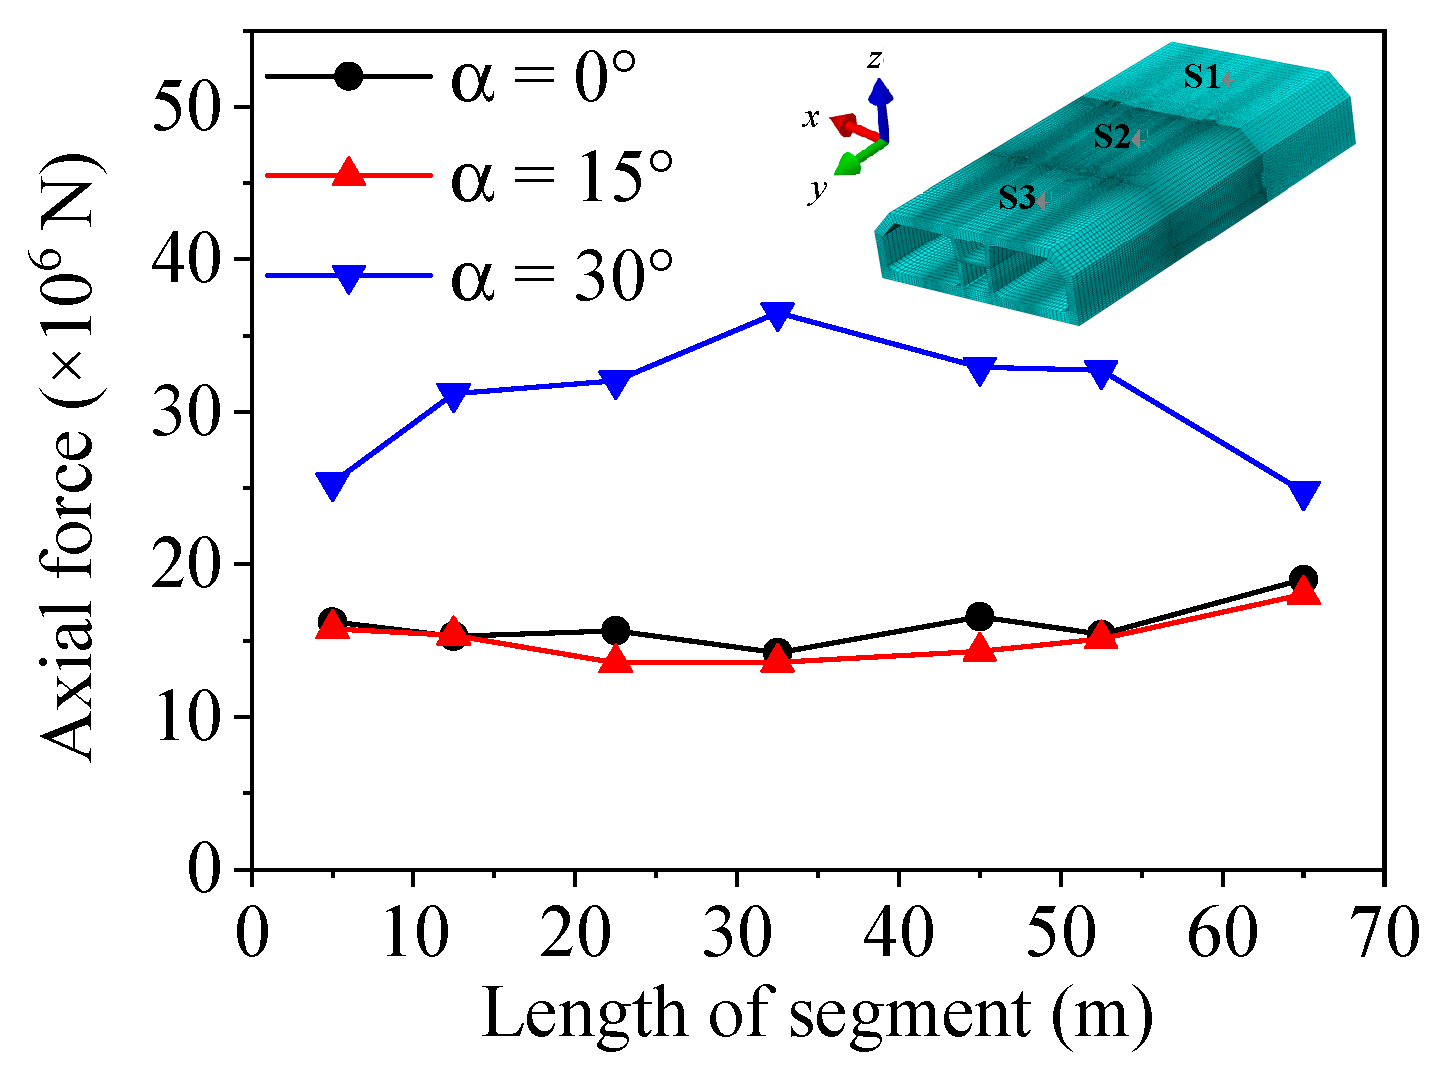
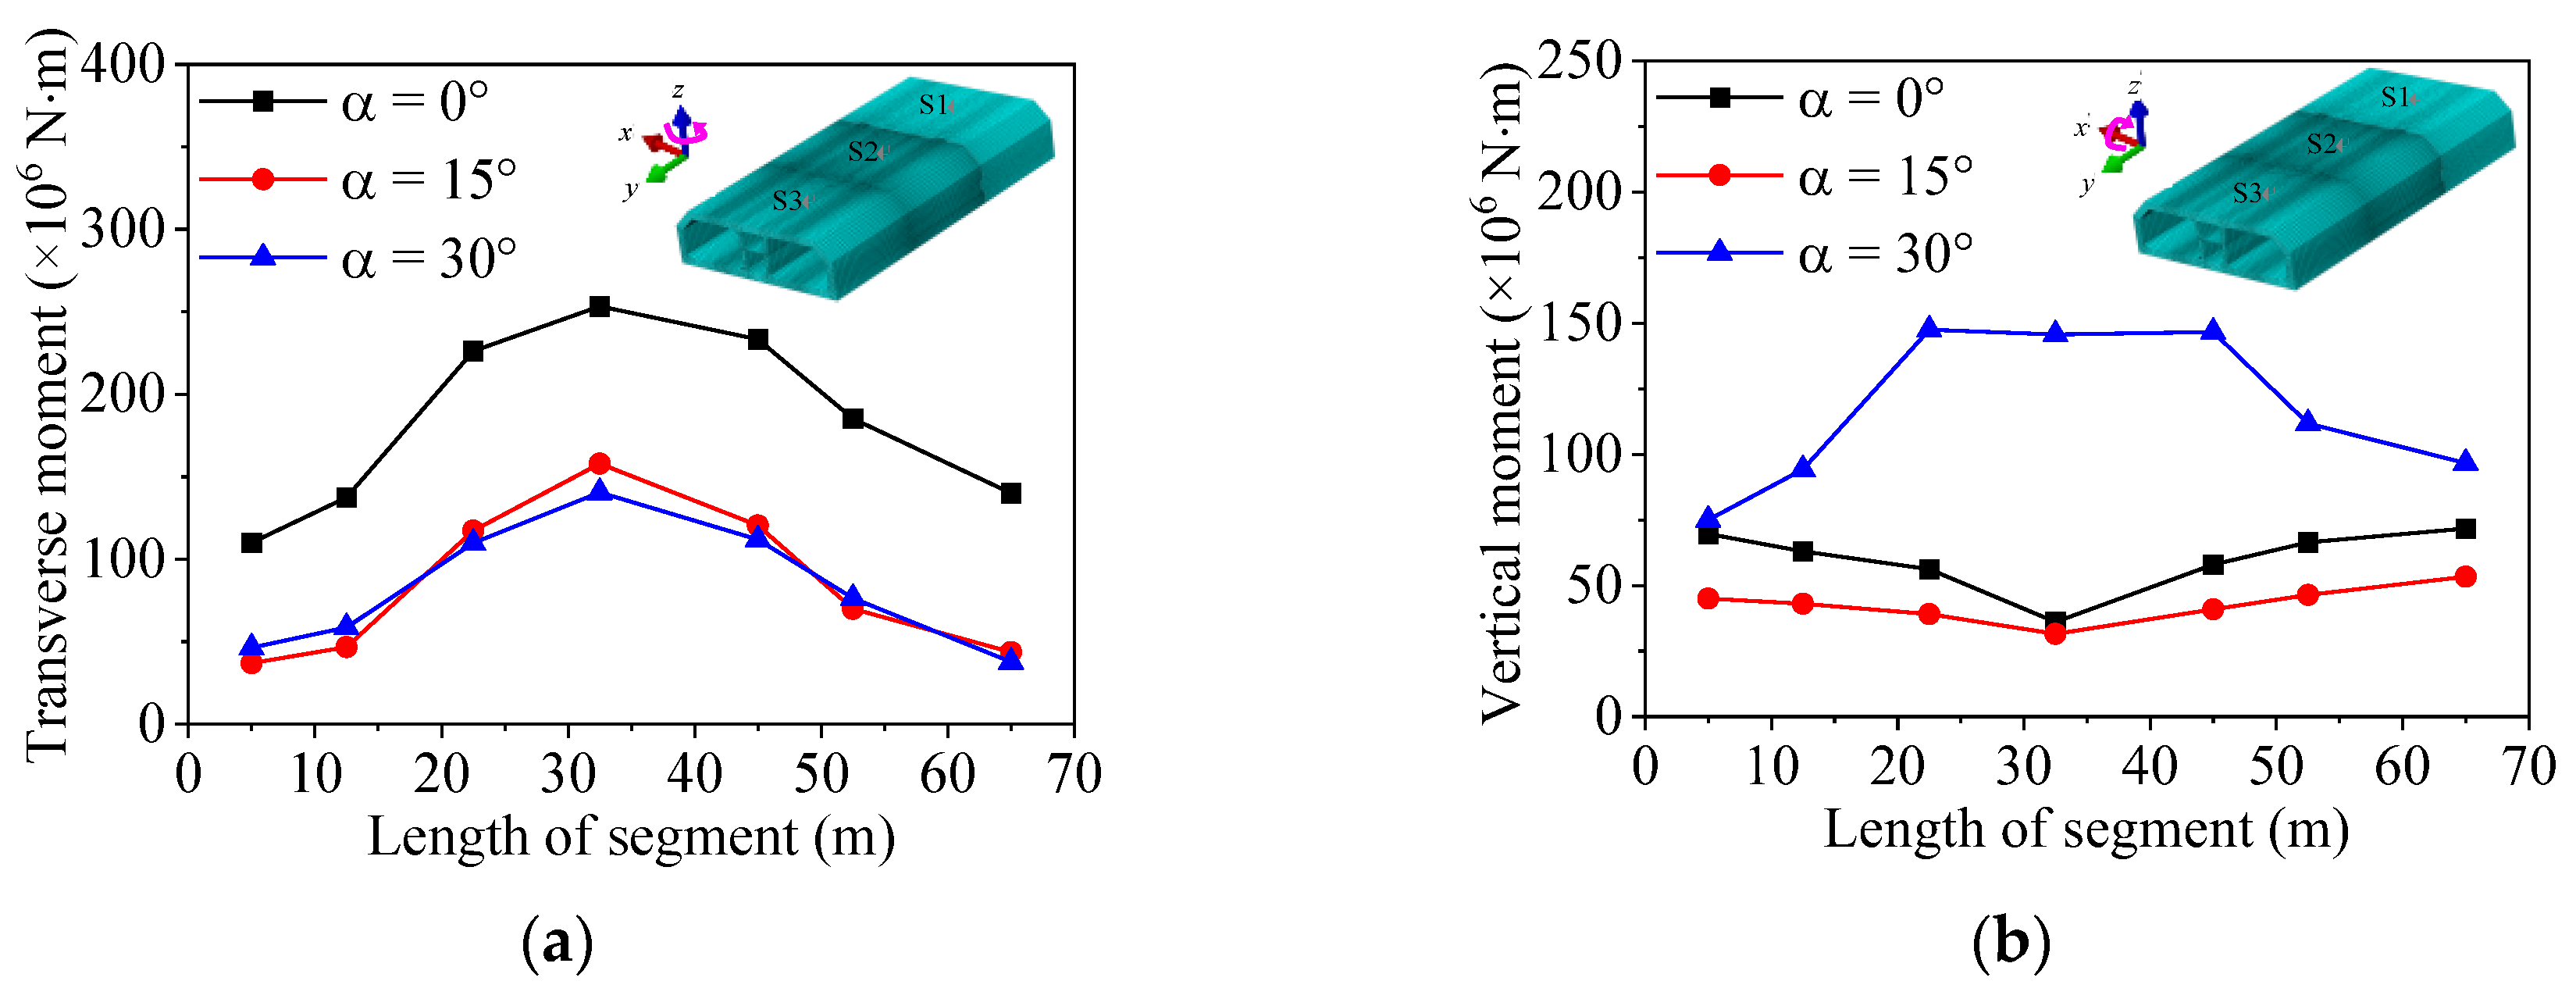
The axial force and bending moment of immersed segments in the numerical model were extracted and analyzed (Figure 18 and Figure 19). The axial force refers to the axial force along the longitudinal y-axis of the tunnel, the transverse bending moment is the bending moment rotating around the z-axis, and the vertical bending moment is the bending moment rotating around the x-axis. Axial force and bending moment refer to the axial force and bending moment of the entire section of immersed segment, respectively.
It can be determined that the tunnel structure is mainly subjected to tensile force in the axial direction, which is consistent with the discussion in Section 4.2.2. A change in incident angle affects the axial force and bending moment of tunnel structure. When the incident angle is within 15°, the axial force of the structure changes little; however, with the further increase in the incident angle, the axial force of the structure increases significantly. When the incident angle is close to the critical angle, the maximum value is 36.5 × 10⁶ N, which is 90% higher than that of the corresponding vertical incidence. However, with the increase in incident angle, the transverse bending moment and the vertical bending moment of the tunnel structure have completely different effects. The transverse bending moment of the structure decreases as a whole, while the vertical bending moment increases as a whole. The peak value of the transverse bending moment is 253.3 × 10⁶ N·m at an incident angle of 0°, while the peak value of the vertical bending moment is 147.5 × 10⁶ N·m at an incident angle of 30°. The reason is that the increased incident angle reduces the horizontal component and increases the vertical component of the seismic wave. The stiffness of the immersed tunnel joint is relatively small; thus, the seismic design should pay attention to the design of the joint to prevent failure of the immersed tunnel caused by the excessive joint angle.

4.3.2. Shearing Force of Immersed Segments

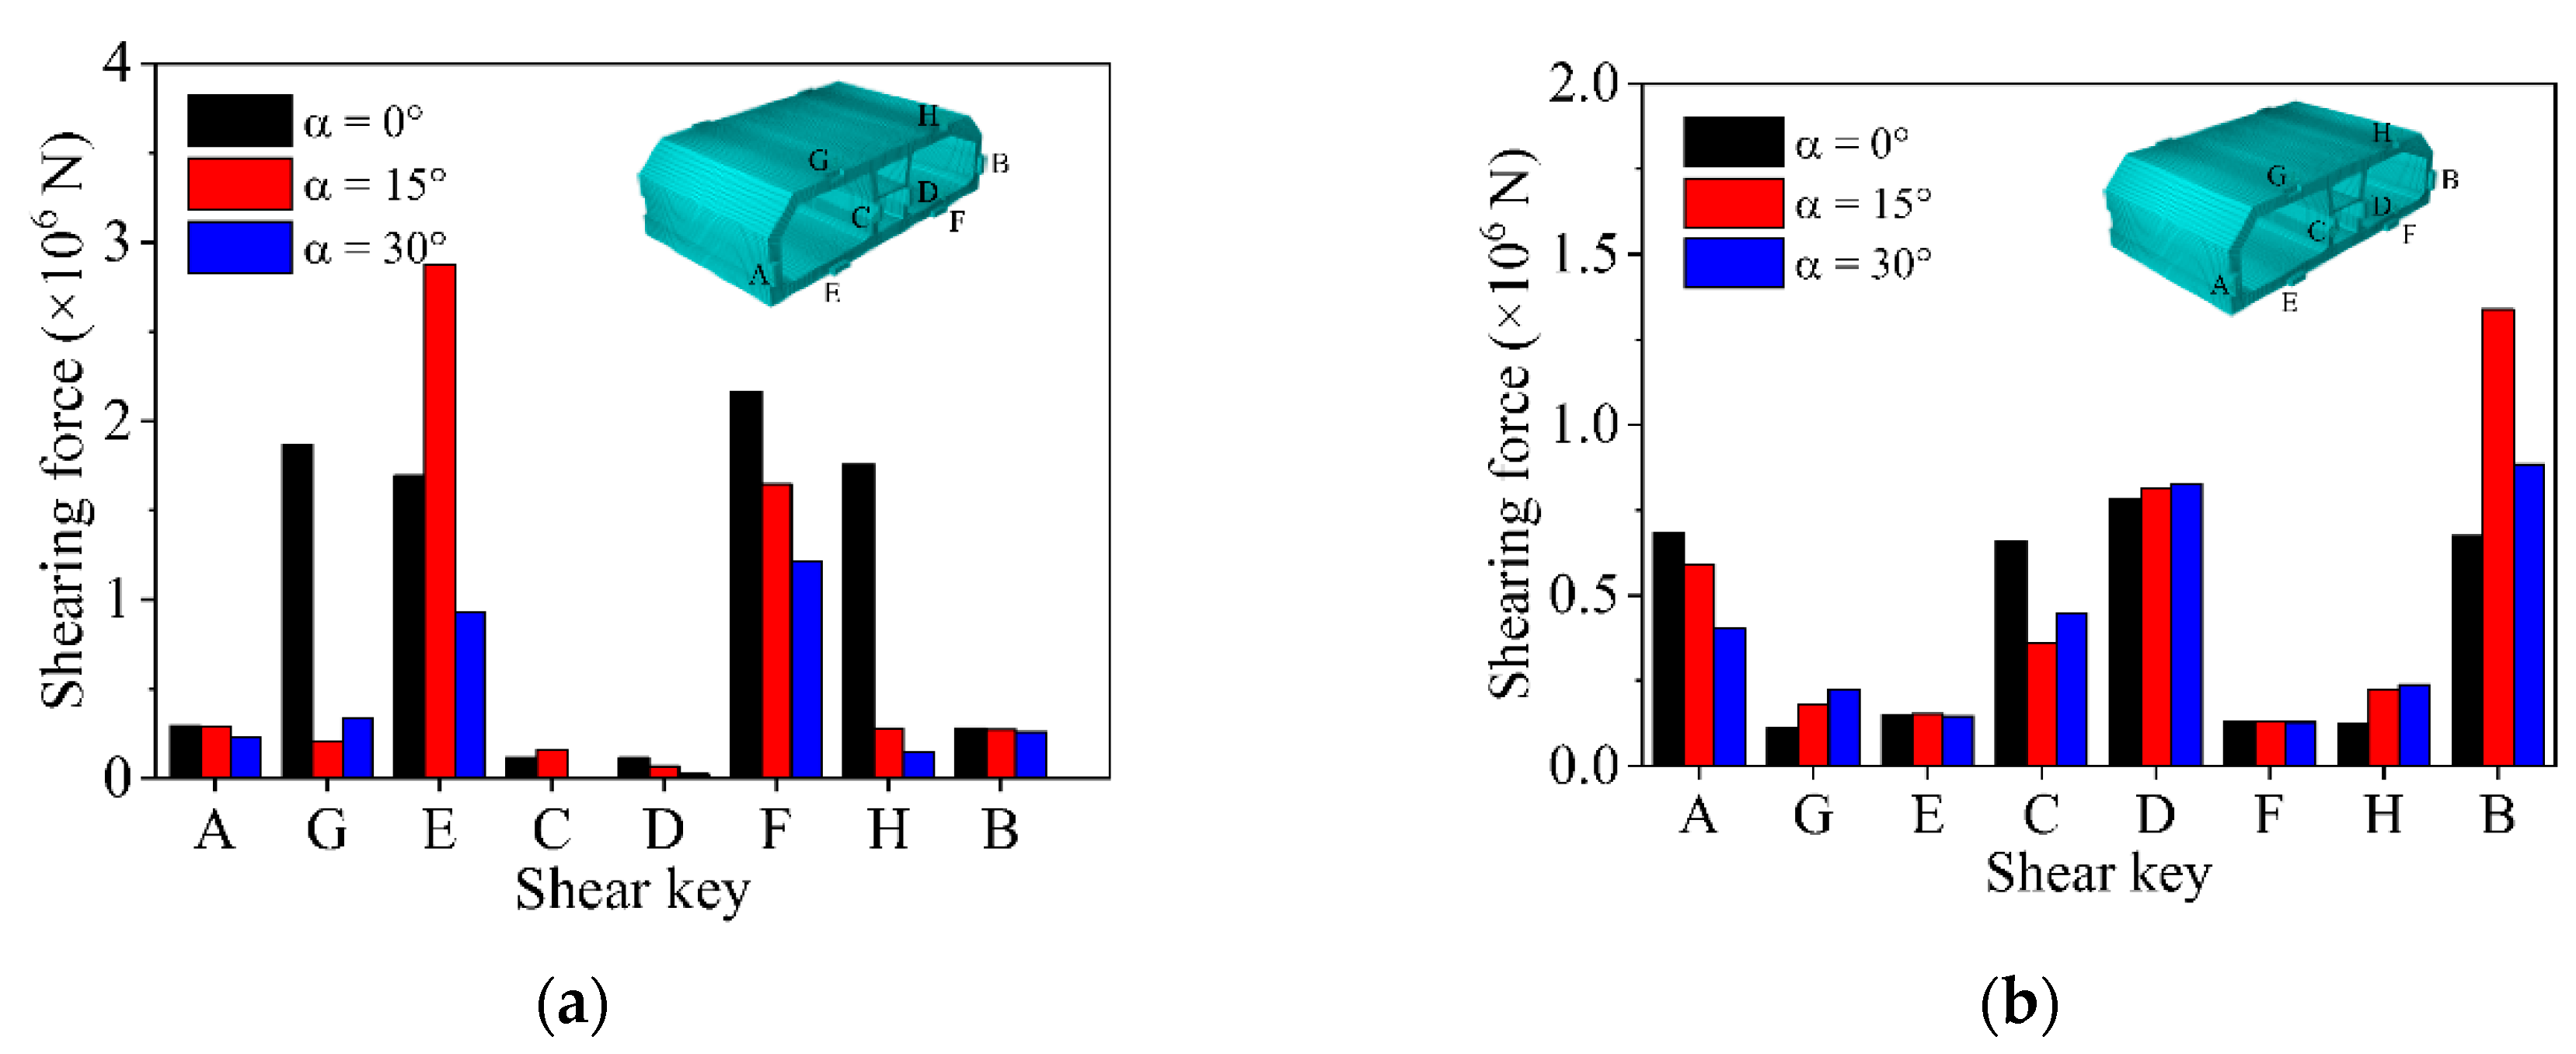
The shearing force of the immersed tunnel is mainly borne by the shear key, which is the main bearing structure to ensure the force and safety of the tunnel. Shear keys, especially the endpoint position and connection position of shear keys, are the key observation positions during the force analysis of a tunnel [43]. The eight shear keys of the S2–S3 segment joint are labeled A–H, as shown in Figure 20.
The shearing force (absolute value) at the root of shear key in the numerical model was extracted for analysis, and the calculation results are depicted in Figure 21. The shearing force of shear key is approximately symmetrical, which is related to the fact that the whole immersed tunnel is a symmetrical structure. When the SV wave turns obliquely incident, the symmetrical tunnel shear key is subjected to asymmetrical force, especially the side of the side wall where shear key B is located as the wave front of oblique incidence, making the vertical shear value of shear key B significantly larger than other shear keys. The peak value of vertical shearing force appears at shear key B on the side wall, up to 1.338 × 10⁶ N. The vertical shearing force in the segment joint is mainly borne by the vertical shear key, and the vertical shearing force borne by the horizontal shear key is very small. The vertical shear key bears about 85% of the vertical shearing force, while the horizontal shear key only bears 15% of the vertical shearing force. This is because the horizontal shear key is connected with the outer surface of immersed tunnel, i.e., the horizontal shear key directly contacts the surrounding soil. When the segment is subjected to vertical force, the partial stress of horizontal shear key is released with the extrusion deformation of shear key on the surrounding soil. The peak value of transverse shearing force of the shear key is 2.873 × 10⁶ N, which appears at floor shear key E at an incident angle of 15°. Most of the transverse shearing force in segment joint is borne by the horizontal shear key, while the vertical shear key hardly bears the transverse shearing force, especially the middle wall shear key, which directly penetrates the lining; therefore, the transverse shearing force borne by it is the smallest. The ratio of the horizontal shear key and vertical shear key to bear the transverse shearing force is about 9:1, and the middle wall shear key bears only 2% of the transverse shearing force. The distribution of the shearing force is closely related to the layout direction of shear key in the joint. The layout direction of the shear key in the joint determines the distribution of shearing force at the root of shear key. Both the transverse peak shearing force and the vertical peak shearing force of shear keys occur when the SV wave has oblique incidence. In consequence, each shear key only needs to be checked for the shear capacity of the shear key direction, and the impact of incident angle should be considered.

4.4. Stress Behavior of Shear Keys

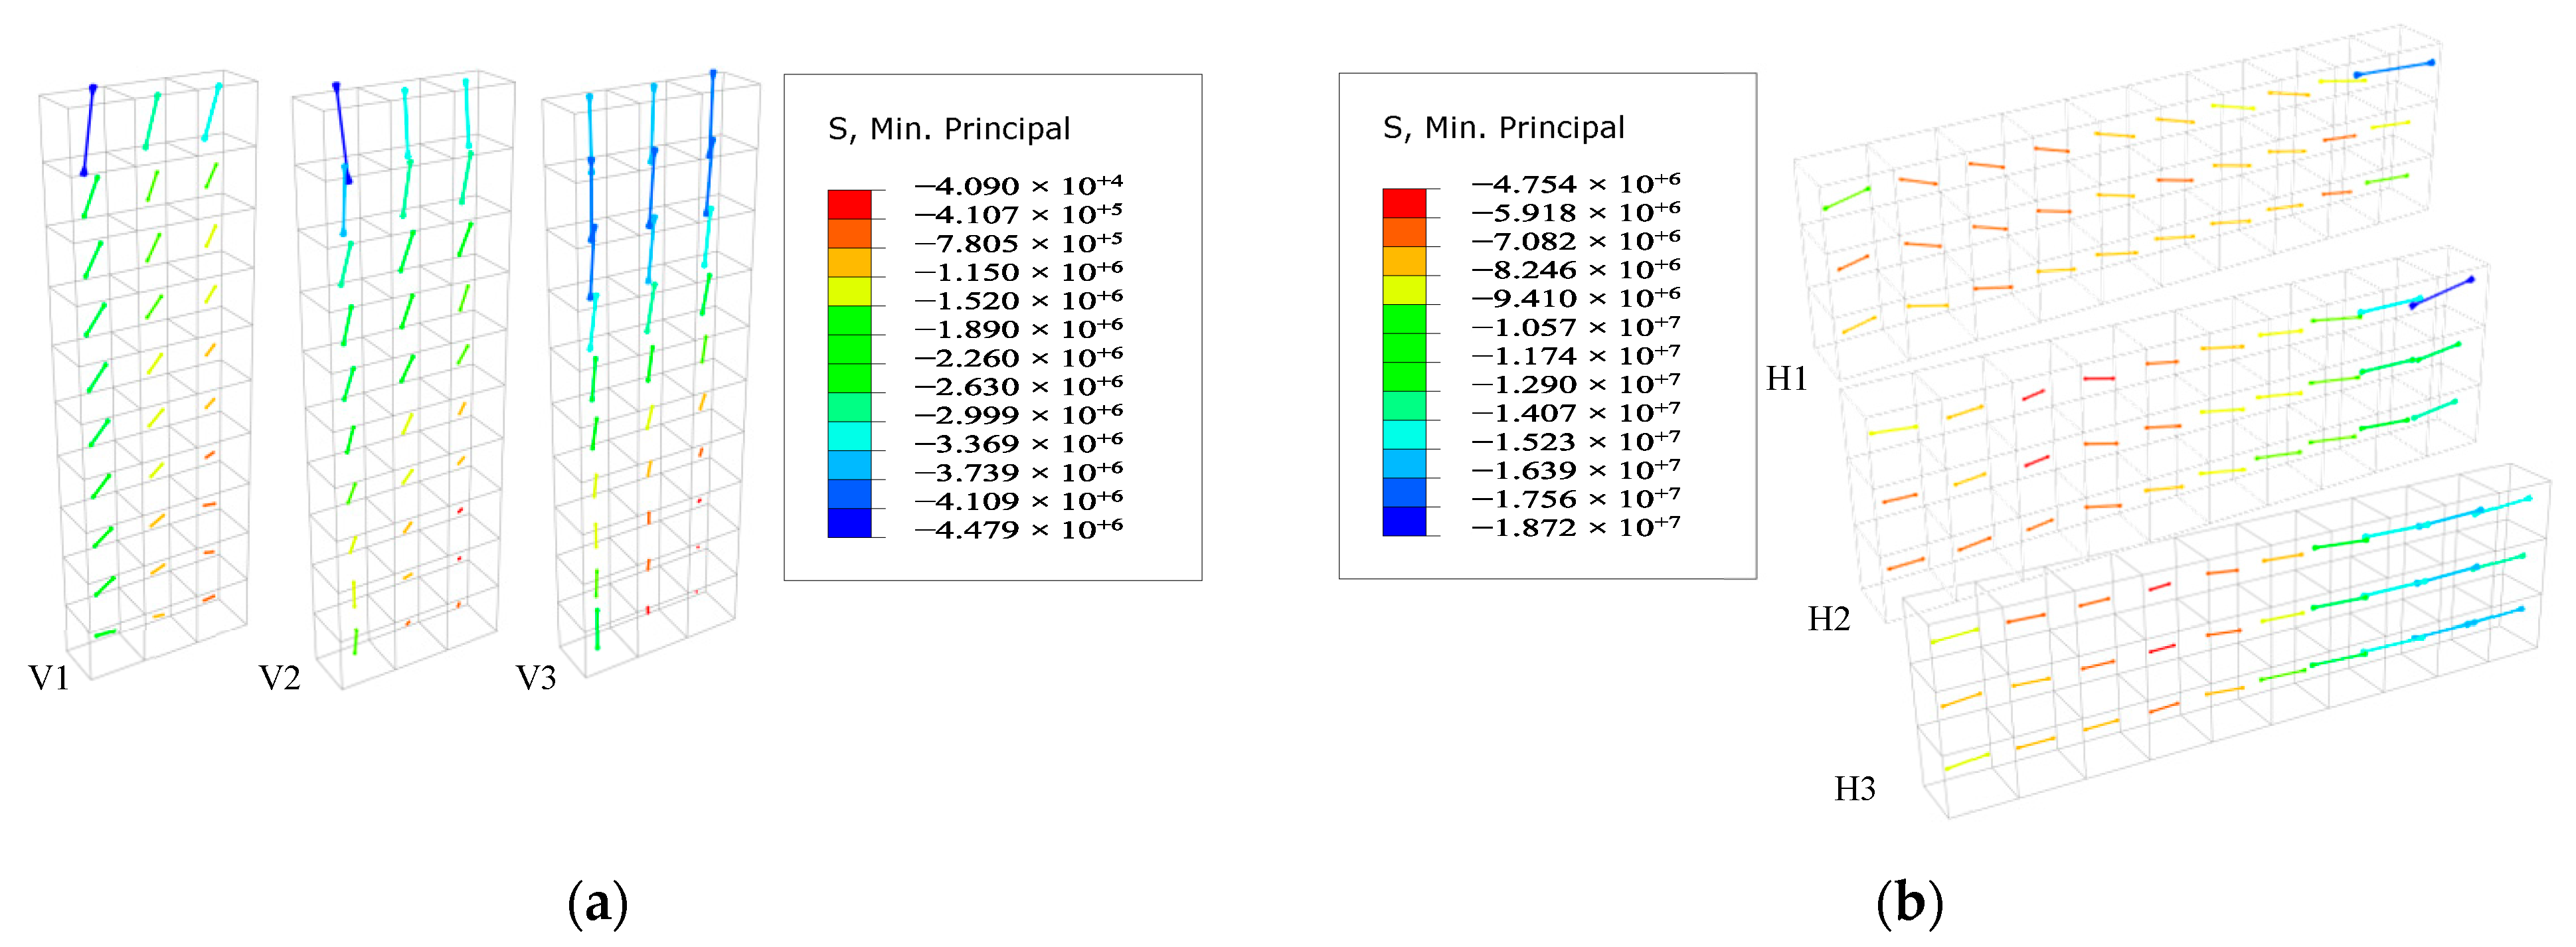
It can be seen from Section 4.3.2 that the peak shearing force in the transverse and vertical directions of the segment joint appears in shear key E and shear key B, respectively. The stress vector diagrams of shear key B and shear key E were extracted for further analysis, as shown in Figure 22 and Figure 23. In order to clearly see the stress vector diagram inside the shear key, the shear key is cut into three entities along the axial grid line. The three entities of horizontal shear key E are marked as H1, H2, and H3, and the three entities of vertical shear key B are marked as V1, V2, and V3. As shown in Figure 20, the plane 3–4–4′–3′ is the root of the shear key, i.e., the position of the shear key connecting to the immersed segment. The corresponding plane 1–2–2′–1′ is the end of the shear key. H1 and V1 are the entities which connected to the main body of the immersed segment. The maximum principal stress in Figure 22 and Figure 23 represents the tensile stress, while the minimum principal stress is the compressive stress. The relative direction of the arrow represents the compressive stress vector, the opposite direction of the arrow represents the tensile stress vector, and the length of the arrow represents the stress value.
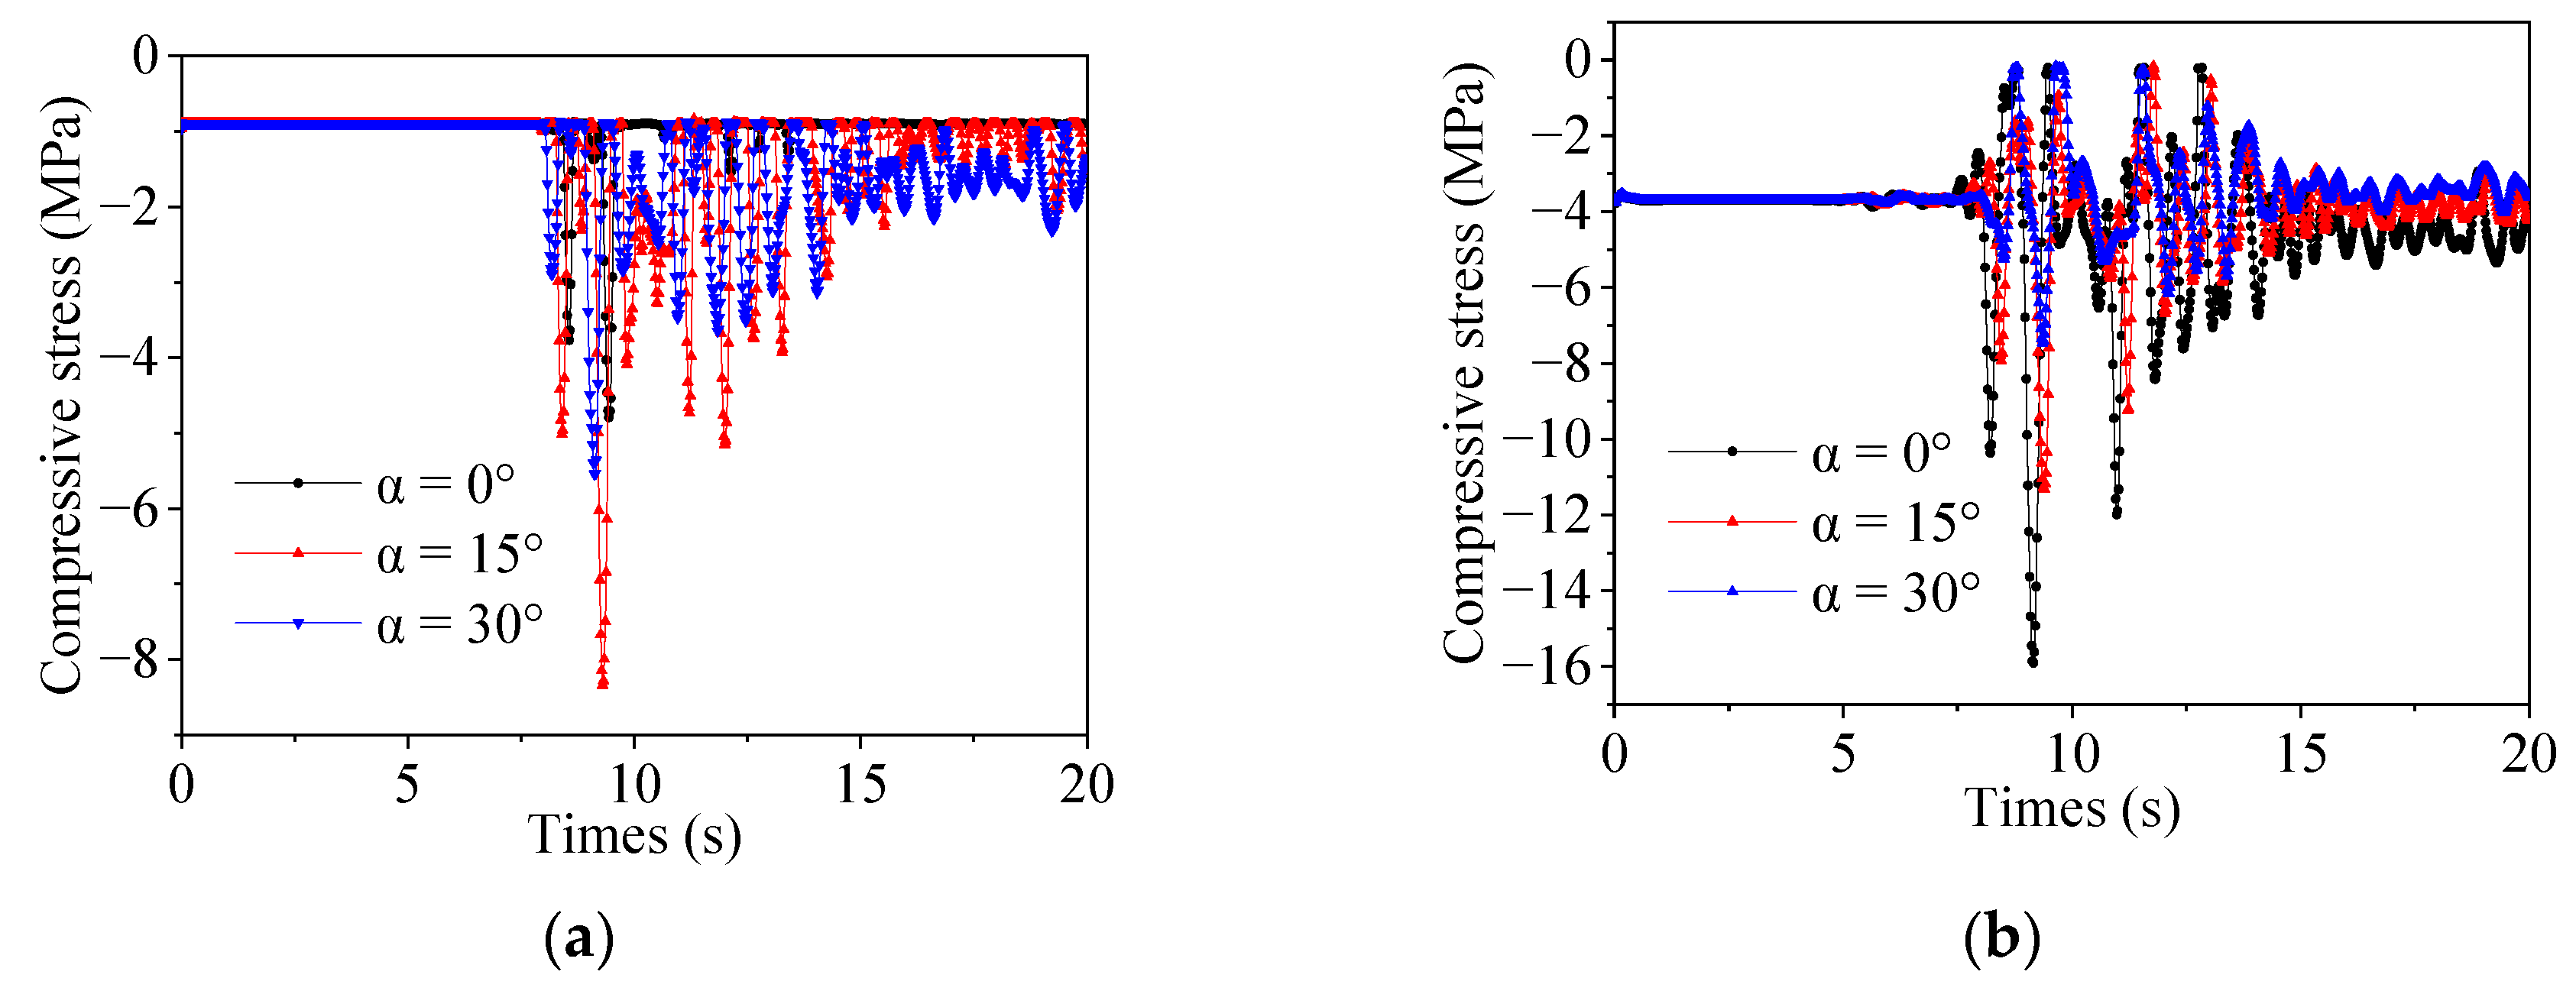
According to Figure 22 and Figure 23, the maximum stress of the shear key under an earthquake is compressive stress, while the tensile stress is relatively small. The tensile stress is mainly concentrated at the root of shear key and decreases from the root to the end. Meanwhile, the compressive stress distribution of the shear key is relatively uniform. The end and root of the shear key are subjected to large compressive stress, and the maximum compressive stress appears at the end of shear key. Moreover, the tensile stress of the shear key has a certain angle with the horizontal plane, while the tensile strength of the concrete is low, and the root of the shear key is prone to produce a certain angle of tensile crack, which is consistent with the experimental phenomenon observed by Hu and Xie [44]. Under the action of an earthquake, the shear key tenon and shear key groove squeeze each other, and the compressive stress at the end angle of the shear key is large, where stress concentration and damage can easily occur.
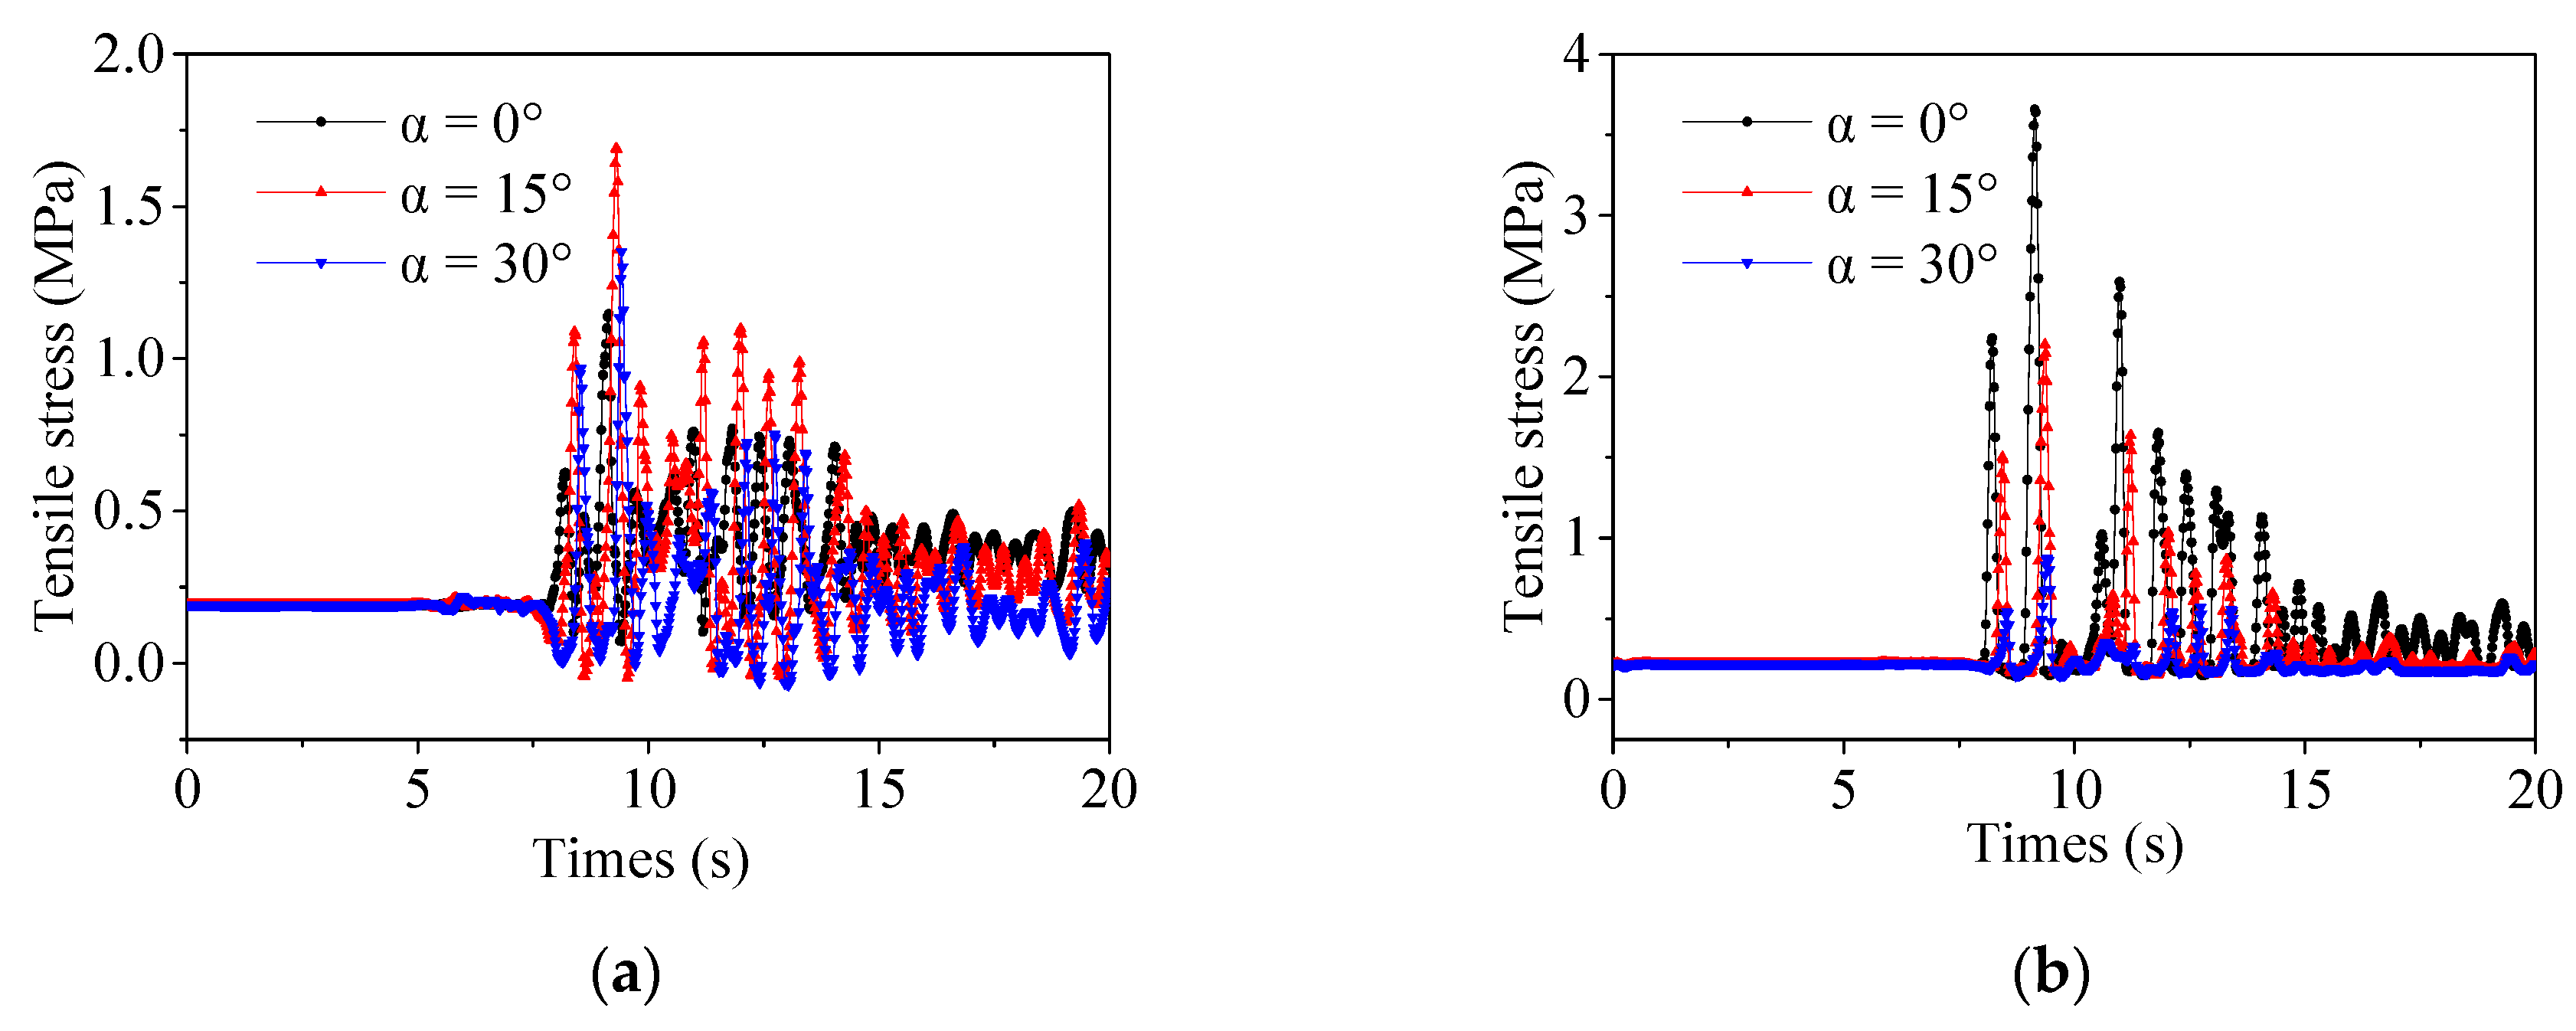
In order to clarify the change in the stress level of shear key with the incident angle, the tensile stress time history of the root node of shear key B and the compressive stress time history of the end node of shear key E were extracted for analysis, as shown in Figure 24 and Figure 25. We can see from the figures that the stress of the shear key experiences severe fluctuations in the period of 7–15 s, and the maximum value appears near 8.52 s, but different incident angles have different time delays. This performance is similar to the fluctuation characteristics of the input seismic wave, indicating that the stress fluctuation on the shear key is mainly affected by the input seismic wave. The initial value of the shear key stress time history is not 0, indicating that the shear key is subjected to a certain static force before the dynamic calculation, which is mainly caused by self-weight and hydrostatic pressure. As the incident angle increases, the stress of vertical shear key B increases, and the stress of horizontal shear key E decreases. The oblique incidence makes the stress distribution of shear key more complicated. This was also mentioned in the previous section, which is related to the change in the horizontal and vertical components caused by the oblique incidence. The tensile strength of concrete material is low; hence, the tensile stress is an important index to evaluate the safety of shear key. The maximum tensile stress of shear key E reaches 3.65 MPa, which exceeds its ultimate tensile strength, indicating that shear key E is damaged. Even if the oblique incidence of seismic waves makes the shear key B produce greater stress, the stress is less than the damage threshold. It can be concluded that the damage of shear key mainly occurs in the root with tensile failure, and the shear key corner stress concentration phenomenon needs attention.
As a result, in the seismic design, attention should be paid to the configuration of anti-crack steel bars at the connection between the shear key and immersed segment and the selection of concrete materials, as well as the structural optimization of the end angle of the shear key, such as setting a certain chamfer or changing the shape of shear key, so as to reduce the local stress concentration at the end angle to meet the seismic demand of the shear key. In addition, the ultimate bearing capacity of shear key can refer to the design method of the bracket which is controlled by the crack under the normal limit state for the force mode of shear key and is very close to the bracket.

5. Conclusions

The incident angle and SSI have a significant impact on site seismic response. Using the FEM and time-domain wave method, this study combined the analytical solution of the free-field seismic response of the soil when the SV wave is obliquely incident in the half-space with the VSAB. The numerical simulation of an SV wave with oblique incidence was realized by applying equivalent nodal loads on the boundary. The simulation technology can be used for the seismic response analysis of an SSI system. The rationality and accuracy of the simulation technique were verified using a free-field example. On this basis, a 3D FE model of a soil-immersed tunnel is established. Considering the coupling effect of static–dynamic load, the seismic response of the HZM immersed tunnel under an oblique incident SV wave was studied. The main conclusions of the simulation are as follows:
  • The proposed method can effectively simulate the seismic response of engineering site under oblique incidence of the SV wave. This method can consider the impact of incident angle and SSI, which is useful for the seismic design of tunnel structures.
  • The oblique incident SV wave amplifies the vertical and longitudinal seismic responses of the structure, and the influence reaches maximum when the incident angle is close to the critical angle. Moreover, the oblique incident SV wave reduces the response frequency of the tunnel structure, making it closer to the natural frequency of the soil–tunnel system.
  • With an increase in the incident angle, the horizontal displacement and force of tunnel structure decrease and tend to be stable. The difference between the incident angle of 15° and 30° is small.
  • The oblique incidence of seismic wave causes the asymmetric shearing force in symmetric parts of the structure, resulting in the change of the shear bearing ratio in the shear key. The root of the shear key is prone to tensile cracks, and the end angle may also be partially damaged due to stress concentration. Therefore, the influence of oblique incidence of seismic waves should be considered in seismic design. Furthermore, attention should be paid to the configuration of anti-crack reinforcement at the connection between the shear key and immersed segment and the structural optimization of the end angle of shear key.
  • Further improvements of the factors (e.g., the oblique incidence direction parallel to the yz plane and multilayered foundation) will be investigated to establish a more general model and obtain more accurate results.

Author Contributions

Conceptualization: C.H.; methodology, C.H.; validation, C.H. and G.X.; formal analysis, C.H.; investigation, Z.Z.; resources, Z.Z.; data curation, C.H.; writing—original draft preparation, C.H.; writing—review and editing, C.H.; visualization, C.H. and W.L.; supervision, G.X.; project administration, G.X.; funding acquisition, W.L. All authors have read and agreed to the published version of the manuscript.

Funding

This research was funded by the National Natural Science Foundation of China (Grant No. 51508200).

Institutional Review Board Statement

Not applicable.

Informed Consent Statement

Not applicable.

Data Availability Statement

The data that support the findings of this study are available from the first author upon reasonable request.

Acknowledgments

We thank the Cosmos Virtual Data Center for sharing their data. We thank the anonymous reviewers for their comments, which were of substantial help to the improvement of the paper.

Conflicts of Interest

The authors declare no conflict of interest.

References

  1. Yu, H.T.; Yuan, Y.; Bobet, A. Multiscale Method for Long Tunnels Subjected to Seismic Loading. Int. J. Numer. Anal. Methods Geomech. 2013, 37, 374–398. [Google Scholar] [CrossRef]
  2. Anastasopoulos, I.; Gerolymos, N.; Drosos, V.; Georgarakos, T.; Kourkoulis, R.; Gazetas, G. Behaviour of deep immersed tunnel under combined normal fault rupture deformation and subsequent seismic shaking. Bull. Earthq. Eng. 2008, 6, 213–239. [Google Scholar] [CrossRef]
  3. Hu, X.Y.; Zhang, X.X.; Qiu, Y.L.; Dong, W.H.; Kou, B.W. Seismic analysis of immersed tube tunnel for Hong Kong-Zhu Hai-Macao Bridge Project. Adv. Mater. Res. 2011, 250–253, 1723–1727. [Google Scholar] [CrossRef]
  4. Chen, Z.Y.; Liang, S.B.; He, C. Seismic performance of an immersed tunnel considering random soil properties and wave passage effects. Struct. Infrastruct. Eng. 2018, 14, 89–103. [Google Scholar] [CrossRef]
  5. Taylor, P.R.; Ibrahim, H.H.; Yang, D. Seismic retrofit of George Massey Tunnel. Earthq. Eng. Struct. Dyn. 2005, 34, 519–542. [Google Scholar] [CrossRef]
  6. Egeli, I.; Gurbuz, C. Dynamic analysis of an immersed tunnel in Izmir. Recista Constr. 2018, 17, 103–111. [Google Scholar] [CrossRef]
  7. Choshiro, T.; Shunzo, O. On earthquake resistant design of a submerged tunnel. In Proceedings of the International Symposium on Earthquake Structure Engineering, St. Louis, MO, USA, 19–21 August 1976; pp. 809–822. [Google Scholar]
  8. Sawamura, Y.; Kishida, K.; Kimura, M. Experimental study on seismic resistance of a two-hinge precast arch culvert using strong earthquake response simulator. In Proceedings of the 15th Asian Regional Conference on Soil Mechanics and Geotechnical Engineering, Fukuoka, Japan, 9–13 November 2015; pp. 1684–1687. [Google Scholar] [CrossRef] [Green Version]
  9. Naseem, A.; Kashif, M.; Iqbal, N.; Schotte, K.; Backer, H.D. Seismic Behavior of Triple Tunnel Complex in Soft Soil Subjected to Transverse Shaking. Appl. Sci. 2020, 10, 334. [Google Scholar] [CrossRef] [Green Version]
  10. Oskouei, A.G.; Oskouei, A.V. The Effect of P-Wave Propagation on the Seismic Behavior of Steel Pipelines. Period. Polytech. Civ. Eng. 2017, 61, 889–903. [Google Scholar] [CrossRef]
  11. Nguyena, D.D.; Parkb, D.; Shamsherb, S.; Nguyenb, V.Q.; Leea, T.H. Seismic vulnerability assessment of rectangular cut-and-cover subway tunnels. Tunn. Undergr. Space Technol. 2019, 86, 247–261. [Google Scholar] [CrossRef]
  12. Pham, V.V.; Do, N.A.; Dias, D. Sub-Rectangular Tunnel Behavior under Seismic Loading. Appl. Sci. 2021, 11, 9909. [Google Scholar] [CrossRef]
  13. Wadi, A.; Pettersson, L.; Karoumi, R. FEM simulation of a full-scale loading-to-failure test of a corrugated steel culvert. Steel Compos. Struct. 2018, 27, 217–227. [Google Scholar] [CrossRef]
  14. Abuhajar, O.; Naggar, H.E.; Newson, T. Static soil culvert interaction the effect of box culvert geometric configurations and soil properties. Comput. Geotech. 2015, 69, 219–235. [Google Scholar] [CrossRef]
  15. Abuhajar, O.; Naggar, H.E.; Newson, T. Experimental and numerical investigations of the effect of buried box culverts on earthquake excitation. Soil Dyn. Earthq. Eng. 2015, 79, 130–148. [Google Scholar] [CrossRef]
  16. Michael, G.K. Seismic Design and Analysis of Buried Culverts and Structures. J. Pipeline Syst. Eng. Pract. 2010, 1, 111–119. [Google Scholar] [CrossRef]
  17. Yatsumoto, H.; Mitsuyoshi, Y.; Sawamura, Y.; Kimura, M. Seismic Design and Analysis of Buried Culverts and Structures. Undergr. Space 2018, 4, 147–167. [Google Scholar] [CrossRef]
  18. Maleska, T.; Beben, D.; Nowacka, J. Seismic vulnerability of a soil-steel composite tunnel–Norway Tolpinrud Railway Tunnel Case Study. Tunn. Undergr. Space Technol. 2021, 110, 103808. [Google Scholar] [CrossRef]
  19. Maleska, T.; Beben, D. Behaviour of soil-steel composite bridge with various cover depths under seismic excitation. Steel Compos. Struct. 2022, 42, 747–764. [Google Scholar] [CrossRef]
  20. Sigaki, T.; Kiyohara, K.; Sono, Y.; Kinosita, D.; Masao, T.; Tamura, R.; Yoshimura, C.; Ugata, T. Estimation of earthquake motion incident angle at rock site. In Proceedings of the 12th World Conference Earthquake Engineering, Auckland, New Zealand, 30 January–4 February 2000; p. 956. [Google Scholar]
  21. Li, P.; Song, E.X. Three-dimensional numerical analysis for the longitudinal seismic response of tunnels under an asynchronous wave input. Comput. Geotech. 2014, 63, 229–243. [Google Scholar] [CrossRef]
  22. Huang, J.Q.; Zhao, M.; Du, X.L. Non-linear seismic responses of tunnels within normal fault ground under obliquely incident P waves. Tunn. Undergr. Space Technol. 2017, 61, 26–39. [Google Scholar] [CrossRef]
  23. Huang, J.Q.; Du, X.L.; Jin, L.; Zhao, M. Impact of incident angles of P waves on the dynamic responses of long lined tunnels. Earthq. Eng. Struct. Dyn. 2016, 45, 2435–2454. [Google Scholar] [CrossRef]
  24. Wang, X.W.; Chen, J.T.; Xiao, M. Seismic damage assessment and mechanism analysis of underground powerhouse of the Yingxiuwan Hydropower Station under the Wenchuan earthquake. Soil Dyn. Earthq. Eng. 2018, 113, 112–123. [Google Scholar] [CrossRef]
  25. Wang, X.W.; Chen, J.T.; Xiao, M. Seismic responses of an underground powerhouse structure subjected to oblique incidence SV and P waves. Soil Dyn. Earthq. Eng. 2019, 119, 130–143. [Google Scholar] [CrossRef]
  26. He, C.; Gong, J.P.; Xu, G.Y. Seismic response analysis of oblique incident angle of SV wave on immersed tunnel. IOP Conf. Ser. Earth Environ. Sci. 2019, 304, 042059. [Google Scholar] [CrossRef]
  27. Zhang, G.L.; Wang, P.G.; Zhao, M.; Du, X.L.; Zhao, X. Seismic structure-water-sediment-rock interaction model and its application to immersed tunnel analysis under obliquely incident earthquake. Tunn. Undergr. Space Technol. 2021, 109, 103758. [Google Scholar] [CrossRef]
  28. Zhou, X.J.; Liang, Q.H.; Zhang, Y.Y.; Liu, Z.X.; He, Y. Three-dimensional nonlinear seismic response of immersed tunnel in horizontally layered site under obliquely incident SV waves. Shock. Vib. 2019, 3131502. [Google Scholar] [CrossRef] [Green Version]
  29. Wolf, J.P. Dynamic Soil-Structure Interaction; Prentice-Hall: Englewood Cliffs, NJ, USA, 1985. [Google Scholar]
  30. Peng, H.K.; Meng, G.; Ding, Q.; Xu, F. The influence of hydrodynamic pressure on immersed tunnel under earthquake excitation. J. Shanghai Jiaotong Univ. 2008, 42, 1027–1031. [Google Scholar] [CrossRef]
  31. Achenbach, J.D. Wave Propagation in Elastic Solids; Elsevier: Amsterdam, The Netherlands, 1973. [Google Scholar]
  32. Deeks, A.J.; Randolph, M.F. Axisymmetric time-domain transmitting boundaries. J. Eng. Mech. 1994, 120, 25–42. [Google Scholar] [CrossRef]
  33. Liu, J.B.; Du, Y.X.; Du, X.L.; Wang, Z.Y.; Wu, J. 3D viscous-spring artificial boundary in time domain. Earthq. Eng. Eng. Vib. 2006, 5, 93–102. [Google Scholar] [CrossRef]
  34. Liu, J.B.; Lu, Y.D. A direct method for analysis of dynamic soil-structure interaction based on interface idea. Delelopments Geotech. Eng. 1998, 83, 261–276. [Google Scholar] [CrossRef]
  35. Kuhlemeyer, R.L.; Lysmer, J. Finite element method accuracy for wave propagation problems. J. Soil Mech. Found. Div. 1973, 99, 421–427. [Google Scholar] [CrossRef]
  36. Ewing, W.M.; Jardetzky, W.S.; Press, F. Elastic Waves in Layered Media; McGraw-Hill: New York, NY, USA, 1957. [Google Scholar]
  37. Eringen, A.C.; Suhubi, E.S. Elastodynamics; Academic Press: New York, NY, USA, 1975. [Google Scholar]
  38. Lee, C.F.; Ding, Y.Z.; Huang, R.H. Seismic Hazard Analysis of the Hong Kong Region; Geo Report No.65; Geotechnical Engineering Office: Hong Kong, China, 1998; pp. 14–24.
  39. ABAQUS Inc. ABAQUS Theory Manual Version 6.12; Rising Sun Mills: Providence, RI, USA, 2007. [Google Scholar]
  40. Dong, Y.; Lou, M.L. Seismic response analysis of complicated soil site based on saturated porous media. J. Tongji Univ. (Nat. Sci.) 2014, 42, 198–202. [Google Scholar] [CrossRef]
  41. Hatzigeorgiou, G.D.; Beskos, D.E. Soil-structure interaction effects on seismic inelastic analysis of 3-D tunnels. Soil Dyn. Earthq. Eng. 2010, 30, 851–861. [Google Scholar] [CrossRef]
  42. Lou, M.L.; Dong, Y.; Zhang, R.L. Several problems in refined local modeling for seismic response analysis of immersed tunnel. Chin. J. Geotech. Eng. 2016, 38, 1705–1712. [Google Scholar] [CrossRef]
  43. Cheng, X.J.; Xu, K.P.; Liang, H.A. Study on the scheme of sensor arrangement in pseudo static test for immersed tunnel joint. IOP Conf. Ser. Earth Environ. Sci. 2020, 455, 012165. [Google Scholar] [CrossRef]
  44. Hu, Z.N.; Xie, Y.L. Mechanical and failure characteristics of shear keys on immersed tunnel segment joints under differential settlements. Procedia Eng. 2016, 166, 373–378. [Google Scholar] [CrossRef]
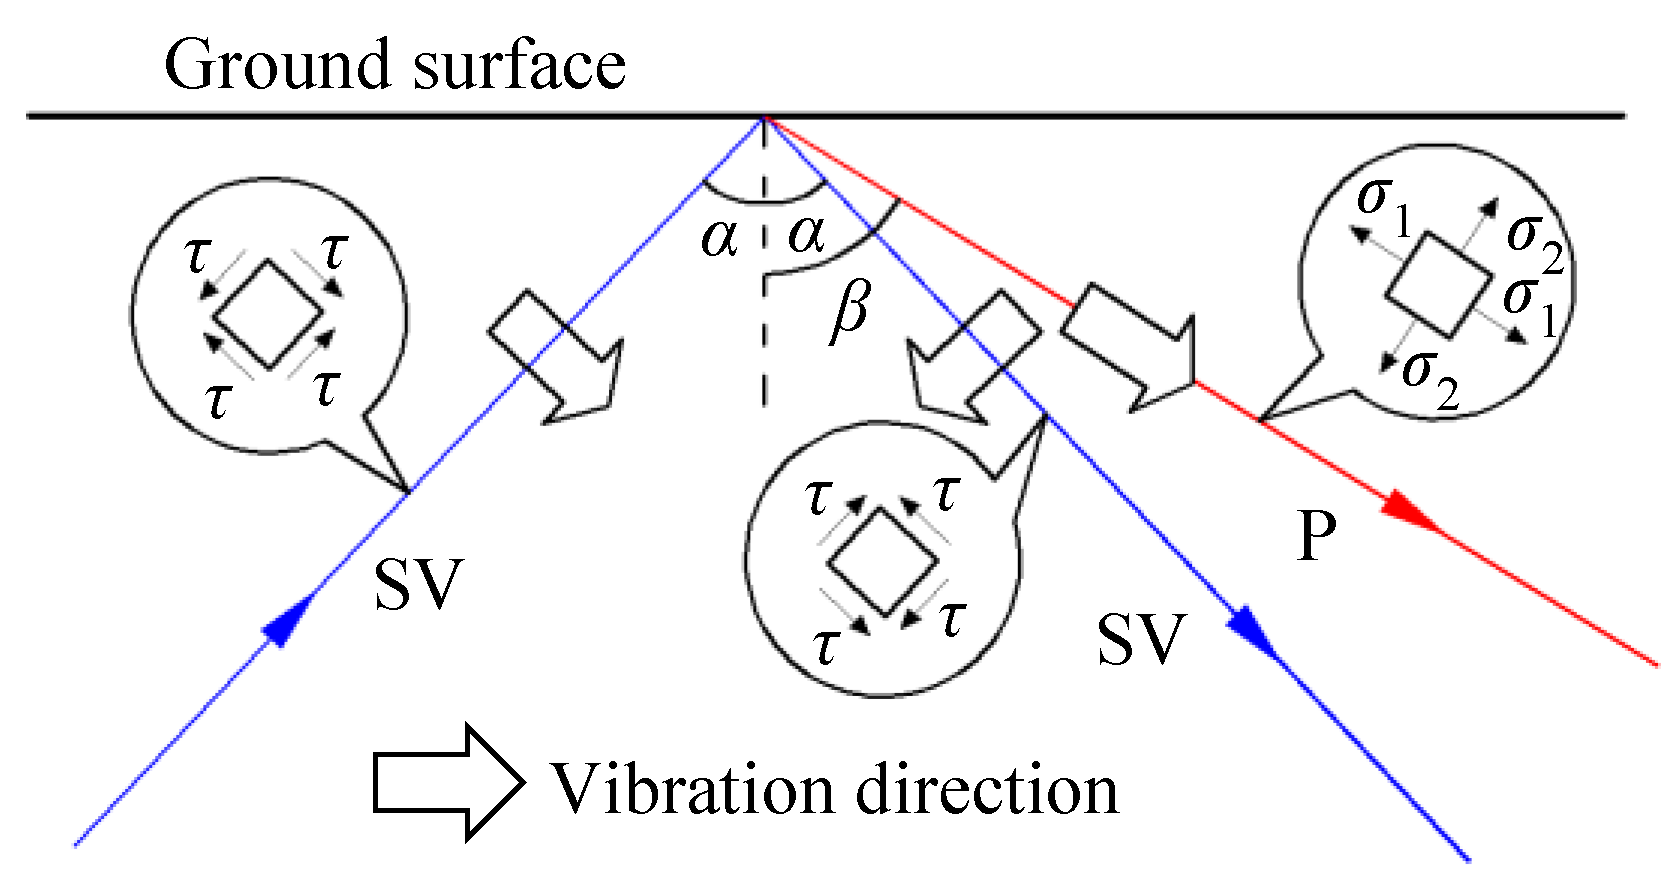
Figure 1. Reflection of SV wave on the free surface.
Applsci 12 10440 g001
Figure 2. Schematic diagram of oblique incidence of plane SV wave condition: (a) 3D schematic diagram; (b) 2D schematic diagram.
Applsci 12 10440 g002
Figure 3. The 3D VSAB condition.
Applsci 12 10440 g003
Figure 4. Plane SV wave pulse of oblique incidence: (a) displacement; (b) velocity.
Applsci 12 10440 g004
Figure 5. Displacement of half-space subjected to SV wave incidence at 30° (unit: m): (a) t = 0.46 s; (b) t = 0.88 s; (c) t = 1.13 s; (d) t = 1.45 s.
Applsci 12 10440 g005
Figure 6. Time history of the displacement of plane SV wave incidence at 30°: (a) the center point of the bottom; (b) the center point of the top.
Applsci 12 10440 g006
Figure 7. Typical structural section of segment joint in immersed tunnel (unit: m).
Applsci 12 10440 g007
Figure 8. Whole FE model.
Applsci 12 10440 g008
Figure 9. The Kobe wave: (a) time history; (b) Fourier spectrum.
Applsci 12 10440 g009
Figure 10. Sketch drawing of seabed surface hydrodynamic pressure decomposition.
Applsci 12 10440 g010
Figure 11. Flowchart of numerical simulation process.
Applsci 12 10440 g011
Figure 12. Acceleration time history of monitoring point: (a) horizontal acceleration of roof midpoint; (b) vertical acceleration of roof midpoint; (c) horizontal acceleration of floor midpoint; (d) vertical acceleration of floor midpoint.
Applsci 12 10440 g012
Figure 13. Fourier spectrum of roof midpoint: (a) horizontal; (b) vertical.
Applsci 12 10440 g013
Figure 14. Fourier spectrum comparison between monitoring points and incident seismic wave.
Applsci 12 10440 g014
Figure 15. The maximum relative horizontal displacement of the wall: (a) the middle wall; (b) the side wall.
Applsci 12 10440 g015
Figure 16. Relative displacement of segment joint: (a) horizontal; (b) longitudinal; (c) vertical.
Applsci 12 10440 g016
Figure 17. Horizontal and vertical displacements of segment at different angles of incidence: (a) horizontal; (b) vertical.
Applsci 12 10440 g017
Figure 18. Curves of axial force of segment at different angles of incidence.
Applsci 12 10440 g018
Figure 19. Curves of bending moment of segment at different angles of incidence: (a) transverse; (b) vertical.
Applsci 12 10440 g019
Figure 20. Distribution of shear keys at segment joint.
Applsci 12 10440 g020
Figure 21. Shearing force of segment at different angles of incidence: (a) transverse; (b) vertical.
Applsci 12 10440 g021
Figure 22. Tensile stress vector diagram of the shear key: (a) shear key B; (b) shear key E. (unit: Pa).
Applsci 12 10440 g022
Figure 23. Compressive stress vector diagram of the shear key: (a) shear key B; (b) shear key E. (unit: Pa).
Applsci 12 10440 g023
Figure 24. Tensile stress time history of the shear key: (a) shear key B; (b) shear key E.
Applsci 12 10440 g024
Figure 25. Compressive stress time history of the shear key: (a) shear key B; (b) shear key E.
Applsci 12 10440 g025
Table 1. The material properties of the model.
MaterialDensity (kg/m3)Poisson’s RatioModulus of Elasticity (MPa)Shear Wave Velocity (m/s)
Concrete25000.1632,500-
Soil layer20000.27101.6141
Overlying gravel soil15000.15150209
Publisher’s Note: MDPI stays neutral with regard to jurisdictional claims in published maps and institutional affiliations.