Article

A Novel Non-Parametric Spatiotemporal Scan Statistic: An Application to Detect Disease Outbreaks

by
Kethmi H. Hettige
* and
Chandima D. Tilakaratne
Department of Statistics, University of Colombo, Colombo P.O. Box 1490, Sri Lanka
*
Author to whom correspondence should be addressed.
Appl. Sci. 2022, 12(20), 10513; https://doi.org/10.3390/app122010513
Submission received: 26 August 2022 / Revised: 16 September 2022 / Accepted: 26 September 2022 / Published: 18 October 2022
(This article belongs to the Section Computing and Artificial Intelligence)

Abstract

:
The majority of the widely used scan statistics are based on distributional assumptions. Contrary to the existing methods, with a new perspective in clustering, the Mann-Whitney Scan Statistic was introduced to detect clusters in continuous data indexed by time or space, without any distributional assumptions or parameters to set up. We propose an extension of the Mann-Whitney Scan Statistic that can be applied to spatiotemporal data based on spatiotemporal distance measure. This novel scan statistic is distribution-free and seems to be powerful against parametric spatiotemporal scan statistics. The results are applicable in a wide variety of spatiotemporal domains, including epidemiology, socioeconomic analysis and climate sciences, irrespective of continuous or discrete data.

1. Introduction

In general, scan statistics are designed and used for analyzing count data, i.e., point processes. Past literature reveals the use of several versions of spatiotemporal scan statistics in disease outbreak detection. Some of the related works are presented in [1,2,3,4]. In most of these studies, scan statistics show a greater ability in detecting disease outbreak areas. However, in all these studies, it is assumed that the response variable (i.e., disease-related events) follows a Poisson distribution and thus that events are independent of each other. For instance, both the Space Time Scan Statistic and Space Time Permutation Scan Statistic assume that the number of occurrences follow a Poisson distribution. However, in reality, the occurrences of communicable diseases are not independent of each other with respect to time as well as space. For example, in the domain of disease data, it is unreasonable to assume that disease events are independent. It is highly likely that disease cases are dependent on each other based on both the location and time aspects. Hence, the use of parametric scan statistics will not always yield the correct results and might distort the real scenario.
Given these facts, with a new perspective of clustering, the authors of [5] introduced the Mann-Whitney Scan Statistic, which allows the detection of clusters in continuous data indexed by time or by space, without any distributional assumptions or parameters to set up. This scan statistic is based on the Mann-Whitney test [6], which is used to test whether the distributions of two samples of continuous observations are equal, or at least whether their medians are equal.
The authors of [7] suggested that the use of the non-parametric concentration index may be more powerful than likelihood ratio tests to detect cluster presence in point processes. Thus, the study [8] used the distribution-free null hypothesis, “the marks are realizations of independent and identically distributed random variables”, in analyzing the spatially marked point processes. The same null hypothesis was used by the authors of [5] in defining the Mann-Whitney Scan Statistic but with continuous marks. The null hypothesis used in [1,9] is the same, but there is a specific pre-determined distribution (Bernoulli, Poisson or Gaussian).
The methodology proposed in [5] is only focused on identifying the most significant cluster, but not the secondary clusters. However, finding secondary clusters is straightforward using the procedure proposed in [10]. This method suggests, once a significant cluster is found, to remove the data included in the significant cluster and restart the analyzing process.
In literature, there are some studies which propose non-parametric tests, such as [11,12]. However, these studies focus only on spatial data. The study [5] introduced the Mann-Whitney Scan Statistic either to be applied in a spatial or temporal context. The present paper introduces the Mann-Whitney Scan Statistic that can also be applied to spatiotemporal data using the spatiotemporal distance introduced in [13]. Taking this into account, the ultimate objective of this study is to extend the Mann-Whitney Scan Statistic to be applied in the spatiotemporal context.
The next section of this paper describes the development of the Spatiotemporal Mann-Whitney Scan Statistic. Section 3 demonstrates its application to a simulated dataset and real-time application to detect COVID-19 outbreak. Furthermore, this section explicitly compares the performance of the novel Spatiotemporal Mann-Whitney Scan Statistic against the widely used parametric scan statistics in disease outbreak areas. Finally, the Section 4 presents the concluding remarks and discusses the limitations and further improvements of the study.

2. Methodology

2.1. A Spatiotemporal Mann-Whitney Scan Statistic

Likelihood-based Scan Statistics such as the Space Time Scan Statistic and Space Time Permutation Scan Statistic are sensitive to the distribution of the response variable and hence perform well only against specific alternatives. Thus, as discussed so far, the Mann-Whitney Scan Statistic becomes a unique clustering alternative due to its non-parametric nature. However, to date, the Mann-Whitney Scan Statistic has only been developed to capture spatial variations with no regard for the temporal aspect. This section comprehensively explains the improvement of the Mann-Whitney Scan Statistic to be used in the spatiotemporal context.

2.1.1. Spatiotemporal Distance

The authors of [5] suggested that the Mann-Whitney Scan Statistic can be applied to spatiotemporal data using the spatiotemporal distance introduced in [13]. This was the major motivation behind the improvement of this concept. The authors of [13] introduced the spatiotemporal distance as a weighted combination of the spatial and temporal Euclidian distances along with a parameter establishing the correspondence between space and time. The procedure can be explained as follows.
Let | A | denote the observation domain area and | T | the time observational interval length. Let D = 2 | A | π the diameter of a disc whose area is | A | . Therefore, D is the maximal spatial distance between two points in the disc. Correspondingly, the spatiotemporal distance is defined as follows [13].
d S T [ ( x , y , t ) , ( x 0 , y 0 , t 0 ) ] 2 = d S [ ( x , y ) , ( x 0 , y 0 ) ] 2 + D 2 | T | 2 d T [ t , t 0 ] 2
where d S and d T are the Euclidian spatial and temporal distances, respectively.
Furthermore, the study [11] stated that this defined distance can be considered as a spatial Euclidean distance in 3 after rescaling the temporal axis. Hence, more precisely, the spatiotemporal distance d S T can be illustrated as follows:
d S T [ ( x , y , t ) , ( x 0 , y 0 , t 0 ) ] = d S [ ( x , y , D T t ) , ( x 0 , y 0 , D T t 0 ) ]  

2.1.2. Calculation of the Spatiotemporal MW Concentration Index

Let S 1 , S 2 , , S n denote n   distinct spatiotemporal locations. Suppose that the locations are ordered:   S 1 < S 2 < < S n based on the spatiotemporal distance (Equation (2)) with respect to the coordinates and time factor of each of the distinct spatiotemporal locations instead of using the spatial distance.
For example, suppose the observations over a period of 31 days are considered and hence the observational time length ( T )   is 31, and the maximum spatial distance ( D )   among the points of the area of interest is 30 km. Then, the spatiotemporal distance between two points (40.7504, 73.9967, 3) and (40.722, −73.99, 5) can be calculated as follows.
d S T [ ( 40.7504 ,   73.9967 ,   3 ) , ( 40.722 , 73.99 ,   5 ) ] = d S [ ( 40.7504 , 73.9967 , 30 31 × 3 ) , ( 40.722 , 73.99 , 30 31 × 5 ) ] = ( 40.7504 40.722 ) 2 + ( 73.9967 ( 73.99 ) ) 2 + ( ( 30 31 × 3 ) ( 30 31 × 3 ) ) 2 = 148.000217
The continuous marks attached to each spatiotemporal location are denoted by X 1 , X 2 , , X n . Let X ( 1 ) , X ( 2 ) , , X ( n ) be the order statistics associated with the X i s such that X ( 1 ) < X ( 2 ) < < X ( n ) . Let R j   be the rank of X j such that   X ( R j ) = X j ,     j = 1 , 2 , , n
Then Mann-Whitney Spatial Scan Statistic can be extended to the spatiotemporal setting by considering a three-dimensional cylindrical scanning window with a base representing space and a height representing time. Then, for each cylinder C y , containing n C   distinct spatiotemporal locations, the standardized sum of ranks can be calculated as follows.
I r a n k ( C y ) = S R ( C y ) M ( C y ) V ( C y )  
where S R ( C y ) = S k C y R k   , M ( C y ) = n C ( n + 1 ) 2 and V ( C y ) =   n C ( n n C ) ( n + 1 ) 12 . Accordingly, the spatiotemporal MW concentration index for high-rate clusters can be defined as
M W S T H = max C y ϵ S I r a n k ( C y )
According to the literature, it appears to be difficult to find the exact or even an asymptotic distribution of this type of test statistic. Therefore, the p-value is estimated using the Monte Carlo procedure where the observed scan statistic is compared to the scan statistics computed after random permutations of the marks. This methodology proposed in [5] is only focused on identifying the most significant cluster, but not the secondary clusters. However, finding secondary clusters is straightforward using the procedure proposed in [10], which suggests, once a significant cluster is found, to remove the data included in the significant cluster and restart the analyzing process.

3. Experimental Results

3.1. A Simulation Study

The proposed scan statistic is first applied in the year 2004 to the simulated datasets used in [14], which have been specifically designed for evaluating and comparing the statistical power of spatiotemporal disease outbreak detection methods. These simulated datasets can be found in http://www.satscan.org/datasets (accessed on 25 December 2021).
These datasets were simulated by Martin Kulldorf based on the geography and population of New York City, including the effects of disease outbreaks of a hypothetical disease of varying size and location. Accordingly, geographic coordinates (representing the approximate center of each zip code) and population numbers for 176 New York City zip codes were used for these datasets. Assuming outbreak occurred in seventeen different locations in New York City, with a high or moderate risk, 34 datafiles were created considering a period of 31 days, with a random number of cases of the hypothetical disease. Each file has 1000 simulated datasets. For each dataset, the total number of randomly allocated cases is 100 multiplied by the number of days (i.e., 31 × 100 = 3100 cases). The number 100 was chosen to reflect the occurrence rate of certain syndromes common to the syndromic surveillance system of New York City emergency department visits.
In the null model scenario of this context, each person living in New York City is equally likely to contact the disease, and hence each case is assigned to a particular zip code on any given day with a probability proportional to the population of that zip code. When generating data for geographically localized outbreaks, an increased risk was assigned to the zip codes in which the outbreaks are assumed to have occurred. Consequently, for each such zip code and day combination, the corresponding population was multiplied by an assigned relative risk.
This study attempts to detect the areas in which a disease outbreak has occurred out of a larger geographic region using the improved Spatiotemporal Mann-Whitney Scan Statistic. The wider geographical region includes areas belonging to the four main boroughs of New York City: Brooklyn (A), Manhattan (B), Staten Island (C) and the Bronx (E). The simulated datasets, which were created assuming that outbreak occurred only in Williamsburg, Brooklyn (A), were selected to apply the novel spatiotemporal MW scan statistic. The chosen datasets are simulated with a high risk of outbreak for a period of 31 days. Of the datasets simulated, assuming outbreak occurred in Williamsburg, Brooklyn, 10 datasets were chosen randomly for this study.
The main objective in this scenario is to determine whether the exact outbreak zip code, 11211, of area A is identified by this scan statistic. If this zip code is not included in the most likely cluster, secondary clusters are found using the method introduced in [1] until this area is detected.
According to the results (see Appendix A), all the zip codes identified in the most likely cluster of each sample belong to area A. In other words, the scan statistic has detected A as the outbreak area in all cases, out of the four boroughs considered. Hence, the Spatiotemporal MW Scan Statistic performs well in detecting the area of disease outbreak in a larger geographical region. Furthermore, it detects four surrounding areas of the exact outbreak zip code on average, in the most likely cluster. Moreover, 80% of the time, the Spatiotemporal MW Scan Statistic identifies the exact outbreak zip code in the most likely cluster. Therefore, it is reasonable to suggest that the Spatiotemporal MW Scan Statistic can effectively detect the exact disease outbreak zip code in the majority of cases. In the samples where the exact zip code was not detected in the most likely cluster, it was detected in the first secondary cluster, implying that the spatiotemporal scan statistic has an ability to detect the exact outbreak zip code in one of its significant clusters.

3.2. An Application to COVID-19 Data

We secondly applied the proposed scan statistic to reported COVID-19 cases in China corresponding to the time period from January 2020 to May 2020. This dataset contains cases reported in 33 major spatial areas in China. The data were extracted through the data repository of the Center for Systems Science and Engineering at Johns Hopkins University.
Our main objective in this context is to determine disease outbreak areas with a significantly higher number of reported cases using the improved Spatiotemporal Mann-Whitney Scan Statistic. According to the results, 30 out of 33 locations are included in the most significant cluster. In order to further confirm these results, we came up with the following spatiotemporal visualizations.
The chart in Figure 1 was obtained excluding the Hubei region since it was an outlier with a significantly higher number of cases over the period. The regions which are not included in the highly likely cluster are boxed in Figure 1. According to the visualization, these regions have little or no fluctuation over the considered period compared to the other regions. Furthermore, no significant peaks of cases can be seen in those regions over the five months.
Table 1 shows the spatial averages of each region in ascending order. Accordingly, three of the areas which are not included in the cluster have the lowest spatial averages.
Moreover, according to Figure 2, the three areas which are not included in the cluster are located away (towards left) from the rest of the locations. Even though the regions Macau and Ningxia have relatively low spatial averages, they are located closer to the larger outbreak areas and hence they could have been included in the most significant cluster.

3.3. A Comparison Study

We thirdly conducted a comparison study on the simulated datasets mentioned in Section 3.1 to assess and compare the performance of the novel Spatiotemporal Mann-Whitney Scan Statistics with the existing widely used Space Time Scan Statistic and Space Time Permutation Scan Statistic. A novel performance measure is introduced for the purpose of comparing the performance due to the unavailability of a common measure which can be used for both parametric and non-parametric scan statistics.
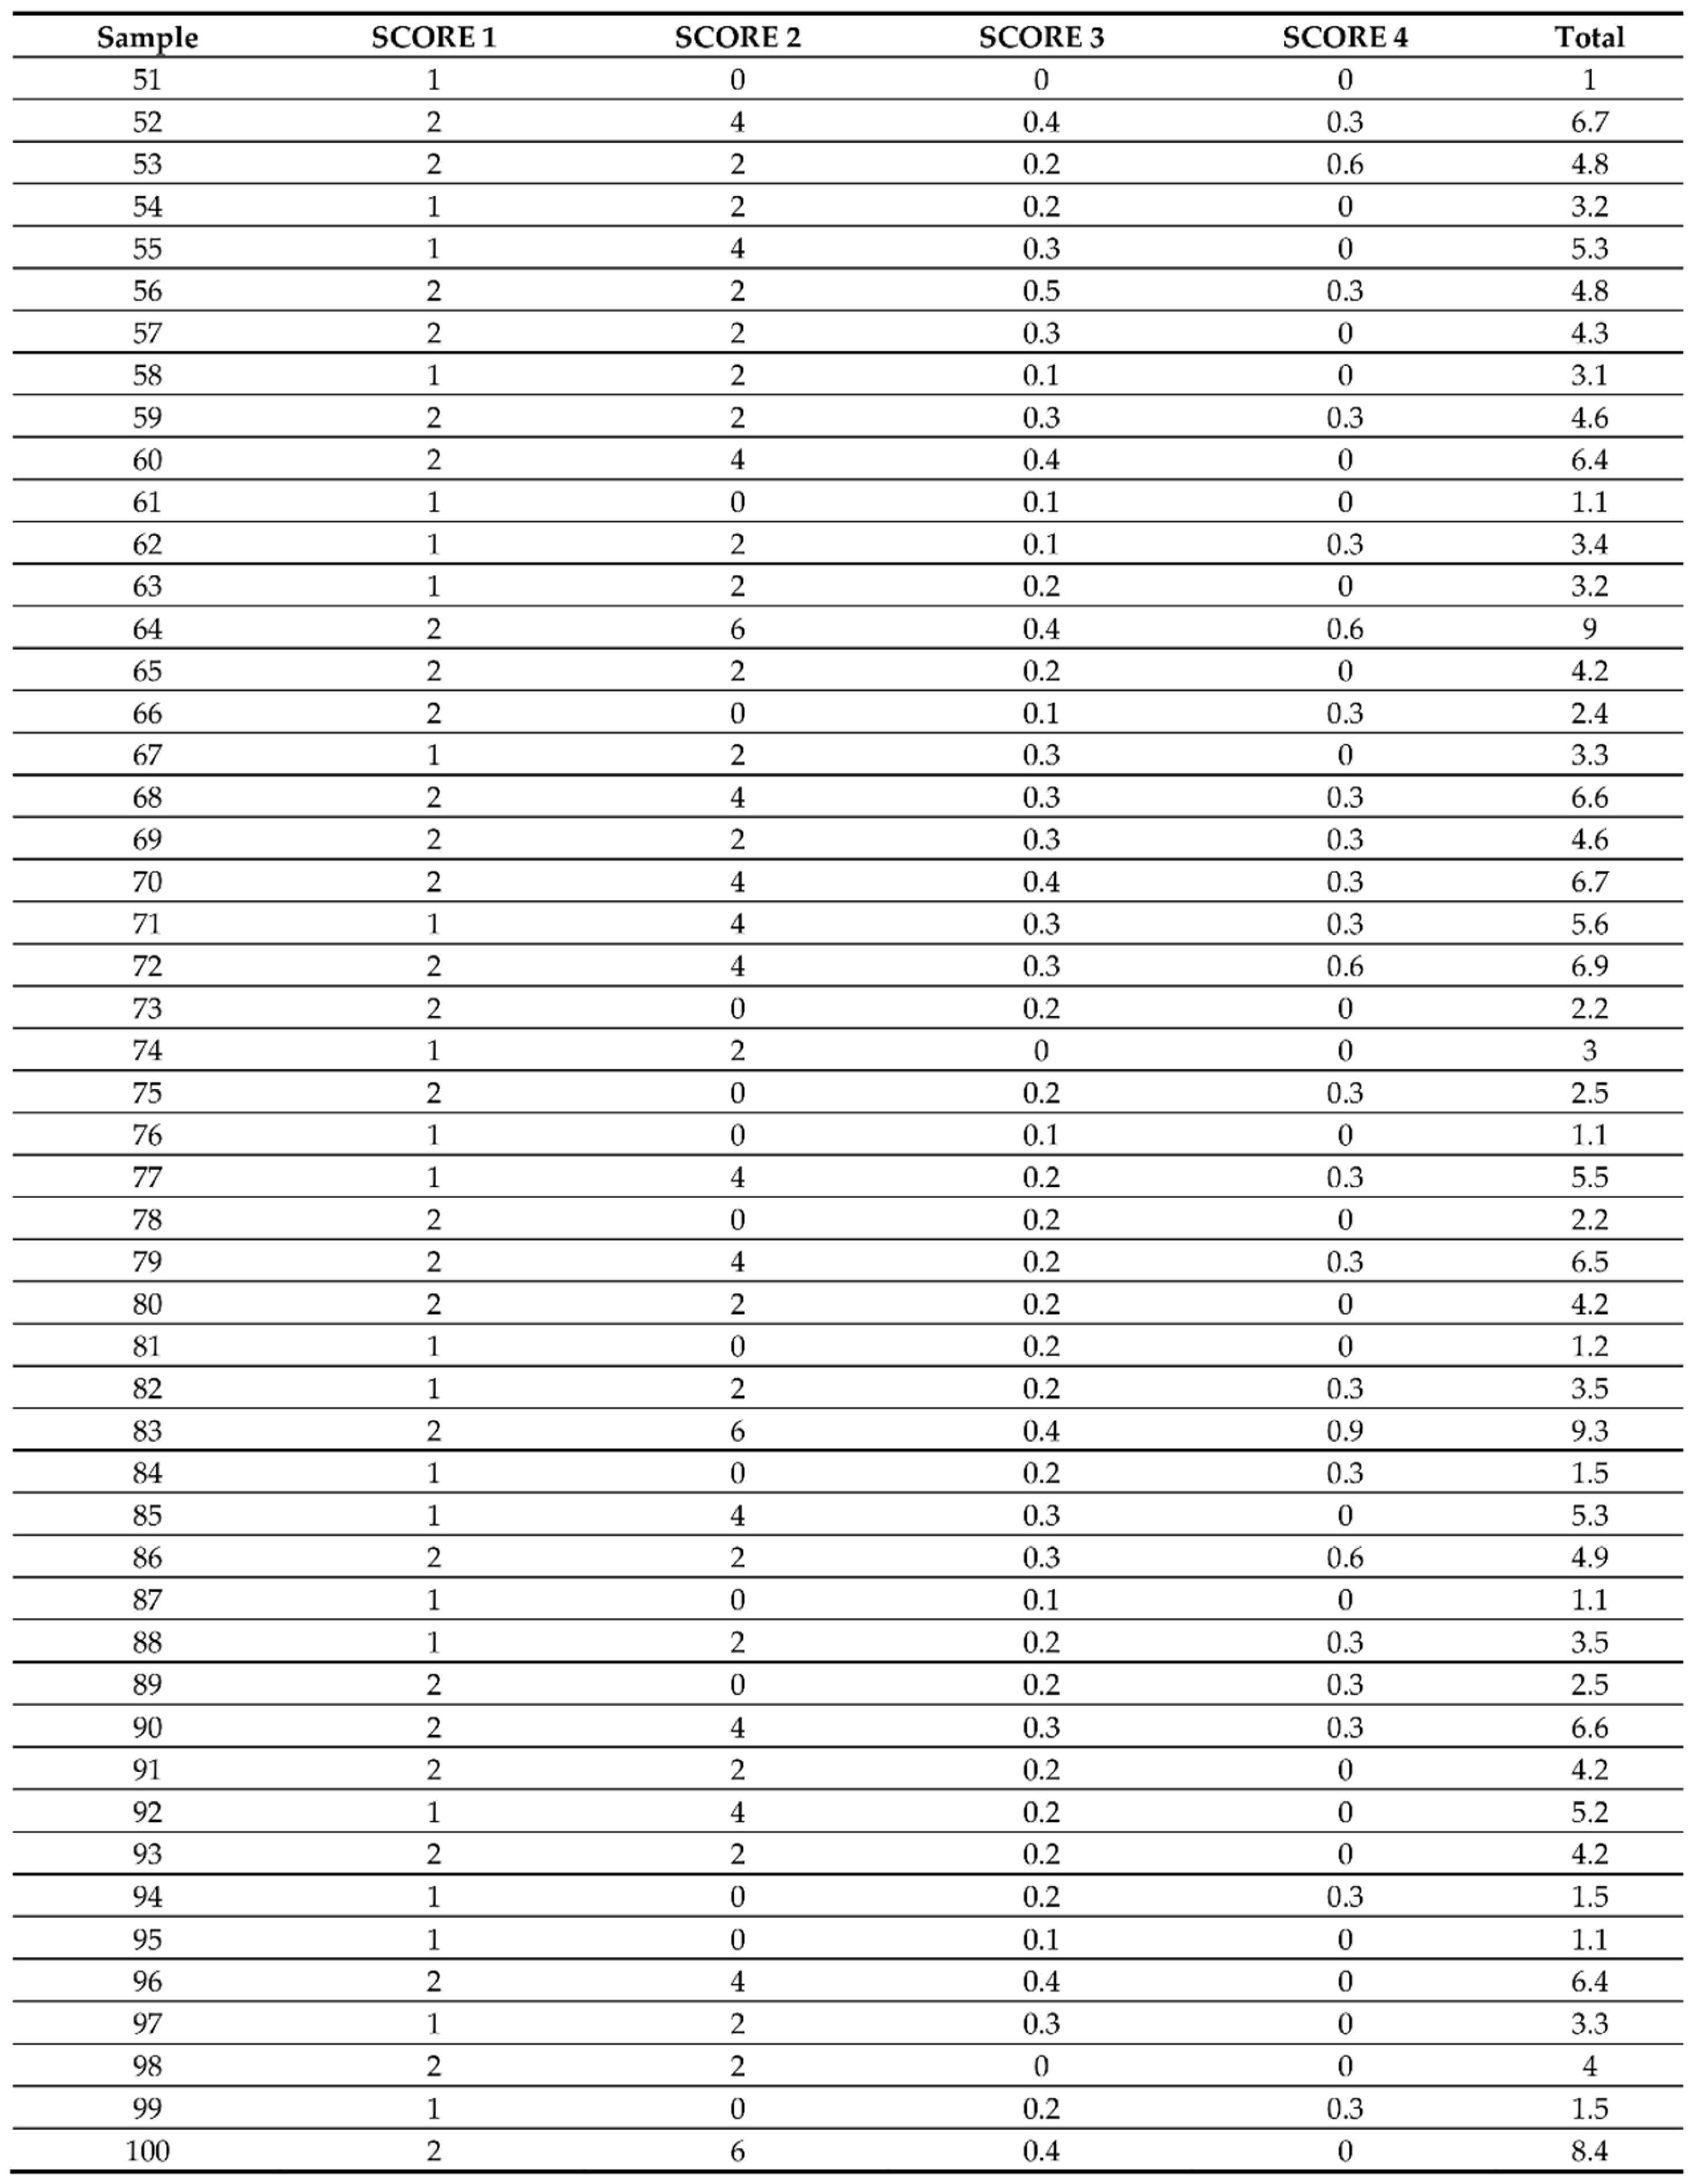
This novel performance measure is introduced as a Total Score which integrates four sub-scores concerned with the following four major aspects in identifying disease outbreak areas.
  • Score 1: Ability to detect smaller areas of outbreak
As stated in Section 3.1, the data are simulated assuming that outbreak occurred in the five zip codes of Williamsburg, Roosevelt Island, Bulls Head, La Guardia and West Farms of the five major boroughs Brooklyn (A), Manhattan (B), Staten Island (C), Queens (D) and the Bronx (E), respectively. Among these five major boroughs, Manhattan (B) and the Bronx (E) are relatively small areas. In the occurrence of an outbreak in a zip code, it is highly likely that the disease spreads quickly across smaller areas and that cases are reported from several parts of that area. Thus, such a small area can be quickly detected when assessing the number of incidents.
Therefore, if a scan statistic can identify at least one zip code belonging to either B or E areas, Score 1 is equal to 1, whereas if it was able to identify at least one zip code belonging to both areas B and E, Score 1 is equal to 2. Hence, Score 1 can take values 0, 1 or 2.
  • Score 2: Ability to detect larger areas of outbreak
As opposed to the circumstances in Score 1, Score 2 is used to assess the ability of scan statistics to detect larger areas given that outbreak occurred in a particular zip code. Unlike the above scenario, when an outbreak occurs in a zip code of a larger area, it is unlikely to spread to the entire region and that cases are reported from the entire region. Thus, large areas such as A, C and D will not be quickly identifiable. Therefore, if a scan statistic can identify at least one zip code belonging to either A, C or D, Score 2 is equal to 2. Thus, Score 2 can take the values 0, 2, 4 or 6.
  • Score 3: Ability to detect neighborhoods of the outbreak location
Irrespective of the area of the outbreak zip code being small or large, if a scan statistic can identify surrounding zip codes of the outbreak zip code, it should be rewarded. Identification of the surrounding zip codes of the exact outbreak zip codes helps to narrow down the region in which health officials should take action. Thus, Score 3 is defined to assess the ability of scan statistics in detecting adjacent zip codes of the exact outbreak zip code. Accordingly, the standard adjacent zip codes of each outbreak zip code were identified, and if a scan statistic can identify at least one adjacent zip code of an outbreak zip code, Score 3 is equal to 0.1. Since there are five outbreak zip codes, score 3 can take the values 0, 0.1, 0.2, 0.3, 0.4 or 0.5.
  • Score 4: Ability to detect the exact location of outbreak
Score 4 serves to assess the ability of the scan statistic to detect the exact zip codes in which the outbreak occurred. If a scan statistic can identify the exact zip code in one of its significant clusters, it should be given extra points. Accordingly, for the identification of each exact zip code 0.3 marks are given. Hence, Score 4 can take the values 0, 0.3, 0.6, 0.9, 1.2 or 1.5.
The total score can be used to assess the overall performance of the scan statistics in detecting disease outbreak areas, which is an aggregation of the four above-mentioned sub-scores. Accordingly, the total score can take any value between 0 and 10. In the presence of a single data sample, the total score obtained for each technique can be compared. Accordingly, the higher the total score, the better the performance of the scan statistic. In the presence of many samples, the determined total score is compared based on the coefficient of variation of the samples, and thus, the lower the coefficient of variation, the better the performance of the scan statistic.
According to the results (Appendix B), both the Space Time Scan Statistic and the Space Time Permutation Scan Statistic perform better in identifying outbreaks in narrow areas than in wider areas. The Space Time Permutation Scan Statistic performs well in detecting the surrounding areas of exact outbreak zip codes, while the Space Time Scan Statistic performs well in identifying exact outbreak zip codes. The experimental results of Section 3.1 reveal that the novel Spatiotemporal MW Scan Statistic performs significantly well in detecting the area of disease outbreak in a larger geographical region. Moreover, it can effectively detect the exact disease outbreak zip code in the majority of cases. Even if the exact outbreak zip code was not detected in the most likely cluster, it was detected in one of the secondary clusters by this scan statistic.

4. Discussion and Conclusions

We specifically focused on improving the existing MW Scan Statistic, incorporating the time component and using it to detect disease outbreak areas. Following the suggestion in [5], the Spatiotemporal MW Scan Statistic was improved in this study by using the spatiotemporal distance defined in [11]. The performance of this improved scan statistic was then evaluated.
Based on the obtained results, the Spatiotemporal MW Scan Statistic performs significantly well in detecting the area of disease outbreak in a larger geographical region. Moreover, it can effectively detect the exact disease outbreak area in the majority of cases. Even if the exact outbreak area was not detected in the most likely cluster, it was detected in one of the secondary clusters by this scan statistic.
It is important to acknowledge several limitations of the current study, which restrict the generality of the conclusions that can be drawn from these experiments. Only a limited number of samples were evaluated in assessing the performance of the newly developed Spatiotemporal MW Scan Statistic due to higher computational time (approx. 10 h/sample). Moreover, the issue of the ties in ranking the response variable in calculating the Spatiotemporal MW Scan Statistic might cause distortions of the results. Furthermore, no population adjustments were considered in calculating the Spatiotemporal MW Scan Statistic. Due to the unavailability of a common measure which can be used to evaluate the performance of both parametric and non-parametric scan statistics, we applied only a basic performance measure. A more appropriate probabilistic performance measure will be developed to conduct future experiments.
The improvement of the Spatiotemporal MW Scan Statistic will be a promising alternative in the field of scan statistics as it can be applied to different scenarios without making any assumptions of the distribution of the response variable and can still detect significant spatiotemporal clusters. Even though the response variable of the applications used in this study is a count variable, this improved scan statistic can be applied to continuous data with the same framework provided. We aimed to identify the most likely clusters (MLCs) over a specific time period. Thus, based on the results, the identified clusters are the disease hotspots over the whole time period. This work can be further improved by the consideration of clusters across variable time frames and by incorporating population adjustments which will enable the detection of multiple outbreaks simultaneously, along with their precise time characteristics.

Author Contributions

Conceptualization, C.D.T. and K.H.H.; Data curation, K.H.H.; Formal analysis, K.H.H.; Investigation, K.H.H.; Methodology, K.H.H. and C.D.T.; Project administration, C.D.T.; Software, K.H.H.; Supervision, C.D.T.; Validation, K.H.H.; Visualization, K.H.H.; Writing—original draft, K.H.H.; Writing—review & editing, C.D.T. All authors have read and agreed to the published version of the manuscript.

Funding

This research received no external funding.

Informed Consent Statement

Not applicable.

Data Availability Statement

Publicly available datasets were analyzed in this study. These data can be found at http://www.satscan.org/datasets (accessed on 25 December 2021) (Simulated Datasets) and https://github.com/CSSEGISandData/COVID-19 (accessed on 25 December 2021) (COVID-19 Data).

Acknowledgments

The authors thank Lionel Cucala (University of Montpellier) for providing the basic R programs of the Mann-Whitney Scan Statistic along with his insights and expertise that greatly assisted and improved the research.

Conflicts of Interest

The authors declare no conflict of interest.

Appendix A

Applsci 12 10513 i001Applsci 12 10513 i002Applsci 12 10513 i003Applsci 12 10513 i004Applsci 12 10513 i005Applsci 12 10513 i006Applsci 12 10513 i007

Appendix B

Figure A1. Space Time Scan Statistics results summary (first 50 samples).
Applsci 12 10513 g0a1
Figure A2. Space Time Scan Statistics results summary (last 50 samples).
Applsci 12 10513 g0a2
Figure A3. Space Time Permutation Scan Statistic results summary (first 50 samples).
Applsci 12 10513 g0a3
Figure A4. Space Time Permutation Scan Statistic results summary (last 50 samples).
Applsci 12 10513 g0a4
Figure A5. Average score comparison.
Applsci 12 10513 g0a5

References

  1. Kulldorff, M.; Athas, W.F.; Feurer, E.J.; Miller, B.A.; Key, C.R. Evaluating cluster alarms: A space-time scan statistic and brain cancer in Los Alamos, New Mexico. Am. J. Public Health 1998, 88, 1377–1380. [Google Scholar] [CrossRef] [PubMed] [Green Version]
  2. Kulldorff, M.; Heffernan, R.; Hartman, J.; Assunção, R.; Mostashari, F. A space–Time permutation scan statistic for disease outbreak detection. PLoS Med. 2005, 2, e59. [Google Scholar] [CrossRef] [Green Version]
  3. Kulldorff, M.; Mostashari, F.; Duczmal, L.; Katherine Yih, W.; Kleinman, K.; Platt, R. Multivariate scan statistics for disease surveillance. Stat. Med. 2007, 26, 1824–1833. [Google Scholar] [CrossRef] [PubMed] [Green Version]
  4. Kulldorff, M. Prospective time periodic geographical disease surveillance using a scan statistic. J. R. Stat. Soc. Ser. A 2001, 164, 61–72. [Google Scholar] [CrossRef]
  5. Cucala, L. A Mann-Whitney scan statistic for continuous data. Commun. Stat. Theory Methods 2016, 45, 321–329. [Google Scholar] [CrossRef]
  6. Mann, H.B.; Whitney, D.R. On a test of whether one of two random variables is stochastically larger than the other. Ann. Math. Stat. 1947, 18, 50–60. [Google Scholar] [CrossRef]
  7. Cucala, L. A Hypothesis-Free Multiple Scan Statistic with Variable Window. Biom. J. 2008, 50, 299–310. [Google Scholar] [CrossRef] [PubMed]
  8. Cucala, L. A distribution-free spatial scan statistic for marked point processes. Spat. Stat. 2014, 10, 117–125. [Google Scholar] [CrossRef]
  9. Kulldorff, M. A spatial scan statistic. Commun. Stat. Theory Methods 1997, 26, 1481–1496. [Google Scholar] [CrossRef]
  10. Zhang, Z.; Assunção, R.; Kulldorff, M. Spatial scan statistics adjusted for multiple clusters. J. Probab. Stat. 2010, 2010, 642379. [Google Scholar] [CrossRef]
  11. Cucala, L.; Genin, M.; Occelli, F.; Soula, J. A multivariate nonparametric scan statistic for spatial data. Spat. Stat. 2019, 29, 1–14. [Google Scholar] [CrossRef]
  12. Jung, I.; Cho, H.J. A nonparametric spatial scan statistic for continuous data. Int. J. Health Geogr. 2015, 14, 30. [Google Scholar] [CrossRef] [PubMed] [Green Version]
  13. Demattei, C.; Cucala, L. Multiple Spatio-Temporal Cluster Detection for Case Event Data: An Ordering-Based Approach. Commun. Stat.-Theory Methods 2011, 40, 358–372. [Google Scholar] [CrossRef]
  14. Kulldorff, M.; Zhang, Z.; Hartman, J.; Heffernan, R.; Huang, L.; Mostashari, F. Benchmark data and power calculations for evaluating disease outbreak detection methods. MMWR Suppl. 2004, 53, 53–144. [Google Scholar] [CrossRef]
Figure 1. Spatiotemporal plot of COVID-19 cases in China.
Applsci 12 10513 g001
Figure 2. Spatial plot of average number of cases.
Applsci 12 10513 g002
Table 1. Spatial averages of COVID-19 cases.
RegionAverage Number of Cases
Tibet0.007633588
Qinghai0.13740458
Macau0.34351145
Ningxia0.572519084
Xinjiang0.580152672
Gansu1.061068702
Guizhou1.13740458
Liaoning1.13740458
Jilin1.183206107
Hainan1.290076336
Yunnan1.41221374
Tianjin1.465648855
Shanxi1.511450382
Inner Mongolia1.79389313
Guangxi1.938931298
Shaanxi2.351145038
Hebei2.503816794
Fujian2.732824427
Sichuan4.389312977
Chongqing4.419847328
Beijing4.526717557
Jiangsu4.984732824
Shanghai5.129770992
Shandong6.045801527
Jiangxi7.152671756
Heilongjiang7.213740458
Anhui7.564885496
Hunan7.778625954
Hong Kong8.27480916
Zhejiang9.679389313
Henan9.740458015
Guangdong12.17557252
Hubei520.1145038
Publisher’s Note: MDPI stays neutral with regard to jurisdictional claims in published maps and institutional affiliations.

