Article

Documenting Archaeological Petroglyph Sites with the Use of 3D Terrestrial Laser Scanners—A Case Study of Petroglyphs in Kyrgyzstan

1
Department of Computer Science, Lublin University of Technology, ul. Nadbystrzycka 36B, 20-618 Lublin, Poland
2
Computer Science Department, Kyrgyz State Technical University Named after I. Razzakov, Prospekt Mira, 66, Bishkek 720044, Kyrgyzstan
*
Author to whom correspondence should be addressed.
Appl. Sci. 2022, 12(20), 10521; https://doi.org/10.3390/app122010521
Submission received: 30 September 2022 / Revised: 11 October 2022 / Accepted: 16 October 2022 / Published: 18 October 2022

Abstract

:
The use of 3D terrestrial laser scanners (TLS) in the documentation of archaeological sites is an effective method of collecting information about the area under study. The wide range of acquired data makes this method a versatile tool, and not limited only to documentation tasks. This article presents the possibilities of 3D TLS and their postprocessing software in the pioneering work related to the digitization of exhibits in The Petroglyphs of Cholpon-Ata Open-air Museum near Lake Issyk-Kul in Kyrgyzstan. A 3DScaMITE methodology adapted for that task is highlighted. The data obtained during the scanning were used to build high-accuracy 3D digital petroglyph models, together with their location within the open-air museum area. The acquired models also allowed a detailed analysis of the geometric parameters of the cavities forming the petroglyph figures. The results of the analysis confirmed the thesis about improper preservation of petroglyphs. It has been demonstrated in this way that the used TLS method is completely universal in documenting petroglyphs, including the location and shape of their place of creation, as well as creating a sufficiently accurate analysis of the structure of drawings.

1. Introduction

Petroglyphs, the rock drawings carved by representatives of different cultures throughout human history, are usually the work of people of the era before the creation of alphabets and inscriptions. They are a pre-literary form of presenting stories and ideas, in use from around the 10th millennium BC to almost modern times. Petroglyphs are found on all continents of the world except Antarctica, the continent considered uninhabited by humans. These drawings are perhaps the oldest evidence of human civilization and intelligence. Their exploration, documentation, and preservation for future generations is a very important element of protecting the cultural heritage (CH) of mankind.
Petroglyphs, as human rock art, occur mostly in currently little-known and not very frequented places, i.e., caves, mountain gorges, sea cliffs, rocks in desolate places, etc. Such places are usually not protected, and the nature of petroglyphs—rock drawings, does not allow them to be moved to safer places without irreversible damage to their surroundings. Petroglyphs are therefore exposed to various threats, leading to their loss for humanity, and also as a result of human activities.
The theft of rocks with petroglyphs occurs in practically all countries on all continents. For example, in California, USA, petroglyphs [1] made by the local Paiute tribe and held sacred by them, were stolen by cutting the stones they were carved on (Figure 1). A similar case took place in Nevada, USA [2] and Tasmania [3]. There are also reports of petroglyphs being treated as souvenirs by tourists [4]. In addition to stealing, acts of sheer vandalism against petroglyphs are noted. For example, vandals have irrevocably damaged petroglyphs in Arizona, USA [5] and Kyrgyzstan [6]. These are just examples of the destruction of petroglyphs, and there are more such cases all over the world.
Unfortunately, there are also errors of petroglyph conservators [7], leading to the partial destruction of monuments during restoration works. This leads to the need to remove incorrectly selected protective layers, which is not always possible, and always carries the risk of further damage to the monument. A description of the method of removing aged acrylic coatings (also used for the maintenance of petroglyphs) from wall paintings with the use of microemulsions, can be found in [8].
Such cases occur all over the world, and therefore urgent and permanent documentation of petroglyphs that have survived to this day should be a priority. This is made possible by the digital technology which consists of 3D scanning of their geometry, appearance and position. The ever more popular and affordable tool that could be used for this are 3D terrestrial laser scanners (TLS).
The purpose of this work includes:
I.
Adaptation of the 3DScaMITE [9] methodology, developed for scanning cultural heritage objects with 3D TLS, to the scanning of petroglyphs in the places of their occurrence.
II.
Verification of the proposed adaptation during the scanning of petroglyphs at The Petroglyphs of Cholpon-Ata Museum in Kyrgyzstan.
III.
Verification of the usefulness of the obtained data to confirm or reject the thesis about improper conservation of petroglyphs.
The remaining part of the paper is organised as follows:
  • Section 2 provides an overview of publications on documenting rock art and the methods of its protection;
  • Section 3 discusses the main aspects of 3D TLS scanning, and presents modifications to the 3DScaMITE methodology for petroglyph scanning tasks;
  • Section 4 discusses the effects of scanning petroglyphs at Cholpon-Ata and discusses the results in terms of confirming the thesis about the improper conservation of petroglyphs.

2. Rock Art Documentation

The issue of protection of various types of historical and cultural properties, apart from defensive ones, including sacred and secular structures and such objects as petroglyphs, inscriptions or stone monuments, has been taken up by state and local authorities in all corners of the world: Asia (Mongolia [10], Russia [11], United Arab Emirates [12]), Africa [13], North America [14], South America (Brazil [15], Peru [16]), Australia [17,18] and Europe (Spain [19,20,21,22,23], Sweden [24,25,26], Italy [27,28], UK [29] and France [30]). For example, according to the inventory conducted in Mongolia [10], petroglyphs and other rock art constitute 14% (i.e., 3261 artefacts) of the monuments in this country. Research on rock art (petroglyphs) is carried out primarily by domestic researchers working in “their backyard”, although there are instances of highly advanced international collaborations [12], for example a three-year project led by Departamento de Ingeniería Topográfica y Cartografía of the Universidad Politécnica de Madrid (Spain) in the Emirate of Sharjah, United Arab Emirates.
The activities carried out currently take three main directions, apparently not always interconnected: cultural research, research on data acquisition methods, and protection and sharing. The basic direction of research is the analysis of petroglyphs in terms of culture, e.g., the assessment of zoomorphic and pragmamorphic artefacts in the context of the existence of certain rhetorical figures—assigning the properties of animals and objects to humans [24], or in the aspect of interpreting rock narratives in the context of the theory of migration and diffusion of ideas, along with using ethnographic and folklore materials [11]. The problem of dating rock sites has not yet been solved in numerical terms. It is easier to build a reliable chronological framework that takes into account aspects such as group mobility or emerging cultural networks [23].
In recent years, many studies have presented a description of various modern technologies for data acquisition in conducted research. In works [24,29] various technologies used to document petroglyphs are traced, from the oldest, often called traditional ones, which are now less and less used, such as frottage, tracing and drawing. All these technologies maintain fairly precise dimensions of the rock drawings, although they have many disadvantages: they poorly reflect spatial surfaces, are very time-consuming, are not suitable in cold and humid climates, and largely depend on the experience of the person carrying out the work. There is no reference to dimensions in the methods based on single photos obtained with conventional or digital photography, taken without placing additional markers or rulers on the objects. In the last two decades, many new digital technologies have been introduced in the acquisition of rock drawings: reflectance transformation imaging (RTI) [19,20], structure from motion (SfM) [24,31], photogrammetric measurements [21,22,28], optical laser scanning (OLS) [24,32], terrestrial laser scanning (TLS) [15,27,31], photogrammetric measurements combined with aerial recordings [12,16] using an unmanned aerial vehicle (UAV) or combining tachymeter-based tracking of the scanner, stereo and SfM [27]. RTI technology consists in taking approximately 60 photos of the object with a camera placed on a tripod, with changing light directions (evenly distributed on the hemisphere), which, after processing the collected data, leads to the collection of information about the value of the 2.5D model [19]. Other technologies, by using specialised software, allow for the more or less simple building of 3D models of petroglyphs, which significantly facilitates their storage and sharing. Article [22] is noteworthy, as it presents a detailed methodology describing all the stages of creating 3D petroglyph models using photogrammetry. Paper [14] is a methodological study on the advantages/disadvantages of using long-range laser scanning and high-resolution digital photography for petroglyph recording, and in [18] the method of combining spectral information from cave wall scanning by means of geodetic measurements is presented, with petroglyphs from digital elevation mode (DEM). Having a very large collection of rock art allows one to conduct research aimed at using artificial intelligence by building a neural network for the automation of identification and classification of rock art images [26].
The issue of protecting petroglyphs and making them available to local and international communities appears more and more widely in the scientific literature. In [13] the authors pay attention to the fact of adapting the used petroglyph digitisation methods to the economic potential of the country, while in [22] low-cost solutions for the preparation of 3D models of petroglyphs are presented. The need to create online platforms to integrate geo-referenced information with generated 3D petroglyph models for the purpose of more effective analysis and data availability, which facilitates further scientific research, can be found in [12,28]. Aspects of the usefulness of digital technologies (photogrammetry and TLS) for creating 3D models to protect rock art objects against their loss due to the deterioration of their condition, because of the variability of weather conditions and possible disasters (natural—earthquakes, international—military actions, or social—theft, devastation), can be found in [18,30,33]. Attention is also paid to the social responsibility of professional communities dealing with 3D digitisation of petroglyphs and other cultural monuments for promoting these techniques, so that their beauty can be recognised and examined by others in the future [18]. Paper [17] analyses the advantages and disadvantages of laser scanning, photogrammetry and photographic reconstruction in capturing and managing knowledge of rock art sites, with particular emphasis on practical applications in the field of cultural heritage management, with the example of West Angelas, in the East Pilbara region of Western Australia.

3. Contemporary 3D TLS and the Methodology of Their Use for Documenting Archaeological Artefacts

When performing 3D scanning and documentation of archaeological artefacts, two aspects that have a significant impact on obtaining the intended results can be distinguished: the selection of the appropriate equipment, and the use of an appropriate scanning methodology. In the case of scanning petroglyphs, the use of laser technologies allows for the scanning of the artefact with its natural surroundings, during one scanning session consisting of many (3–5) scans.

3.1. TLS Scanners

Contemporary 3D terrestrial laser scanners are universal and fully automatic measuring devices. They differ in their purpose and range of scanning. The general principle of operation of these devices is based on the measurement of the distance from the device to the object, on the basis of the analysis of the reflection of the laser beam from the surface of the object. Most devices use a near infrared laser. The maximum TLS scanning range can be divided into short-range—up to 70/150 m (e.g., Surphaser 100HSX, FARO Focus S70), medium-range—up to 350 m (e.g., Trimble TX8, FARO Focus S350, Leica RTC360), and long-range, where the range is measured in kilometres (e.g., Teledyne Optech Polaris, Riegl VZ-6000).
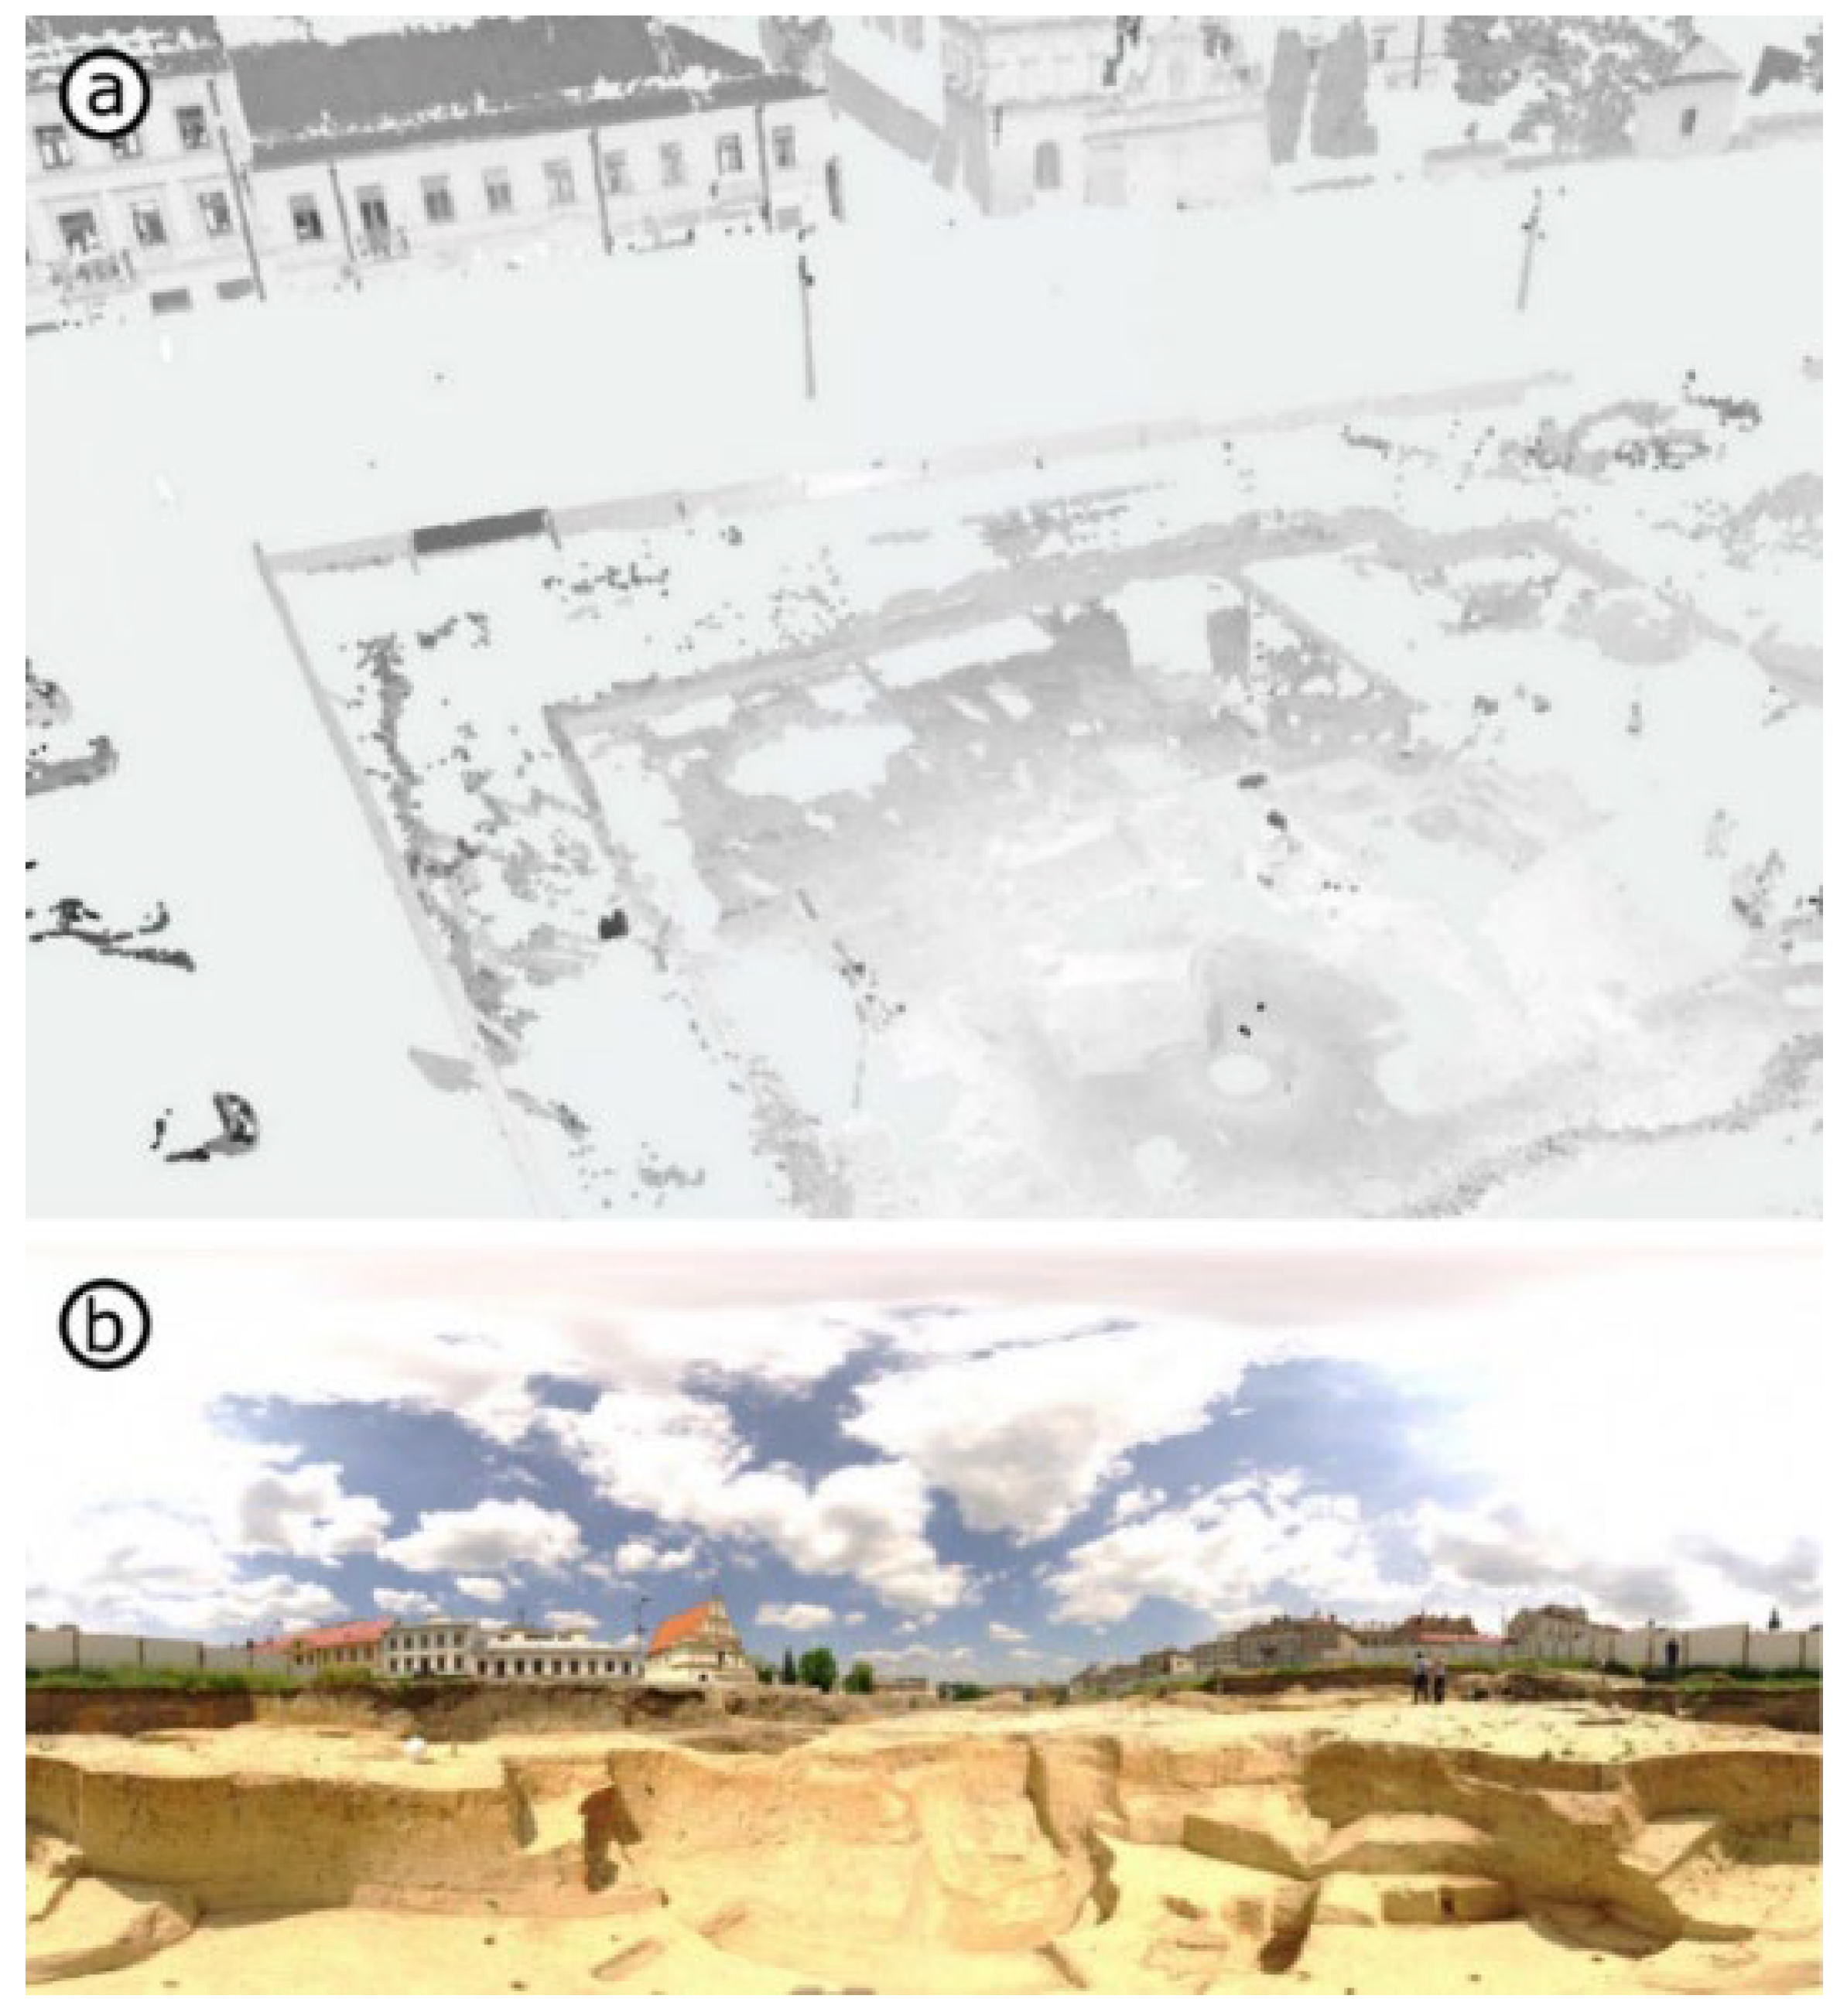
The basic data obtained is a cloud of 3D points of the places where the laser reflects from the objects around the scanner, recorded in the coordinate system relative to the position of the scanner. In addition to the coordinates of the reflection point, the scanner can measure the energy of the reflected signal, which allows for the determination of the brightness level of the surface at any given point (Figure 2a).
Laser detection alone does not allow the assigning of a colour to the detected surfaces. Most of the modern TLS devices also have the ability to take a spherical photograph of the environment (Figure 2b), on the basis of which the scan is coloured. There are three groups of solutions:
  • Use of an external camera/digital camera mounted in a special holder and synchronized with the scanner.
  • Use of a built-in spherical camera or set of cameras permanently installed in the scanner housing.
  • Use of a built-in camera using the same optical path as the laser measurement.
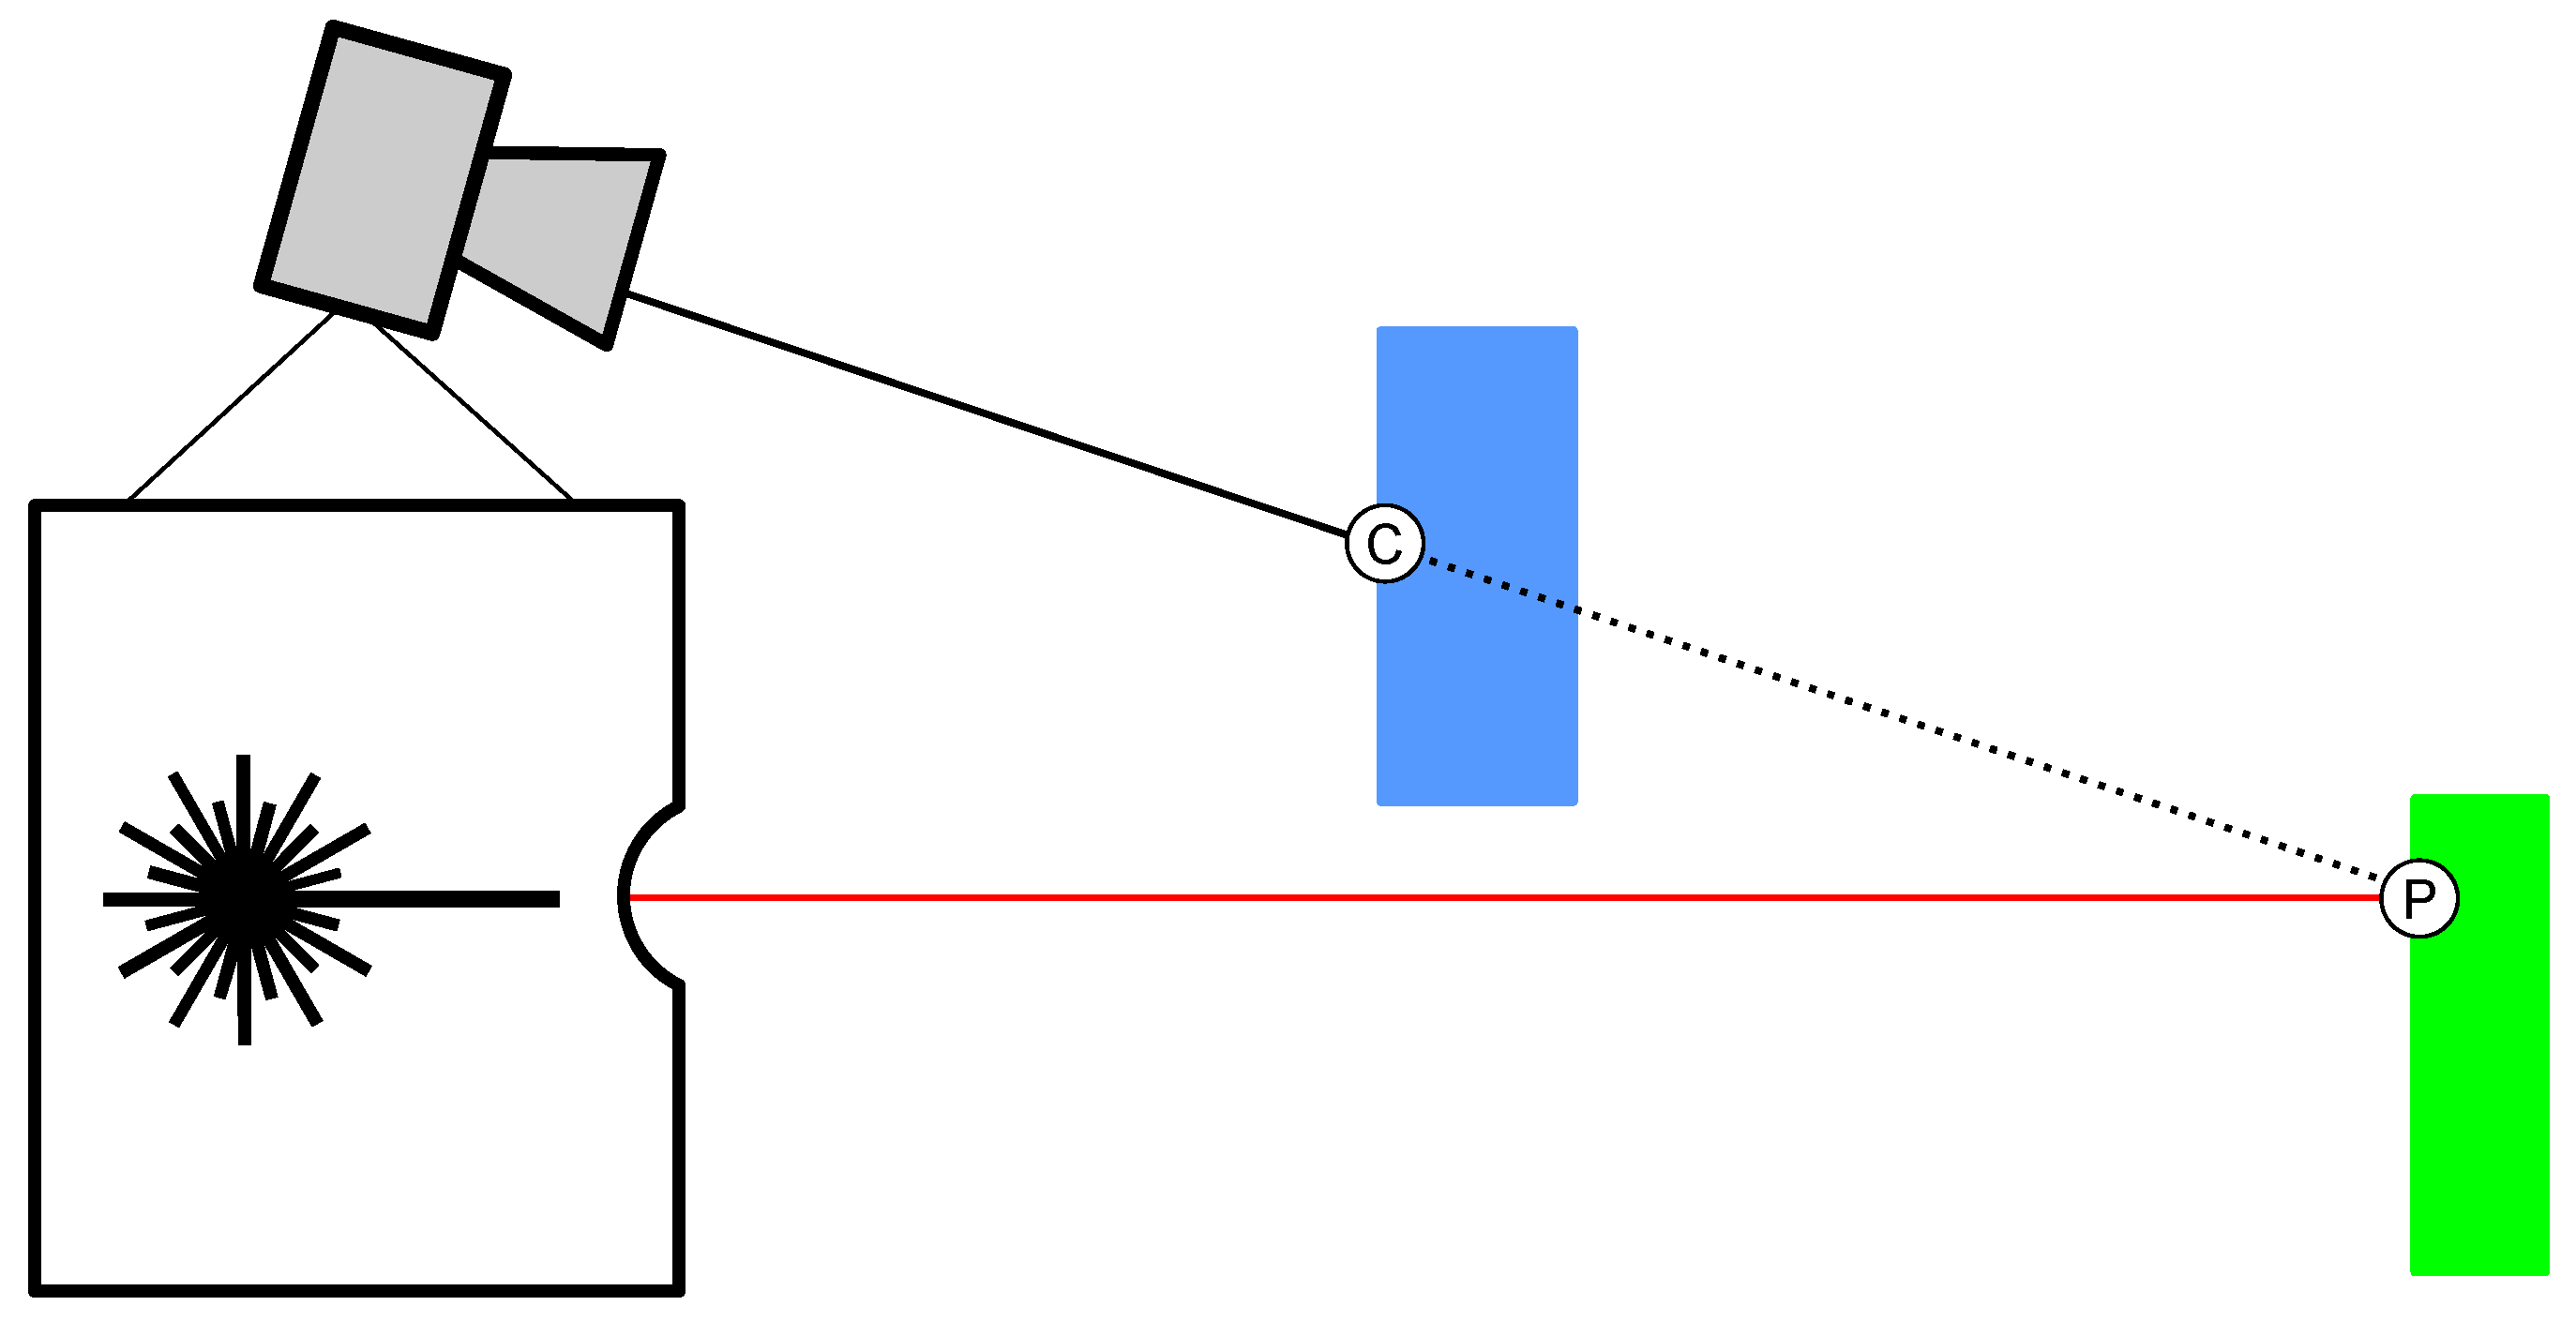
The advantage of the first method is the possibility of using a popular (reasonably priced) digital camera with parameters matching the required effect; the disadvantage is the need to calibrate the camera after changing the parameters (e.g., focal length). Solutions two and three eliminate the need for calibration, as the cameras are already factory calibrated. The disadvantage is the rigid limitation of the resolution of the obtained spherical image, resulting from the physical parameters of the built-in devices. In the case of solutions one and two, additionally, errors in the assignment of colours may occur, due to the difference in the position of the laser emission point and the focal point of the spherical image (Figure 3). These errors are most significant in close proximity to the device. Solution three eliminates this problem, due to the positioning of the camera in the axis of the laser beam emission.
The obtained coloured scan (3D point cloud with colours) is saved in coordinates relative to the position of the scanning device. In order to be able to determine the location of the scanned areas in the real world, it is necessary to obtain data on the geographical location of the scanner, along with its height above sea level, the rotation angle of the scanner’s base position in relation to the north direction, and the direction and angle of the scanner from the horizontal position. With this information, it is possible to pre-position and align multiple scans of a given area.
Depending on the model of the device, TLSs are equipped with various sensors allowing the obtaining of the above-mentioned data. Determining the geographical position of the scanner is performed with the use of the global navigation satellite system (GNSS) sensor module. Currently, the GPS, BeiDou, and Galileo networks are available worldwide. Depending on the module used by the TLS, it can pinpoint its position using one or more networks, which results in an average outdoor positioning accuracy ranging from 2 to 10 m. Actual accuracy can be diminished by signal interference.
Depending on the solution used in the device, the altitude above sea level is obtained on the basis of readings from GNSS data or by using an electronic barometer built with MEMS (MicroElectroMechanical Systems) technology. The MEMS technology also creates a magnetometer, used by the scanner as an electronic compass. The compass reading is used to pre-align the obtained scan with respect to the north direction. In order to measure the inclination (inclinometer), a MEMS accelerometer is used, which measures the changes in induction caused by the inclination of the mass in the sensor in response to changes in the position of the device in relation to the gravitational field of the earth. The tilt reading is used to level the scan.
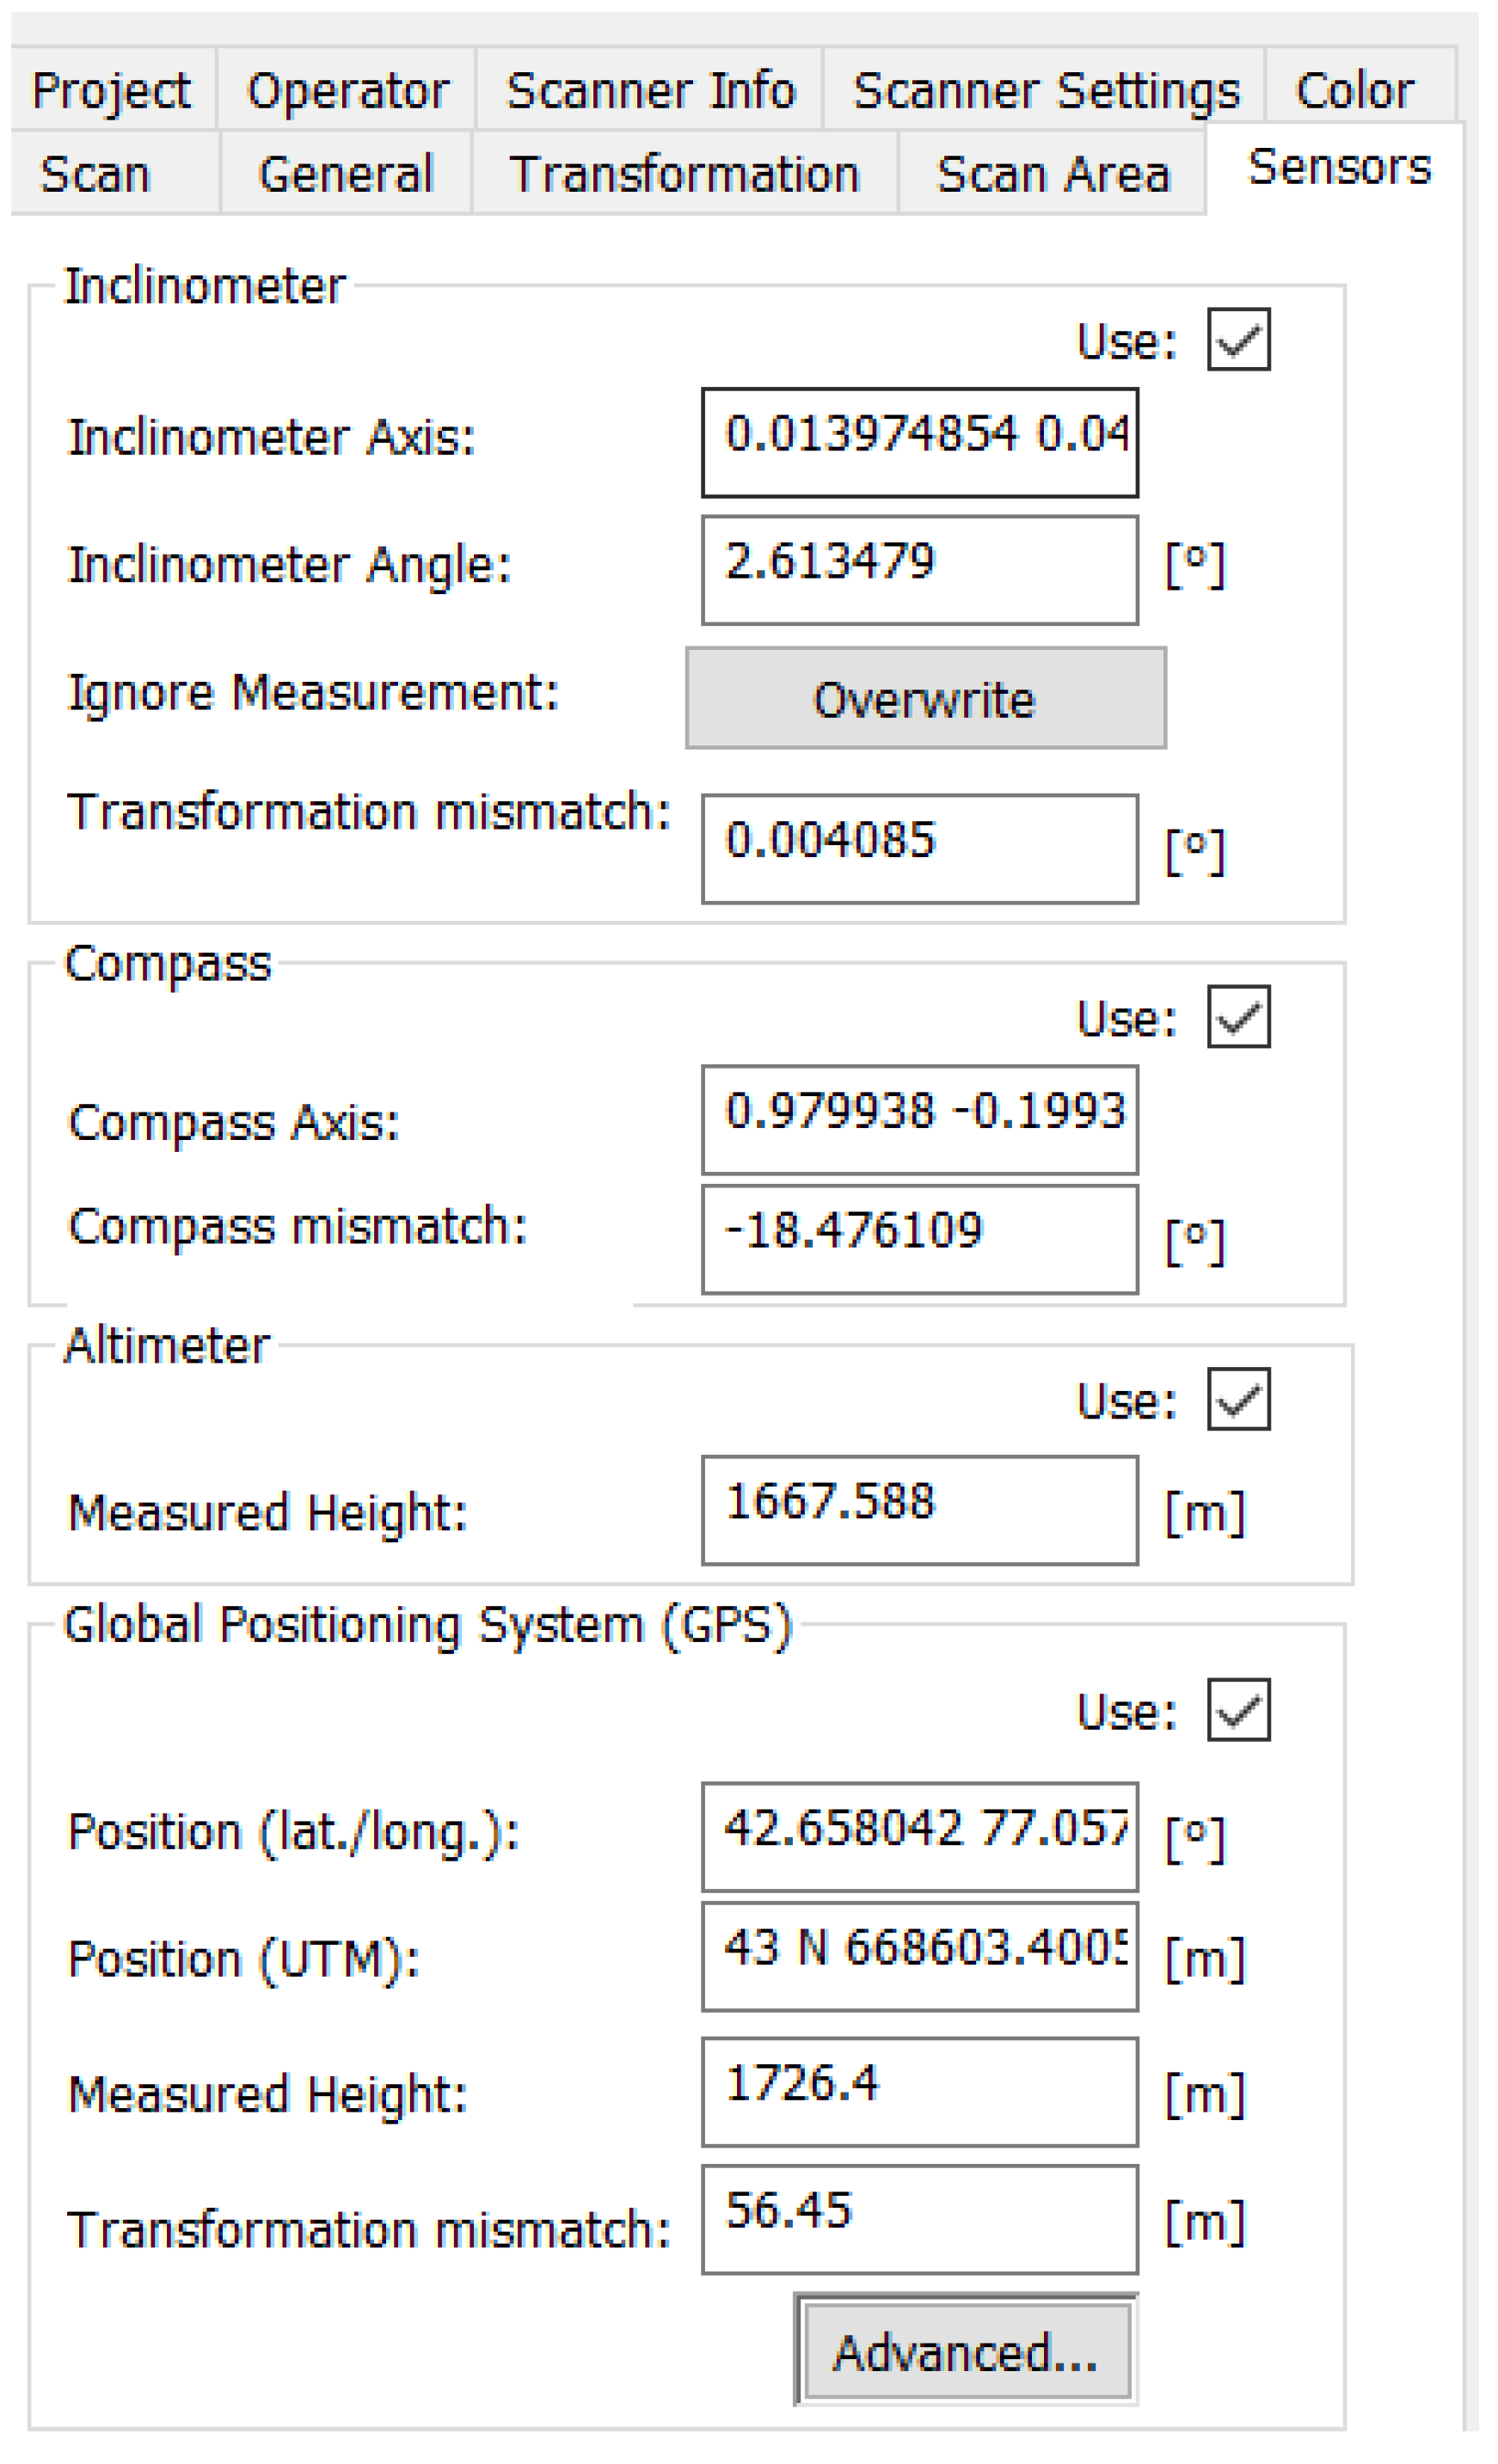
Modern TLS scanners are therefore able, during a single measurement session, to obtain clouds of object surface measurement points, data on their levelling, height above sea level, GPS position and orientation towards the sides of the world (Figure 4), as well as photographic images of high resolution and colour quality of the scanned surfaces.
Performing a series of such automated measurements in the field allows for quick and highly accurate acquisition of geometric and visual data that allow archaeological artefacts to be documented.

3.2. Scanning Methodology

When carrying out the task of scanning cultural heritage objects with the use of TLS scanners, it is necessary to follow a specific methodology. This methodology should enable the scanning work to be carried out in a way that, after processing the obtained data, would not force repetition of the actions. The 3DScaMITE methodology of scanning cultural heritage objects with TLS scanners presented by the authors in [9], distinguishes the following stages: planning, implementation, results processing and dissemination of results. The methodology modified for petroglyph scanning tasks is presented in Table 1.
The suitability of the scanner used in the research (Faro Focus X330) has been assessed based on scanner specifications. Although the scanner has a systematic error of 1 mm at 20 m (repeatable for each scanner unit), this refers to the global position of the petroglyph surface. The error of measuring petroglyph carvings depth is represented by the random measurement error (noise), which is 0.3–0.5 mm, depending on the surface reflection. This error is additionally reduced by the scanner hardwired procedure of repeating the measurement of each point multiple times (increasing the beam exposure time for each point). This, compared with the expected petroglyph carvings depth of 1–8 mm and the scanner-to-surface distance within the 1.5–5 m range, allows for the claim that the scanner used is suitable for distinguishing petroglyph carvings.

4. Petroglyphs at Cholpon-Ata, Kyrgyzstan and Their Scanning

One of the most famous stone fields with rock drawings is located above the shore of Lake Issyk-Kul (approx. 1630 m above sea level) in the village of Cholpon-Ata in Kyrgyzstan. The stone field was created by a break in a mountain lake embankment several thousand years ago, which allowed the lake waters to flood the valley. Hence, there are various types of large boulders and round logs lying there, unparalleled in the local landscape. Located there is an open-air museum called the Issyk-Kul Provincial State Historical Cultural Museum-Reserve. The museum covers a stone field with an area of 42 ha with thousands of stones with drawings dating from as early as the 2nd millennium BC to the 8th century AD [34]. The images were mainly made by the nomadic Turkic tribes called Saka and Usun. They contain zoomorphic themes: “depictions of goats and deer with ornamented bodies, camels, dogs, deer, boars, bulls, horses, wild rams, or predators: wolves; hunting scenes, juxtaposed animals, individual and paired goats, multi-figure compositions with goats in rows, geometrised goats, camel caravans, individual hunting scenes” [34]. A view of the petroglyph field open to visitors in the museum is shown in Figure 5.
Unfortunately, Kyrgyzstan has very limited resources to protect its cultural heritage. Thanks to projects sponsored from abroad, limited works related to the protection and reconstruction of monuments are carried out. This causes, among others things, a lack of permanent protection of the Issyk-Kul Provincial State Historical Cultural Museum-Reserve, and a high risk of its vandalism or destruction.
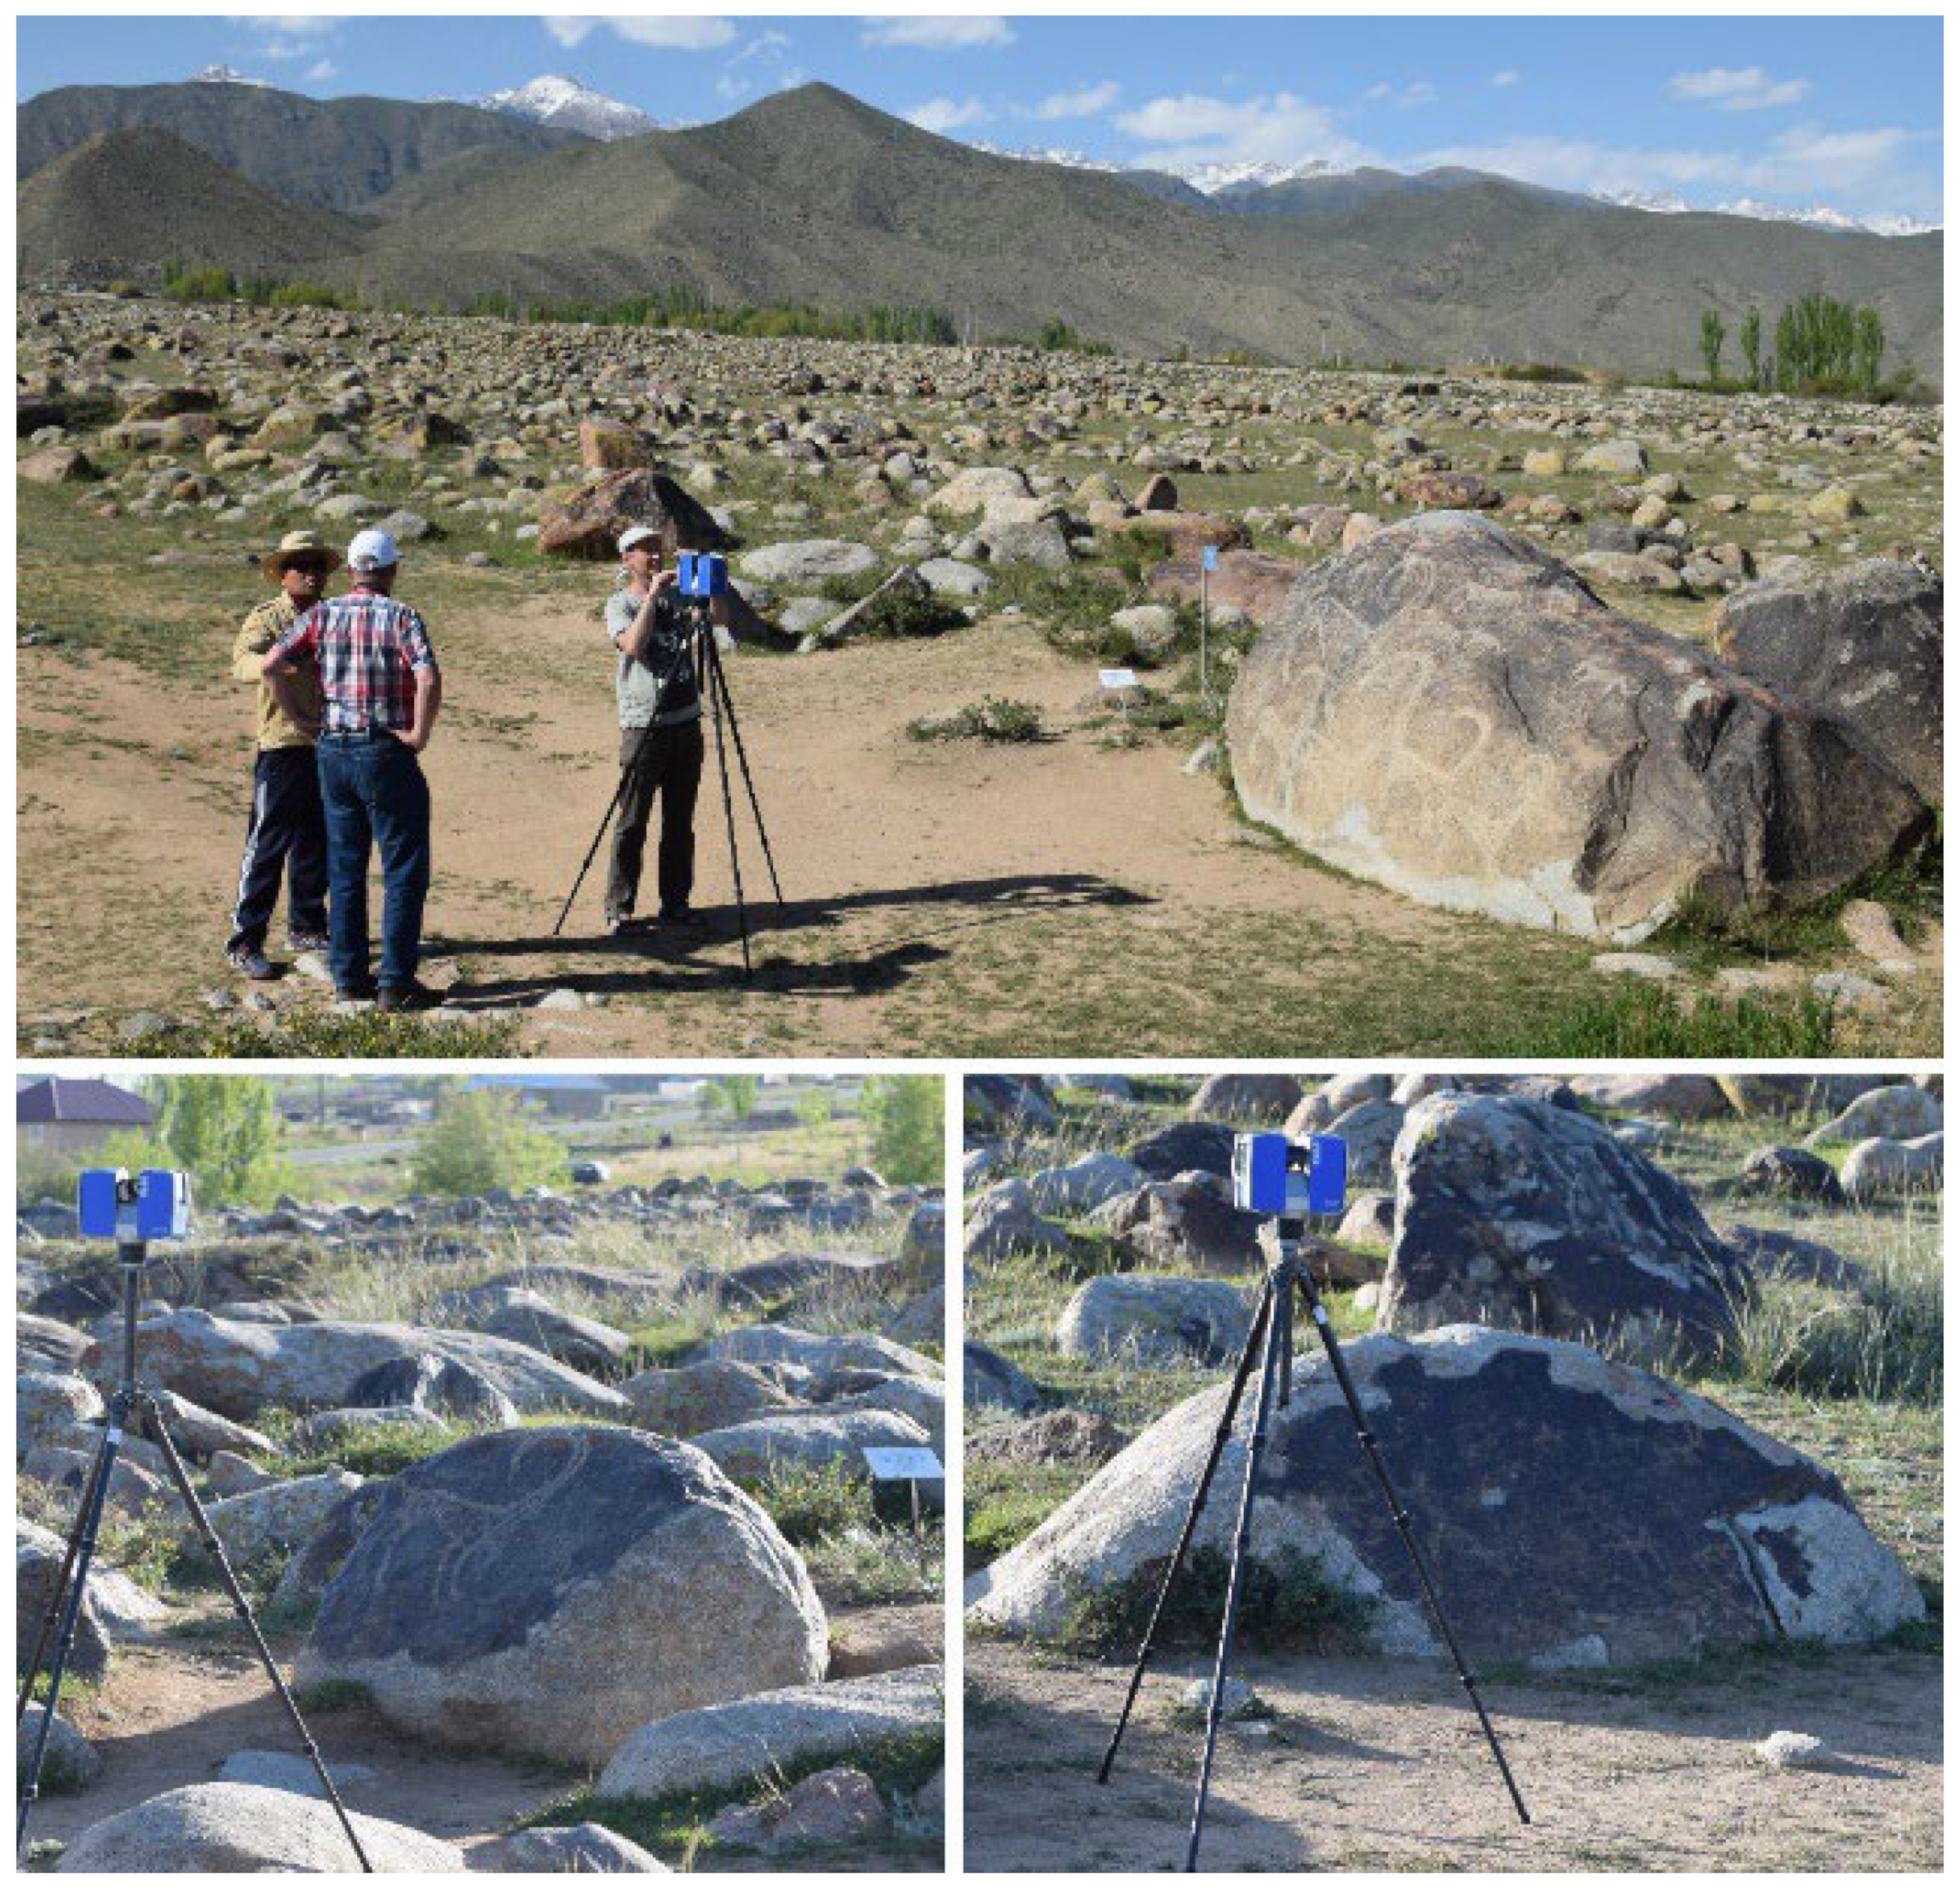
As part of the 3rd Scientific Expedition of the Lublin University of Technology to Central Asia, which took place in 2019 [35], a pilot scan of selected objects with petroglyphs in the museum was carried, out using the TLS scanner (Figure 6).
Unfortunately, the museum’s poor protection against weather conditions (high mountain climate) and tourists, causes the petroglyphs to gradually deteriorate. As mentioned by some authors, e.g., [36], a significant number of stones in petroglyphs have been lost over the last fifty years, due also to mundane activities such as building roads and houses.
In addition, in 2002 over 300 stones were restored, including 74 with the most interesting drawings. In the course of this work, without preliminary tests, the rock drawings were covered with an acrylic resin called Paraloid B72 [7]. At first it seemed that the conservation had paid off—the drawings became more visible. But in a couple of years, under the influence of the high-mountain climate (high levels of UV radiation, large temperature changes, wind, etc.), the situation deteriorated significantly. The paraloid layer became less transparent, and in many places the surface of the stones began to peel off and then fall off [7]. The depressions forming the drawings originally had clear and even edges, and a depth of 1–3 mm (and sometimes more—up to 8 mm). After conservation, they were flooded and levelled with resin. The edges have become blurry and the depth of the carvings has decreased.
Paraloid B72 has been used in many places around the world to protect monuments. Currently, there is more and more talk about its harmfulness and the need to remove aged coatings [37,38,39].

5. Scanning Results and Discussion

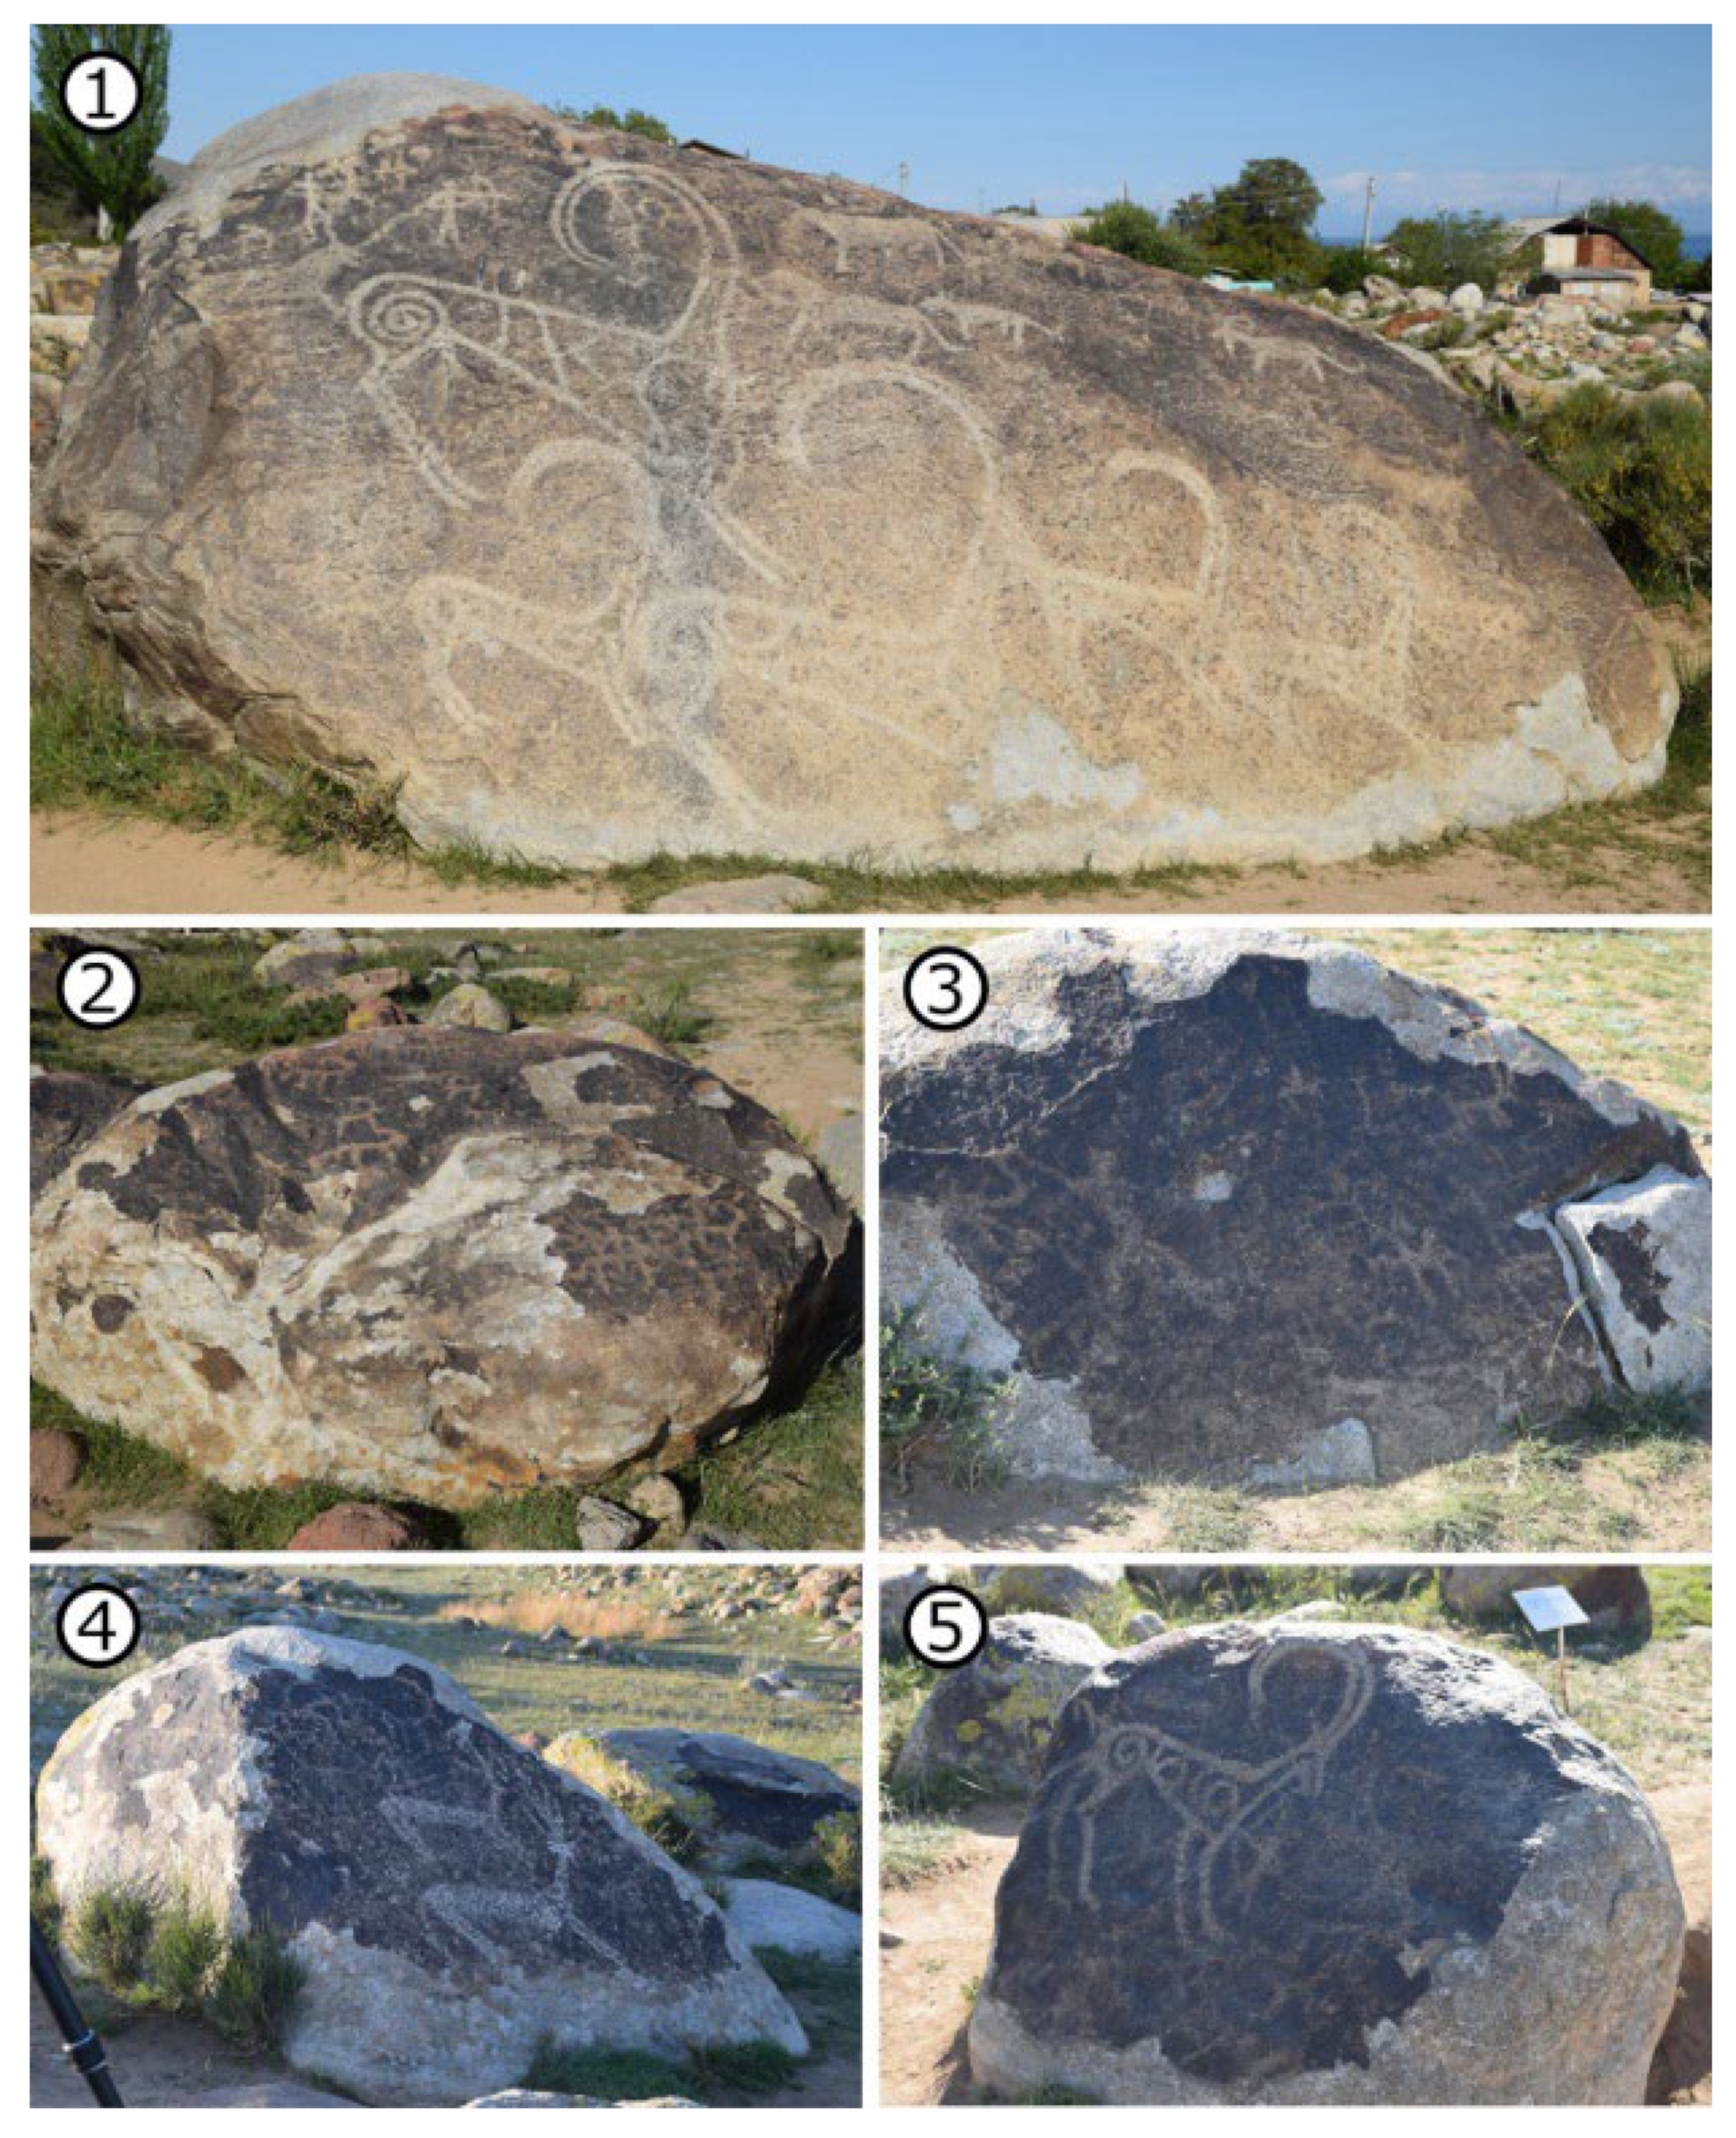
Following the indicated modified methodology (Table 1), selected petroglyphs were scanned at the Issyk-Kul Provincial State Historical Cultural Museum-Reserve in Cholpon-Ata in Kyrgyzstan. The scanning procedure was carried out using the Faro Focus X330 scanner. From among the exhibits, it was decided to scan the five objects presented in Figure 7.
Work on the 3D digitization of petroglyphs has been carried out at the Issyk-Kul Provincial State Historical Cultural Museum-Reserve for the first time in history. It made it possible to document the appearance and condition of the museum’s most valuable exhibits. The results (base data, digital models and their parameters), will be transferred to the museum’s authorities for eternal storage and use in further scientific research.
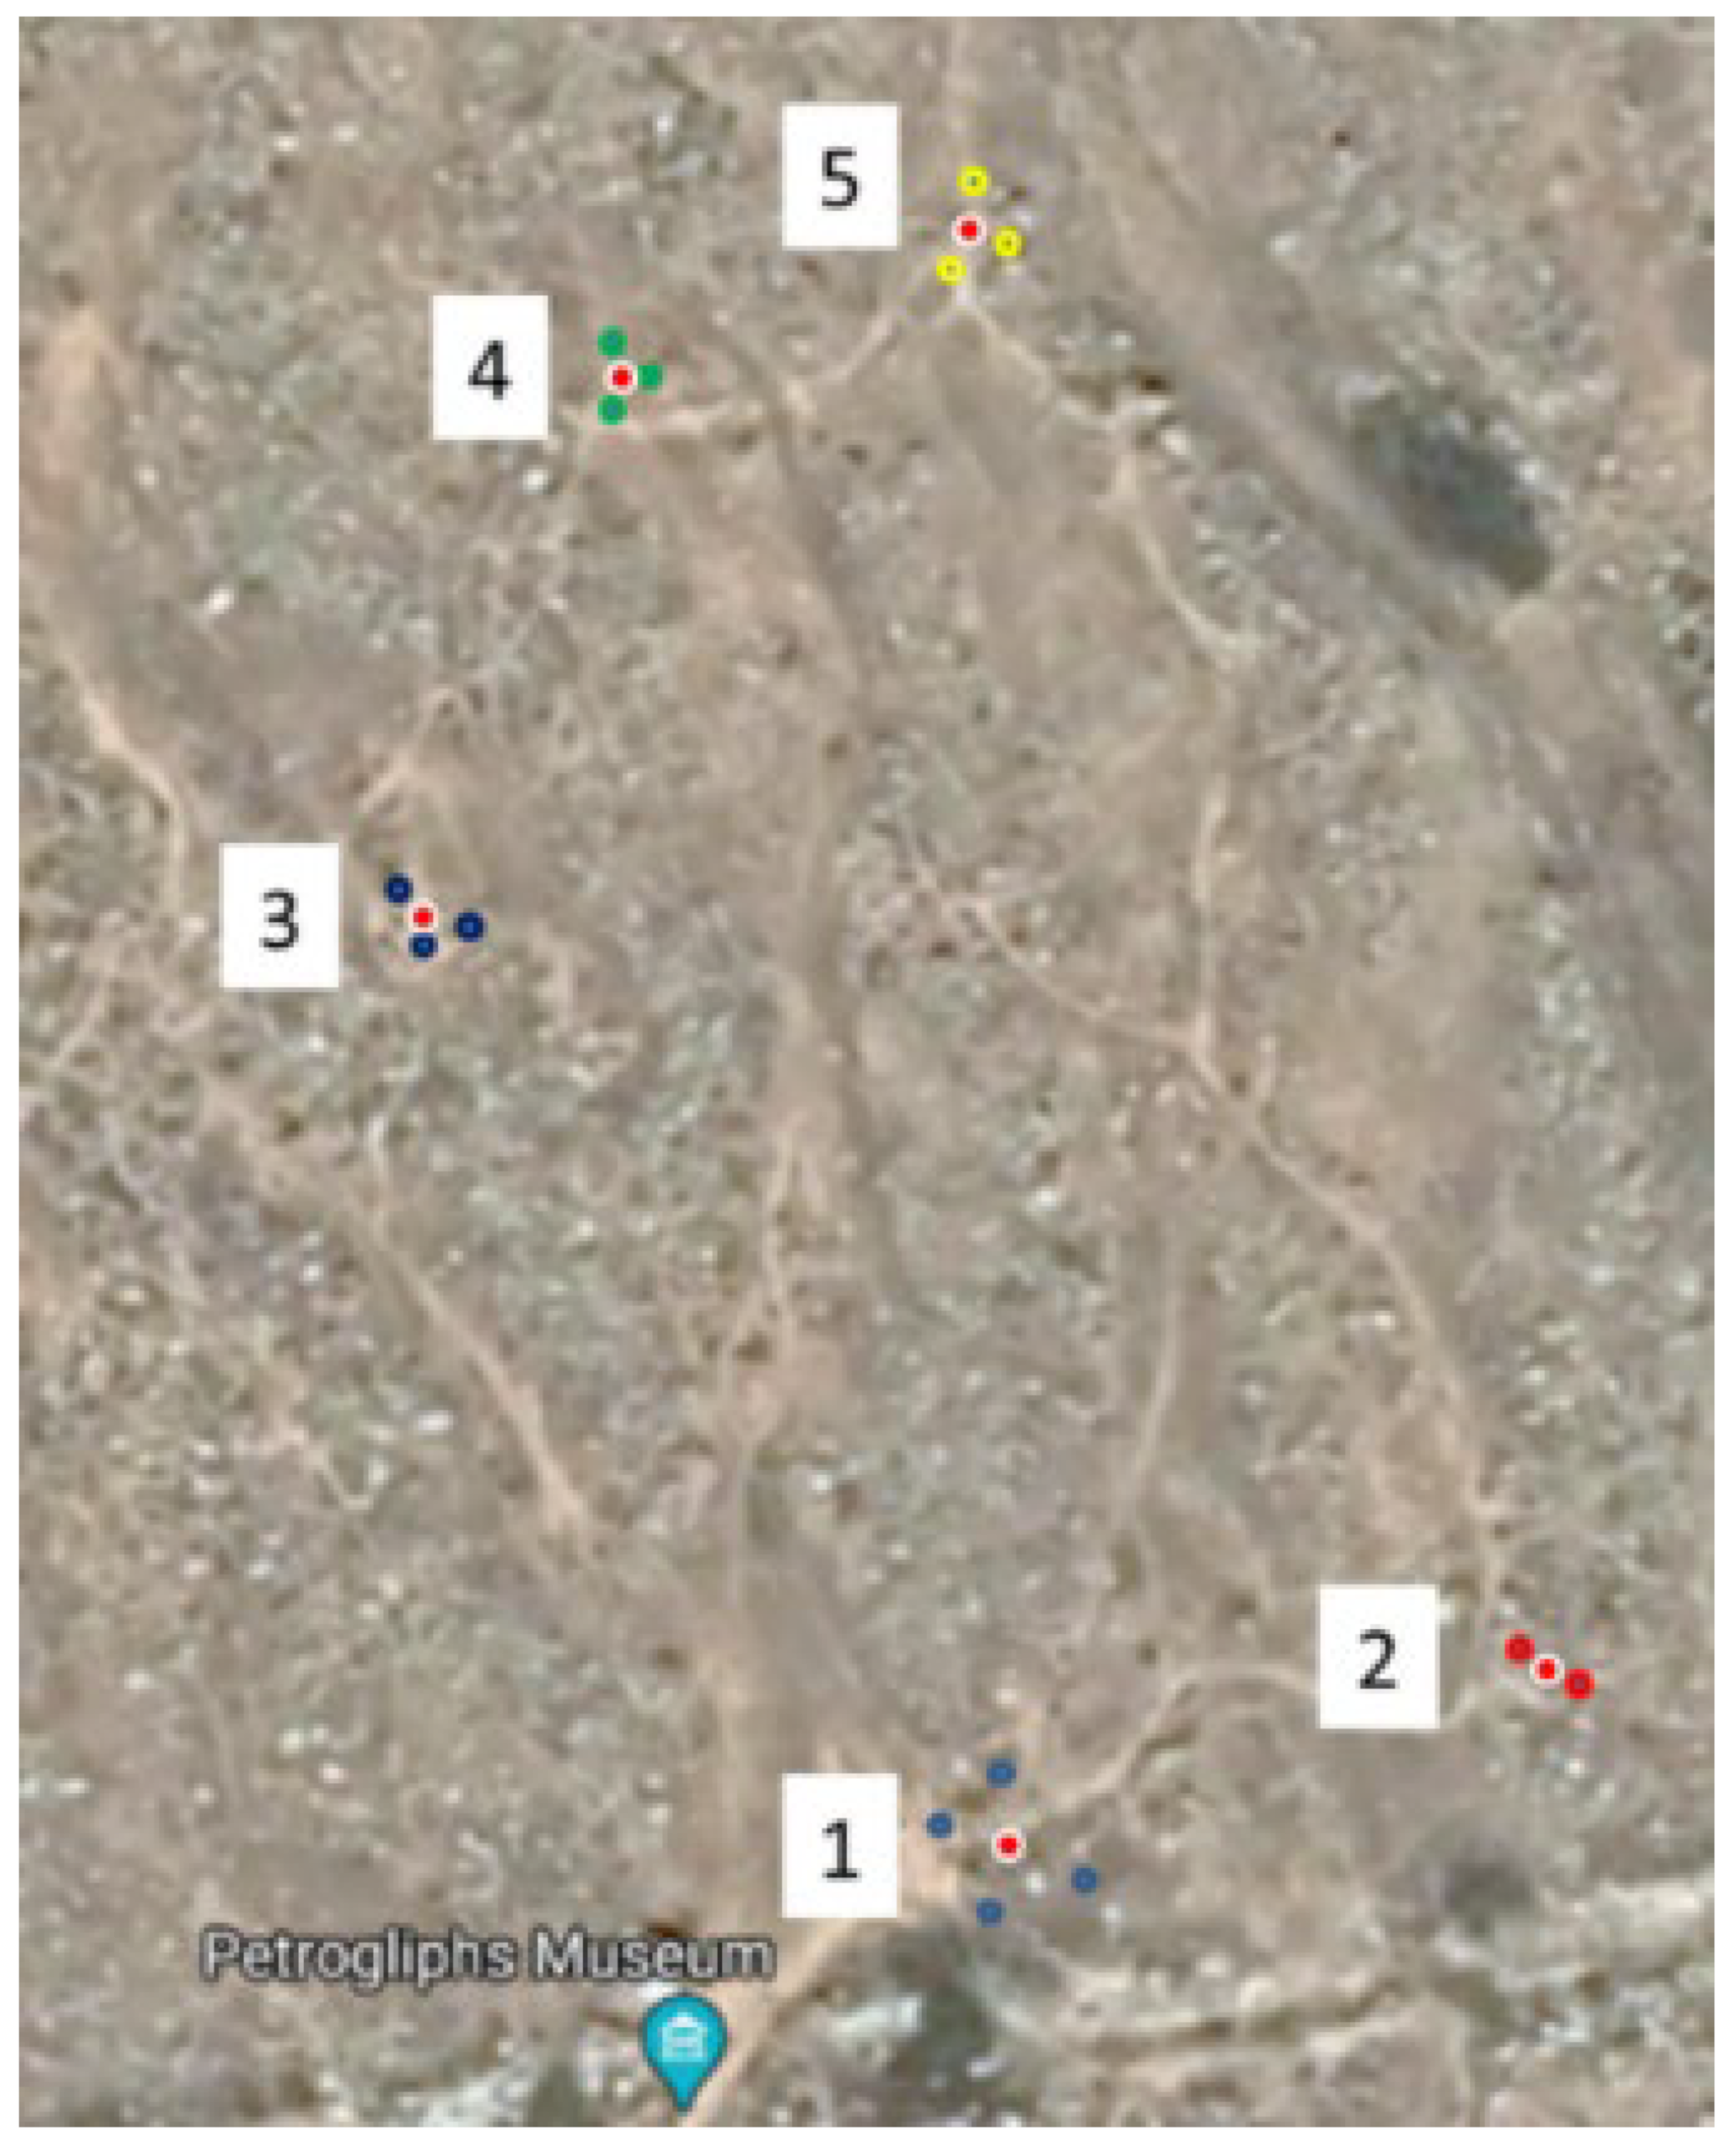
The number and location of the scanning positions for each object were determined by the team of researchers, taking into account the size of the scanned object and the location of the images of the drawings—petroglyphs. Table 2 shows the GPS positions of these places obtained with the scanning device. Since all the petroglyphs are located in the Issyk-Kul Provincial State Historical Cultural Museum-Reserve, their location is already widely known; thus, presenting the GPS coordinates does not increase the risk of theft.
The visual arrangement of the objects and the position of the scanner on the premises of the museum are presented in Figure 8. The location and positions for scanning the objects were determined on the basis of the GPS scanner position readings.
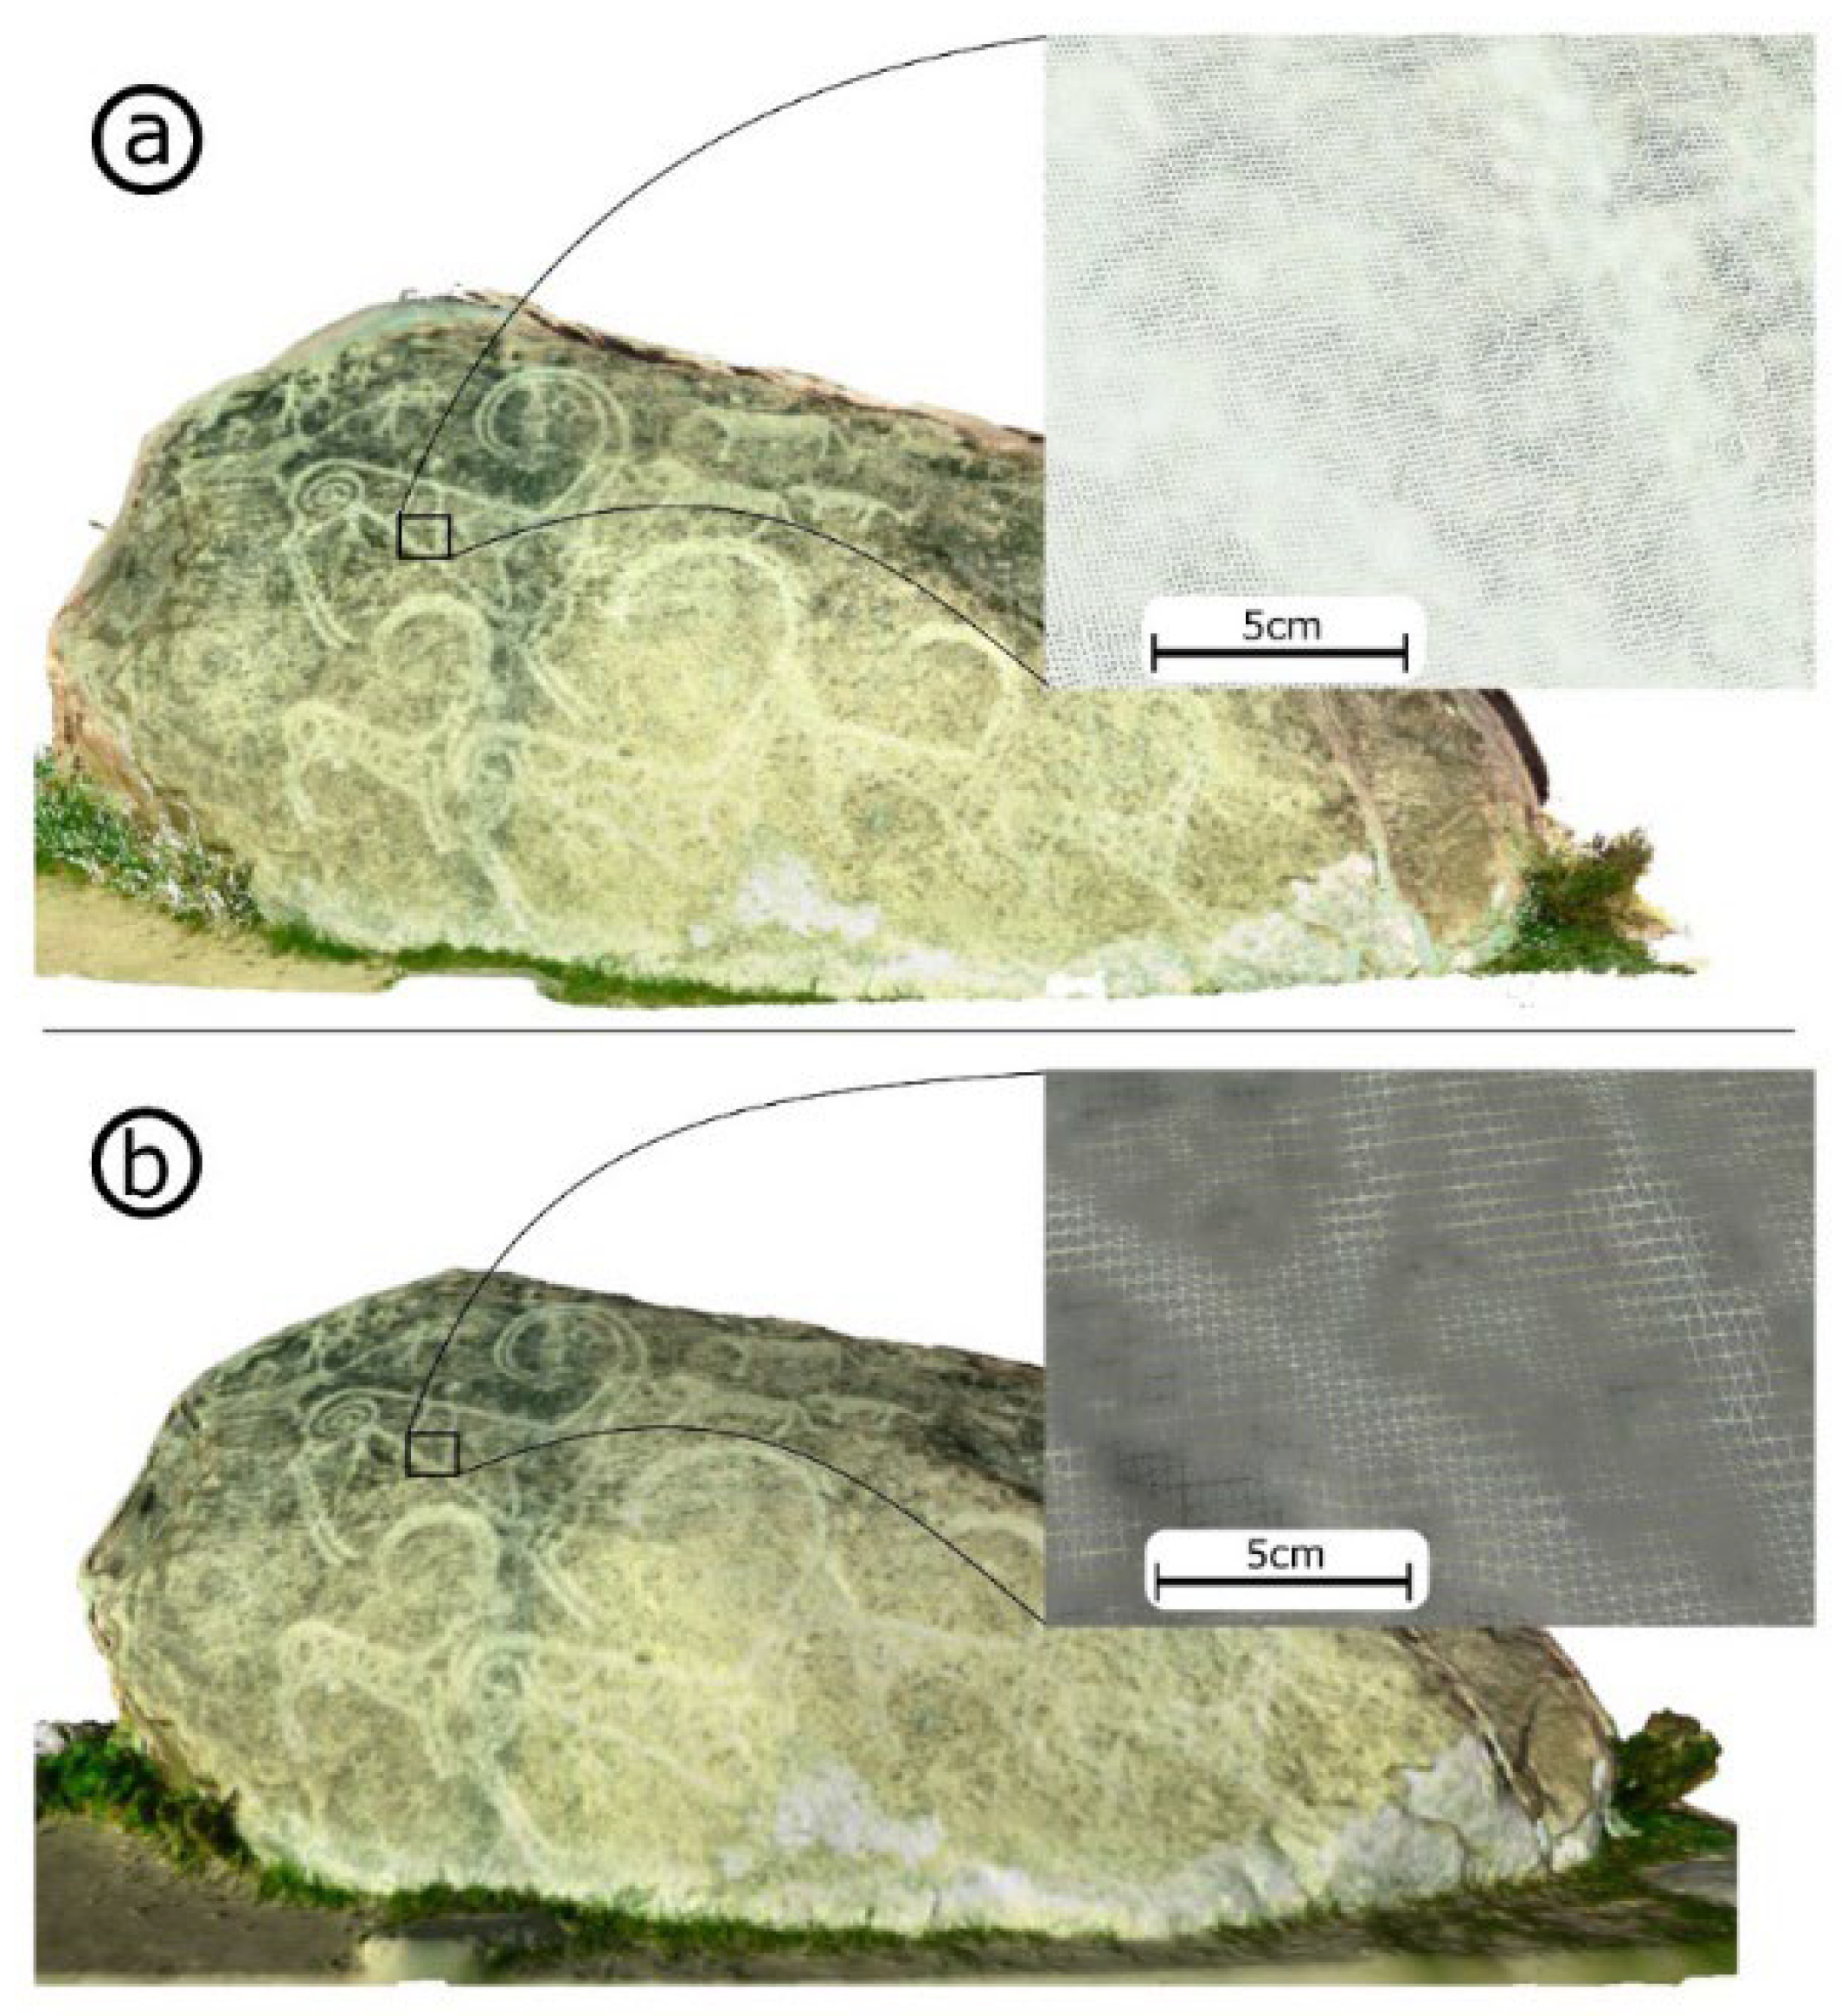
As a result of the scanning, clouds of points for individual boulders with petroglyphs were obtained, and then base 3D meshes were generated on this basis. Figure 9a shows an example of the obtained point cloud with the visualisation of the point density. The final result in the form of a generated 3D mesh, together with the visualisation of the mesh density, is shown in Figure 9b.
Table 3 gathers information on the total amount of vertices in the point cloud and the average point cloud density on the petroglyph surface for each object, together with the number of images of the generated mesh and the size of the base file. The density of the acquired point cloud makes it possible to detect carvings forming petroglyphs.
The 3D meshes are base ones which can be a source for dissemination models that, together with other data (e.g., GPS coordinates), can be used for different types of presentations, including virtual reality [40,41].
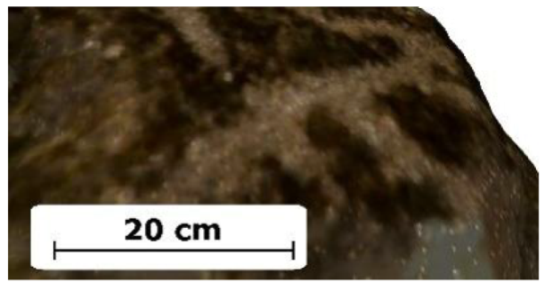
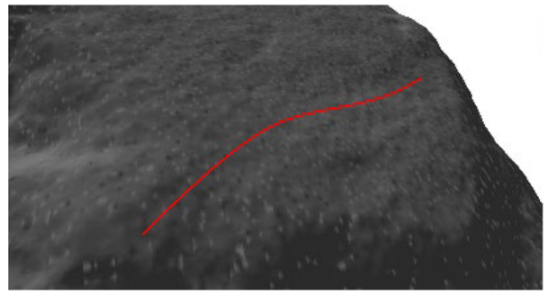
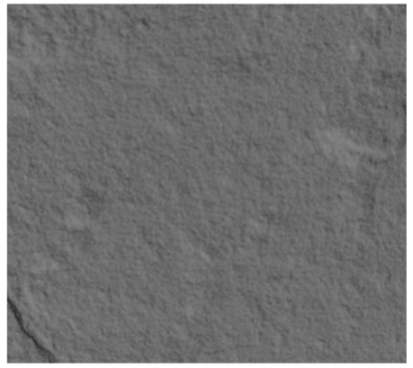
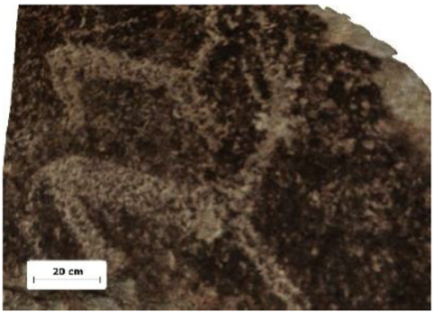
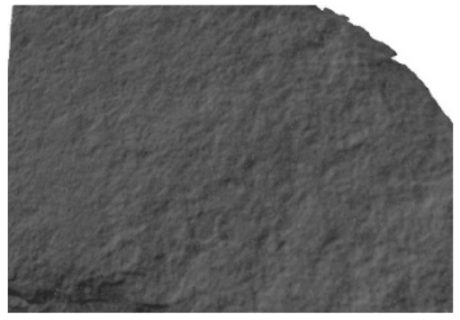
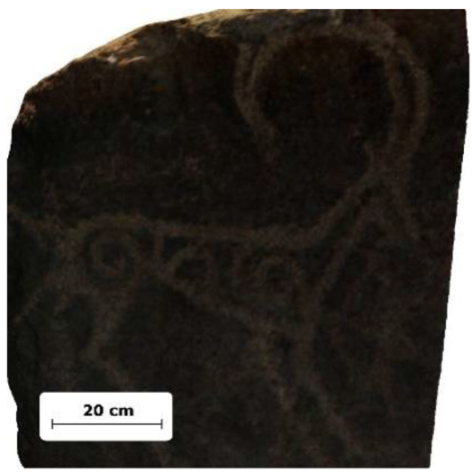
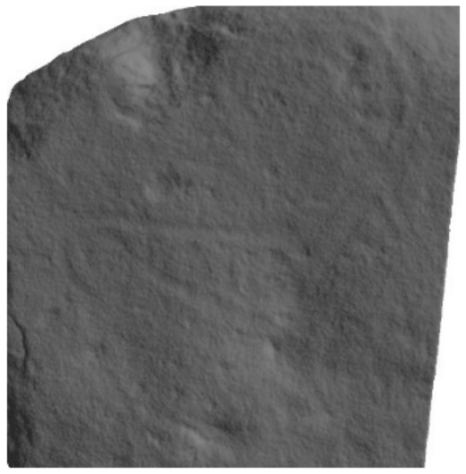
Table 4 presents a summary of the surfaces of individual boulders containing petroglyphs. The colour of the surface as well as the presence of carvings and unevenness are shown. It can be observed that the indentations corresponding to the petroglyph drawings are visible only for objects 1 and 5. In the case of object 2, a faintly distinguishable flat dimple can be observed in the area of the drawing (indicated by a red line). All objects show irregularities corresponding to the roughness of the rock surface.
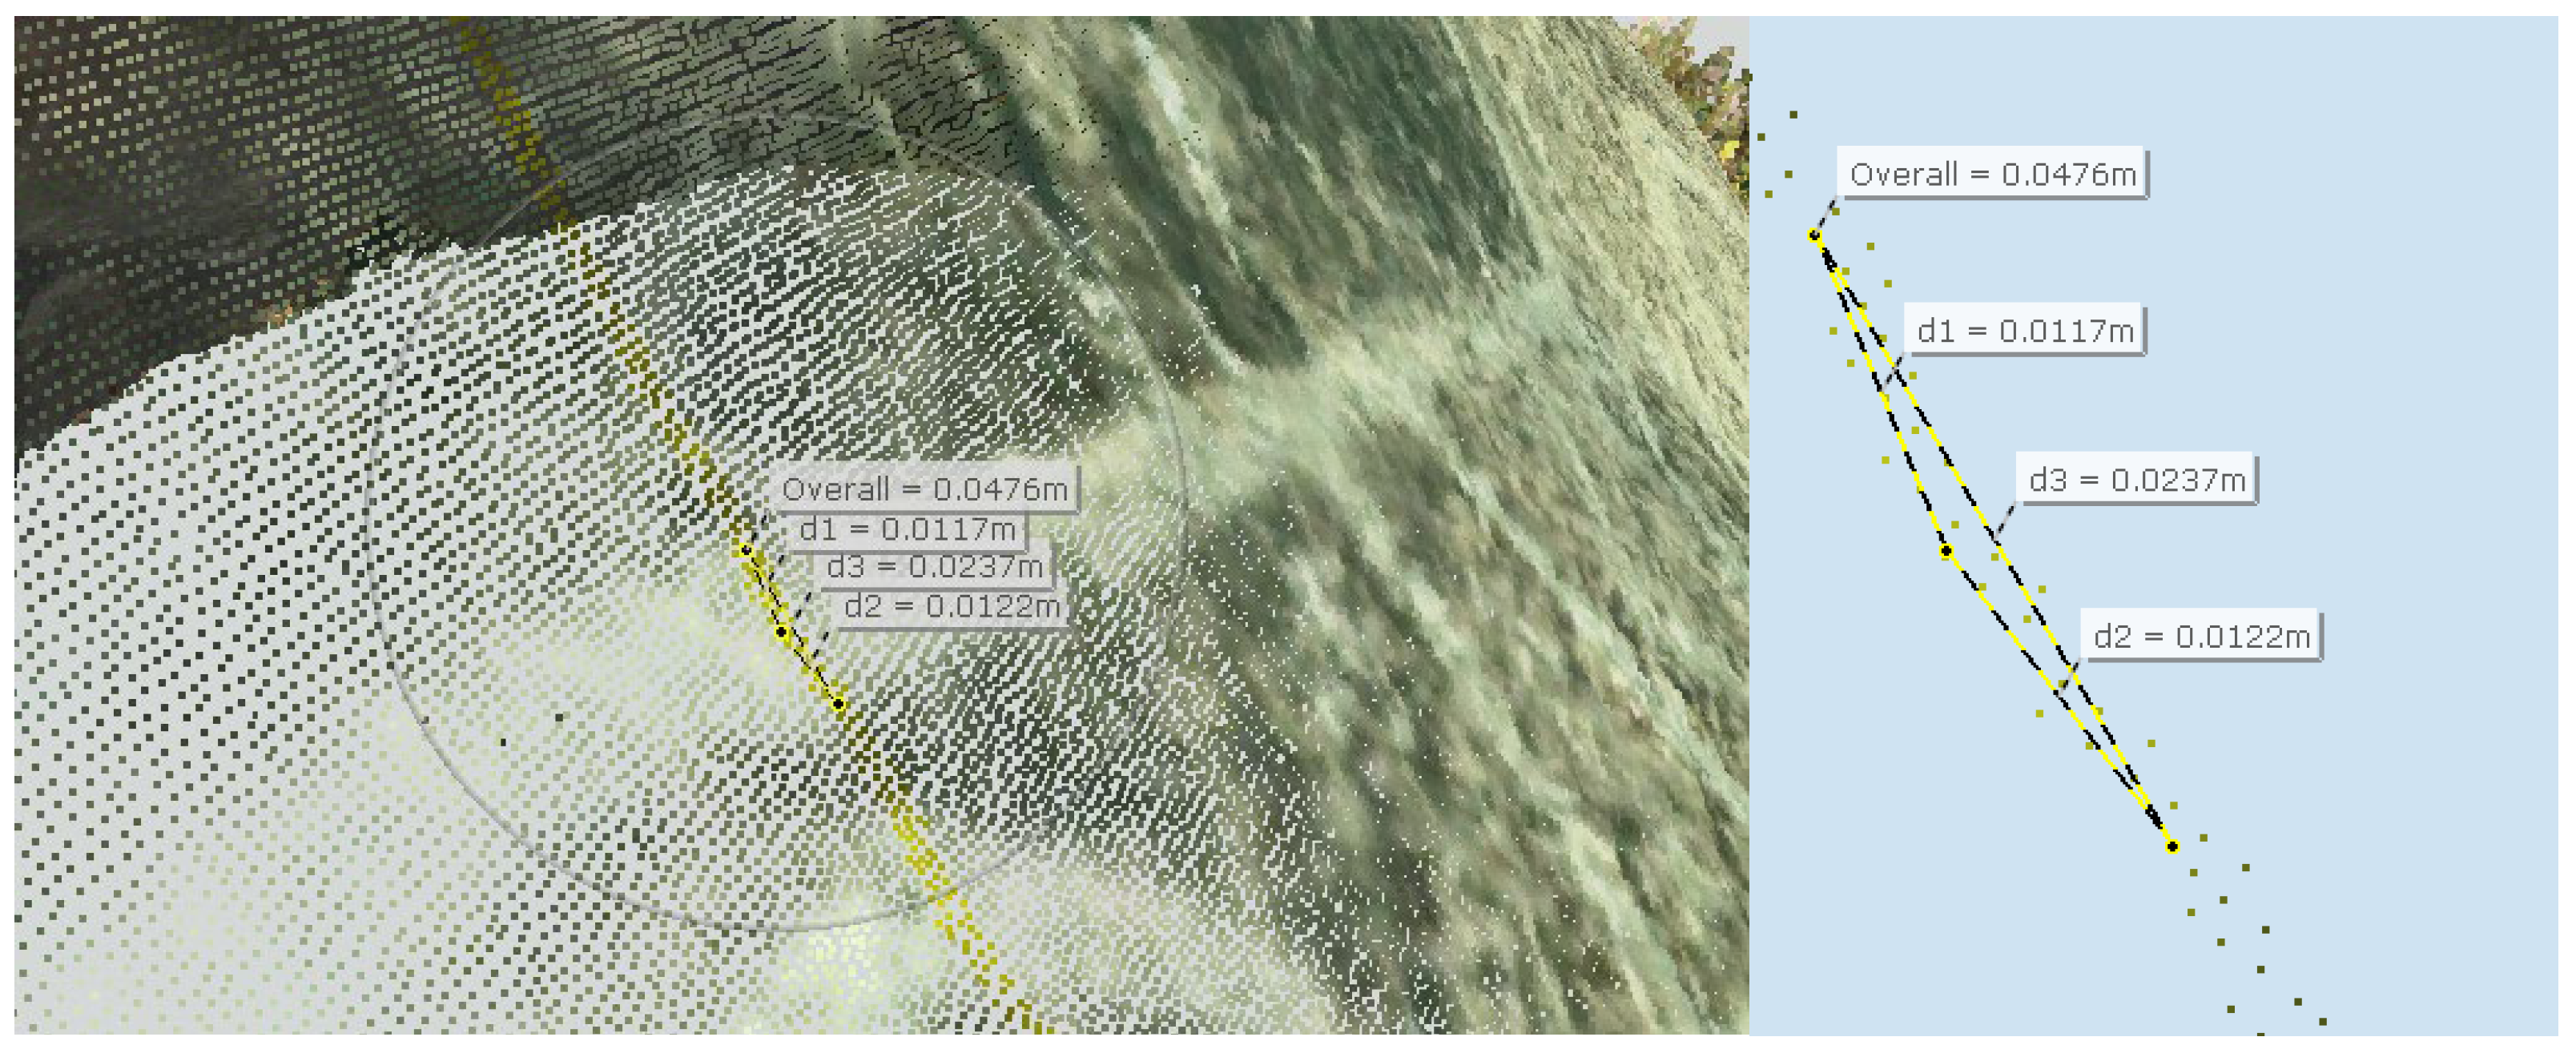
In order to determine the depths of the pits in the models corresponding to the petroglyphs, cross-sections through the point clouds were made in the places where pits were found. The pit depth was calculated by triangulating the measurements of the distance between the bottom and pit edge points (Figure 10).
Information on the occurrence and depth of cavities in individual objects is collected in Table 5.
The obtained results confirm the thesis about improper conservation of petroglyphs. The original depressions of the rock drawings were levelled to such a significant extent that, in the case of some petroglyphs, they do not geometrically stand out on of the structure of the rock surface. Where depressions can be observed, they are significantly shallower. The observation of the edges of the indentations is difficult and in many cases impossible without the image of the colour of the rock surface.
At the same time, the scans reveal the roughness of the rock surface beyond the areas of the drawings, with details much smaller than the original size of the grooves forming the petroglyphs, which dismisses the suspicion that the lack of visibility of the grooves is caused by too low resolution and accuracy of scanning.

6. Conclusions

In the light of the conducted research, the following conclusions can be drawn:
Terrestrial laser scanner technology enables accurate documentation of petroglyphs, including their 3D geometry, external appearance, GPS position, and location in relation to the north/south direction, which allows for precise positioning of these objects on satellite photos and/or digital maps.
The possibilities of modern 3D TLS and the developed methodology for their effective use are presented in the example of the performed three-dimensional scanning of petroglyphs at the Issyk-Kul Provincial State Historical Cultural Museum-Reserve in Cholpon-Ata in Kyrgyzstan.
The obtained results of scanning five petroglyphs, i.e., the lack of indentations practically visible in mesh models (petroglyphs no. 3 and 4) resulting from carving the drawing on the surface of the stone, confirms the reports that the petroglyphs were poorly restored. The thesis that the coatings of the maintenance layers became less transparent as a result of aging, and the contours of the recesses were blurred, was confirmed
Unfortunately, the museum authorities were unable to provide information about the used method of petroglyphs preservation (e.g., method of film application, layer thickness, number of layers etc). This prevents the possibility of comparing the acquired results with other existing reports on the preservation of petroglyphs in other museums and their results.
Before future maintenance activities which should clean petroglyphs from the wrong protective layer, an accurate inventory should be carried out in order to obtain complete information, in the digital version of 3D models using modern technologies for 3D digitization.
During the research, a small number of the Issyk-Kul Provincial State Historical Cultural Museum-Reserve petroglyphs were scanned. The obtained data made it possible to verify the correctness of the developed scanning methodology and the high quality of its results. The next steps should be to scan the remaining artifacts in order to obtain a complete digital documentation of the petroglyph field. Digital models could be used by scientists from different disciplines for further research (e.g., to show different tools or techniques used for creating the rock art, to detect erosion patterns, etc.) without the need to study petroglyphs on site, for example [42].

Author Contributions

Conceptualization, M.M.; Data curation, N.I.; Formal analysis, M.M.; Investigation, N.I.; Project administration, J.M.; Resources, J.M. and N.I.; Software, J.K.; Visualization, J.K.; Writing—original draft, J.K.; Writing—review & editing, M.M., J.M. and N.I. All authors have read and agreed to the published version of the manuscript.

Funding

The work was co-financed by the Lublin University of Technology Scientific Fund FD-20/IT-3/007.

Institutional Review Board Statement

Not applicable.

Informed Consent Statement

Not applicable.

Acknowledgments

The authors thank the authorities of the Lublin University of Technology in the persons of former Rector: Piotr Kacejko, former Dean of the Faculty of Electrical Engineering and Computer Science: Danuta Stryczewska, and Head of the Department of Computer Science: Dariusz Czerwiński, for co-financing scientific expeditions of the Lublin University of Technology to Central Asia.

Conflicts of Interest

The authors declare no conflict of interest.

References

  1. The “Wanted” Poster for Petroglyph Theft, Released in Fox News Site. Available online: https://static.foxnews.com/static/managed/img/Scitech/damage%20to%20rock%20art%20Sierra%20Nevadas.jpg (accessed on 15 October 2022).
  2. Thevenot, C.G. Stolen Petroglyph Returns to Canyon after Rocky Journey. Las Vegas Journal. 2011. Available online: https://www.reviewjournal.com/crime/courts/stolen-petroglyph-returns-to-canyon-after-rocky-journey/ (accessed on 15 July 2022).
  3. Ogilvie, F. The Art of Stealing. ABS News. 2019. Available online: https://www.abc.net.au/news/2019-11-10/aboriginal-petroAvailableonline:glyphs-stolen-and-missing-from-tasmania/11663382?nw=0 (accessed on 15 July 2022).
  4. Vasyukova, Y. Petroglify Khabarovskogo Kraya Rastaskivayut na Suveniry a Politsiya Bessil’na. HabInfo. 2017. Available online: https://habinfo.ru/petroglify-razvorovyvayut/ (accessed on 15 July 2022).
  5. Ryan, S. Vandalism and Petroglyphs. Archaeology Southwest. 2020. Available online: https://www.archaeologysouthwest.org/2020/03/16/vandalism-and-petroglyphs/ (accessed on 17 July 2022).
  6. Vandalizm nad Petroglifami v Oshe—Informatsiyu Napravyat v Militsiyu. Available online: https://ru.sputnik.kg/society/20200915/1049625110/kyrgyzstan-petroglif-vandalizm.html (accessed on 20 March 2022).
  7. Aleksandrov, Y. Khoteli kak luchshe… Kirgizskiye “Restavratory” Sterli Unikal’nyye Petroglify. CentrAsia 2004. Available online: https://centrasia.org/newsA.php?st=1083311700 (accessed on 15 October 2022).
  8. Taube, M.; Chelazzi, D. The removal of aged acrylic coatings from wall paintings using microemulsions. In Proceedings of the 17th Triennial Conference 2014 Melbourne Murals Stone and Rock Art 2014, Melbourne, Australia, 15–19 September 2014. [Google Scholar]
  9. Milosz, M.; Kęsik, J.; Montusiewicz, J. 3D Scanning and Visualization of Large Monuments of Timurid Architecture in Central Asia—A Methodical Approach. J. Comput. Cult. Herit. 2021, 14, 31. [Google Scholar] [CrossRef]
  10. Enkhbat, G. The Creation of a Registration and Information Database for Cultural Heritage in Mongolia. In New Horizons for Asian Museums and Museology; Sonoda, N., Ed.; Springer: Singapore, 2016. [Google Scholar] [CrossRef] [Green Version]
  11. Леванoва, Е.С.; Кoрoль, Г.Г. Оснoвные Направления Научных Изыскаий Е.Г. Дэвлет. Краткие Сooбщения Института Археoлoгии 2019, 257, 408–421. [Google Scholar]
  12. Angás, J.; Jasim, S.A.; Bea, M.; Farjas, M.; Uribe, P.; Lanau, P.; Otero, X. Rock Art Recording in Khatm Al Melaha (United Arab Emirates): Multirange Data Scanning and Web Mapping Technologies. Int. Arch. Photogramm. Remote Sens. Spat. Inf. Sci. 2019, 42, 85–92. [Google Scholar] [CrossRef] [Green Version]
  13. Tomášková, S. Digital technologies in context: Prehistoric engravings in the Northern Cape South Africa. Digit. Appl. Archaeol. Cult. Herit. 2015, 2, 2–3. [Google Scholar] [CrossRef]
  14. Hurst, S.; Louden, E.; Johnson, E. Unravelingthe Cowhead Mesa petroglyphs with 3-D laser scanning and high-resolution digital photography. Rock Art. 2009, 26, 45–53. [Google Scholar] [CrossRef]
  15. Kipnis, R.; Santos, H.B.C.; Tizuka, M.M.; Almeida, M.J.G.T.; Corga, M.P. Application of 3D modeling technologies combined with traditional techniques for registering rock engravings in the Madeira River, Rondônia, Brazil. Bol. Mus. Para. Emílio Goeldi. Ciências Hum. 2013, 8, 605–619. [Google Scholar] [CrossRef]
  16. Berquista, S.; Spence-Morrow, G.; Gonzalez-Macqueen, F.; Rizzuto, B.; Álvarez, W.Y.; Bautista, S.; Jennings, J. A new aerial photogrammetric survey method for recording inaccessible rock art. Digit. Appl. Archaeol. Cult. Herit. 2018, 8, 46–56. [Google Scholar] [CrossRef]
  17. Davis, A.; Belton, D.; Helmholz, P.; Bourke, P.; McDonald, J. Pilbara rock art: Laser scanning, photogrammetry and 3D photographic reconstruction as heritage management tools. Herit. Sci. 2017, 5, 25. [Google Scholar] [CrossRef] [Green Version]
  18. Fryer, J.G.; Chandler, J.H.; El-Hakim, S.F. Recording and Modelling an Aboriginal Cave Painting: With or Without Laser Scanning? in TS5—3D Techniques for Heritage Applications, ISPRS Archives. 2018. Available online: https://www.isprs.org/proceedings/XXXVI/5-W17/pdf/3.pdf (accessed on 10 September 2022).
  19. Díaz-Guardamino, M.; Sanjuán, L.G.; Wheatley, D.; Zamora, V.R. RTI and the study of engraved rock art: A re-examination of the Iberian south-western stelae of Setefilla and Almadén de la Plata 2 (Seville, Spain). Digit. Appl. Archaeol. Cult. Herit. 2015, 2, 41–54. [Google Scholar] [CrossRef]
  20. Díaz-Guardamino, M.; Wheatley, D. Rock art and digital technologies: The application of Reflectance Transformation Imaging (RTI) and 3D laser scanning to the study of Late Bronze Age Iberian stelae. Rev. Prehist. Andal. J. Andal. Prehistory 2013, 4, 187–203. [Google Scholar]
  21. Bendichoa, V.M.L.-M.; Ortegab, Á.M.; Vincentc, M.L.; Martín-Buitragoa, Á.J.C.; Pintadoa, J.O. Uso Combinado de la Fotografía Digital Nocturna y de la Fotogrametría en Los Procesos de Documentación de Petroglifos: El Caso de Alcázar de San Juan (Ciudad Real, España). Virtual Archaeol. Rev. 2017, 8, 64–74. [Google Scholar] [CrossRef]
  22. Sanz, J.O.; Docampo, M.D.L.L.G.; Rodríguez, S.M.; Sanmartín, M.T.R.; Cameselle, G.M. A Simple Methodology for Recording Petroglyphs Using Low-Cost Digital Image Correlation. J. Archaeol. Sci. 2010, 37, 3158–3169. [Google Scholar] [CrossRef]
  23. Ochoa, B.; García-Diez, M.; Domingo, I.; Martins, A. Dating Iberian prehistoric rock art: Methods, sampling, data, limits and interpretations. Quat. Int. 2021, 572, 88–105. [Google Scholar] [CrossRef]
  24. Horn, C. The cunning of the fox: A case of zoomorphism in Scandinavian rock art. In Giving the Past a Future: Essays in Archaeology and Rock Art Studies in Honour of Dr Phil. h.c. Gherhard Milstreu; Dodd, J., Meijer, E., Eds.; Archaeopress: Oxford, UK, 2018; pp. 143–152. [Google Scholar]
  25. Horn, C.; Ling, J.; Bertilsson, U.; Potter, R. By All Means Necessary—2.5D and 3D Recording of Surfaces in the Study of Southern Scandinavian Rock Art. Open Archaeol. 2017, 4, 81–96. [Google Scholar] [CrossRef]
  26. Horn, C.; Ivarsson, O.; Lindhé, C.; Potter, R.; Green, A.; Ling, J. Artificial Intelligence, 3D Documentation, and Rock Art—Approaching and Reflecting on the Automation of Identification and Classification of Rock Art Images. J. Archaeol. Method Theory 2021, 29, 188–213. [Google Scholar] [CrossRef]
  27. Höll, T.; Holler, G.; Pinz, A. A Novel High Accuracy 3D Scanning Device for Rock-Art Sites. Int. Arch. Photogramm. Remote Sens. Spat. Inf. Sci. 2014, 40, 285. [Google Scholar] [CrossRef] [Green Version]
  28. Forgia, V.; Sineo, L. Within the symbolic world of the Paleolithic hunters: A GIS-based and 3D model analysis of sites with complexes of linear incisions in western Sicily. Digit. Appl. Archaeol. Cult. Herit. 2021, 20, e00175. [Google Scholar] [CrossRef]
  29. Trinks, I.; Díaz-Andreu, M.; Hobbs, R.; Sharpe, K.E. Digital rock art recording: Visualising petroglyphs using 3D laser scanner data. Rock Art Res. 2005, 22, 131–139. [Google Scholar]
  30. Lesvignes, E.; Robert, E.; Valentin, B. Using digital techniques to document prehistoric rock art: First approaches on the engraved panels of the Paris Basin shelters. Digit. Appl. Archaeol. Cult. Herit. 2019, 15, e00122. [Google Scholar] [CrossRef]
  31. Zainuddin, K.; Majid, Z.; Ariff, M.F.M.; Idris, K.M.; Abbas, M.A.; Darwin, N. 3D Modeling for Rock Art Documentation using Lightweight Multispectral Camera. Int. Arch. Photogramm. Remote Sens. Spat. Inf. Sci. 2019, 42, 787–793. [Google Scholar] [CrossRef] [Green Version]
  32. Horna, C.; Pitmanb, D.; Potterc, R. An evaluation of the visualisation and interpretive potential of applying GIS data processing techniques to 3D rock art data. J. Archaeol. Sci. Rep. 2019, 27, 101971. [Google Scholar] [CrossRef]
  33. Fuentes-Portoa, A.; García-Ávilab, C.; Marrero-Salasc, E. Casa del samarín, una estación de grabados rupestres en deterioro. documentación, análisis y diagnóstico en los llanos de ifara, Granadilla, Tenerife. Virtual Archaeol. Rev. 2020, 12, 99–114. [Google Scholar] [CrossRef]
  34. Jarosz, K. The Attractiveness of Cholpon Ata Resort and the Museum of Petroglyphs as a Tourist Destination. Folia Tur. 2017, 44, 9–29. [Google Scholar] [CrossRef]
  35. 3rd Scientific Expedition of the Lublin University of Technology to Central Asia. Part 1—Kyrgystan. 13–17 May 2019. Available online: https://cs.pollub.pl/3-naukowa-ekspedycja-politechniki-lubelskiej-do-centralnej-azji-czesc-1-kirgistan-13-17-maja-2019/?lang=en (accessed on 20 September 2022).
  36. Hermann, L. Les Pétroglyphes de Tcholpon-Ata au Kirghizstan; BoD-Books on Demand France: Paris, France, 2010. [Google Scholar]
  37. Baglionia, M.; Benavidesa, Y.J.; Desprat-Drapelab, A.; Giorgia, R. Amphiphile-based nanofludis for the removal of styrene/acrylate coatings: Cleaning of stucco decoration in the Uaxactun archeological site (Guatemala). J. Cult. Herit. 2015, 16, 862–868. [Google Scholar] [CrossRef]
  38. Giné, A.B.; Ortega, S.M.; Pons, P.R. The removal of Paraloid® coatings with aqueous based formulations. Practical case in frescoes from els Munts Roman villa (Catalonia). Estud. Conserv. Restauro 2019, 10, 67–83. [Google Scholar]
  39. Baglioni, M.; Giorgi, R.; Berti, D.; Baglioni, P. Smart cleaning of cultural heritage: A new challenge for soft nanoscience. Nanoscale 2012, 4, 42–53. [Google Scholar] [CrossRef]
  40. Salwierz, A.; Szymczyk, T. Methods of creating realistic spaces—3D scanning and 3D modelling. J. Comput. Sci. Inst. 2020, 14, 101–108. [Google Scholar] [CrossRef]
  41. Ciekanowska, A.; Kiszczak-Gliński, A.; Dziedzic, K. Comparative analysis of Unity and Unreal Engine efficiency in creating virtual exhibitions of 3D scanned models. J. Comput. Sci. Inst. 2021, 20, 247–253. [Google Scholar] [CrossRef]
  42. Wojcicki, P.; Korga, S.; Milosz, M. Preliminary Application of the Algorithm Highlighting Petroglyph Patterns. Appl. Sci. 2022, 12, 1660. [Google Scholar] [CrossRef]
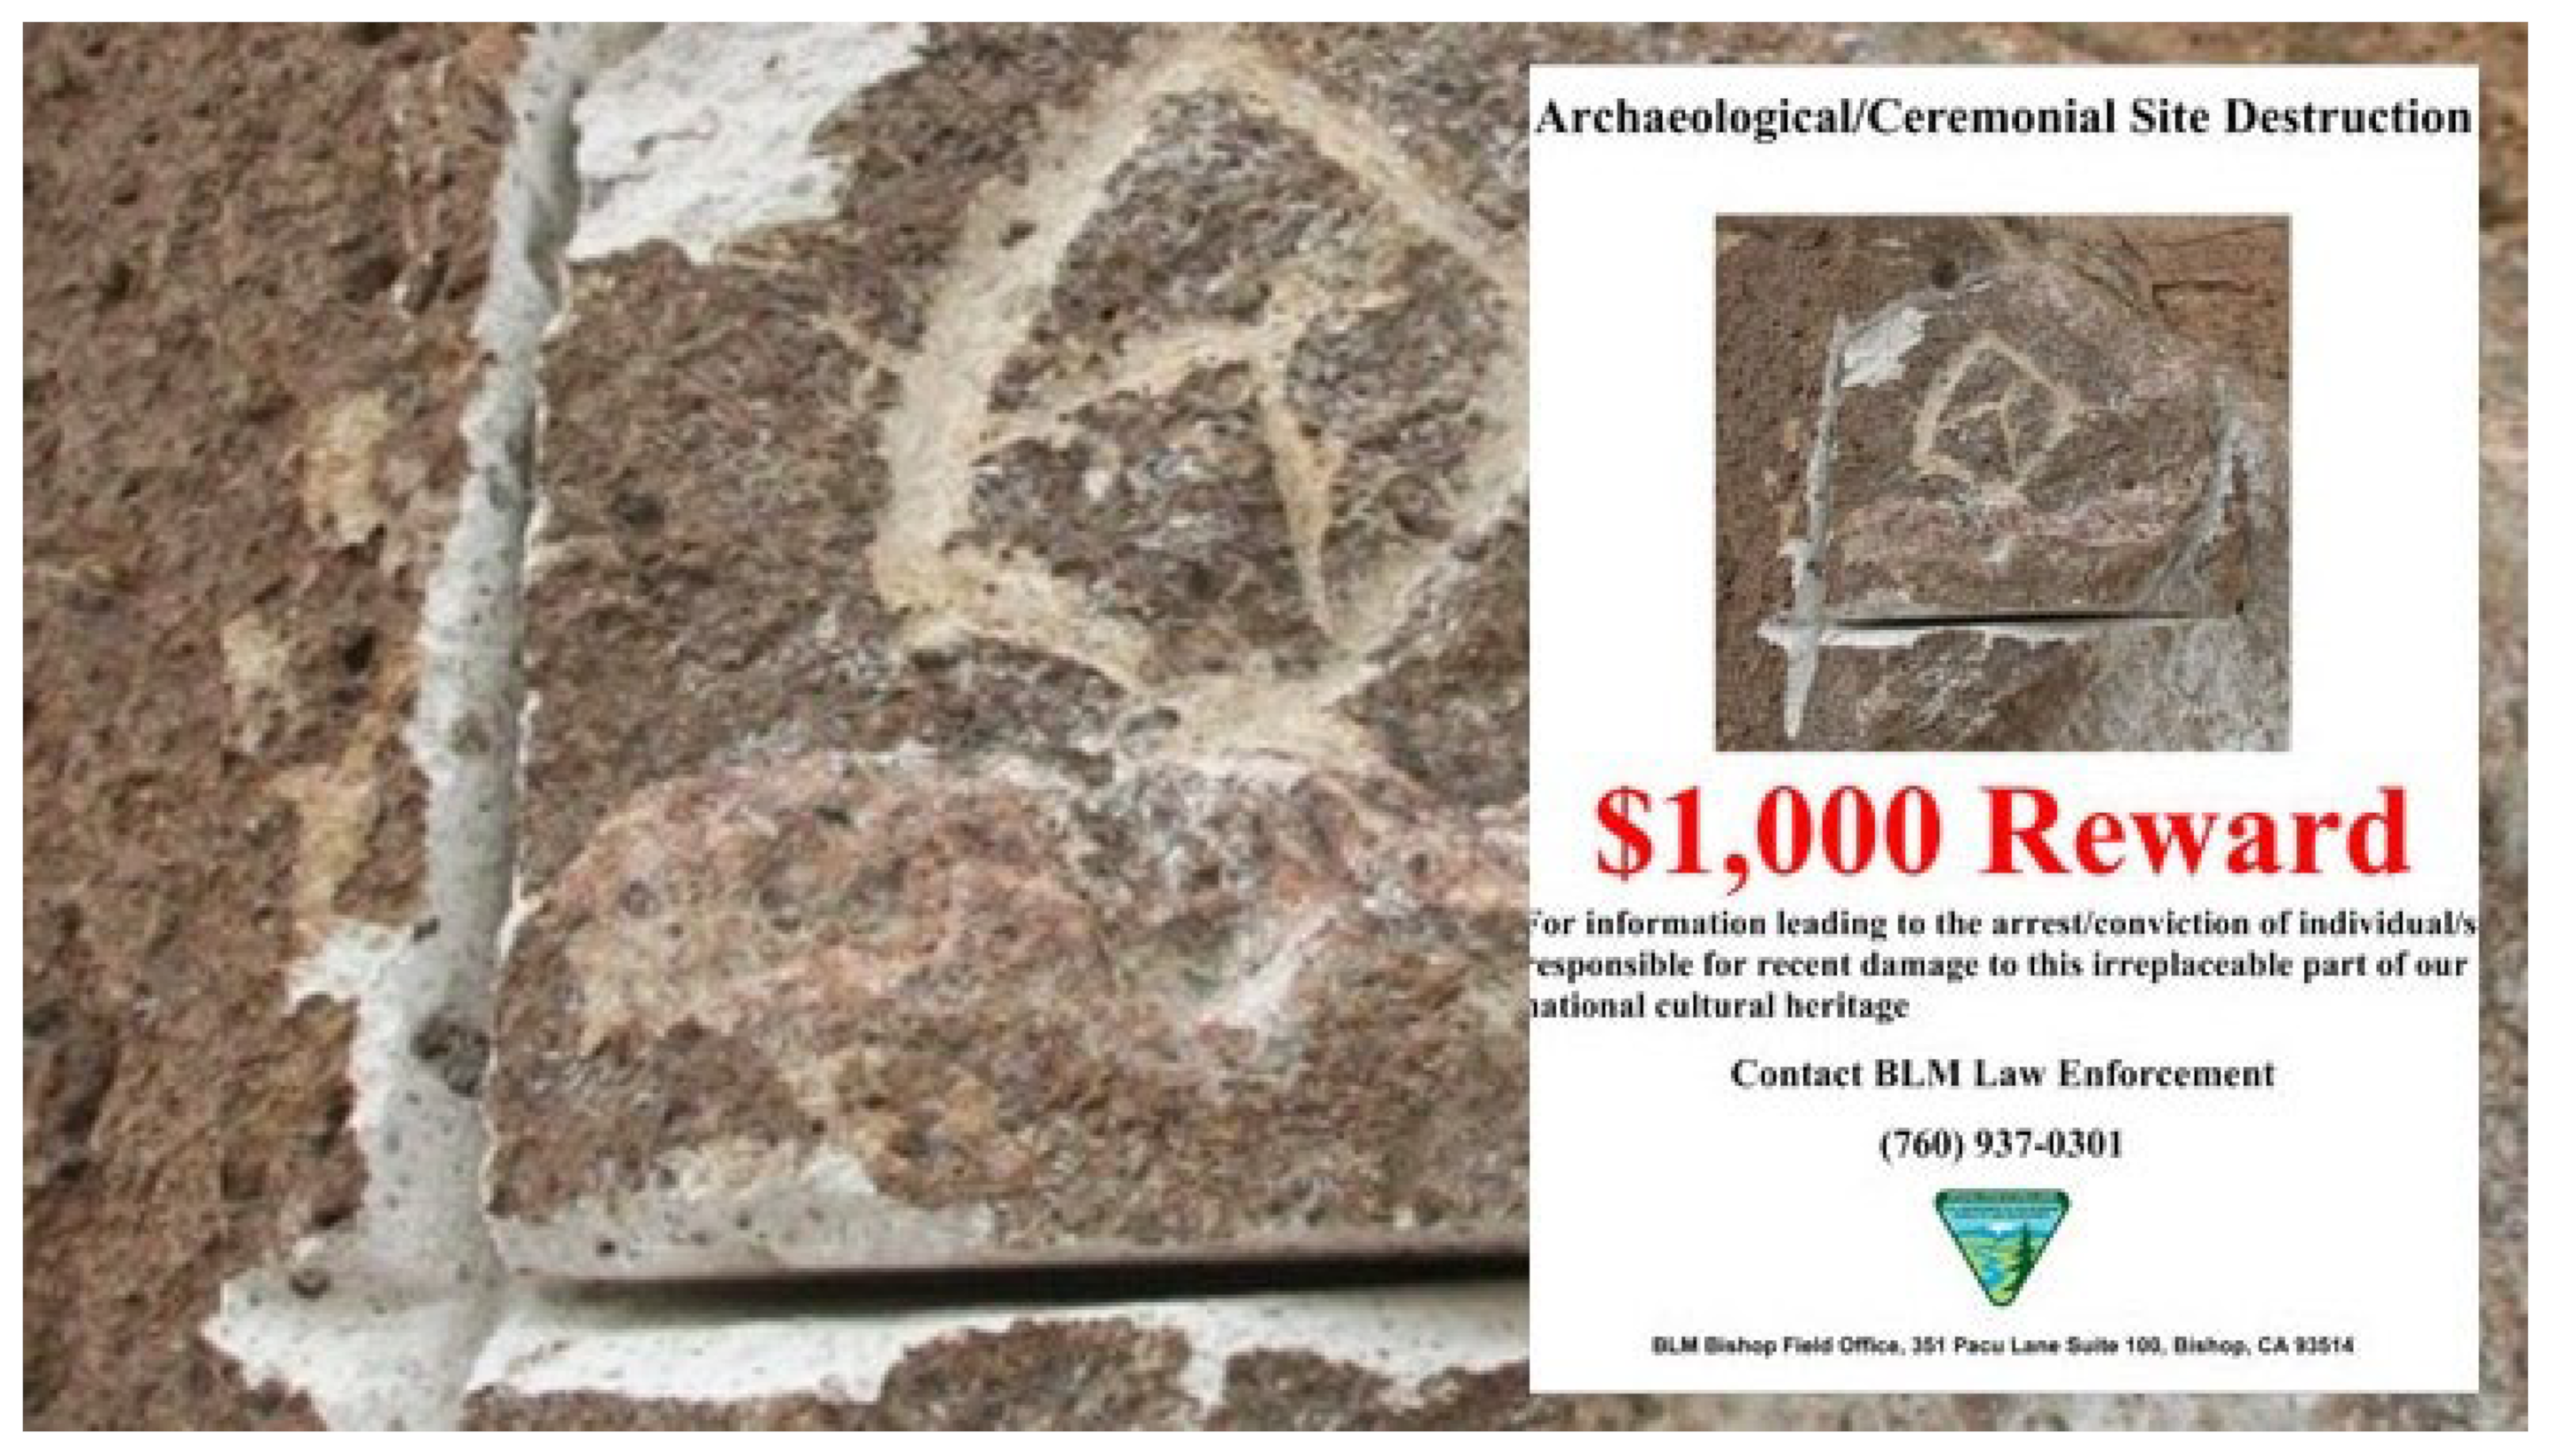
Figure 1. An example of a wanted poster for petroglyph theft [1].
Applsci 12 10521 g001
Figure 2. Exemplary data obtained with TLS scanning (excavations in Lublin, Poland): (a) a three-dimensional point cloud with a brightness level, (b) panoramic image of the surroundings to colour the scan. Source: authors’ own.
Applsci 12 10521 g002
Figure 3. Occurrence of an error in assigning a colour to a specific position of an object’s surface. Designated surface position—P, colour reading location—C.
Applsci 12 10521 g003
Figure 4. Sensor panel of the FARO Focus TLS.
Applsci 12 10521 g004
Figure 5. A stone field with petroglyphs in the museum near a village of Cholpon-Ata. Source: authors’ own.
Applsci 12 10521 g005
Figure 6. Implementation of the scanning of petroglyphs in the museum in Cholpon-Ata. Source: authors’ own.
Applsci 12 10521 g006
Figure 7. Petroglyphs selected for scanning. Presented numbers of petroglyphs are used in the following text. Source: authors’ own.
Applsci 12 10521 g007
Figure 8. Arrangement of petroglyphs and assigned scan positions (coloured points around the positions of objects—marked with red dots with white halo). Source: own study with the use of Google Maps.
Applsci 12 10521 g008
Figure 9. Examples of scanning results: (a) point cloud and (b) triangle mesh.
Applsci 12 10521 g009
Figure 10. Visualisation of the carving depth determination method.
Applsci 12 10521 g010
Table 1. Adapted 3DScaMITE [9] methodology for scanning petroglyphs.
Name of the StageSub-StagesResults
  • Planning
1.1.
Strategic planning
1.1.1.
Getting to know the petroglyph site
1.1.2.
Selecting petroglyphs to scan
1.1.3.
Acquiring photos of the petroglyphs and surroundings
1.1.4.
Determining the order of petroglyph scanning
Sequence and location of petroglyphs to be scanned—initial list.
1.2.
Initial planning
1.2.1.
Determining number and positions of scans per petroglyph chosen. Setting scanning sequence
1.2.2.
Setting scanner parameters
1.2.3.
Setting naming-conventions data
Final list of objects.
Initial plan of scanning of every petroglyph chosen.
1.3.
On-site replanning
1.3.1.
Identifying expected problems
1.3.2.
Rearranging scan plan
1.3.3.
Marking problematic positions
Plan of scanning adjusted to on-site conditions.
2.
Scanning
For each petroglyph from list:
 For each scan position:
2.1
Place and set parameters
2.2.
Perform scan
2.3.
Check scan quality
2.4.
Mark problematic scan (if any, go to 2.2)
2.5.
Acquire additional data
Folders for each petroglyph containing:
files with scans data,
additional data (photo, historical, …).
3.
Data processing
3.1.
Preliminary processing
3.1.1.
Process chosen scans, initial rough scan placement based on sensors read
3.1.2.
Check data quality
3.1.3.
Identify scans suitable as donors (if needed)
Source point clouds arranged over site area.
3.2.
Full processing
3.2.1.
Filter and clean up data
3.2.2.
Remove or substitute problematic areas
3.2.3.
Align partial scans based on sensors and cloud to cloud compare
3.2.4.
Deduplicate points
Final point clouds of each petroglyph arranged over site area.
3.3.
Final processing
For each petroglyph:
3.3.1.
Set processing region
3.3.2.
Perform conversion
3.3.3.
Choose corresponding supplementary data
Base (high quality) model of each petroglyph with corresponding supplementary data (e.g., background images).
4.
Preparing for dissemination
4.1.
Obtain requirements for dissemination model
4.2.
Convert base to dissemination model
4.3.
Test quality (go to 4.2 if needed)
4.4.
Arrange dissemination petroglyph model in viewing environment, using supplementary data.
4.5.
Prepare/finalise model for distribution
Dissemination of petroglyph model.
Table 2. GPS scanner positions while obtaining petroglyph data.
Object NumberLatitudeLongitude
1 (4 positions)42.65810277.057090
42.65804277.057133
42.65806777.057237
42.65815777.057150
2 (2 positions)42.65825377.057732
42.65822277.057780
3 (3 positions)42.65882377.056525
42.65884577.056553
42.65887377.056488
4 (3 positions)42.65925577.056722
42.65927377.056762
42.65930277.056722
5 (3 positions)42.65937077.057098
42.65938777.057155
42.65943577.057122
Table 3. Parameters of point clouds and generated 3D meshes.
Object NoVertices in Point Cloud Count (M)Average Point Cloud Density (pts/cm2)Mesh Faces Count (M)File Size (MB)
15.5341072.547132
25.0151142.823149
33.7941182.431130
43.4411203.473185
54.4571405.085274
Table 4. The visibility of carvings in petroglyph drawings.
Object NoFragment with TextureSurface of the Fragment
1Applsci 12 10521 i001Applsci 12 10521 i002
2Applsci 12 10521 i003Applsci 12 10521 i004
3Applsci 12 10521 i005Applsci 12 10521 i006
4Applsci 12 10521 i007Applsci 12 10521 i008
5Applsci 12 10521 i009Applsci 12 10521 i010
Table 5. Petroglyph carvings observed on the scanned object surface.
Object NoCarvings-VisibilityCarvings-OccurrenceCarvings-Average Depth (mm)
1Clearly visibleSignificant1.5
2Barely seenSlight0.4
3ImperceptibleNone-
4ImperceptibleNone-
5Clearly visibleSignificant1.3
Publisher’s Note: MDPI stays neutral with regard to jurisdictional claims in published maps and institutional affiliations.