Article

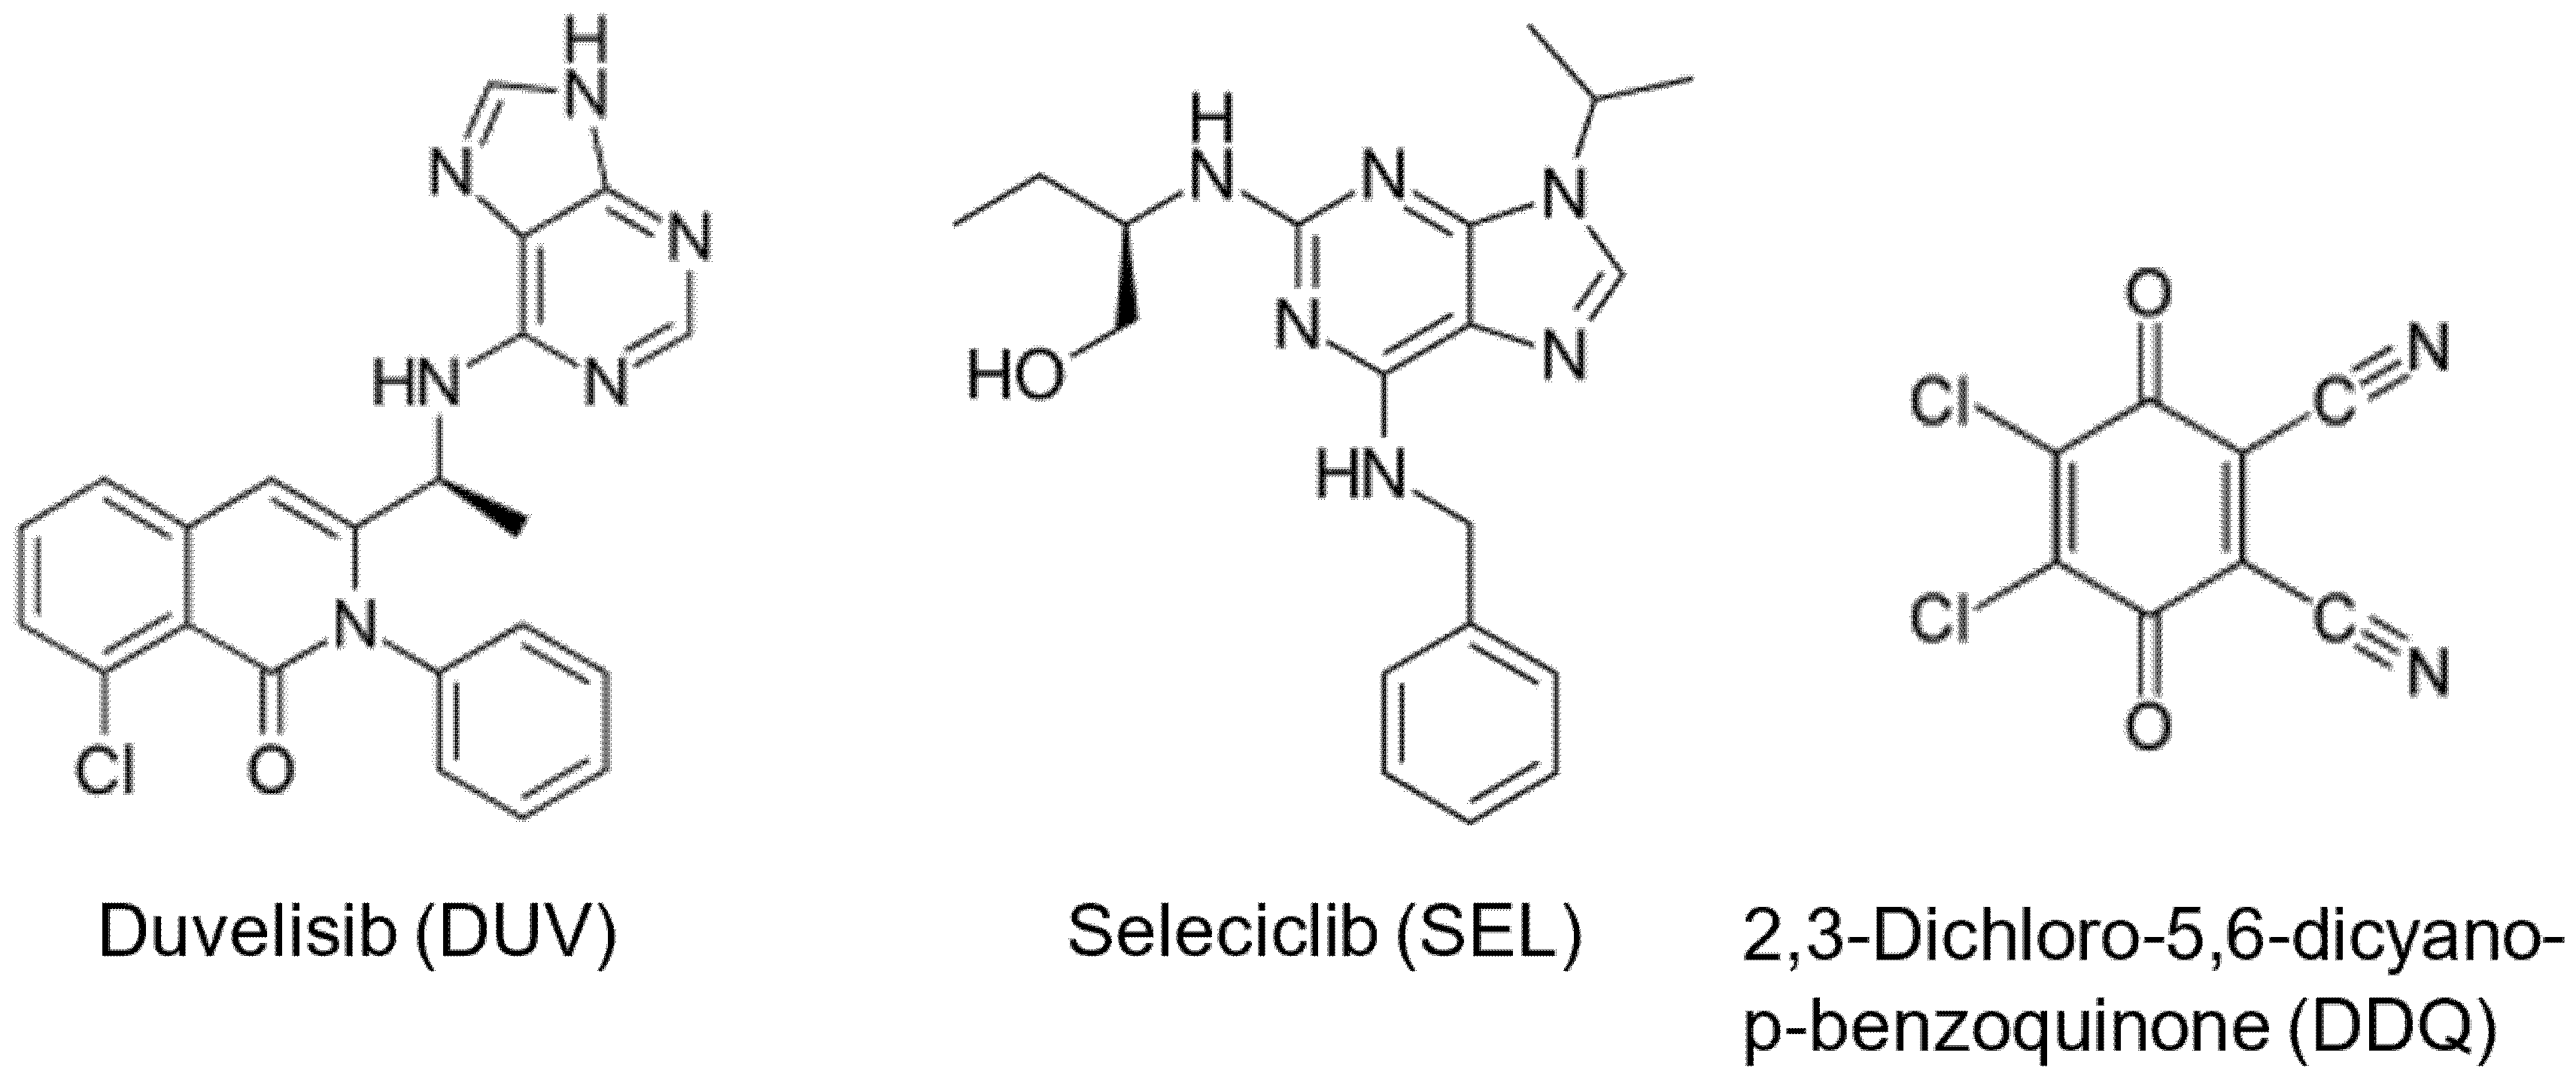
Development and Validation of 96-Microwell-Based Spectrophotometric and High-Performance Liquid Chromatography with Fluorescence Detection Methods with High Throughput for Quantitation of Duvelisib and Seliciclib in Their Bulk Forms and Capsules

Department of Pharmaceutical Chemistry, College of Pharmacy, King Saud University, P.O. Box 2457, Riyadh 11451, Saudi Arabia
*
Author to whom correspondence should be addressed.
Appl. Sci. 2022, 12(20), 10624; https://doi.org/10.3390/app122010624
Submission received: 19 September 2022 / Revised: 11 October 2022 / Accepted: 17 October 2022 / Published: 20 October 2022
(This article belongs to the Section Chemical and Molecular Sciences)

Abstract

:
The Food and Drug Administration (FDA) has approved duvelisib (DUV) for managing follicular lymphoma, small lymphocytic lymphoma, and relapsed or refractory chronic lymphocytic leukemia. Seliciclib (SEL) is a candidate drug for these cancers, neurodegenerative disorders, renal diseases, several viral infections, and chronic inflammation disorders. This work describes the development and validation of a 96-microwell-based spectrophotometric method (MW-SPM) and a high-performance liquid chromatography with fluorescence detection method (HPLC-FD) for the quantitation of DUV and SEL in their bulk forms and capsules. The MW-SPM is based on the formation of colored charge transfer complexes (CTCs) as products for the reactions of DUV and SEL, as n-electron donors, with 2,3-dichloro-5,6-dicyano-1,4-benzoquinone (DDQ), as a π-electron acceptor. The absorption intensity of the CTCs was measured by using an absorbance plate reader at 450 nm. The stoichiometric ratios of DUV:DDQ and SEL:DDQ were 1:1 and 1:2, respectively, and accordingly the reaction mechanisms were postulated. The HPLC-FD involved the chromatographic separation of DUV and SEL on a Hypersil™ Phenyl HPLC column (250 mm length × 4.6 mm i.d., 5 μm particle diameter) with a mobile phase composed of acetonitrile:acetate buffer, pH 4.5 (35:65, v/v) at a flow rate of 2.2 mL/min. DUV and SEL were detected at 370 nm after excitation at 280 nm. SEL was used as an internal standard (IS) for quantitation of DUV, and DUV was used as an IS for quantitation of SEL. Both MW-SPM and HPLC-FD were validated according to the guidelines of the International Council for Harmonization (ICH) for validation of analytical procedures. The linear ranges for both DUV and SEL were 14.52–200 µg/well (100 µL) and 0.12–3.2 µg/mL for MW-SPM and HPLC-FD, respectively. LOD values in MW-SPM for DUV and SEL were 4.4 and 3.17 µg/well, respectively; however, those for HPLC-FD were 0.03 and 0.05 µg/mL, respectively. The accuracy and precision of both methods were confirmed as the recovery values were ≥98.5% and the values of relative standard deviations (RSD) were ≤2.41%. Both methods were satisfactorily applied to the quantitation of DUV and SEL in their capsules; the mean recovery values were ≥99.2%. Both methods have simple procedures and high analytical throughput. Moreover, they consume a small volume of organic solvent; thus, they are economic and eco-friendly. Accordingly, the methods are valuable for routine use in quality control (QC) laboratories for quantitation of DUV and SEL in their bulk forms and capsules.

1. Introduction

The second biggest cause of mortality worldwide for both men and women is cancer. In 2018, it was responsible for 9.6 million fatalities, or 13% of all deaths. In 2030, 13.1 million people are predicted to die from cancer worldwide [1]. The most popular method for treating disseminated or systemic malignancies is chemotherapy [2]. All chemotherapeutic drugs employ their cytotoxic effect by interfering with the cellular synthesis and/or the role of RNA, DNA, and the proteins that maintain cells’ life. Thus, they have solemn side effects because of their non-specificity in killing cancer cells, rather than normal cells [2]. To overcome these problems, recent research involving life sciences and technologies has led to the introduction of new drug molecules, which are highly specific for definite cell targets (e.g., DNA, tubulin) present in both cancer and regular cells [3]. Currently, drug discovery research is directed towards targeting the key enzymes involved in the intracellular signal transduction pathway responsible for cancer cell differentiation and proliferation [4]. Among these drugs are those targeting kinases, particularly phosphoinositide 3-kinase (PI3K) and cyclin-dependent kinase (CDK).
PI3K is a lipid kinase that is essential for intracellular signalling and its pathway is most prone to mutation. There are different catalytic subunits for PI3K which are PI3Kα, PI3Kβ, PI3Kδ and PI3Kγ. These enzymes are activated through cell membrane protein–tyrosine kinase receptors. Following their activation, PI3K subunits α, β, and δ catalyze the phosphorylation of phosphatidylinositol-4,5-bisphosphate to yield phosphatidylinositol-3,4,5-triphosphate. Consequently, protein kinase B (pKB/Akt) and the mammalian target of rapamycin (mTOR) protein–serine/threonine kinases are activated, and promote the growth, differentiation, and proliferation of the cell [5]. CDKs are serine/threonine kinases that are overexpressed in different variants of cancer. In response to various extracellular and intracellular signals, CDKs govern, manage, and control cell division as well as influence transcription. Three cell-cycle-related subfamilies (CDK1, CDK4, and CDK5) and five transcriptional subfamilies (CDK7, CDK8, CDK9, CDK11, and CDK20) encompass the CDK family. Deregulation of CDKs is a mutual character of several illnesses, including cancer, and inhibition of definite members by a drug has produced highly positive therapeutic outcomes [6]. Drugs targeting PI3K and CDKs are specific, potent, have minimum side effects, and have supremacy over regular chemotherapeutic drugs in the therapy of different types of cancer [7,8,9,10,11]. Duvelisib (DUV) and seliciclib (SEL) are important members of the chemotherapeutic drugs which exert their action by selective inhibition of PI3K and CDK, respectively.
DUV (also known as IPI-145) is a small molecule and its chemical name is: 8-chloro-2-phenyl-3-[(1S)-1-(7H-purin-6-ylamino) ethyl]isoquinolin-1-one (Figure 1). It has a molecular formula of C22H17ClN6O and its molar mass is 416.86 g/mol [12]. DUV was granted approval by the FDA for the therapy of relapsed or refractory chronic lymphocytic leukemia/small lymphocytic lymphoma, and follicular lymphoma. It can also be used to treat T-cell lymphoma, solid tumors, and non-Hodgkin’s lymphoma. DUV inhibits both PI3Kδ and PI3Kγ via potent ATP-competitive inhibition; however, it has higher affinity toward PI3Kδ over PI3Kγ [13,14,15,16].
SEL (also known as (R)-roscovitine and CY-202) is a small purine analogue molecule (Figure 1). The chemical name of SEL is (2R)-2-{[6-(benzylamino)-9-isopropyl-9H-purin-2-yl] amino}-1-butanol. The chemical formula of SEL is C19H26N6O and its molecular weight is 354.45 [17]. SEL is a drug candidate for the therapy of cancers (non-small cell lung cancer, nasopharyngeal cancer, and lymphoma), neurodegenerative disorders, renal diseases, several viral infections (HIV, herpes simplex), and chronic inflammation disorders. It functions by competing with ATP for binding at the ATP-binding site of CDKs (2, 7, and 9) by cooperating with the amino acids that line up the ATP-binding pocket of the CDK catalytic domain leading to disruption of cell cycle progression [18].
The effective and safe treatment with DUV is basically depending on the characteristics of its commercialized copiktra capsules, in terms of purity and drug content. As well, the successful therapeutic benefits of SEL will encourage the development and approval of new pharmaceutical formulations for SEL. For pharmaceutical quality control (QC) of DUV and SEL, a proper analytical method with a simple procedure and high-throughput is required. Extensive literature review revealed that most of the existing methods for DUV [19,20,21,22,23] and SEL [24,25] were dedicated to the quantitation of the drugs in biological samples. The methods available for determination of DUV [26] and SEL [27,28,29] in their bulk and/or capsules are very limited. Technology scientists have been creating analytical techniques with straightforward procedures and high throughput capacities in an attempt to enhance the QC analysis and increase its productivity [30]. These techniques allow for the quick processing of large numbers of samples, which could lead to the uniformity of pharmaceutical formulations, the quick identification of active chemicals, and other pharmaceutical industry activities. This work focuses on the development and validation of two new, straightforward, high-throughput methodologies for DUV and SEL quality control. These two methods are the microwell spectrophotometric method (MW-SPM) and HPLC with fluorescence detection (HPLC-FD) methods.

2. Experimental

2.1. Apparatus

A double-beam ultraviolet-visible spectrophotometer (V-530: JASCO Co. Ltd., Kyoto, Japan) was used for the photometric measurements. A fluorimeter (FP-8200: JASCO Co. Ltd., Kyoto, Japan) was used for recording the fluorescence spectra. The width of the slits of both monochromators for the excitation and emission was set at 5 nm. The Spectra Manager® software was used to convert all recorded spectra to ASCII format. A microplate absorbance reader (ELx808: Bio-Tek Instruments Inc., Winooski, VT, USA) was controlled by KC junior software. The HPLC instrument (Shimadzu Corporation, Kyoto, Japan) was assisted with an auto-sampler and with a fluorescence detection (set at λex 280 nm and λem at 370 nm). The system was controlled, and data was acquisitioned by Labsolutions software provided with the system. Microprocessor laboratory pH meter (BT-500: Boeco, Hamburg, Germany), digital balance (JB1603-C/FACT: Mettler-Toledo International Inc., Zürich, Switzerland), and water purification system (Purelab Flex: ELGA Veolia Ltd., High Wycombe, UK) were used.

2.2. Chemicals and Materials

The purities of duvelisib (DUV) and seliciclib (SEL) were >99%; they were bought from LC Laboratories in Woburn, USA. From Sigma-Aldrich Corporation, 2,3-Dichloro-5,6-dicyano-1,4-benzoquinone (DDQ) was bought (St. Louis, MO, USA). Its methanolic solution (0.5%, w/v) was freshly prepared each day (analytical grade). Corning/Costar Inc. provided transparent 96-microwell plates for the experiment (Cambridge, MA, USA). Sigma Chemical Corporation provided a Finnpipette adjustable 8-channel pipette (St. Louis, MO, USA). Phenomenex provided the 250 mm × 4.6 mm, 5 m Hypersil™ Phenyl HPLC column (Torrance, CA, USA). Purchasable from the Saudi local market, Copiktra® capsules (Verastem, Inc., Boston, MA, USA) were marked to contain 25 mg of DUV per capsule. All of the solvents were chromatography-grade (Merck, Darmstadt, Germany). Analytical-grade chemicals were employed throughout the experiment.

2.3. Preparation of Standard and Sample Solutions

2.3.1. Standard Solutions

A weighed quantity (50 mg) of the drug (DUV or SEL) was quantitatively transferred into 25-mL calibrated flasks dissolved in 1 mL dimethyl sulfoxide and made up to volume with methanol to produce a stock solution of 2 mg/mL. The stock solutions were stable for a minimum of one week when kept in a refrigerator. The stock solutions were diluted with methanol to yield working solutions in the concentration range of 125–2000 and 0.1–3.2 µg/mL for the MW-SPM and HPLC-FD, respectively.

2.3.2. Capsules Sample Solutions

Commercialized Copiktra® capsules were used for DUV; however, laboratory-made capsules were prepared and used for SEL. These capsules were prepared by thoroughly mixing an accurate amount (100 mg) of SEL material with 25 mg of each of the inactive ingredients (starch, lactose monohydrate, microcrystalline cellulose, and hydroxypropyl cellulose). An exact weight of the prepared mixed powder equivalent to 50 mg of each of DUV and SEL was transferred to a 25-mL calibrated flask. One milliliter of DMSO was added to completely dissolve the powder, and the volume was made up with methanol. The contents were shaken well, and the complete dissolution of DUV and SEL was ensured by sonicating the flasks for 5 min. Each flask’s contents were filtered off, and the first portions of the filtrate were rejected. The filtrate was diluted with methanol and analyzed by the MW-SPM and HPLC-FD.

2.4. Recommended Procedures

2.4.1. MW-SPM

Ninety-six-microwell plates were filled with accurate volumes (100 µL) of the standard or capsule sample solution with different concentrations of DUV or SEL (12.5–200 µg/well). After adding 100 µL of DDQ reagent solution (0.5%, w/v), the reaction was set to run for five minutes at ambient temperature (25 ± 2 °C). The absorbance microwell-plate reader was used to measure the solutions’ absorbance at 450 nm.

2.4.2. HPLC-FD

The HPLC analysis of DUV and SEL was carried out on a Hypersil™ Phenyl HPLC column (250 mm × 4.6 mm, 5 μm). The temperature of the column was fixed at 25 ± 2 °C. Separations were accomplished using the isocratic mode for elution with a mobile phase of acetonitrile: acetate buffer, pH 4.5 (35:65, v/v) pumped at a flow rate of 2.2 mL/min. The mobile phase was degassed by pumping through with helium gas for 15 min and ultrasonic bath for 10 min. The injection volume was 20 µL. The detector was set at 280 nm and 370 nm for the excitation and emission, respectively. The system was controlled, and data was acquisitioned by using Labsolutions software provided with the system. For determination of DUV, SEL was used as IS, and for determination of SEL, DUV was used as IS. For generation of the calibration curve of DUV, standard calibrator solutions were prepared to contain varying concentrations of DUV (0.1–3.2 µg/mL); each solution contained a fixed concentration (0.8 µg/mL) of SEL as IS. For generation of the calibration curve of SEL, standard calibrator solutions were prepared to contain varying concentrations of SEL (0.1–3.2 µg/mL); each solution contained a fixed concentration (1.6 µg/mL) of DUV as IS. The relation of the peak area ratios of analytes (DUV and SEL) to IS (SEL or DUV, respectively), on Y-axis and the analyte concentration (X-axis) was utilized as the basis for the quantitation. The regression equations were computed and utilized for DUV and SEL quantitation in their samples.

3. Results and Discussion

3.1. Development of MW-SPM

3.1.1. Strategy for Method Development and Its Design

Since spectrophotometric analyzers are frequently employed for assessment of pharmaceutical formulations, particularly when examining the uniformity of contents and characteristics of dissolution of solid dosage forms, spectrophotometric methods are of significant importance in drug analysis [31]. The spectrophotometric methods based on the formation of colored CTCs are widely used in the field of pharmaceutical QC of many pharmaceutical compounds [32,33,34,35]. However, the conventional protocols of these methods are performed manually and accordingly their throughput is low. In addition, these methods also consume large volumes of costly organic solvents, and more importantly, the analyst is exposed to the poisonous effects of the organic solvents [36,37,38,39]. Briefly, many reports assured the strong link between the exposure to these solvents in laboratories and the occurrence of neurotoxic signs [36], elevated incidence of some fertility disorders [37], elevated chance of spontaneous abortion between all pregnant women [38], and elevated danger of leukemic and lymphocytic malignancy in both males and females [39]. Accordingly, the reduction of human contact to the organic solvents have become a concern to health/environment protection agencies and administrations.
In a previous study, Darwish et al. [40] successfully developed a novel methodological for reducing the consumption of organic solvents in the spectrophotometric analysis involving the formation of CTCs. This approach involved the 96-well assay plate as vessels in which the reactions were accrued out in situ, and an absorbance plate reader for measuring the color intensity in the 96-wells assay plate, simultaneously in less than 1 min. This approach significantly reduced the consumption of organic solvents and displayed high throughput. Therefore, the present research was devoted to developing a similar methodology for DUV and SEL. The CT reaction was taken into account in this study because of the good electron-donating property of both DUV and SEL, which is due to the presence of multiple basic amino groups in their chemical structures (Figure 1). A previous study involving charge transfer (CT) reactions with some electron acceptors of polyhalo-/polycyanoquinone derivatives [41] revealed that DDQ (Figure 1) is a very reactive acceptor, as it reacts instantaneously and gives highly sensitive signals. Therefore, DDQ was selected to develop the method described herein for both DUV and SEL.

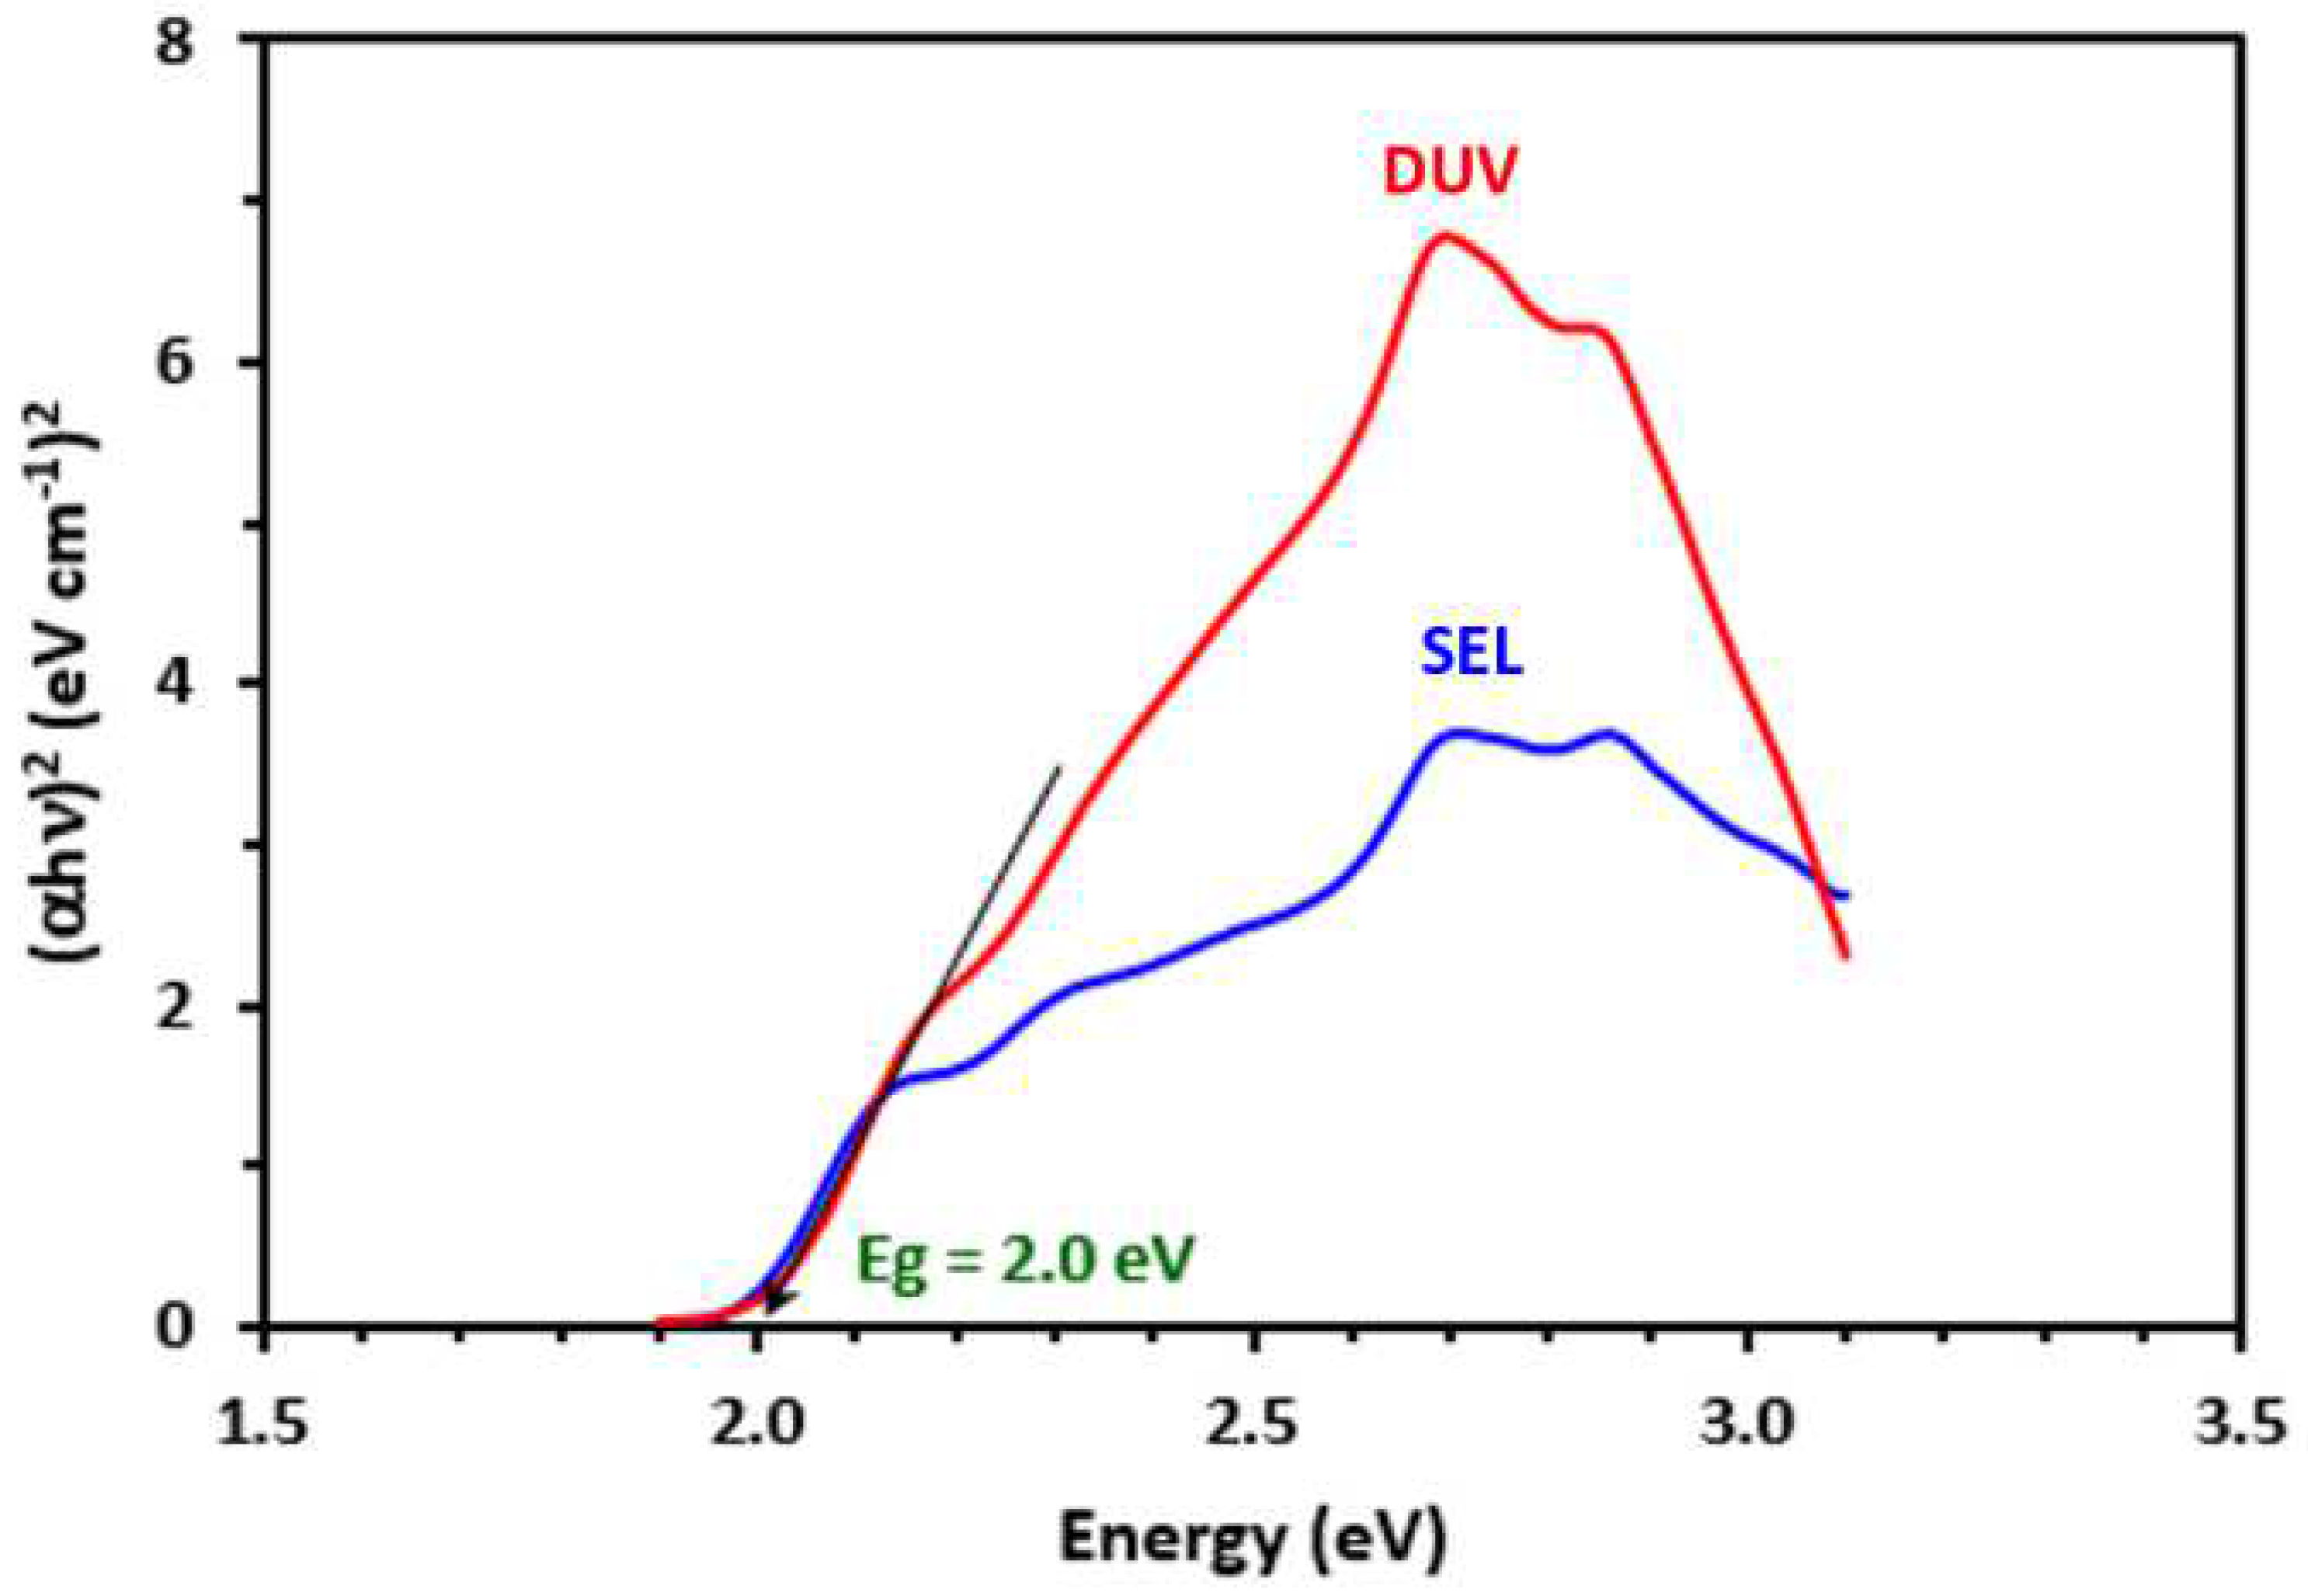
3.1.2. UV-Visible Absorption Spectra and Gap Band Energy

The UV-visible absorption spectra of methanolic solutions of DUV and SEL were recorded in the range of 200–800 nm (Figure 2). The spectrum of DUV showed dual discrete maxima (λmax) at 269 and 341 nm. The spectrum of SEL showed three λmax at 210, 231, and 291 nm. Both DUV and SEL did not show any UV-absorption at wavelengths >400 nm. The spectrum of DDQ did not show light-absorption at wavelengths >340 nm. Solutions of DUV and SEL were separately mixed with DDQ solution, and the reactions were proceeded at 25 ± 2 °C (room temperature), and the light absorption spectra of the mixtures were recorded versus DDQ reagent as a blank solution. Reactions of both DUV and SEL gave red-colored products showing new absorption bands at 460 nm. The absorption intensity of these new bands increased with the increase of DUV and SEL concentrations in the reaction mixtures (Figure 3). This gradual ongoing increment in the new absorption bands was indicative of the yielding of new products. The shape and pattern of these new absorption bands were identical to that of the radical anion of DDQ reported in the literature [42,43,44]. Therefore, the reaction was suggested to proceed in polar solvent (methanol) via CT for each of DUV and SEL as an electron donor (D) to DDQ as a π-electron acceptor (A) to form the complex (D–A), which subsequently dissociated and eventually gave the red-colored radical anion of DDQ:
In the additional confirmation for the CT property of the reaction, the red color of the reaction mixture disappeared upon its acidification with mineral acids. These results were approval of the formation of the CT complexes upon reactions of DUV and SEL with DDQ. Calculations were carried out to ascertain the band gap energy (Eg), which is the lowest amount of energy required to cause an excitation of an electron from its lower-energy valence band into its higher energy in order to participate in a conduction band formation [45]. Tauc plots (Figure 4) were generated for the Eg calculation by graphing energy values (hυ, in eV) against (αhυ)2. By projecting the linear portions of the graphs to (αhν)2 = 0, the values of Eg were calculated [46]. For both DUV and SEL, the Eg was found to be 2.1 eV. This small value is indicative of the easiness of electron transfer from both DUV and SEL to DDQ and giving of the CTC absorption bands.

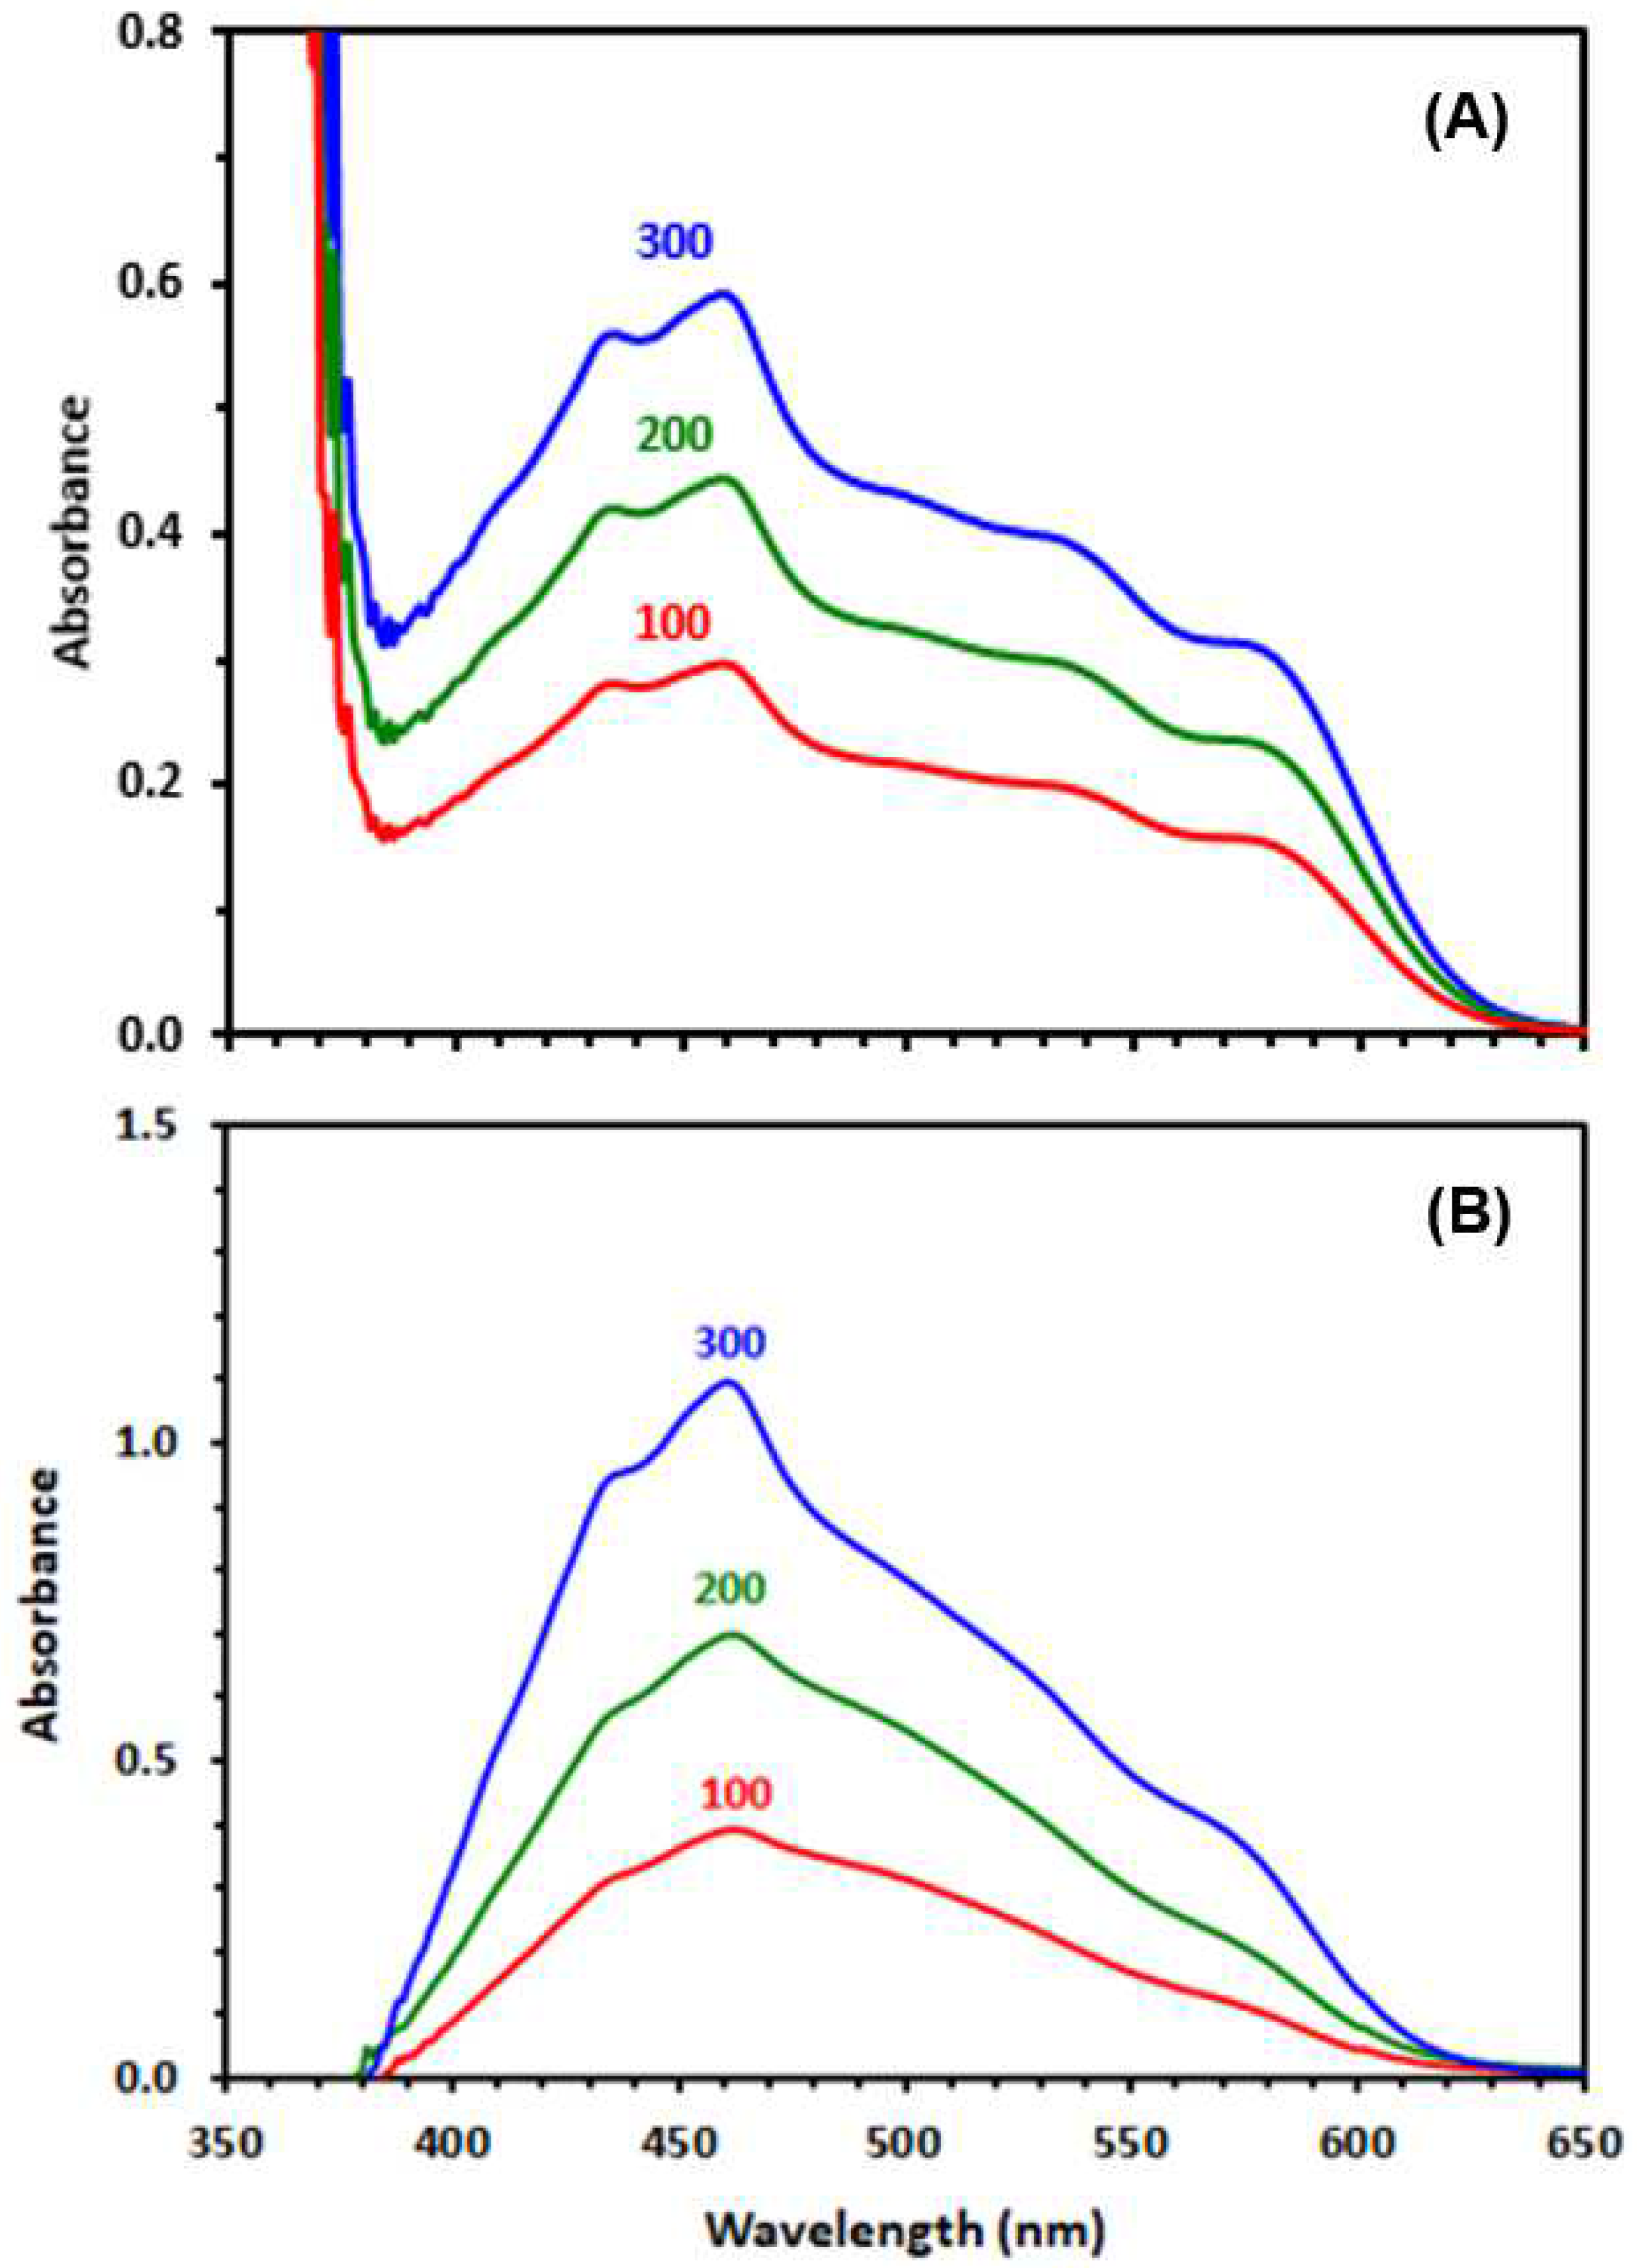
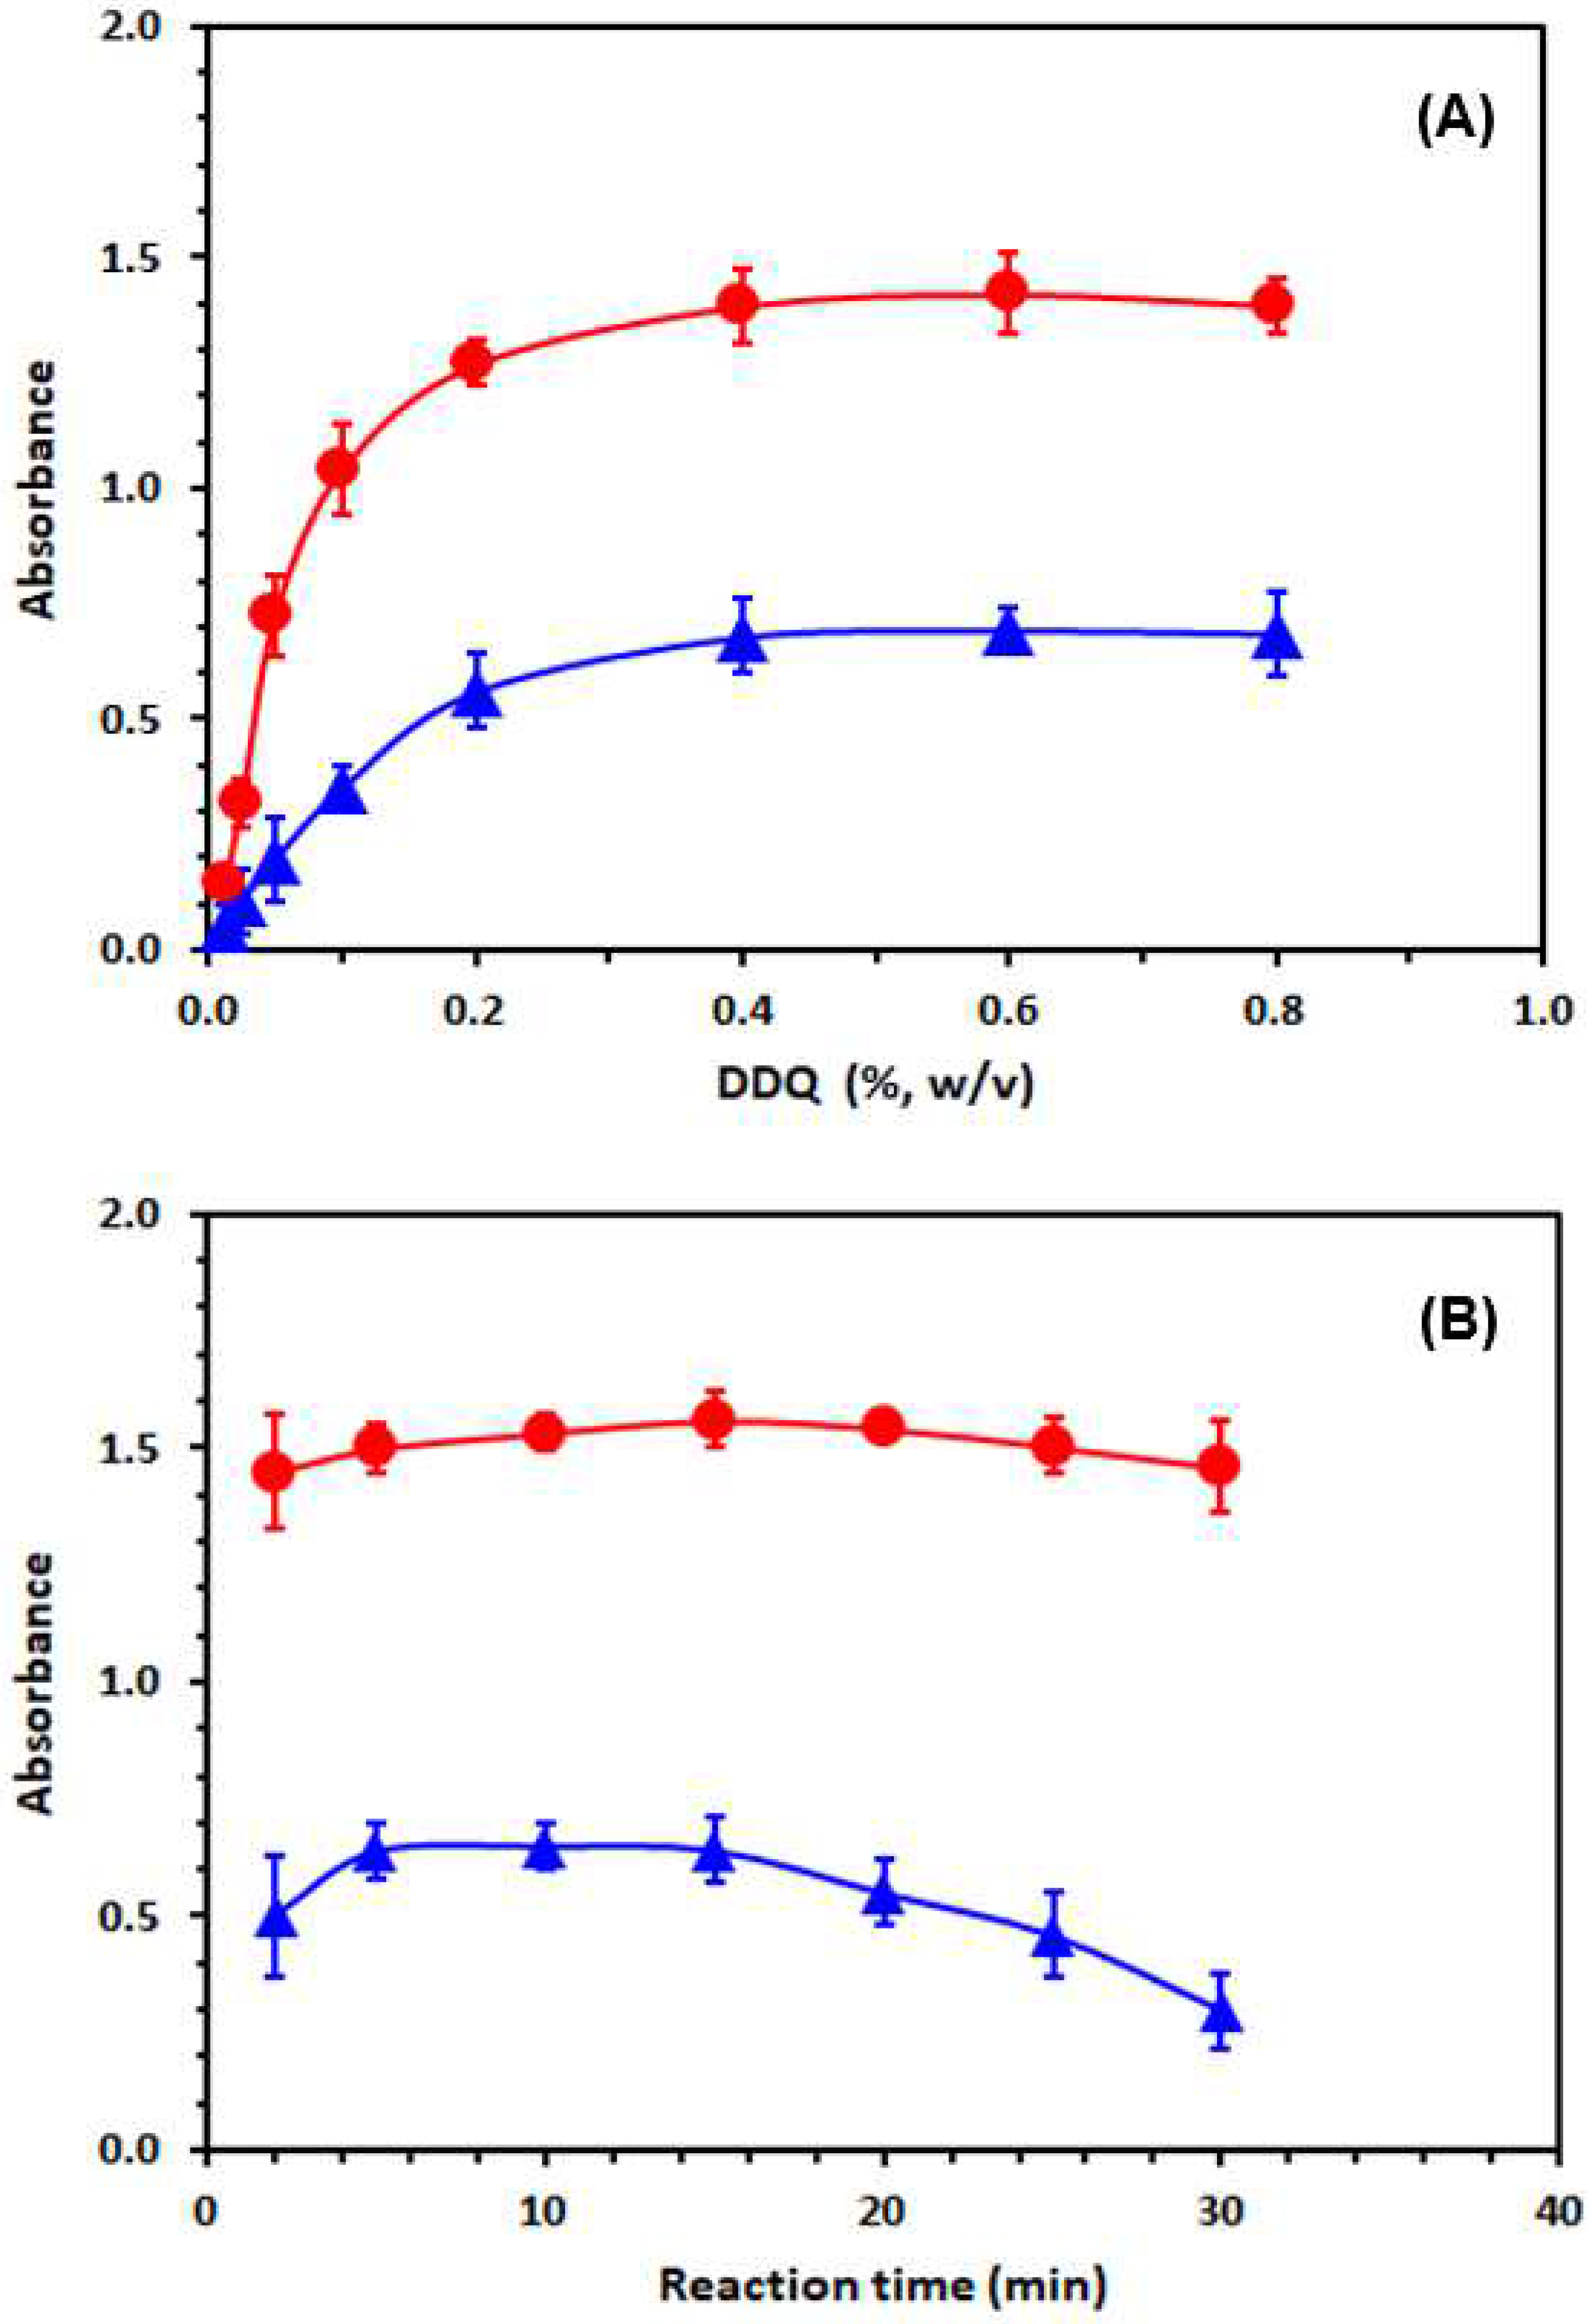
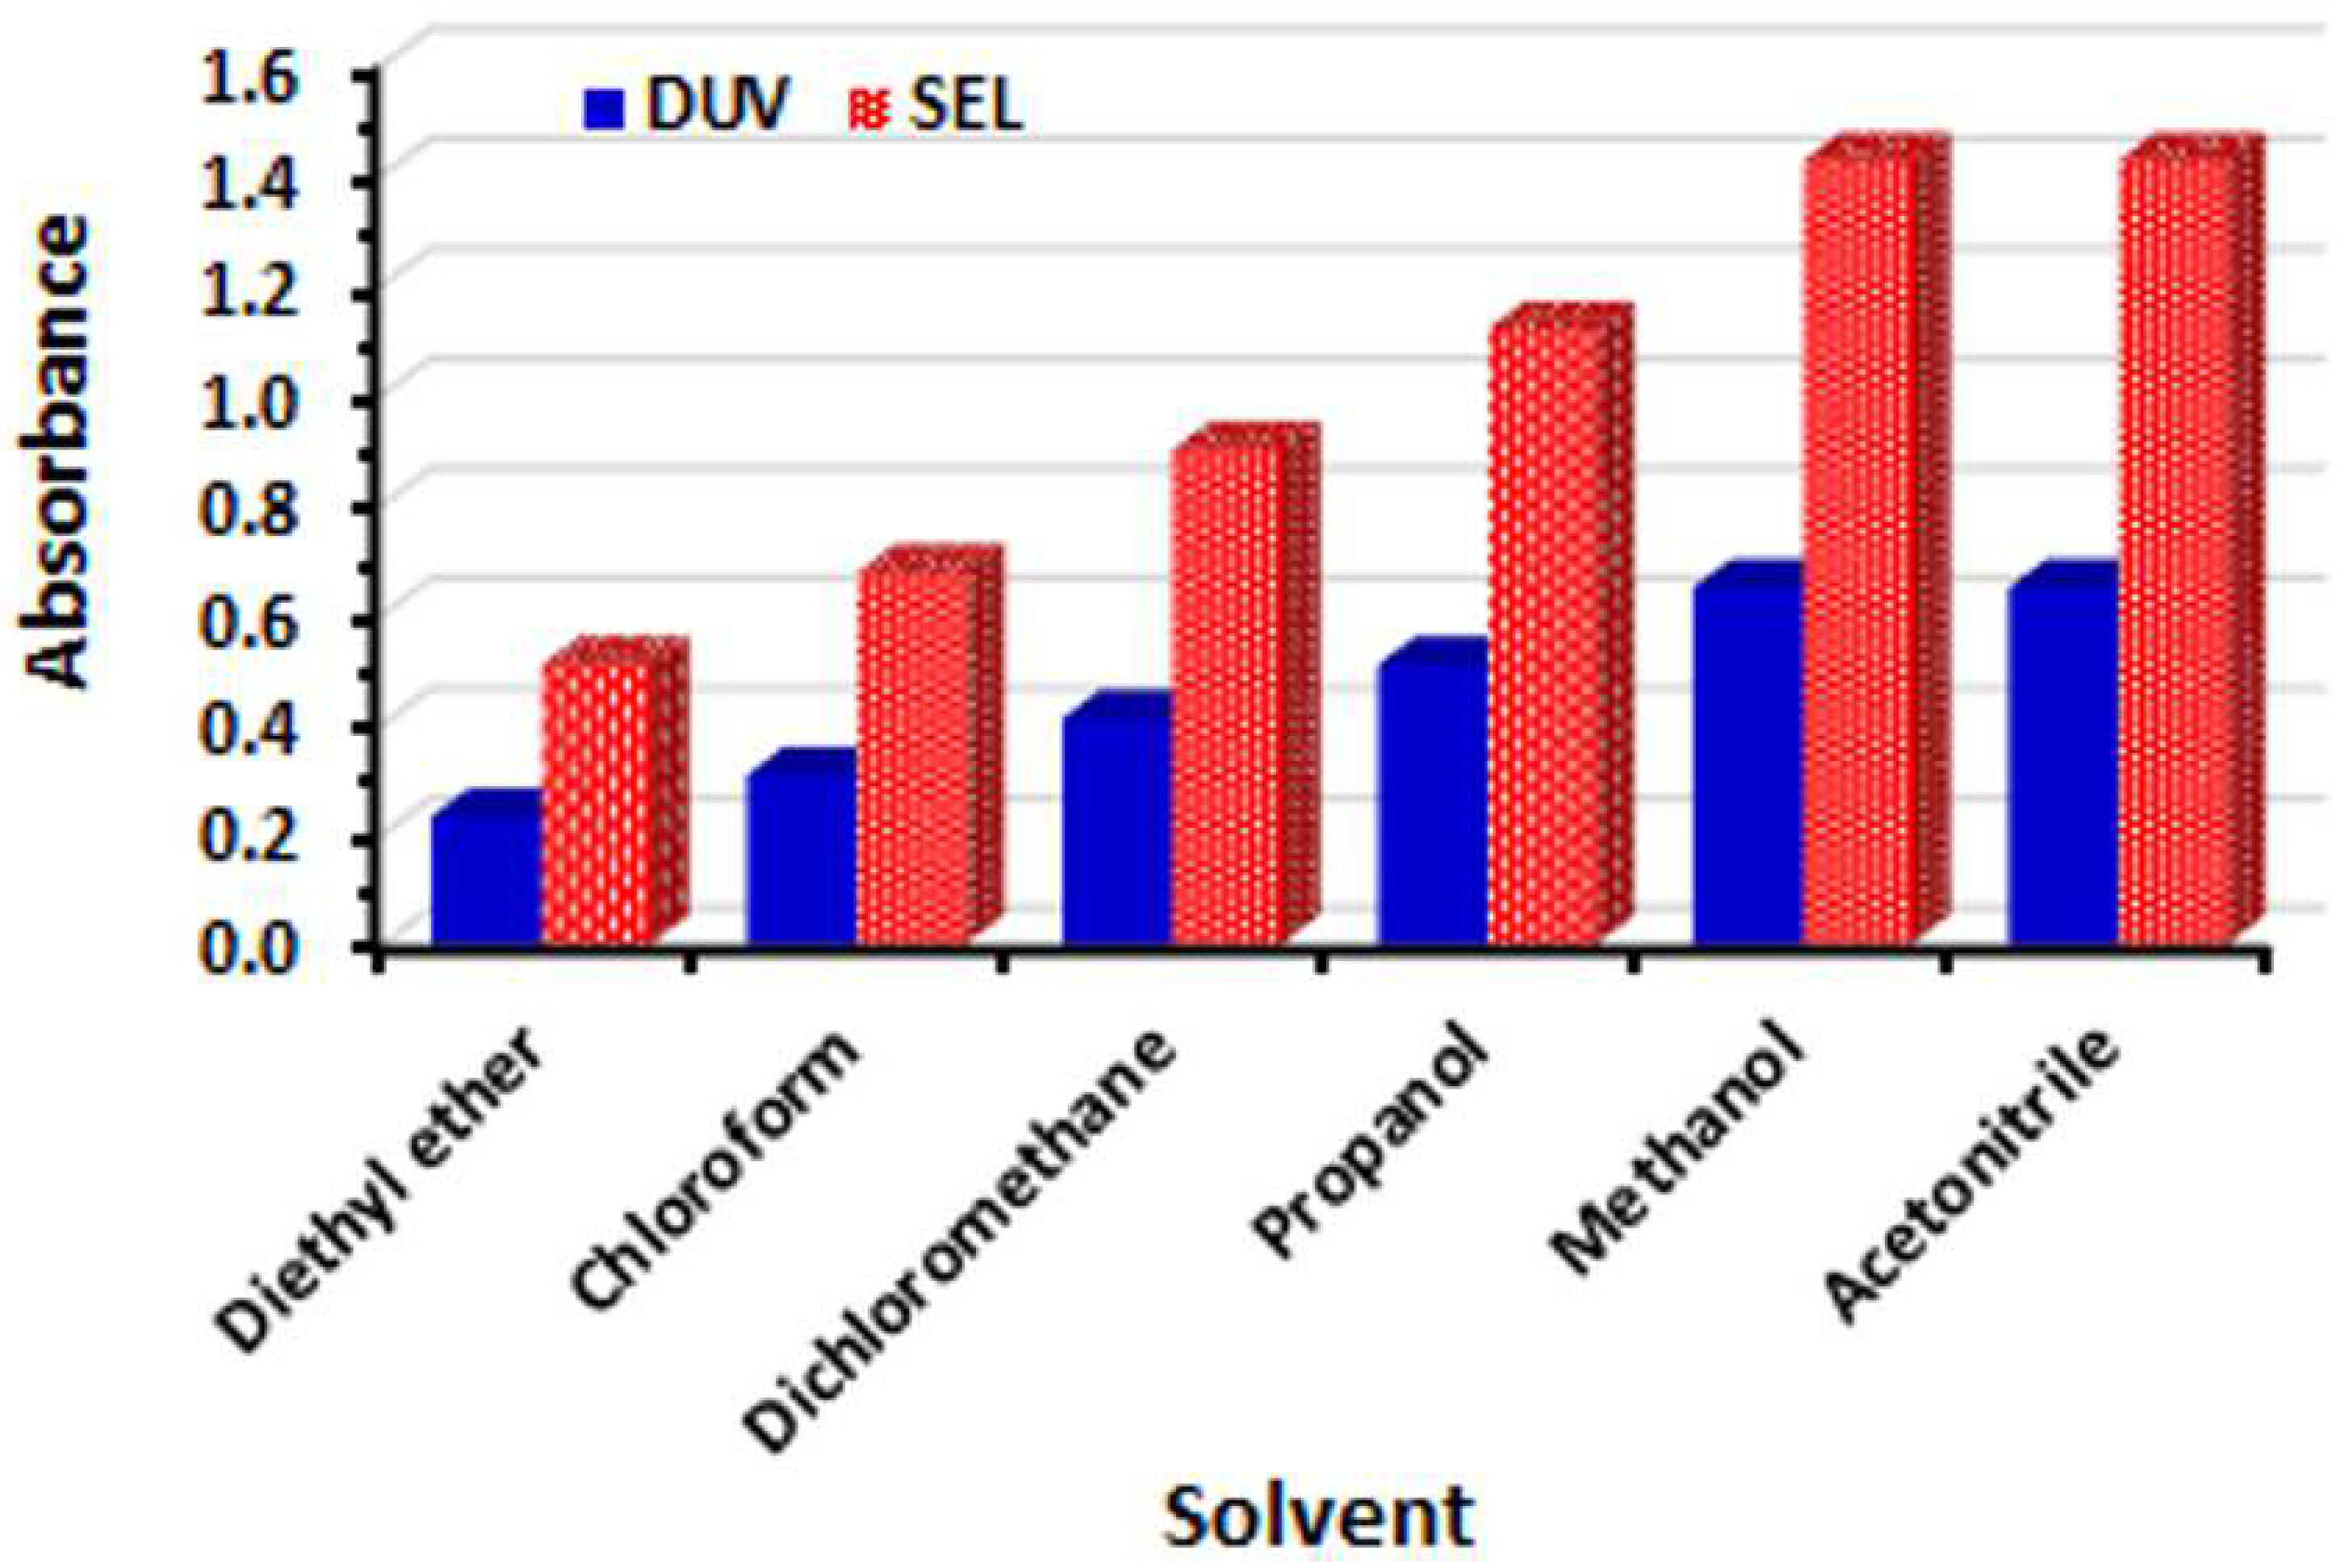
3.1.3. Optimization of Reaction Conditions

Reaction conditions for the accomplishment of the reactions in the 96-microwell plate were adjusted by changing each variable in a turn while the other variables remain constant. All the readings were taken using a plate reader at 450 nm (the nearest filter to the λmax of the CT complexes of DUV and SEL with DDQ). As demonstrated in Figure 5A, the results of several concentrations of DDQ and times of reaction at room temperature (25 ± 2 °C) showed that the ideal DDQ concentration was 0.5% (w/v). Investigations were conducted to refine the reaction time, and it was revealed that the reaction required 5 min to complete in the case of DUV; however, it was instantaneous in the case of SEL (Figure 5B). In both DUV and SEL, better reading precisions were achieved when measurements were performed after 5 min from the reaction start time. Furthermore, the readings remained stable for 30 min in the case of SEL; however, it remained stable for 15 min in the case of DUV. The reactions in all the further experiments were left to proceed for min before taking the readings. The effect of temperature on the reactions of both DUV and SEL with DDQ was studied at variant temperatures (25–50 °C), and the findings revealed that the reactions were independent of the temperature in the studied range. Therefore, the reactions in the subsequent experiments were performed at ambient temperature (25 ± 2 °C).
For choosing the most appropriate solvent for the ideal reaction and color development, the reactions of DUV and SEL with DDQ were performed in different solvents of varying polarities (acetonitrile, methanol, propanol, diethyl ether, dichloroethane, and chloroform) and the results are shown in Figure 6. It was observed that the reactions in polar solvents (e.g., acetonitrile and methanol) offered greater readings compared to those acquired in solvents of low polarity (e.g., diethyl ether and dichloroethane). This outcome was believed to be due to the full electron transfer from DUV and SEL molecules (electron donors) to DDQ (electron acceptor) that occurs in polar solvents. The subsequent experiments were carried out in methanol.
Table 1 gives an overview of the examined conditions and the optimum value that was chosen for the construction of the MW-SPM for DUV and SEL.

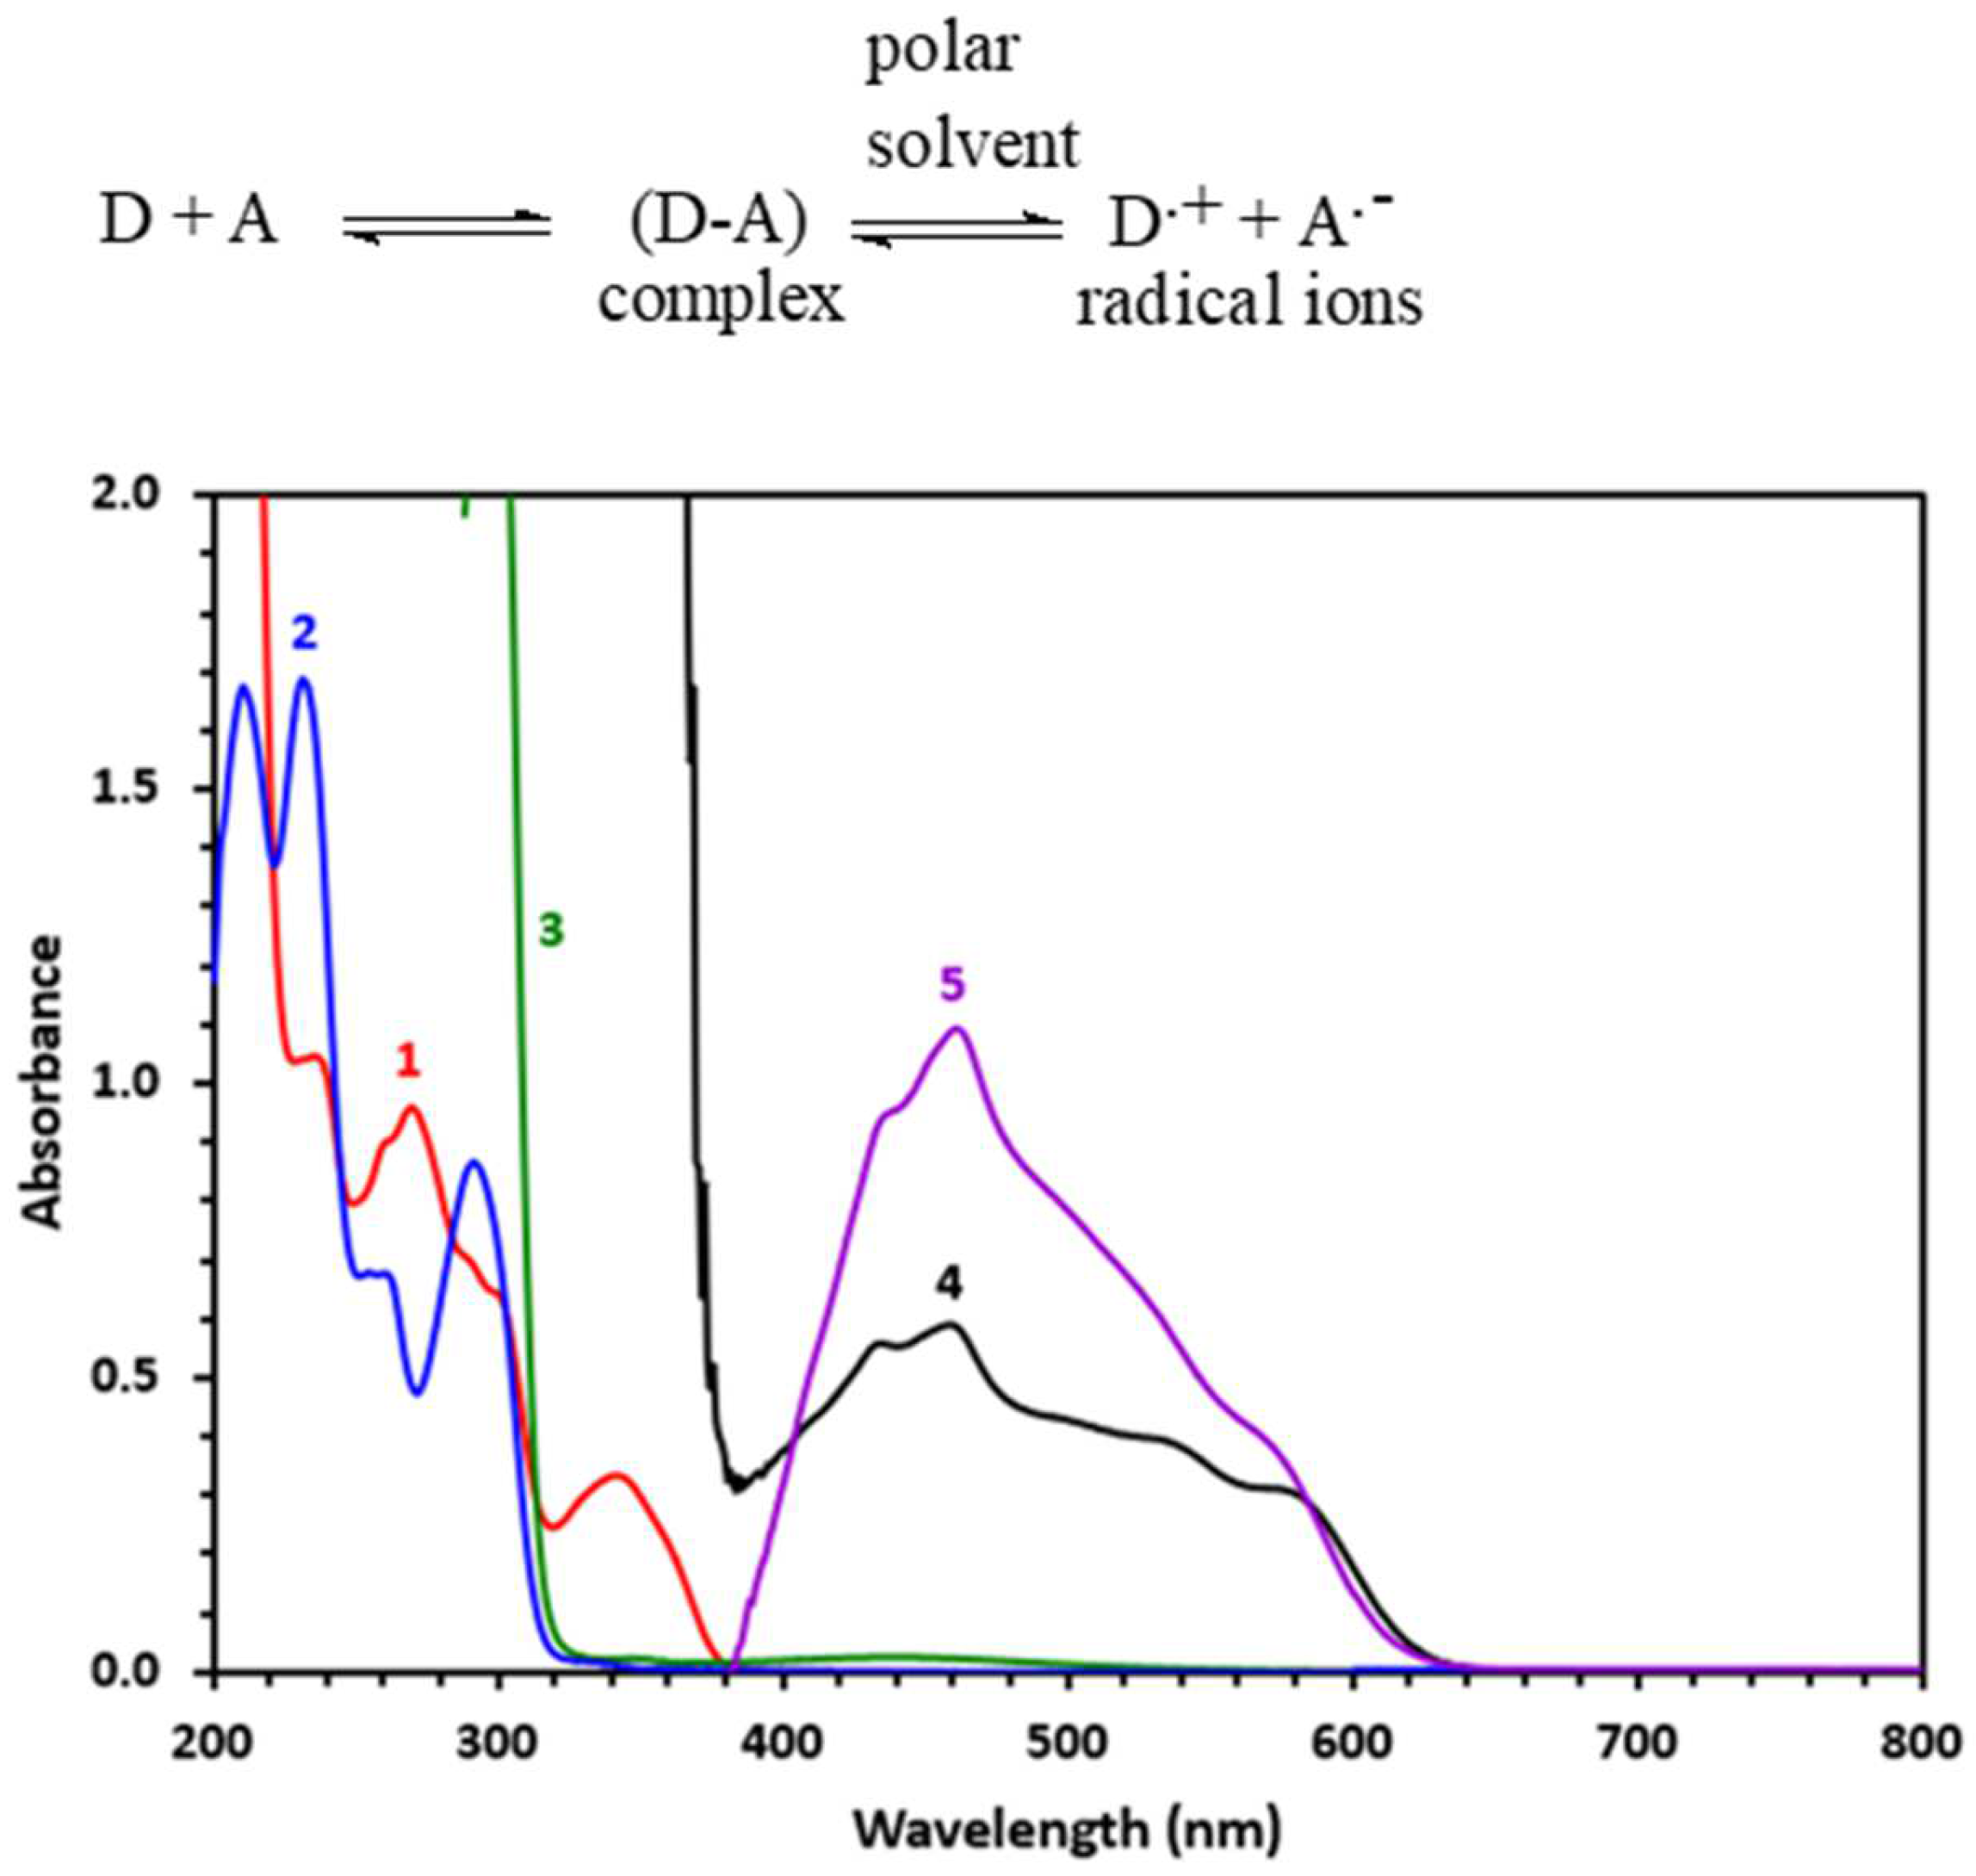
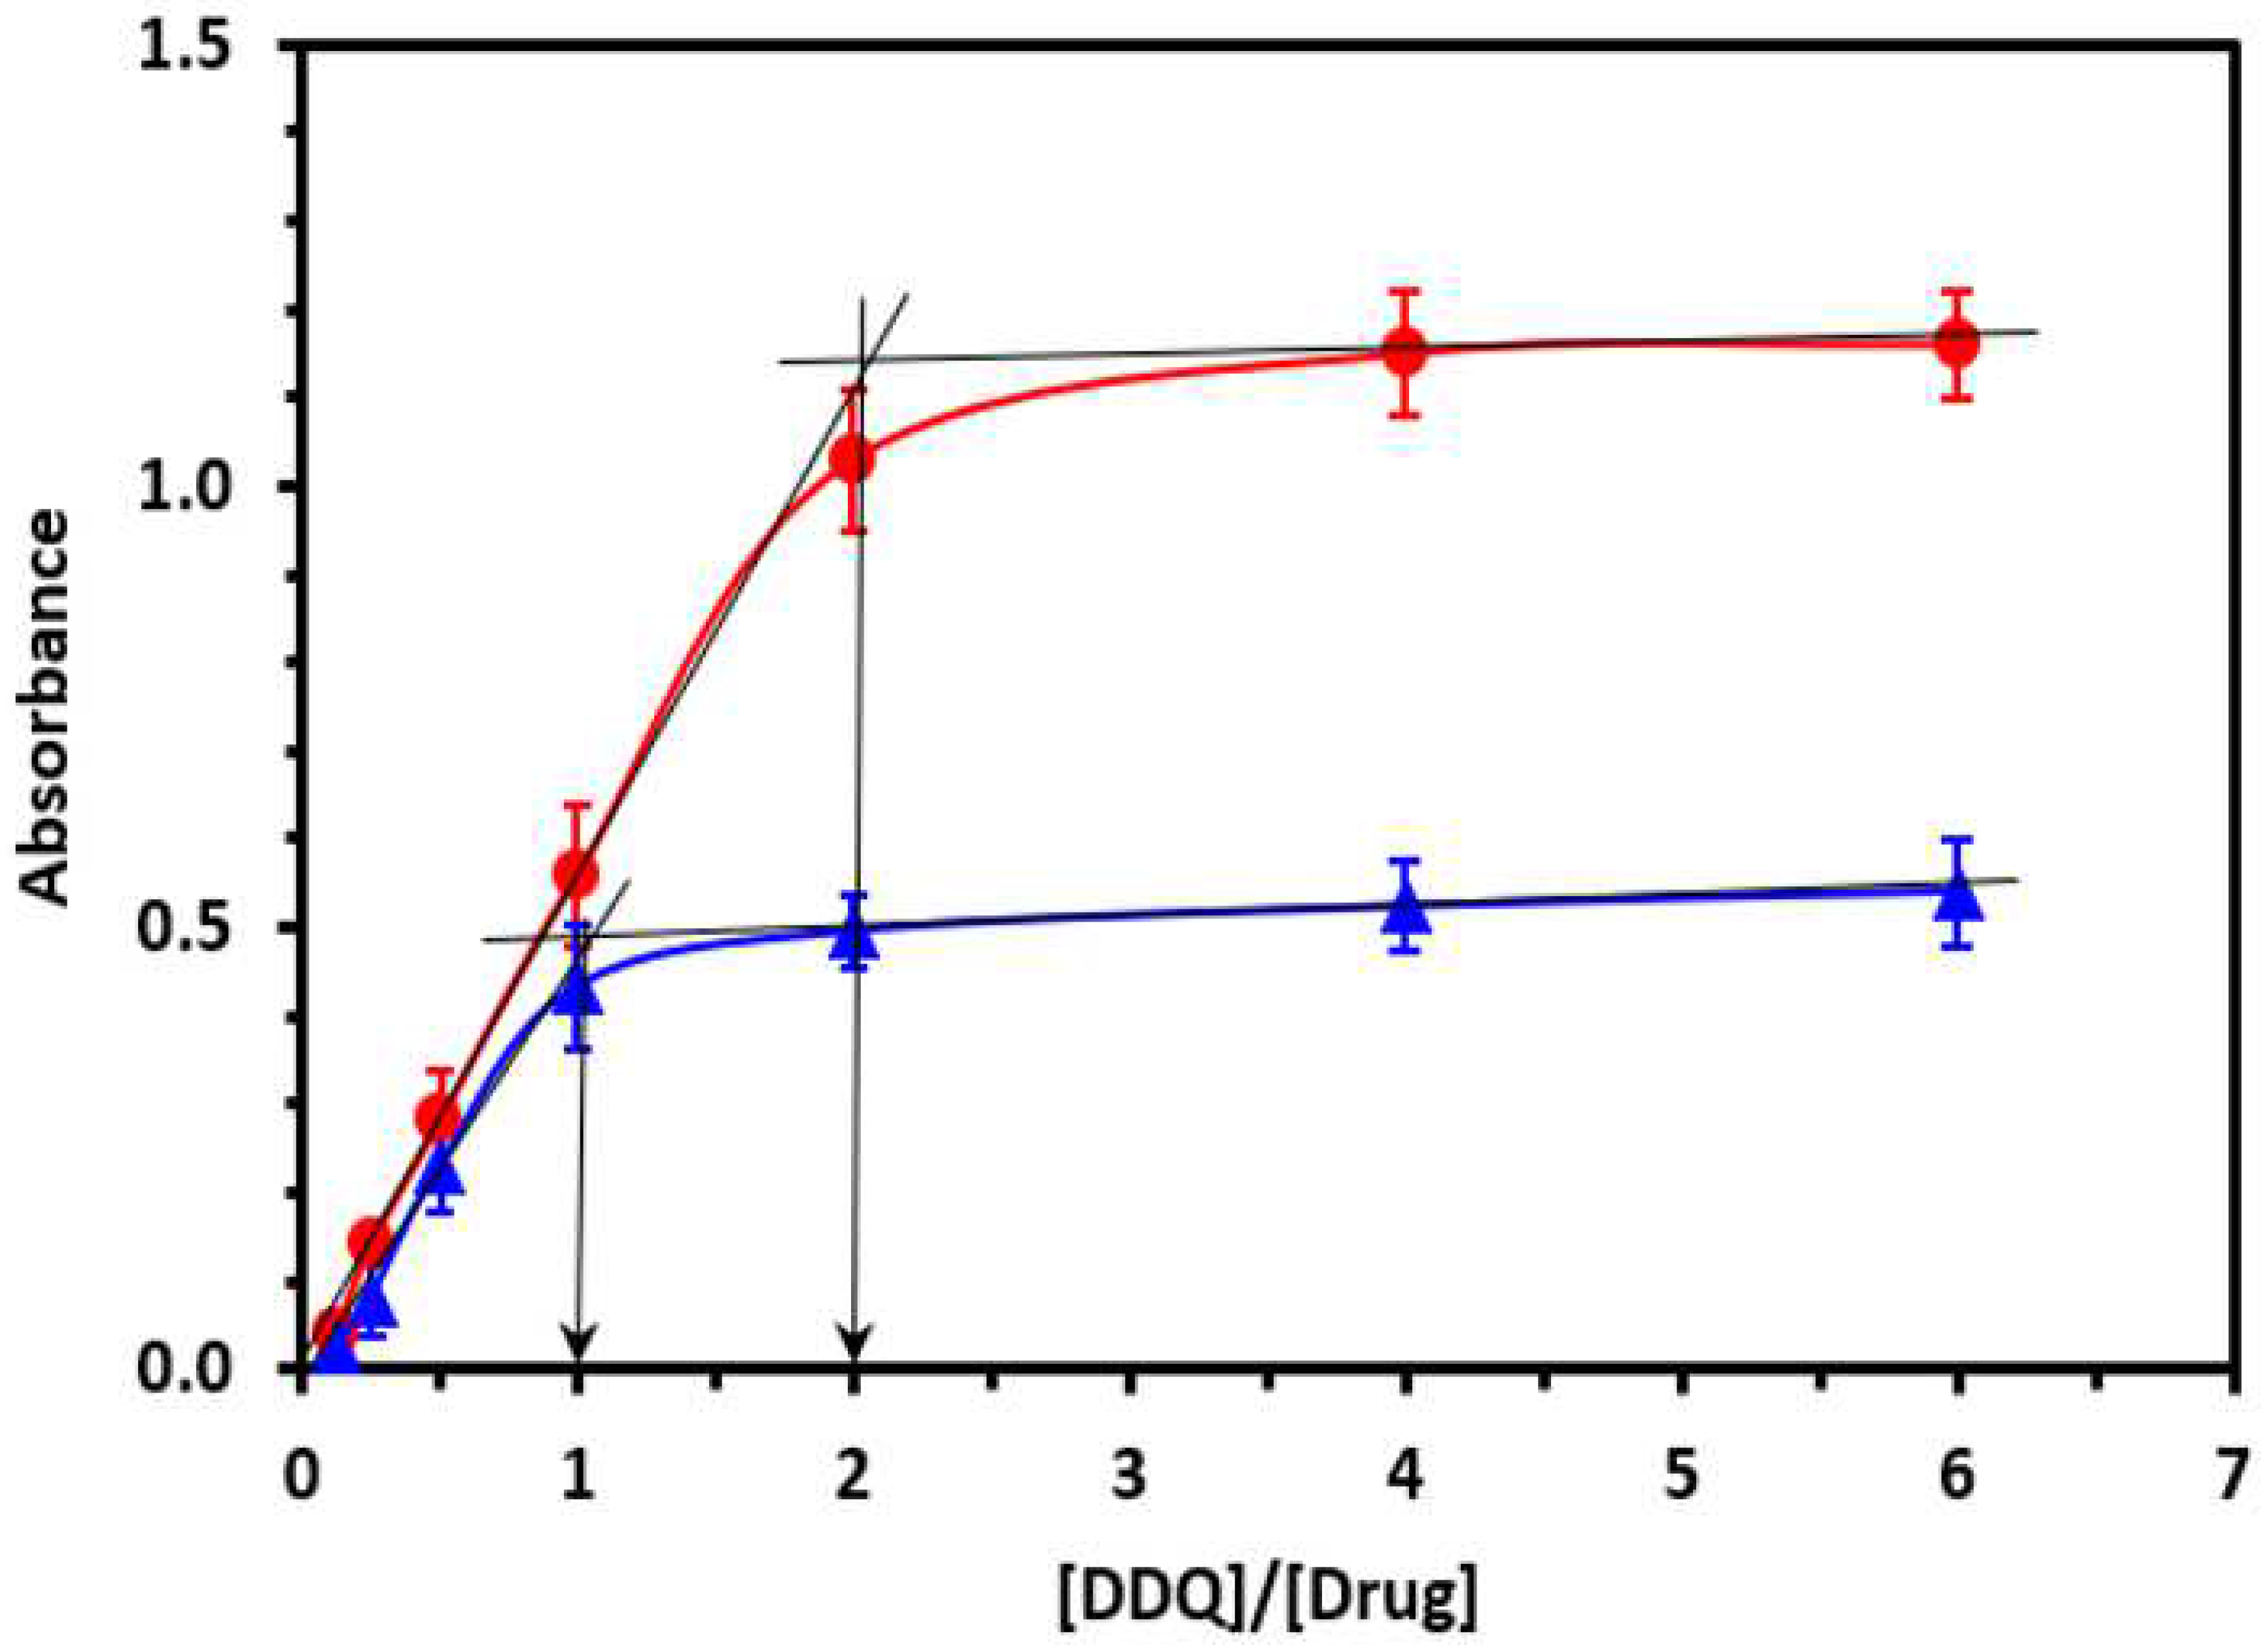
3.1.4. Molar Ratios and Mechanisms of the Reactions

The molar ratio of DUV and SEL to DDQ was calculated by a spectrophotometric titration method [47]. The ratio of DUV: DDQ was 1:1, and that of SEL: DDQ was 1:2 (Figure 7). These ratios indicated that only one electron-donating site on the DUV molecule contributed to the yielding of the CT complex with one molecule of DDQ; however, two sites on SEL molecule contributed to the reaction with two molecules of DDQ. Energy minimization for both DUV and SEL molecules was carried out, and the density of electron on each atom was computed for DUV and SEL molecules (Figure 1). Utilizing molecular orbital computation software (MOPAC), molecular dynamics computation software (MM2 and MMFF94), and CS Chem3D Ultra, version 16.0 (CambridgeSoft Corporation, Cambridge, MA, USA), the energy minimization and charge calculation were carried out. For DUV molecules, the highest electron density was located on the nitrogen atom of –NH– group (amine nitrogen). This density was –0.9 (the negative signs indicate the negative electron density. For SEL, the maximum electron densities were positioned on the two nitrogen atoms of the –NH– groups (amine nitrogens); both nitrogen atoms have the same electron density (–0.9). These data, along with the results of molar ratio, suggested that one nitrogen atom of –NH– group of DUV and two nitrogen atoms of –NH– group of SEL had contributed to the formation of CTC with DDQ.
These findings led to the hypothesis that the CT interaction of DUV and SEL with DDQ would progress as shown in Figure 8.

3.2. Development of HPLC-FD

3.2.1. Background and Strategy for Method Development

HPLC with fluorescence detection (HPLC-FD) has been widely used in the field of pharmaceutical QC because of its inherent high sensitivity and simplicity. Moreover, it can be adapted as a high-throughput approach when it is equipped with an autosampler and involves short run time. Extensive literature review revealed that there is no HPLC-FD method described for QC of DUV and/or SEL. Since DUV and SEL are expected from their chemical structures (Figure 1), and as confirmed by their fluorescence spectra (Figure 9), to have native fluorescence, the current work was dedicated for developing HPLC-FD method with high throughput for quantitation of DUV and SEL in their bulk and/or dosage forms.

3.2.2. Optimization of Chromatographic Analysis Conditions

The fluorescence spectra (excitation and emission) of both DUV and SEL (Figure 9) indicated that DUV has two wavelength maxima for excitation (λex) at 273 and 344 nm, and a wavelength maximum for emission (λem) at 407 nm. SEL spectra show three λex at 239, 263 and 290 nm, and a λem at 349 nm. Fluorescence of both DUV and SEL were detected at 370 nm after their excitation at 280 nm. These excitation and emission wavelengths were selected for detection of both DUV and SEL because both are excitable at this λex and also both emit fluorescence at this λem (Figure 9). Additionally, one molecule could be used as an internal standard in the determination of the other.
Optimization of chromatographic conditions were designed to establish the most appropriate mobile phase, flow rate, and reversed phase column. The chromatographic separation was initiated in isocratic elution mode on a C18 column (150 mm length × 3.9 mm i.d., 5 μm particle diameter). The temperature of the column was maintained at 25 ± 2 °C. Acetonitrile and water were used as the constituents of the mobile phase for separations, with a flow rate of 1.5 mL/min. Upon applying these initial conditions, a fairly long run time (~20 min) was required to achieve elution of DUV and SEL from the column. This long run time does not meet the requirements of high throughput analysis in QC. Due to both DUV and SEL’s high lipophilicity, this delayed elution can be addressed. Accordingly, it was decided to switch to a more polar cyano (CN) column and adjust the mobile phase’s ratio to 40:20:40 acetonitrile: methanol: water. These conditions reduced the run time (~8 min); however, the resolution of DUV and SEL was not adequate. In order to achieve better resolution, variable flow rates and various mobile phase compositions were examined. When a mobile phase composed of acetonitrile: acetate buffer, pH 4.5 (40:60, v/v), and flow rate of 1.7 mL/min were used, the best resolution and peak shape were obtained. Another reversed phase column (Hypersil™ Phenyl, 250 mm length × 4.6 mm i.d., 5 μm particle diameter; manufactured by Phenomenex, Torrance, CA, USA) was also evaluated, and it gave the superlative chromatographic resolution; thus, it was designated for all the subsequent work. Increasing the flow rate to 2.2 mL/min significantly reduced the run time to 5 min without affecting the resolution. Under these best resolution conditions, DUV and SEL were eluted as sharp and narrow symmetric peaks at 3.25 and 4.20 min, respectively (Figure 10).

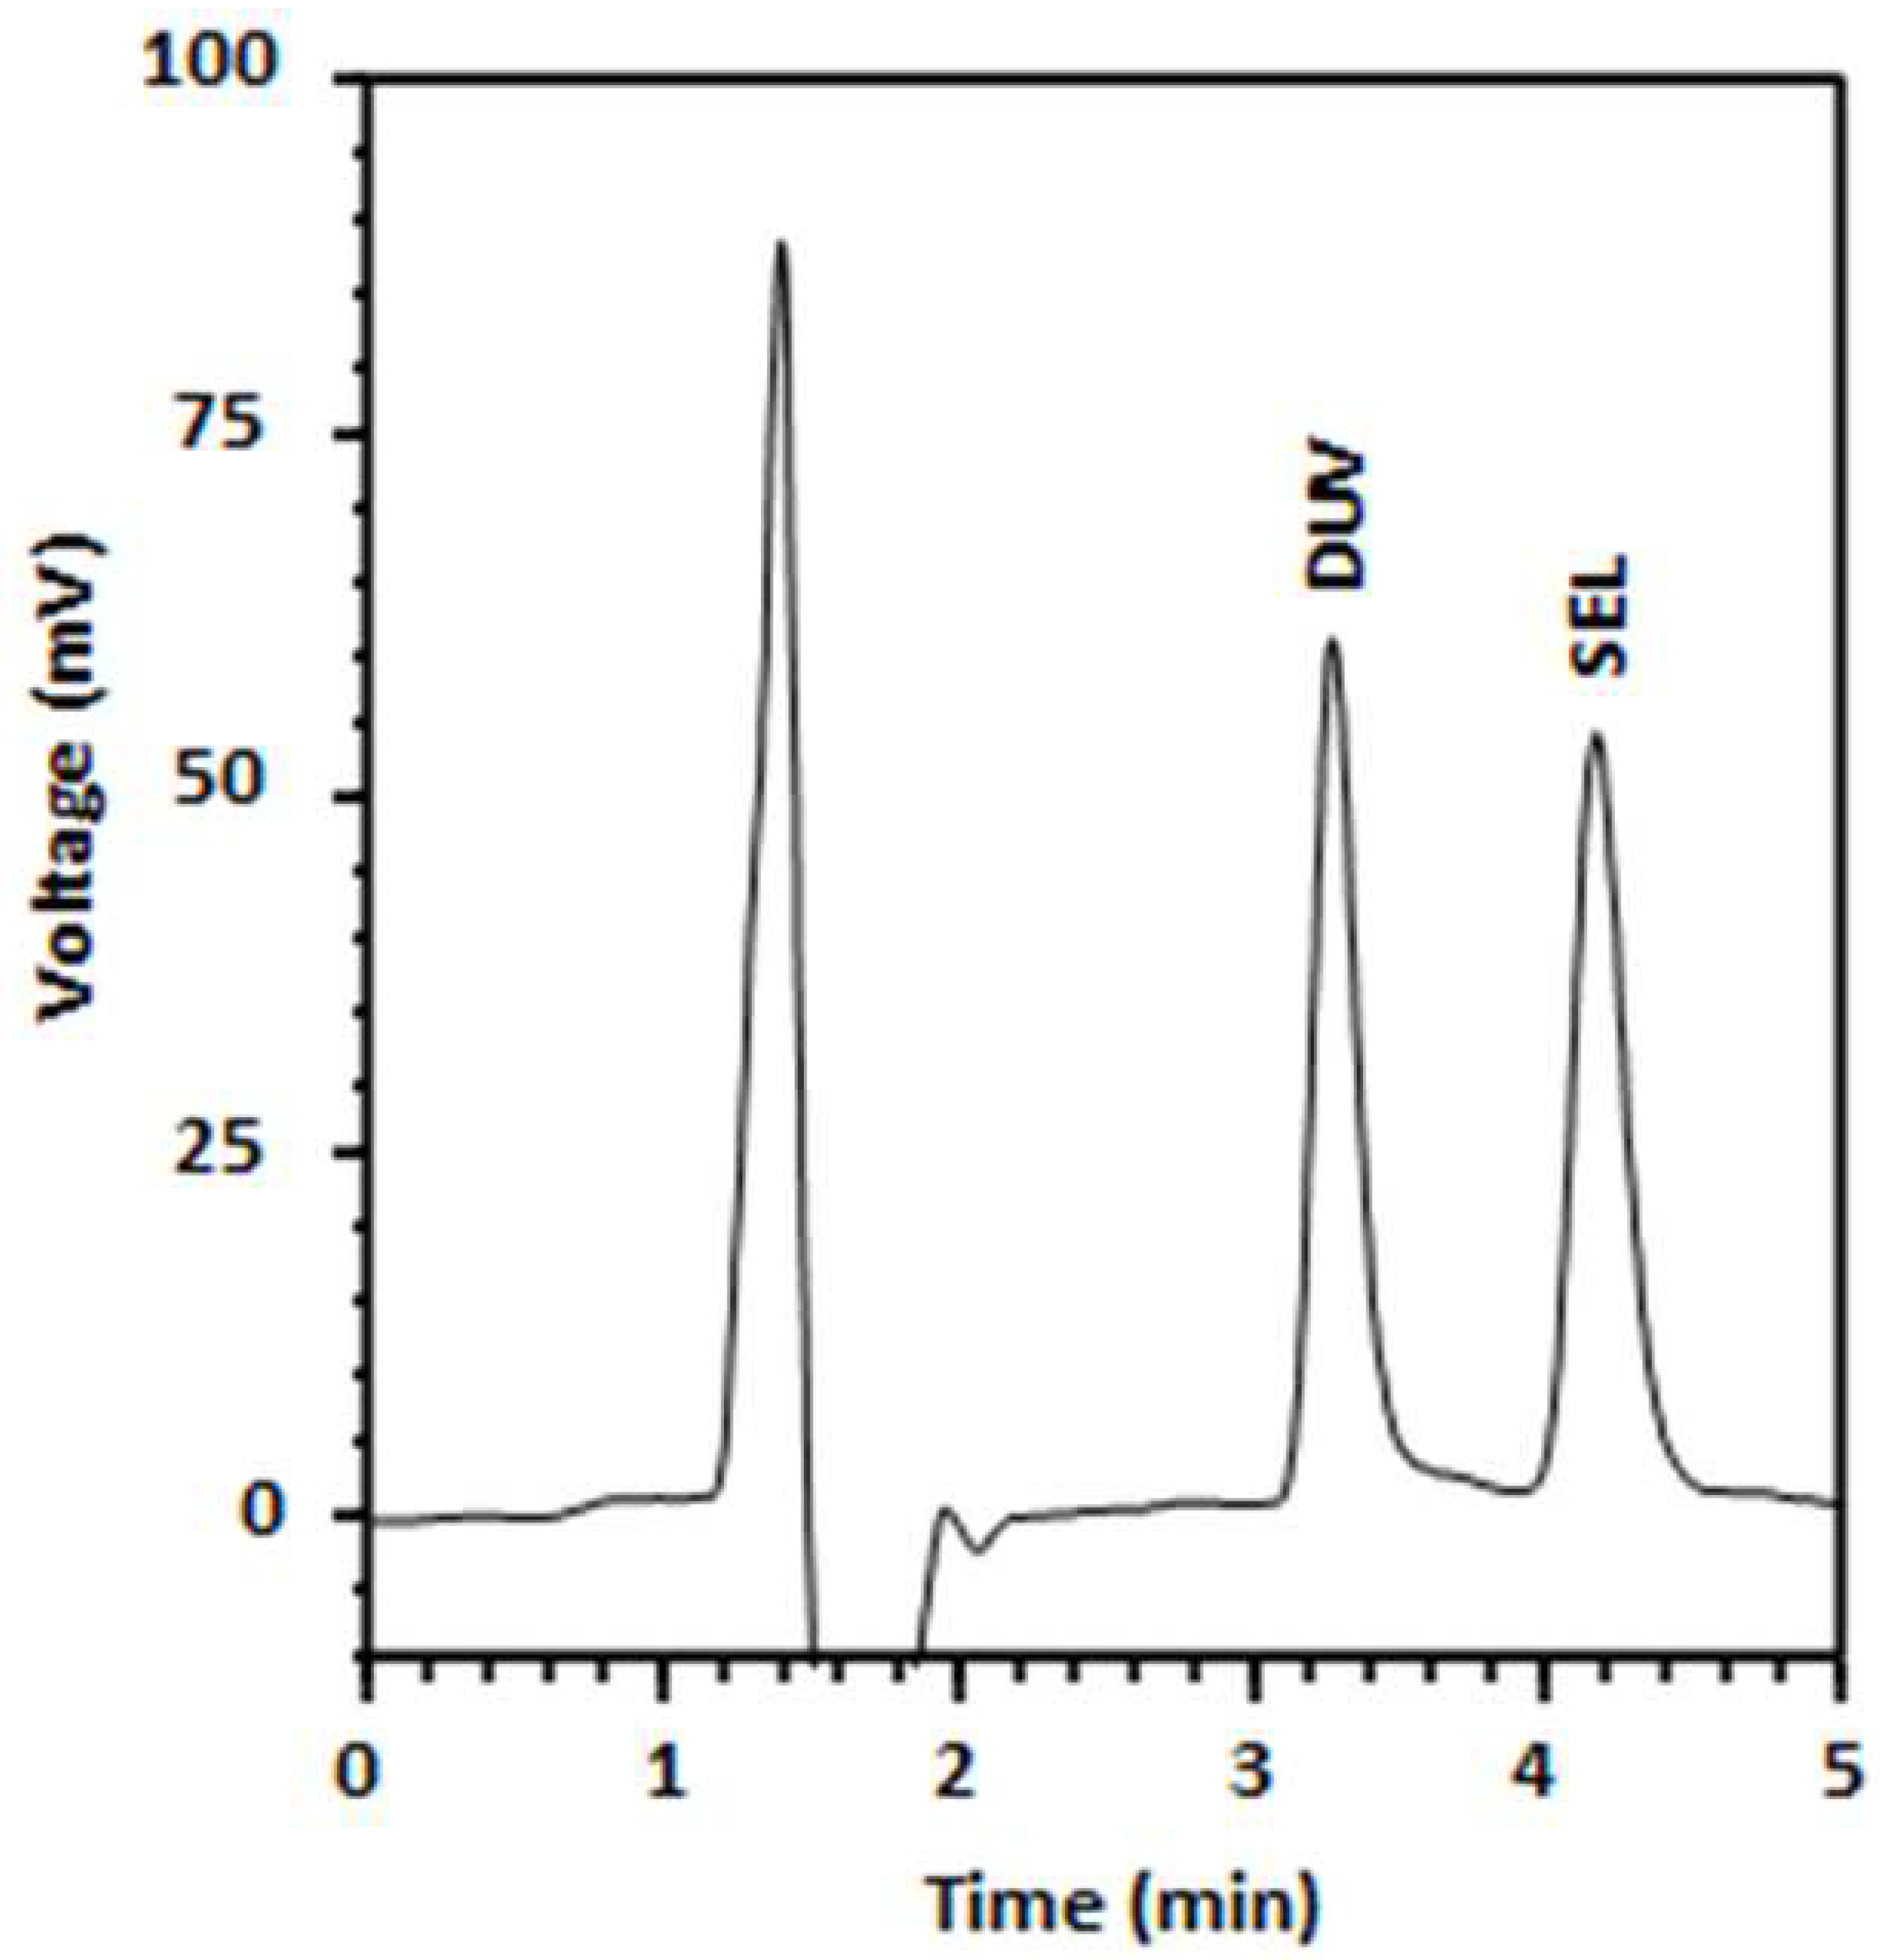
3.2.3. Selectivity and Chromatographic Parameters

The method selectivity was assessed by carrying out blank experiments using a synthetic mixture of the pharmaceutical inactive ingredients (25 mg of each of starch, lactose monohydrate, microcrystalline cellulose, and hydroxypropyl cellulose). The chromatogram of this blank sample did not show any chromatographic peaks at the retention times of either DUV or SEL, indicating the selectivity of the HPLC-FD method. The peak areas, retention times, capacity factors, and other chromatographic parameters were calculated. The formula used to calculate the retention factor (k′) for DUV and SEL is: k′ = (tR − t0)/t0; where tR and t0 are the retention times for the peak of interest and the solvent front, respectively. The equation α = k′2/k′1; where k′1 and k′2 are the retention factors of DUV and SEL, respectively, was used to compute the separation factor or selectivity (α). At 10% of the peak height, the peak asymmetry factor was computed. The resolution factor (Rs) was computed using the formula: Rs = (t2 − t1)/0.5 (w2 + w1); where t2 and t1 are the retention times of the DUV and SEL peaks, and w2 and w1 are the peak widths that were detected by intersecting the tangent with DUV and SEL base line.
Using the equation N = 16 (tR/w)2; where w is the peak width, the column plate number was computed. The chromatographic parameters were measured, along with the system’s suitability and efficacy; the findings are shown in Table 2.

3.3. Validation of MW-SPM and HPLC-FD Methods

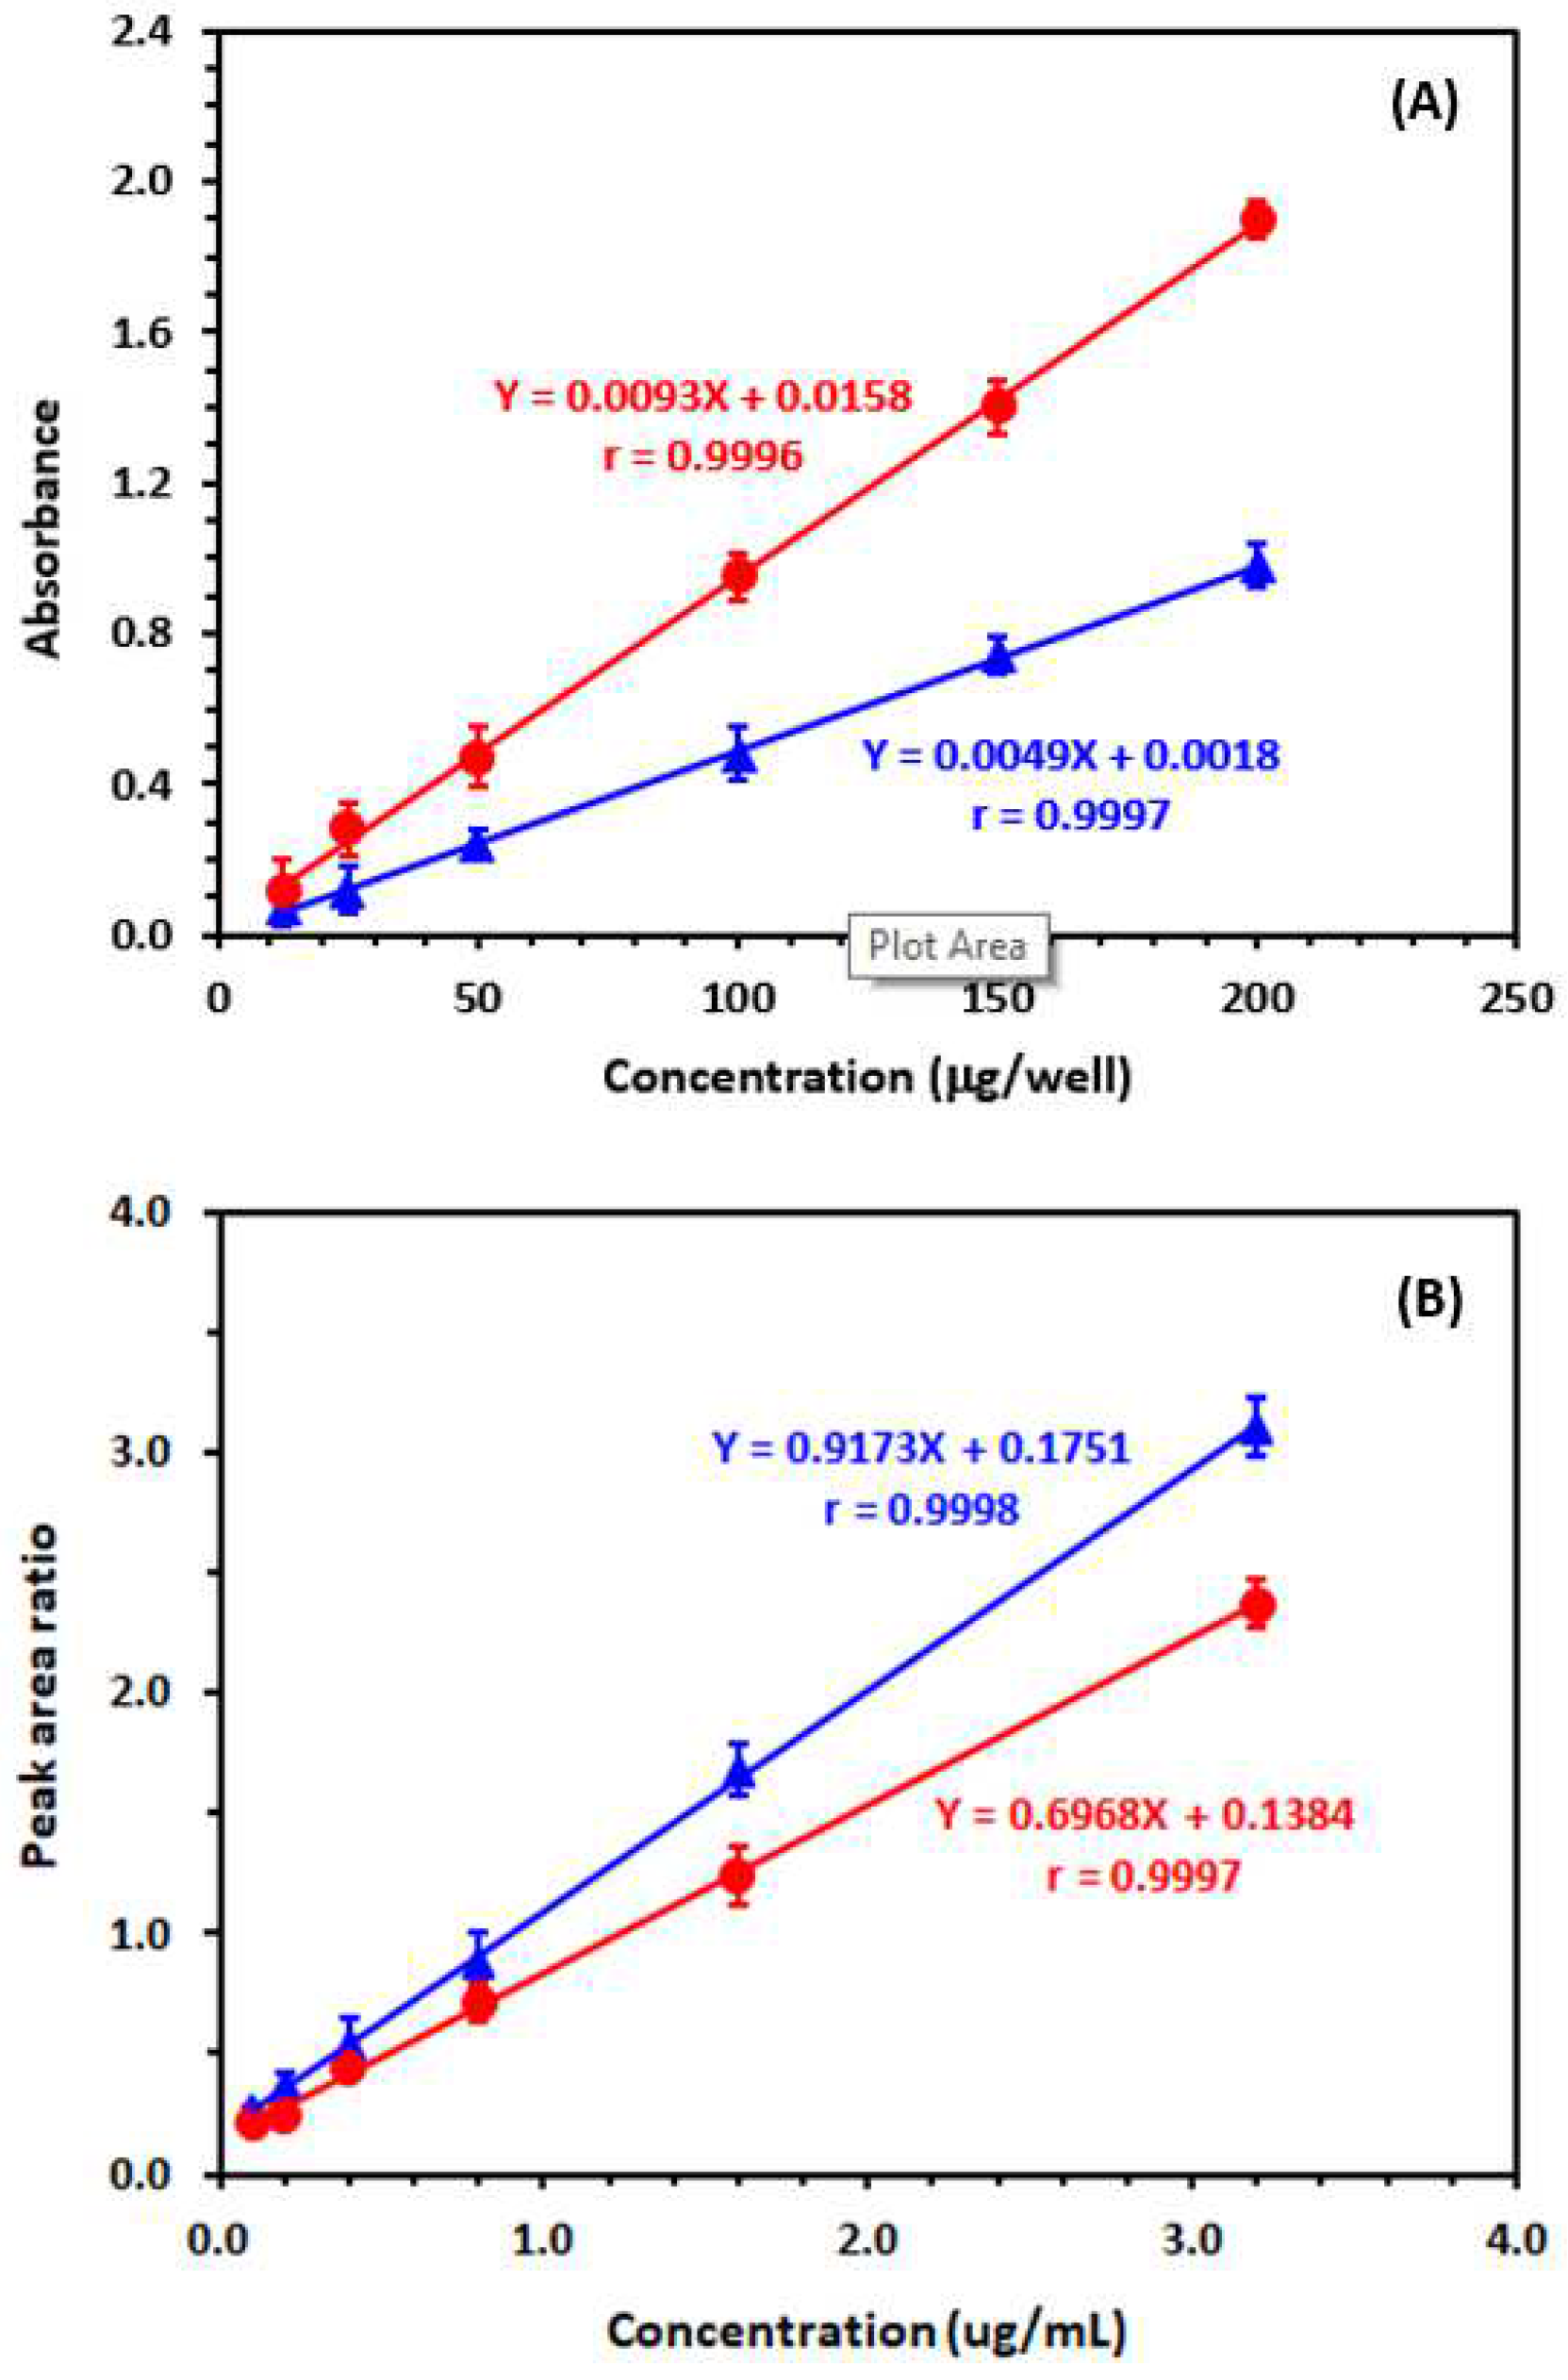
3.3.1. Linear Range and Sensitivity

Calibration curves were built under the predetermined refined optimal conditions for both MW-SPM and HPLC-FD (Figure 11), and the least-squares approach was adopted to analyze the data using linear regression. The graphs were linear and the lines’ correlation coefficients were excellent in the ranges of 14.52–200 µg/well and 0.12–3.2 µg/mL, for MW-SPM and HPLC-FD, respectively. The calibration parameters for both MW-SPM and HPLC-FD are given in Table 3.
The limits of detection (LOD) and limits of quantitation (LOQ) were calculated according to the International Council for Harmonization (ICH) guidelines [48]. The LOD values achieved by MW-SPM for DUV and SEL were 4.4 and 3.17 µg/well, respectively. The LOD values achieved by HPLC-FD for DUV and SEL were 0.03 and 0.05 µg/mL, respectively. Table 3 provides a summary of the MW-SPM and HPLC-FD calibration and validation parameters.

3.3.2. Precision and Accuracy

The precisions of the proposed MW-SPM and HPLC-FD were calculated using sample solutions of DUV and SEL at varying levels of concentration (Table 4). The relative standard deviations (RSD) in the case of MW-SPM were 1.02–2.01 and 1.82–2.41% for the intra- and inter-assay precisions, respectively. RSD values in the case of HPLC-FD were 0.89–1.52 and 1.04–1.72% for the intra- and inter-assay precisions, respectively. These small RSD values proved the high precisions of both MW-SPM and HPLC-FD. The accuracy of both MW-SPM and HPLC-FD was assessed by the recovery experiments at the same levels of concentration that were used for the precision assessment of both DUV and SEL. The recovery values were 98.5–102.5% and 98.8–101.4% for MW-SPM and HPLC-FD, respectively, indicating the accuracy of both methods.

3.3.3. Robustness and Ruggedness

Both methods’ robustness, the impact of slight variations in the procedure variables on the method’s effectiveness, was assessed. The method’s analytical results were found to be unaffected by the method’s little fluctuation; recovery values ranged from 97.8–102.6 (±1.86–2.31%) and 98.4–101.2 (±0.94–1.85%). This confirmed the convenience of both MW-SPM and HPLC-FD for the routine application for the analysis of DUV and SEL.
By having two different analysts perform the MW-SPM and HPLC-FD procedures on three different days, ruggedness was also investigated. The greatest RSD values did not exceed 2.24%, hence the results of the day-to-day variations daily changes were reproducible.

3.4. Application of MW-SPM and HPLC-FD to the Analysis of Capsules

The validation results that were obtained revealed that both MW-SPM and HPLC-FD are appropriate for routine analysis of DUV and SEL in their capsules. Both methods were applied to the quantitation of DUV and SEL in commercialized copiktra capsules for DUV and laboratory-made capsules for SEL. The mean recovery values that were obtained for the nominated concentrations were ~100% for both DUV and SEL by both MW-SPM and HPLC-FD (Table 5). This result indicated that both methods are appropriate for routine accurate determination of DUV and SEL in QC laboratories.

4. Conclusions

This study described the development and validation of two methods for the quantitation of DUV and SEL in their bulk forms and capsules. These two methods are MW-SPM and HPLC-FD. The MW-SPM involved, for the first time, the formation of colored CTCs upon the reaction of DUV and SEL with DDQ and employed an absorbance plate reader for measuring the color intensity. HPLC-FD involved simple chromatographic conditions and the run time was short (5 min) with fluorescence detection for recording the native fluorescence of DUV and SEL. According to the ICH guidelines for the validation of analytical procedures, both methods were validated, and the outcomes were competent. Applicability of the two methods for QC of DUV and SEL was confirmed. Both MW-SPM and HPLC-FD methods have high throughput as they enable the processing of many samples in a fairly period of time, use small volumes of organic solvents; thus, lowering analysis costs and finally can reduce medication expenses to the patient populations. Accordingly, both methods are practical and valuable for routine use in CQ laboratories for determination of DUV and SEL in their bulk forms and capsules.

Author Contributions

H.I.A.: Investigation, Visualization, Data curation, Writing—review and editing. A.A.A.: Investigation, Data curation, Formal analysis. N.Y.K.: Investigation, Visualization, Data curation. H.W.D.: Investigation, Data curation, Validation, Writing—review and editing. R.A.-S.: Validation, Formal analysis, Resources, Writing—review and editing. I.A.D.: Conceptualization, Methodology, Validation, Formal analysis, Resources, Writing—review and editing, Supervision. All authors have read and agreed to the published version of the manuscript.

Funding

This research was funded by Researchers Supporting Project, King Saud University, Riyadh, Saudi Arabia, through grant No. RSP-2021/353.

Data Availability Statement

All data are present in the article.

Acknowledgments

The authors extend their appreciation to the Researchers Supporting Project, King Saud University, Riyadh, Saudi Arabia for funding this work through grant No. RSP-2021/353.

Conflicts of Interest

The authors declare no conflict of interest.

References

  1. World Health Organization. Report—12 September 2018. Available online: https://www.who.int/news-room/fact-sheets/detail/cancer (accessed on 26 June 2022).
  2. Bertino, J.R.; Hait, W. Principles of Cancer Therapy. In Textbook of Medicine, 22nd ed.; Golden, L., Ausiello, D., Eds.; WB Saunders: Saunders, PA, USA, 2004; pp. 1137–1150. [Google Scholar]
  3. Whittaker, S.; Marais, R.; Zhu, A. The role of signaling pathways in the development and treatment of hepatocellular carcinoma. Oncogene 2010, 29, 4989–5005. [Google Scholar] [CrossRef] [PubMed]
  4. Agarwal, E.; Brattain, M.G.; Chowdhury, S. Cell survival and metastasis regulation by Akt signaling in colorectal cancer. Cell. Signal. 2013, 25, 1711–1719. [Google Scholar] [CrossRef] [PubMed] [Green Version]
  5. Fruman, D.A.; Bradshaw, I.R.A.; Dennis, E.A. (Eds.) Phosphoinositide 3-Kinases. In Handbook of Cell Signaling; Academic Press: Cambridge, MA, USA, 2003; pp. 135–141. [Google Scholar]
  6. Malumbres, M. Cyclin-dependent kinases. Genome Biol. 2014, 15, 122. [Google Scholar] [CrossRef] [PubMed] [Green Version]
  7. Wang, Z.; Cole, P.A. Catalytic mechanisms and regulation of protein kinases. Methods Enzymol. 2014, 548, 1–21. [Google Scholar]
  8. Drake, J.M.; Lee, J.K.; Witte, O.N. Clinical targeting of mutated and wild-type protein tyrosine kinases in cancer. Mol. Cell Biol. 2014, 34, 1722–1732. [Google Scholar] [CrossRef] [Green Version]
  9. Knösel, T.; Kampmann, E.; Kirchner, T.; Altendorf-Hofmann, A. Tyrosine kinases in soft tissue tumors. Pathologe 2014, 35, 198–201. [Google Scholar] [CrossRef] [PubMed]
  10. Winkler, G.C.; Barle, E.L.; Galati, G.; Kluwe, W.M. Functional differentiation of cytotoxic cancer drugs and targeted cancer therapeutics. Regul. Toxicol. Pharmacol. 2014, 70, 46–53. [Google Scholar] [CrossRef]
  11. Jiao, Q.; Bi, L.; Ren, Y.; Song, S.; Wang, Q.; Wang, Y.-S. Advances in studies of tyrosine kinase inhibitors and their acquired resistance. Mol. Cancer 2018, 17, 36. [Google Scholar] [CrossRef]
  12. Drugbank. Duvelisib. Available online: https://go.drugbank.com/drugs/DB11952 (accessed on 26 June 2022).
  13. Roskoski, R., Jr. Properties of FDA-approved small molecule phosphatidylinositol 3-kinase inhibitors prescribed for the treatment of malignancies. Pharmacol. Res. 2021, 168, 105579. [Google Scholar] [CrossRef]
  14. Blair, H.A. Duvelisib: First global approval. Drugs 2018, 78, 1847–1853. [Google Scholar] [CrossRef]
  15. Flinn, I.W.; O’Brien, S.; Kahl, B.; Patel, M.; Oki, Y.; Foss, F.F.; Porcu, P.; Jones, J.; Burger, J.A.; Jain, N.; et al. Duvelisib, a novel oral dual inhibitor of PI3K-δ,γ, is clinically active in advanced hematologic malignancies. Blood 2018, 131, 877–887. [Google Scholar] [CrossRef] [PubMed]
  16. Drugs.com. Duvelisib. Available online: https://www.drugs.com/monograph/duvelisib.html (accessed on 26 June 2022).
  17. Cicenas, J.; Kalyan, K.; Sorokinas, A.; Stankunas, E.; Levy, J.; Meskinyte, I.; Stankevicius, V.; Kaupinis, A.; Valius, M. Roscovitine in cancer and other diseases. Ann. Transl. Med. 2015, 3, 135. [Google Scholar] [PubMed]
  18. Raje, N.; Kumar, S.; Hideshima, T.; Roccaro, A.; Ishitsuka, K.; Yasui, H.; Shiraishi, N.; Chauhan, D.; Munshi, N.C.; Green, S.R.; et al. Seliciclib (CYC202 or R-roscovitine), a small-molecule cyclin-dependent kinase inhibitor, mediates activity via down-regulation of Mcl-1 in multiple myeloma. Blood 2005, 106, 1042–1047. [Google Scholar] [CrossRef] [PubMed] [Green Version]
  19. Srujani, C.H.; Annapurna, P.; Nataraj, K.S.; Pawar, K.M.A. Analytlcal quality by design approach in RP-HPLC method development and validation for the estimation of duvelisib. Asian J. Pharm. Clin. Res. 2021, 14, 99–108. [Google Scholar]
  20. Siddesh, A.; Sriram, D.; Zakkula, A.; Kumar, R.; Dittakavi, S.; Zainuddin, M.; Trivedi, R.K.; Mullangi, R. Validated HPLC-UV method for simultaneous quantification of phosphatidylinositol 3-kinase inhibitors, copanlisib, duvelisib and idelalisib, in rat plasma: Application to a pharmacokinetic study in rats. Biomed. Chromatogr. 2021, 35, e5015. [Google Scholar] [CrossRef]
  21. Nigade, P.B.; Gundu, J.; Pai, K.S.; Nemmani, K.V.S. Prediction of tissue-to-plasma ratios of basic compounds in mice. Eur. J. Drug Metab. Pharmacokinet. 2017, 42, 835–847. [Google Scholar] [CrossRef]
  22. Shao, Y.; Xie, S.; Zhu, H.; Du, X.; Xu, R.A. Development of a novel and quick UPLC-MS/MS method for the pharmacokinetic analysis of duvelisib in beagle dogs. J. Pharm. Biomed. Anal. 2020, 187, 113355. [Google Scholar] [CrossRef]
  23. Sayed, A.Y.; Khalil, N.Y.; Almomen, A.; Alzoman, N.Z.; Almehizia, A.A.; Darwish, I.A. A highly sensitive nonextraction-assisted HPLC method with fluorescence detection for quantification of duvelisib in plasma samples and its application to pharmacokinetic study in rats. Drug Des. Dev. Ther. 2021, 15, 2667–2677. [Google Scholar] [CrossRef]
  24. Vita, M.; Meurling, L.; Pettersson, T.; Cruz-Sidén, M.; Sidén, A.; Hassan, M. Analysis of roscovitine using novel high performance liquid chromatography and UV-detection method: Pharmacokinetics of roscovitine in rat. J. Pharm. Biomed. Anal. 2004, 34, 425–431. [Google Scholar] [CrossRef]
  25. Vitaa, M.; Skansenb, P.; Hassana, M.; Abdel-Rehim, M. Development and validation of a liquid chromatography and tandem mass spectrometry method for determination of roscovitine in plasma and urine samples utilizing on-line sample preparation. J. Chromatogr. B 2005, 817, 303–307. [Google Scholar] [CrossRef]
  26. Darwish, I.A.; Almehizia, A.A.; Sayed, A.Y.; Khalil, N.Y.; Alzoman, N.Z.; Darwish, H.W. Synthesis, spectroscopic and computational studies on hydrogen bonded charge transfer complex of duvelisib with chloranilic acid: Application to development of novel 96-microwell spectrophotometric assay. Spectrochim. Acta A 2021, 264, 120287. [Google Scholar] [CrossRef] [PubMed]
  27. Xie, G.; Liao, M.; Wang, B.; Zhang, C. Determination of roscovitine enantiomeric purity by HPLC on chiral stationary phase. Chromatographia 2016, 79, 641–646. [Google Scholar] [CrossRef]
  28. Orság, P.; Fojt, L.H.L.; Coufal, J.; Brázda, V.; Fojta, M. Voltammetric behavior of a candidate anticancer drug roscovitine at carbon electrodes in aqueous buffers and a cell culture medium. Mon. Chem.—Chem. Mon. 2019, 150, 461–467. [Google Scholar] [CrossRef]
  29. Darwish, I.A.; Darwish, H.W.; Khalil, N.Y.; Sayed, A.Y. Experimental and computational evaluation of chloranilic acid as a universal chromogenic reagent for the development of a novel 96-microwell spectrophotometric assay for tyrosine kinase inhibitors. Molecules 2021, 26, 744. [Google Scholar] [CrossRef] [PubMed]
  30. Perry, G.W. High Throughput Analysis in the Pharmaceutical Industry; CRC/Taylor & Francis: Portland, OR, USA, 2009; pp. 1–72. [Google Scholar]
  31. Görög, S. Ultraviolet-Visible Spectrophotometry in Pharmaceutical Analysis; CRC Press: New York, NY, USA, 2018; pp. 1–504. [Google Scholar]
  32. Darwish, I.A. Analytical study for the charge transfer complexes of losartan potassium. Anal. Chim. Acta 2005, 549, 212–220. [Google Scholar] [CrossRef]
  33. Darwish, I.A.; Refaat, I.H. Spectrophotometric analysis of selective serotonin reuptake inhibitors based on formation of charge-transfer complexes with tetracyanoquinondimethane and chloranilic acid. J. AOAC Int. 2006, 89, 326–333. [Google Scholar] [CrossRef] [PubMed] [Green Version]
  34. El-Bagary, R.I.; Elkady, E.F.; Ayoub, B.M. Spectrophotometric methods based on charge transfer complexation reactions for the determination of saxagliptin in bulk and pharmaceutical preparation. Int. J. Biomed. Sci. 2012, 8, 204–208. [Google Scholar] [PubMed]
  35. Kalyanaramu, B.; Rupakumari, G.; Ramarao, K.; Raghubabu, K. Development of new visible spectrophotometric methods for quantitative determination of sumatriptan succinate based on charge-transfer complex formation. Int. J. Pharm. Pharm. Sci. Res. 2011, 1, 47–51. [Google Scholar]
  36. Fidler, A.T.; Baker, E.L.; Letz, R.E. Neurobehavioural effects of occupational exposure to organic solvents among construction painters. Br. J. Ind. Med. 1987, 44, 292–308. [Google Scholar] [CrossRef] [Green Version]
  37. Wennborg, H.; Bonde, J.P.; Stenbeck, M.; Olsen, J. Adverse reproduction outcomes among employee in biomedical research laboratories. Scand. J. Work Environ. Health 2002, 28, 5–11. [Google Scholar] [CrossRef] [Green Version]
  38. Lindbohm, M.L.; Taskinen, H.T.; Sallman, M.; Hemminki, K. Spontaneous abortions among women exposed to organic solvents. Am. J. Ind. Med. 2007, 17, 449–463. [Google Scholar] [CrossRef] [PubMed]
  39. Kristensen, P.; Hilt, B.; Svendsen, K.; Grimsrud, T.K. Incidence of lymphohaematopoietic cancer at university laboratory: A cluster investigation. Eur. J. Epidemiol. 2008, 23, 11–15. [Google Scholar] [CrossRef] [PubMed]
  40. Darwish, I.A.; Mahmoud, A.M.; Al-Majed, A.A. A novel analytical approach for reducing the consumption of organic solvents in the charge transfer-based spectrophotometric analysis: Application in the analysis of certain antihypertensive drugs. Acta Pharm. 2010, 60, 493–501. [Google Scholar] [CrossRef] [PubMed]
  41. Alzoman, N.Z.; Sultan, M.A.; Maher, H.M.; Alshehri, M.M.; Wani, T.A.; Darwish, I.A. Analytical study for the charge-transfer complexes of rosuvastatin calcium with π-acceptors. Molecules 2013, 18, 7711–7725. [Google Scholar] [CrossRef] [Green Version]
  42. Darwish, I.A.; Wani, T.A.; Alqarni, M.A.; Ahamad, S.R. Microwell-based spectrophotometric method for determination of azithromycin in its pharmaceutical formulations via charge transfer reaction with 2,3-dichloro-5,6-dicyano-1,4-benzoquinone. Lat. Am. J. Pharm. 2014, 33, 587–594. [Google Scholar]
  43. Khalil, N.Y.; Wani, T.A.; Darwish, I.A.; Assiri, I.S. Charge-transfer reaction of cediranib with 2,3-dichloro-3,5-dicyano-1,4-benzoquinone: Spectrophotometric investigation and use in development of microwell assay for cediranib. Trop. J. Pharm. Res. 2015, 14, 1667–1672. [Google Scholar] [CrossRef]
  44. Darwish, I.A.; Khalil, N.Y.; Alsaif, N.A.; Herqash, R.N.; Sayed, A.Y.A.; Abdel-Rahman, H.M. Charge-transfer complex of linifanib with 2,3-dichloro-3,5-dicyano-1,4-benzoquinone: Synthesis, spectroscopic characterization, computational molecular modelling and application in the development of novel 96-microwell spectrophotometric assay. Drug Des. Dev. Ther. 2021, 15, 1167–1180. [Google Scholar] [CrossRef]
  45. Karipcin, F.; Dede, B.; Caglar, Y.; Hür, D.; Ilican, S.; Caglar, M.; Şahin, Y. A new dioxime ligand and its trinuclear copper (II) complex: Synthesis, characterization and optical properties. Opt. Commun. 2007, 272, 131–137. [Google Scholar] [CrossRef]
  46. Makuła, P.; Pacia, M.; Macyk, W. How to correctly determine the band gap energy of modified semiconductor photocatalysts based on UV–Vis spectra. J. Phys. Chem. Lett. 2018, 9, 6814–6817. [Google Scholar] [CrossRef]
  47. Skoog, D.A.; Holler, F.J.; Crouch, S.R. Principle of Instrumental Analysis, 7th ed.; WB Saunders: Saunders, PA, USA, 2014; pp. 362–378. [Google Scholar]
  48. The International Council for Harmonization (ICH). Q2(R1) on Validation of Analytical Procedure; ICH: Geneva, Switzerland, 2022. [Google Scholar]
Figure 1. The chemical structures of duvelisib (DUV), seleciclib (SEL), and 2,3-Dichloro-5,6-dicyano-p-benzoquinone (DDQ).
Applsci 12 10624 g001
Figure 2. Absorption spectra of DUV (1), SEL (2), DDQ (3), reaction mixture of DUV with DDQ (4), and reaction mixture of SEL with DDQ (5). Concentrations of separate solutions of DUV, SEL, and DDQ were 20, 20, and 25 µg/mL, respectively. Concentrations of DUV and SEL in their reaction mixtures with DDQ (0.5%, w/v) were 200 and 300 µg/mL, respectively. All solutions were in methanol.
Applsci 12 10624 g002
Figure 3. Absorption spectra of reaction mixtures of varying concentrations of DUV (A) and SEL (B) and with a fixed concentration of DDQ (0.1%, w/v). The values given on the spectra are the concentrations of DUV and SEL in their reaction mixtures; concentrations were in µg/mL). All solutions were in methanol.
Applsci 12 10624 g003
Figure 4. Tauc plots of energy (eV) against (αhυ)2 for the CTC of DUV and SEL with DDQ in methanol.
Applsci 12 10624 g004
Figure 5. Effect of DDQ concentrations (A) and reaction time (B) on its reaction with DUV () and SEL (). Concentrations of DUV and SEL in their mixtures were 150 µg/well (100 µL). All solutions were in methanol.
Applsci 12 10624 g005
Figure 6. Effect of solvent on the reaction of DDQ (0.5%, w/v) with DUV and SEL. Concentrations of DUV and SEL in their mixtures were 150 µg/well for both.
Applsci 12 10624 g006
Figure 7. Plots of absorbance versus molar ratio of [DDQ]/[Drug] obtained from reaction mixtures of fixed concentrations of DUV () and SEL () with varying concentration folds of DDQ. The mole ratio was assigned as the point of intersection of the tangents of straight-line portions of the plots.
Applsci 12 10624 g007
Figure 8. Schemes for the CT reaction of DUV (A) and SEL (B) with DDQ reagent.
Applsci 12 10624 g008
Figure 9. The fluorescence (excitation and emission) spectra of DUV (1 and 2, respectively) and SEL (3 and 4, respectively). The concentrations of DUV and SEL were 380 and 10 µg/mL, respectively. Both solutions were in methanol.
Applsci 12 10624 g009
Figure 10. A representative chromatogram of standard solutions of DUV and SEL. The concentrations of DUV and SEL injected into the HPLC-FD system were 1.6 and 0.8 µg/mL, respectively. Both solutions were in methanol.
Applsci 12 10624 g010
Figure 11. Calibration curves for quantitation of DUV () and SEL () by MW-SPM (A) and HPLC-FD (B). Values of absorbance and peak area ratio are mean of 3 determinations ± SD. On the graph, correlation coefficients (r) are provided for each corresponding calibration line along with linear fitting equations.
Applsci 12 10624 g011
Table 1. Optimization of conditions for the MW-SPM for DUV and SEL based on their formation of colored CT complexes with DDQ.
ConditionStudied RangeOptimum Value a
DDQ conc. (%, w/v)0.125–0.80.5
SolventDifferent bMethanol
Reaction time (min)0–305
Temperature (°C)25–5025
λmax (nm)400–800460 c
a Optimum values were given for both DUV and SEL. b Solvents used were acetonitrile, methanol, propanol, diethyl ether, dichloroethane, and chloroform. c Measurements were carried out by the absorbance plate reader at 450 nm.
Table 2. Chromatographic parameters for DUV and SEL by the suggested HPLC-FD method.
ParameterValue
DUVSEL
Retention time (min)3.254.20
Retention factor (k′)1.1961.857
Separation factor (α)1.551.55
Resolution factor (Rs)2.642.64
Peak asymmetry factor11
Number of theoretical plates (N) per meter80028939
Table 3. Calibration parameters for the determination of DUV and SEL by the proposed MW-SPM and HPLC-FD.
ParameterValue for MW-SPMValue for HPLC-FD
DUVSELDUVSEL
Linear range a14.52–20010.46–2000.12–3.20.15–3.2
Intercept0.00180.01580.17510.1384
Standard deviation of intercept7.11 × 10−39.73 × 10−30.08340.1056
Slope0.00490.00930.91730.6968
Standard deviation of slope5.466 × 10−64.389 × 10−50.00750.0094
Correlation coefficient0.99970.99960.99980.9997
LOD a4.43.170.030.05
LOQ a14.5210.460.120.15
a Values are in µg/well and µg/mL for MW-SPM and HPLC-FD, respectively.
Table 4. Precision and accuracy of the proposed MW-SPM and HPLC-FD for determination of DUV and SEL.
Taken Conc. aRelative Standard Deviation (%) bRecovery (% ± SD) a
Intra-Assay, n = 3Inter-Assay, n = 3
MW-SPM
DUV
201.292.23100.2 ± 1.8
1001.021.82101.4 ± 2.1
1601.622.4198.5 ± 1.8
SEL
201.822.14100.2 ± 2.2
1001.462.0599.4 ± 1.9
1602.012.27102.5 ± 2.4
HPLC-FD
DUV
0.51.241.41101.4 ± 1.2
1.50.891.22100.2 ± 1.5
3.00.981.5499.8 ± 1.2
SEL
0.51.321.58101.4 ± 1.4
1.51.041.0498.8 ± 1.5
3.01.521.72100.2 ± 1.8
a Taken concentrations are µg/well and µg/mL for MW-SPM and HPLC-FD, respectively. b Values are the mean of three determinations.
Table 5. Determination of DUV and SEL in their capsules by the proposed MW-SPM and HPLC-FD.
Nominated Conc. aRecovery (% ± SD) b
Copiktra Capsules
(25 mg DUV)
SEL Capsules (LM) c
(100 mg SEL)
MW-SPM
25101.2 ± 1.2102.2 ± 1.3
50100.4 ± 1.4100.1 ± 1.6
10099.5 ± 1.899.8 ± 1.2
15097.9 ± 1.2101.4 ± 1.1
Mean99.8 ± 1.4100.9 ± 1.1
HPLC-FD
0.298.5 ± 1.1100.1 ± 1.5
0.5100.2 ± 1.298.5 ± 1.2
1.599.4 ± 1.598.8 ± 0.9
3.099.6 ± 0.899.7 ± 1.4
Mean99.4 ± 0.799.2 ± 0.8
a Taken concentrations are µg/well and µg/mL for MW-SPM and HPLC-FD, respectively. b Values are the mean of three determinations. c LM means laboratory made.
Publisher’s Note: MDPI stays neutral with regard to jurisdictional claims in published maps and institutional affiliations.

