Abstract
The article discusses the effect of milling strategies on surface quality and geometric deviations during pocket milling when the perpendicular position of the tool is used. For experimental research, an aluminum alloy, AlCu4Mg, was used. For the production, a three-axis milling machine was used, and consequently, the geometric deviations and roughness parameters of the machined surface were evaluated. Also, the surface texture from each strategy was compared. For the production strategy, the constant Z, circular pocket, constant stepover pocket auto border, and spiral strategies were used. The geometric characteristic evaluation showed the influence of the ball end mill used in the machining process. Constant Z strategy achieved the lowest shape deviations. In the spiral strategy, it was possible to observe an effect of plowing, where the cutting tool crushed the material at the tool center. There was a minimal effect on the surface texture in the circular pocket and constant stepover pocket auto border strategies. Using the constant Z strategy, a non-oriented surface texture was obtained. 3D maps of the extracted residual scallop height for each strategy were observed when examining the surface texture. The roughness parameters Ra and Rz for the circular pocket and constant stepover pocket auto border strategies were the lowest.
1. Introduction
The CNC milling process is considered a very efficient method of obtaining the required shape of the machined surface. The programmer uses very useful strategies, including the CAM system, or it is possible to use workshop programming in case the part is very simple. In this case, some cycles, such as contour, pocket, and groove, are used. To obtain the best quality of the machined surface, CAM systems are used, and they are constantly being developed and highly demanded. It offers many options for choosing an appropriate strategy designed for 2.5D machining, free-form surface milling or for five-axis milling.
In the manufacturing process, we are most often confronted with two problems. The first is to specify the correct process parameters that give the requested output quality, and the second is to find a way to optimize the production system [1]. The production process phase can be divided into four steps. In the first step, it is necessary to design the part using a CAD system according to the defined design requirements. The second step involves the calculation of toolpaths based on the strategy selection in the CAM system. In the third step, the NC code for the corresponding CNC machine is generated using a postprocessor. And in the last step, the manufacturing of the given part starts [2,3].
For many machining parts, simple strategies can be used, such as the machining of simple surfaces parallel or perpendicular to a plane. The advantage of simple strategies is particularly basic parameter setting, such as cutting parameters, stepover, depth of cut, or options for defining the tool movement [4]. The programmer does not take into account tool tilt angles in three-axis machining compared to five-axis machining. The pocket shape belongs among the most common shapes in the automotive industry, in areas where various shapes of molds or dies are produced [5].
The correct selection of the milling strategy allows for obtaining a good surface quality, which is determined by surface texture analysis, roughness parameters, or by geometric deviations defining the accuracy of the production. The problem of the surface quality evaluation for different materials has its justification for different milling strategies. For this reason, it is necessary to search for an optimal production strategy and parameters considering surface quality, reduction of final processing costs, or production time [6,7,8].
The most common quality indicator after the production of a part is surface roughness, which is also one of the requirements in the field of mechanical product manufacturing. To achieve the necessary function of the manufactured part, the surface roughness of the surface plays an important role [9]. In the context of surface roughness characterization, we have a definition that evaluates surface roughness as a deviation from the nominal value of the surface of the third to the sixth range [10]. It is determined by the machining method and the depth of tool marks. The first two ranks determine geometric shape deviations as cylindricity, etc., caused by poor clamping, vibration, or material inhomogeneity. The third and fourth ranks may include, for example, cracks related to chip formation. And fifth and sixth range deviations are characterized by the structure of the material [11].
Nowadays, especially in the field of precision engineering, high-precision measurement techniques and surface quality analysis are increasingly being used [12]. The surface quality during milling depends on different process parameters, e.g., cutting speed, feed per tooth, type of tool, workpiece material, and finally, the choice of milling strategy [13,14]. Surface texture is gaining importance due to the increase in the requirements for the precision machining of parts. In the manufacturing process, surface topography and surface roughness have become major areas of interest. The final texture of machined surfaces is created by overlaying the achieved shape after machining with a single cutting path [15]. During milling, the cutting tool performs several steps to complete the machined area. In the case of using a ball nose end mill, the rest of the material, called scallop height, is created on the machined area between these cuts. The scallop height between each machined step is defined by tool diameter and by stepover distance [16]. In the CAM system, the scallop height is based on two parameters—tool geometry and feed rate [17].
The field of spherical tooling is gaining popularity in practice. Mizugaki et al. [16] investigated an algorithm to predict the final surface after machining with a spherical tool, and two years later, Hao et al. [18] included the angle of inclination of the tool on the surface texture in the algorithm. Chen [19] studied the influence of the machining parameters on the surface topography of the scallop height in high-speed milling. Quan [20] defined the scallop height as the combination of two surfaces, namely convex and concave, the radius of the ball tool and the paths between them. Lopéz de Lacalle et al. in [21] developed a model to create surface topography using a ball end mill with two offsets strategies by the zig-zag method and one-direction milling strategies. He later studied the creation of scallop height on the profile of the machined surface during face milling using a ball end mill. However, the estimation of the influence of the choice of strategy on the scallop height of the machined surface is still under research.
At present, most of the produced parts have different surfaces. In the machining process, it is very important to produce them in the required quality and dimensions. Achieving the required dimensions depends on the selection of appropriate finishing strategies, where a ball nose end mill is often used [19]. Kuroda [22] conducted research into the inclination effect of the tool and consequently compared the scallop height between tool axis inclination on complex free-form surfaces. Kruth and Klewais [23] investigated different tool inclinations on the scallop height model. Capla et al. investigated the contact point in the interaction of the cutting tool and the machined surface and the inclination axis of the tool. Along with Batista, they claim that by using the crushing effect, it is possible to obtain better roughness parameters when using a ball nose end mill for plane surfaces [24,25]. The study [26] analyzed the influence of the finish milling strategies in various tool inclinations when free-form surface milling. The research focused on three contact points—upward milling, downward milling, and milling with the center of the tool.
Input data settings such as cutting parameters, tools used, milling strategy, cooling, and tool holder can affect the surface quality of the machined surface [27]. Different marks created as feed marks of the tool, vibration marks, and some surface defects (scaly burrs, scratches, feeding marks, slight banding bulges) can have a negative effect on the behavior of the part [28,29]. When machining part surfaces, some critical areas may appear. These areas include convex, concave, or planar surfaces where the tool is in a perpendicular position to the surface to be machined. In this case, it is good to know how much the perpendicular tool position can affect the surface quality. We know that the contact between the tool and the surface is very close, and the cutting speed in the cutting process is low. The action of the tool in the perpendicular position on the machined surface can have a negative effect, such as plowing, high values of roughness, tearing dimples, scratches, or plastic deformation. For a better understanding of surface characteristics, we need to obtain more knowledge about the relationship between the perpendicularity of the tool position and machined surface contact [30,31]. The authors Mikó et al. [32] and Vyboishchik [33] describe the machined surface texture as a group of continuous grooves.
Different methods are used in the evaluation of machined surfaces. Their disadvantage is that they are time- and money-consuming [34]. Customers require ever more precise results in production. One possibility is using the equipment as a coordinate measuring machine, where it is possible to measure different geometric deviations. Authors et al. [35] investigated roundness deviation, where for pocket shape evaluation, diameter, center coordinate, and form deviations were measured. Also examined was the effect of the measuring points on the roundness measurement. The result was that the lowest points were not adequate for the quality evaluation, and a high number of points did not make the measurement more precise. In many cases, circles are measured using 4 points, and hardly ever with more than 16 points. The performed investigations proved that 4-point measurements are not enough, especially as the measured detail is to be combined with another one in narrow tolerance.
Zheng [36] analyzed the cylindricity deviations using an online method. Another work focused on this issue [37] investigated flatness deviations of stainless steel. Miko [38] examined the relationship between measured roughness and flatness. Twelve techniques of point feature sampling strategies were used for the experiment. For free-form surfaces, a ball end mill is used because, in the production process, the contact between the axis of the tool and the part is changing, but the question remains what the effect is when a ball end mill for the planar surface is used [39,40], and to what extent it can negatively affect the surface of the component.
Currently, it is possible to find a lot of articles describing the influence of the tool path on surface quality, but only a few studies investigate the tool’s effect on the surface texture. Upon reviewing the previous articles, this article focuses on the influence of the finish milling strategies when a pocket shape is milled by using a ball end mill in the perpendicular position in the machining process. The article compares the most common milling strategies that are applied when milling pockets. Consequently, obtained results are compared and evaluated in terms of geometric deviations, surface texture and roughness. The results also show a possible negative effect on the surface texture when the ball end mill is used on the planar surface at the bottom of the pocket. This combination of results can give us more information about the ball end mill usage in the machining process.
2. Materials and Equipment
The choice of the sample corresponded to the most common machined surfaces experienced in the production process. For the experimental process, the shape of the pocket was used, as shown in Figure 1. The chosen component dimensions are presented in Figure 1a, and a 3D model of the part is shown in Figure 1b.
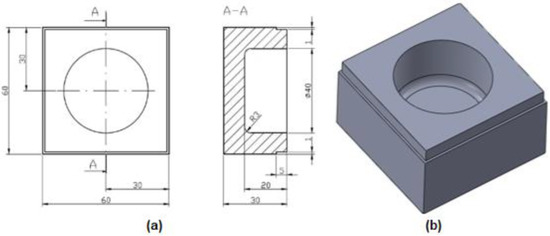
Figure 1.
Test sample (a) dimensions of the test sample (b) 3D model.
A total of four test samples were produced, where four different milling strategies were used and evaluated. The material of the sample parts was aluminum alloy (AlCu4Mg), and its dimensions were 60 × 60 × 30 mm. The mechanical properties of the selected material AlCu4Mg alloy are shown in Table 1.

Table 1.
The basic mechanical properties of the selected AlCu4Mg alloy.
For a CAD model design, the CAD system Solidworks was used, and for the generation of the tool path, the CAM system SolidCAM was used. For the milling process, a 3-axis milling machine EMCO Mill 155 (EMCO MAIER Ges.m.b.H., Hallein/AUSTRIA), was used. The maximum rotation speed used in the experimental process when test samples were produced was 5000 r/min. All test samples were produced by 3 operations: roughing, semi-finish, and finish operation, while only the finish strategies were varied. Constant Z, Circular pocket, Constant stepover pocket auto border and spiral were evaluated and compared. Table 2 shows the cutting tools used in the production process with selected cutting parameters. All cutting parameters were recommended in accordance with tool manufacturers.
Table 2.
Cutting tools used in the production with selected cutting parameters.
End Mill D18 with two interchangeable cutter plates marked APXT11T3PDR-MA was used for the roughing operation. A ball end mill D8 was used for the semi-finish operation, and a ball end mill D6 was used for the finish operation. Tools for the semi-finish and finish operation were clamped in a BT-40 clamping system by a mechanical collet chuck, and their overhang length was 50 mm.
Machining operations were conducted in the following steps:
- Roughing operation—end mill tool D 18 mm, depth of cut ap = 1 mm, side step ae = 2 mm, toolpath tolerance T = 0.1 mm, surface allowance P = 0.5 mm;
- Semi-finish operation—ball end mill D 8 mm, cutting material HSS Co8, depth of cut ap was defined in accordance with the scallop height setting in the CAM system, where the value was 0.1 mm, surface allowance P = 0.2 mm;
- Finishing operation—ball end mill D 6 mm, cutting material HSS Co8, ap = 0.4 mm, side step ae = 0.25 mm, toolpath tolerance T = 0.01 mm, scallop height SH = 0.01 mm.
A more detailed characterization of the finishing strategies used in the experiment is described below.
- Constant Z—This strategy produces high-quality finishes, especially on steep surfaces, and minimizes movements in all three axes that slow older machines and control systems. This strategy allows the function of machining flat areas. Work areas will be automatically created and can be machined using contour pocket machining. The schematic diagram illustrated Constant Z strategy is shown in Figure 2;

Figure 2.
The schematic diagram of Constant Z strategy.
Figure 2.
The schematic diagram of Constant Z strategy.

- Circular pocket—This strategy uses the selected workspace to create a linear 2D pocket field on the plane above the model. The linear field is then projected into the 3D model [41,42]. The schematic diagram illustrating the circular pocket strategy is shown in Figure 3;

Figure 3.
The schematic diagram of the Circular pocket strategy.
Figure 3.
The schematic diagram of the Circular pocket strategy.

- Constant stepover—3D projection machining strategies generate a 2D toolpath with a constant pitch in a plane parallel to the XY plane of the current zero point. This 2D toolpath is then projected onto the 3D model to create a 3D toolpath. This method offers good results when machining prismatic parts but has significant disadvantages when machining curved surfaces because it does not incorporate the curvature of the surface.The constant step is constant for all surfaces, regardless of whether they are steep faces or shallow areas. For these options, the appropriate geometry must be defined. The schematic diagram illustrating the constant stepover strategy is shown in Figure 4;

Figure 4.
The schematic diagram of the constant stepover strategy.
Figure 4.
The schematic diagram of the constant stepover strategy.

- Spiral—The spiral toolpath is first created as a two-dimensional toolpath and then projected onto the 3D model. The Z-position of the tool is calculated during the projection [43]. The schematic diagram illustrating the constant stepover strategy is shown in Figure 5.

Figure 5.
The schematic diagram of the spiral strategy.
Figure 5.
The schematic diagram of the spiral strategy.

When a CAM system is used in a machining process, various factors affect the accuracy of production, which are influenced by the approximation of toolpaths [44].
The experimental process consisted of the following steps:
- -
- Geometric deviation measurement by using the coordinate measuring technique. CMM device Carl Zeiss Contura G2 was used, where some deviations were measured and compared;
- -
- Surface texture evaluation using digital microscope Keyence VHX 5000, where the ball end mill effect in various milling strategies was investigated;
- -
- Roughness measurement and evaluation using a Mitutoyo Surftest SJ 410 device.
2.1. Methodology for the Evaluation of Geometrical Deviations
Geometrical deviations of the four produced test samples were measured using the coordinate measuring technique. The CMM device Carl Zeiss Contura G2 (Figure 6a) with Calypso software was used for the evaluation. Software Calypso allows for the evaluation of various geometric deviations, such as straightness, flatness, and cylindricity. The clamping position used for geometrical deviation measurement is shown in Figure 6b.
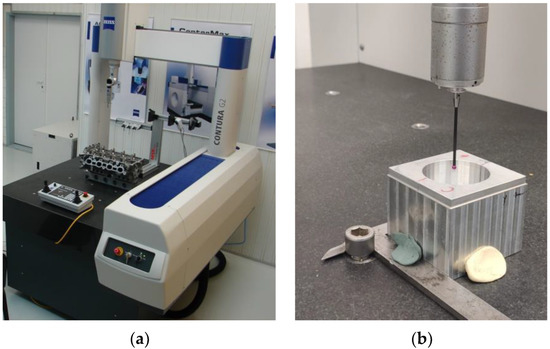
Figure 6.
The CMM device Carl Zeiss Contura G2 (a) CMM device; (b) Clamping and measurement processing.
To align the part in the machine coordinate system, a coordinate system consisting of the features shown in Figure 7 was used. The primary feature (spatial rotation) is defined by a circle on the BS Plane. The circle is created from 4 points. The secondary feature (spatial rotation) is defined by a line marked as BS Line consisting of 2 points. The zero position for the X and Y directions is defined by the BS Circle and for the Z axis by the BS Plane. To increase the accuracy of the alignment, a loop for a maximum of 5 repetitions was used with the delta value set to 0.005 mm.
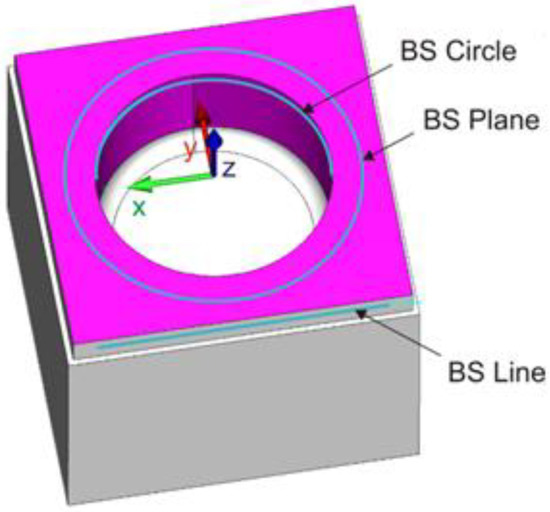
Figure 7.
Base system definition.
A probe with a 3 mm diameter on a length of 50 mm with a Rubin sphere for the measurement was used. The ten circular paths with a distance of 1.5 mm created on a cylindrical surface were used to measure the deviation of circularity and cylindricity. The first circle was measured at a depth of 1.55 mm from the BS Plane. The circles were measured using scanning with a 0.1 mm point-to-point step. For the circularity/roundness measurements, 2 settings were used. In the first case, no filter or outlier elimination was applied, and the least squares method (LSQ) was used for evaluation. In the second case, a Gaussian filter with 4 undulations per revolution was used. A cylinder was created using the Recall feature points function from the measured circular trajectories.
The bottom flatness evaluation used the data recorded by the scanning sensor over 11 concentric circular paths. The largest diameter of the circle was 33 mm, and each additional diameter was 3 mm smaller. A scanning strategy with 0.1 mm point spacing was used for measurement, and an LSQ feature with ±2SD (standard deviation) value elimination and Spline low pass fitting with wavelength LC = 2.5 mm was used for evaluation. The individual measured areas and the evaluated characteristics are shown in Figure 8.
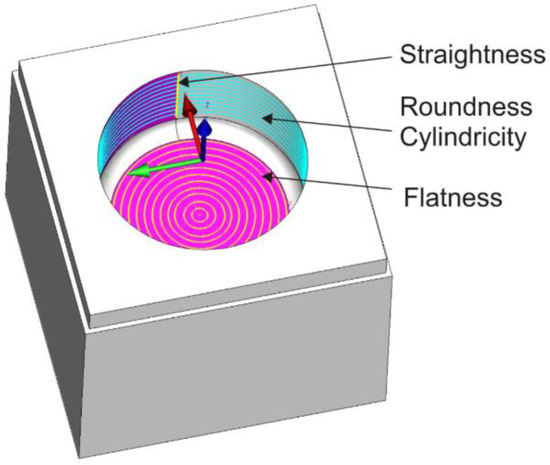
Figure 8.
The individual measured areas and the evaluated characteristics.
A measurement strategy using 4 line segments was chosen to evaluate the straightness of the cylindrical surface of the pocket. The start of the measurement was at a depth of 1.5 mm from the BS plane, and the end of the measurement was at 13.5 mm. A scanning strategy with a step size of 0.1 mm was used for the measurement, and the LSQ (least squares) method and Spline low-pass filter with wavelength LC = 2.5 mm were used for the evaluation without eliminating outliers. The location and indication of the individual lines for the directness evaluation are shown in Figure 9.
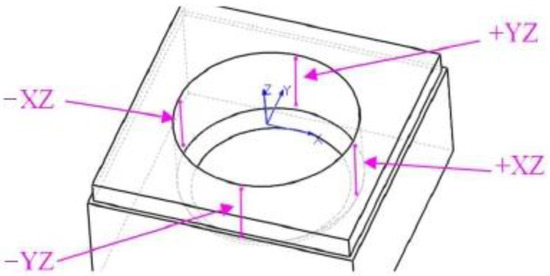
Figure 9.
Representation of the measurement paths in the form of a line segment.
2.2. Methodology for Dimension Evaluation
As part of the manufacturing dimensional accuracy assessment, the distance of the bottom of the pocket from the BS_Plane was evaluated. LSQ feature with ±2SD (standard deviation) value elimination and Spline low pass fitting with wavelength LC = 2.5 mm was used for the evaluation.
2.3. Surface Texture Evaluation Methodology
A digital microscope Keyence VHX-5000 was used for the evaluation of the produced parts. This digital microscope allows viewing any area fully focused in less than a second, and its advanced features eliminate the need for focus adjustment. Due to the high frame rate of its camera, the VHX can quickly scan through the focal range of a sample and recognize areas of focus to build a fully focused image. This provides intuitive and instant focusing and satisfies the universal need for focused magnified observation. The lenses, camera, and graphical output are designed to optimize the relationship between depth-of-field, resolution, and brightness. The selected area for the surface texture evaluation in the CAD model (Figure 10a) and in the machined part is shown in Figure 10b. Figure 10a illustrates the places where 3D maps were created. The measurement was carried out at a distance always offset by 5 mm from the center of the machined part.
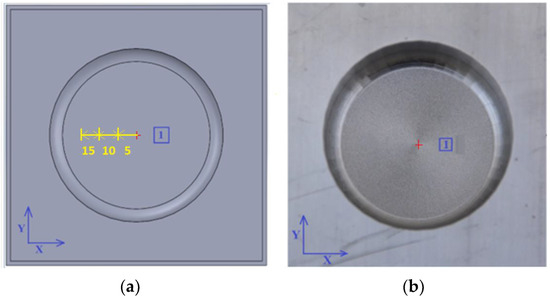
Figure 10.
Surface texture observation area (a) CAD model (b) machined part.
2.4. Roughness Evaluation Methodology
Roughness parameter evaluation complements some knowledge about the surface quality obtained. For practice purposes, the most frequently evaluated parameters are the arithmetic average of the absolute values of the profile heights over the evaluation length known as Ra and the average value of the absolute values of the heights of the five highest-profile peaks and the depths of five deepest alleys within the evaluation length Rz. In an experiment, the above-mentioned roughness parameters were evaluated., A Mitutoyo SJ-410 tester produced in Japan was used for the evaluation.
Three directions were used for the measurement, as shown in Figure 11a. The measurement process is presented in Figure 11b. In each direction, 0°, +45°, and −45° measurements were conducted and then the average value was calculated.
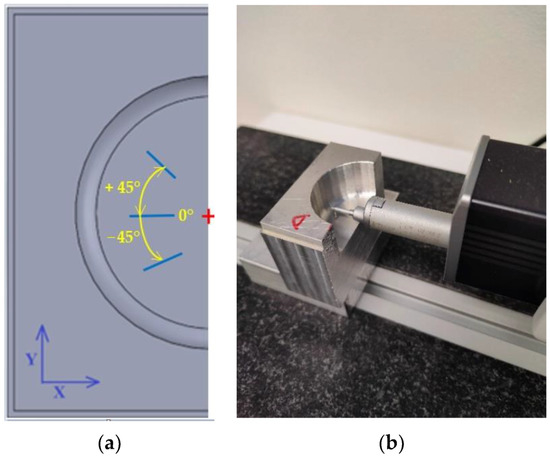
Figure 11.
Surface texture observation area (a) CAD model (b) machined part.
3. Results
Nowadays, it is very important to achieve precise dimensions of the machined part. One way to evaluate the accuracy of the machined surface includes control of geometrical dimensions by coordinate measuring technique. This measurement method is currently the most useful method of recognizing a correctly manufactured part from an incorrect one.
3.1. Geometrical Deviations Evaluation
3.1.1. Roundness Deviations
The deviation of the constant Z strategy and circular pocket strategy is shown in Figure 12, and the deviation of the constant stepover-pocket auto border strategy and spiral strategy is shown in Figure 13, which represents a 5th measured circle from BS Plane at a scale of 100:1. The feature was created by LSQ method. The resulting shape of the curves is caused by interpolation in SolidCAM.
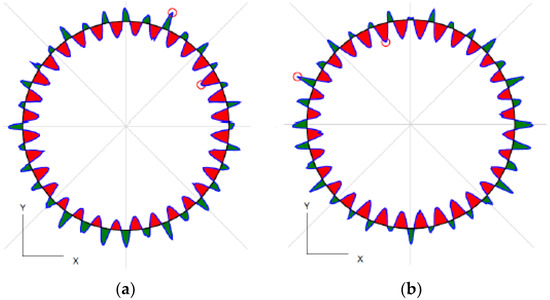
Figure 12.
Roundness deviations (a) Constant Z strategy; (b) Circular Pocket strategy.
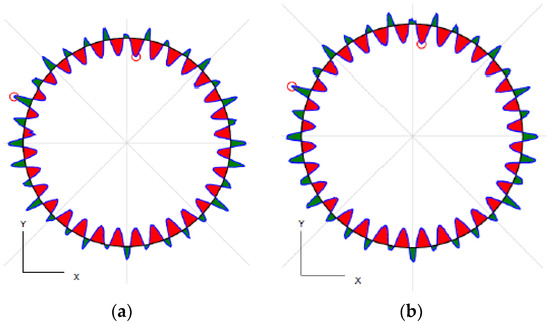
Figure 13.
Roundness deviations (a) constant step over–pocket auto border strategies; (b) spiral strategy.
The roundness values for the single measured circular paths are shown in Table 3. The results show that the test sample produced by the constant Z strategy has the smallest deviations in shape.
Table 3.
Measured roundness deviations.
The boxplot in Figure 14 shows the roundness deviations without using the UPR filter.
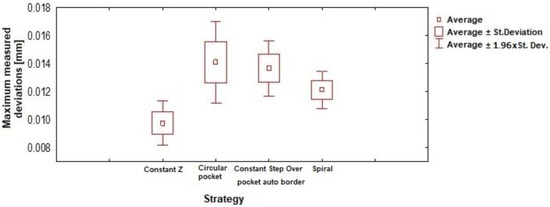
Figure 14.
Roundness deviation without using UPR filter.
In the case of using a UPR filter with a 4 UPR setting, the roundness profile was smoothed by removing the effect of surface roughness and waviness. The use of a filter with this setting is suitable for determining the dimensions (diameter, radius) of a circular pocket. Roundness deviation results for the constant Z strategy and circular pocket strategy are presented in Figure 15, and for the constant stepover-pocket auto border strategy, the spiral strategy is shown in Figure 16 with 100× magnification for circular path 5. The values of the roundness deviations using the filter are given in Table 4. The results show that the smallest deviations of roundness were obtained for the test sample produced by the constant Z milling strategy.
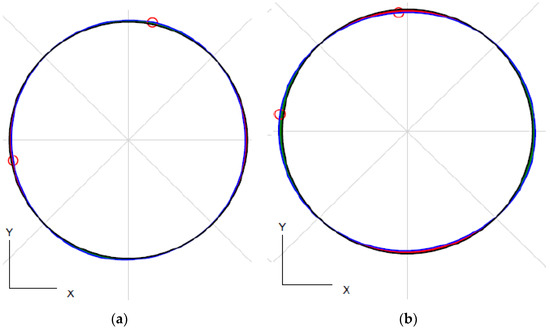
Figure 15.
Roundness deviations (a) constant Z strategy; (b) circular pocket strategy.
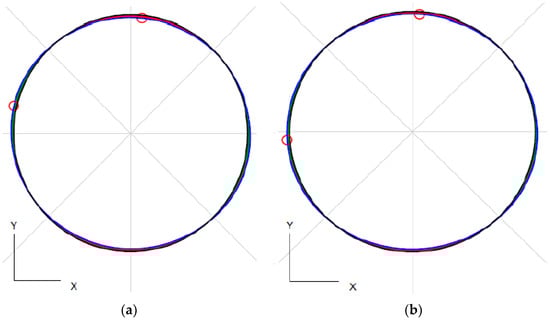
Figure 16.
Roundness deviations (a) constant step over-pocket auto border strategy; (b) spiral strategy.
Table 4.
Roundness deviations using the UPR filter.
The results show that when the UPR filter is used, the roundness value is approximately ¾ smaller, and the standard deviation is 10 times larger than without the filter used. Roundness deviations using the UPR filter are displayed in the form of a graph in Figure 17.
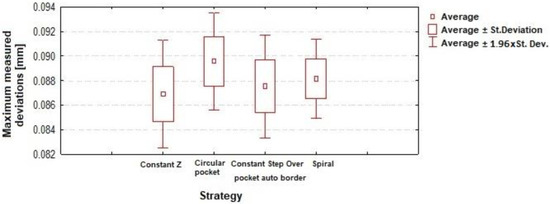
Figure 17.
Roundness deviations using UPR filter.
3.1.2. Deviations of Cylindricity
Cylindricity deviations results for the constant Z strategy and circular pocket strategy are presented in Figure 18, and for the constant stepover-pocket auto border strategy, the spiral strategy is shown in Figure 19 with 20× magnification, where the outer circular path represents 1 circular path from the BS_Plane and the inner 10 circular paths. Positive deviations are shown in green and negative deviations are in red.
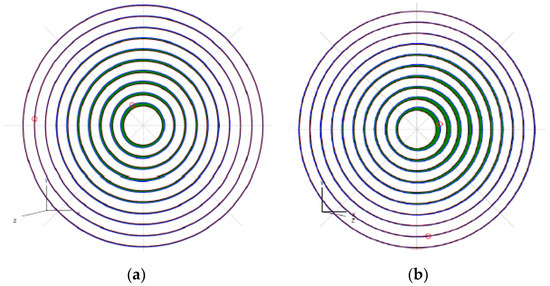
Figure 18.
Cylindricity deviations (a) constant Z strategy; (b) circular pocket strategy.
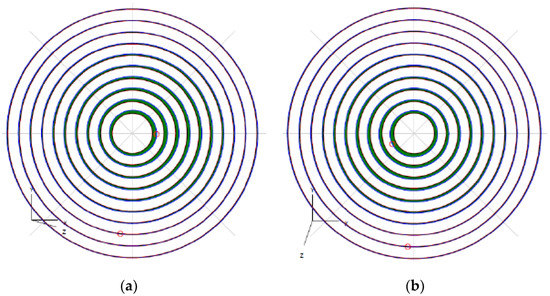
Figure 19.
Cylindricity deviations (a) constant stepover-pocket auto border; (b) spiral strategy.
3.1.3. Straightness Deviations
Straightness deviation results for the constant Z strategy and circular pocket strategy are presented in Figure 20, and for the constant stepover-pocket Auto border strategy, the spiral strategy is shown in Figure 21 with 500× magnification. The red lines indicate the size of the tolerance, i.e., 0.01 mm.
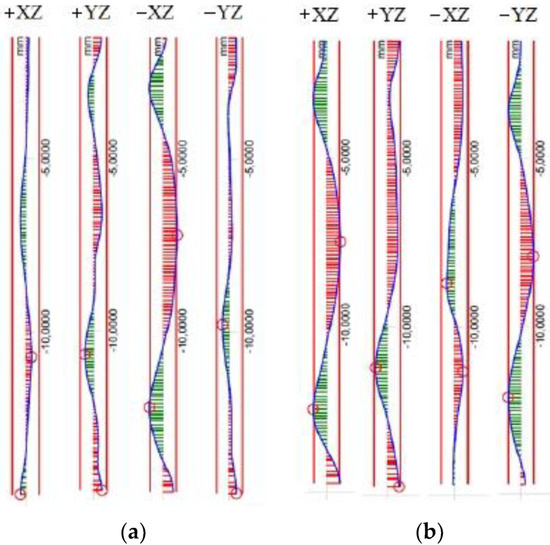
Figure 20.
Straightness deviations (a) constant Z strategy; (b) circular pocket strategy.
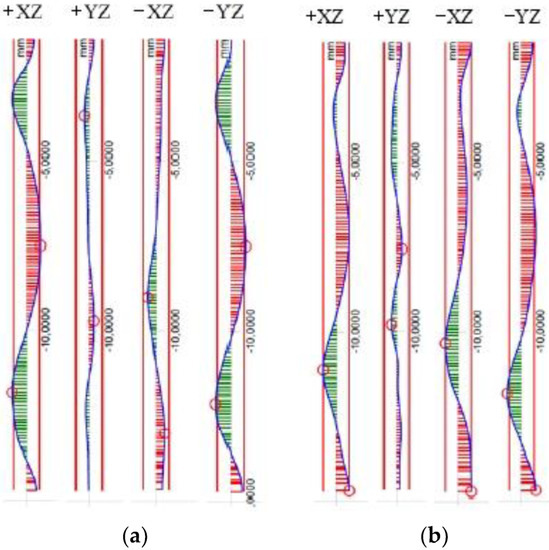
Figure 21.
Straightness deviations (a) constant stepover-pocket Auto border; (b) spiral strategy.
Measured straightness deviations are described in Table 5.
Table 5.
Measured straightness deviations.
The smallest straightness deviation has the part that was produced by the constant Z strategy.
3.1.4. Flatness Deviations
Flatness deviation results for the constant Z strategy and circular pocket strategy are presented in Figure 22, and for the constant stepover-pocket auto border strategy, the spiral strategy is shown in Figure 23 with a scale of 1000:1.
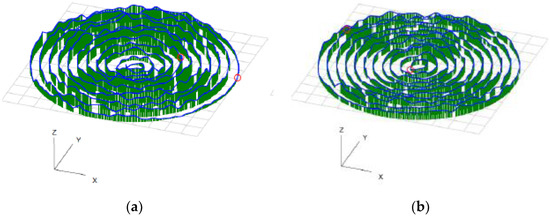
Figure 22.
Flatness deviations (a) constant Z strategy; (b) circular Pocket strategy.

Figure 23.
Flatness deviations (a) constant step over-pocket auto border; (b) spiral strategy.
The flatness values for each production strategy are shown in Table 6. The results show that the best equality value was obtained for the Circular pocket strategy.
Table 6.
Flatness deviations for individual parts.
- Dimension evaluation
The results for each production strategy are shown in Table 7. The nominal depth of the components produced is 20 mm. The results show that the constant stepover pocket auto border strategy has the smallest deviation from the nominal value at 0.0296 mm. The values of the flatness of the bottom influenced the resulting value of the measured dimension only minimally.
Table 7.
Depth comparison for individual parts.
3.2. Surface Texture Evaluation
One of the main factors that have a significant impact on the reliability of a component and its function is the surface texture. Different milling strategies used in the machining process have an effect on the surface texture. After the milling process, different marks are left on the surface. These marks include a tool path or surface defects such as plowing, scratches, tearing, grooves, etc.
The following figures evaluate the surface texture obtained by different milling strategies when the ball end mill was used. A magnification of 100× and 200× was used to evaluate surface texture. The obtained surface texture with the magnification of 100× was extended by displaying an example of a 3D map of the extracted residual scallop height, further called SH, as shown in Figure 24, Figure 25, Figure 26 and Figure 27. The change of color scale for the spiral strategy corresponded to the achieved value of the scallop height in the corresponding area. Example displays of the obtained residual scallop height values are shown in Figure 24, Figure 25, Figure 26 and Figure 27.
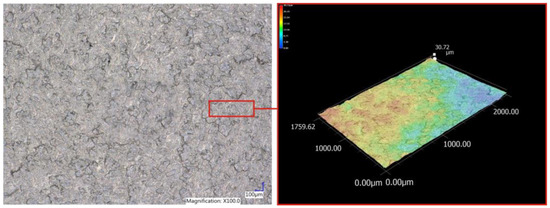
Figure 24.
Display of surface texture and SH in constant Z strategy.
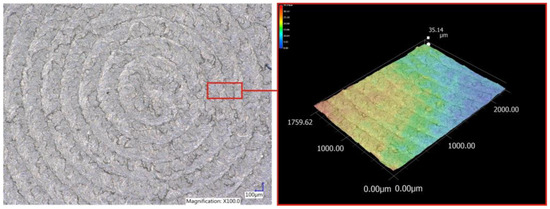
Figure 25.
Display of surface texture and SH in circular pocket strategy.
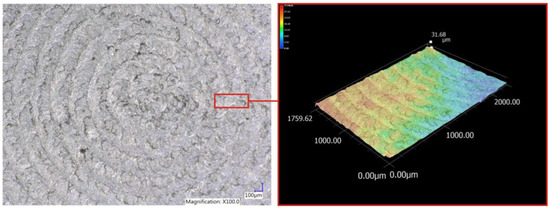
Figure 26.
Display of surface texture and SH in THE constant stepover-pocket auto border strategy.
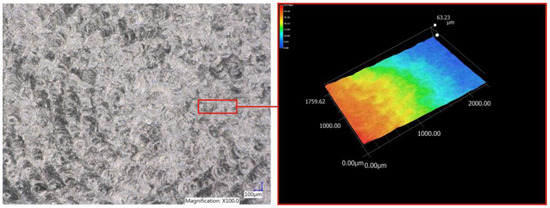
Figure 27.
Display of surface texture and SH in THE spiral strategy.
The obtained values of the residual scallop height after milling in particular positions in relation to Figure 6a are complemented by the graphical representation in Figure 28.
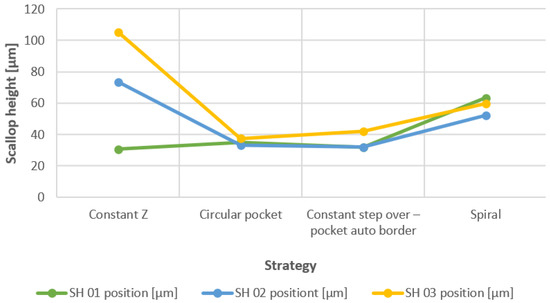
Figure 28.
The comparison of scallop height in particular positions of measuring.
The highest value of the residual scallop height of the workpiece with strategy constant Z was obtained, where a non-oriented machined surface was observed. When circular pocket strategy and constant stepover-pocket auto border, similar values have been reached. Tool marks could be observed on the surface texture achieved by the constant step over-pocket Auto border strategy (Figure 29) and circular-pocket strategy (Figure 30). In both surface textures, the path interval was measured. The obtained 3D map of the residual scallop height for the spiral strategy corresponded with the flatness deviation shown in Figure 23b.
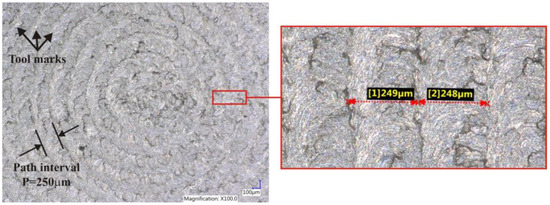
Figure 29.
Tool marks and measured path interval in THE constant step over-pocket auto border STRATEGY.
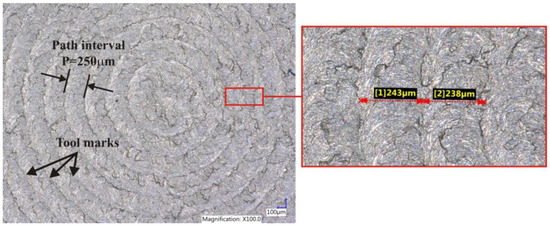
Figure 30.
Tool marks and the measured path interval in THE circular-pocket strategy.
The machined surface shows the obtained period of the paths in the machining process. The measured mark period is approximately equal to the defined path interval (250 μm) in the machining process, as shown in Figure 25 and Figure 26. The individual paths have the shape of concentric circles.
It was possible to observe a non-oriented surface on the machined surface with the spiral strategy. For the spiral strategy, it was not possible to measure the path interval because the machined surface (Figure 31) showed signs of plastic deformation. A so-called plowing effect was created in which a sufficient chip near the center of the tool was not created. Consequently, chip formation was replaced by crushing. The effect of minimum chip thickness was to increase the sliding forces, which resulted in the plowing of the machined surface. A representation of the plowing effect with surface defects on the machined part created by the spiral strategy is shown in Figure 31. On the machined surface, it was possible to see in detail with a setting range of 400× some extrusion cracks and tearing dimples. The tearing dimples were created based on the effect of “squeezing”.
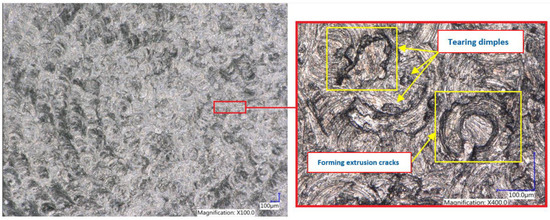
Figure 31.
Display of the plowing effect with surface defects in spiral strategy.
3.3. Roughness Evaluation
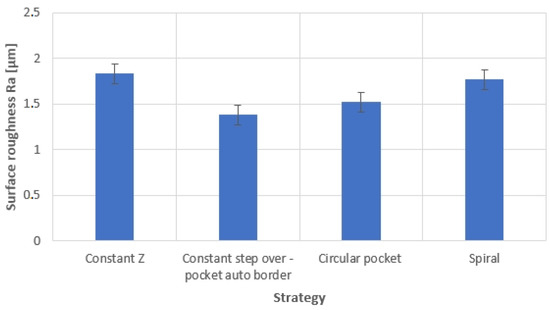
Figure 32.
Comparison of roughness parameter Ra.
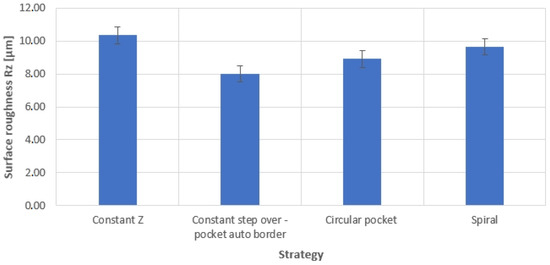
Figure 33.
Comparison of roughness parameter Rz.
The circular pocket strategy and constant stepover-pocket auto border strategy achieved the lowest values in both roughness parameters Ra and Rz. The constant stepover-pocket auto border reached the Ra values from 1.268 μm to 1.492 μm, and the surface roughness depth Rz reached values from 7.437 μm to 8.701 μm. The Constant Z strategy, where the obtained surface was non-oriented, achieved the highest roughness value. The parameter Ra reached values from 1.699 μm to 2.022 μm the surface roughness depth Rz reached values ranging from 10.104 μm to 10.526 μm. Only slightly lower values were obtained for the spiral strategy in comparison with the constant Z strategy.
In comparison with the 3D map of the residual scallop height, where the highest values were obtained in the constant Z strategy and spiral strategy was achieved, it shows that the existence of SH increases the roughness of the machined surface and degrades the surface quality.
4. Discussion
The geometric characteristic evaluation showed the influence of the ball end mill used in the machining process. When comparing the shape deviations, comparable results were achieved. The constant Z strategy achieved the lowest shape deviations. When the roundness deviation was evaluated, the circular-pocket strategy obtained the highest measured values compared to the constant Z strategy, where the measured values were the lowest. Additionally, cylindricity deviation measurement showed a similarity between the circular-pocket strategy and constant stepover–pocket auto border. Similarly, the constant Z strategy achieved the lowest deviations of the cylindricity. When comparing the locations of the cylindricity measurements at different pocket heights, the lowest deviation was measured at the top of the pocket, and the highest deviation was at the bottom of the pocket.
The experimental results show that it was possible to observe an effect of plowing in the surface texture obtained in the spiral strategy, where the cutting tool crushed the material at the tool center. For circular–pocket and constant stepover–pocket auto border strategies, there was minimal effect on the surface texture where circular paths could be observed. The surfaces after these strategies showed no signs of surface defects as in the spiral strategy, where tearing dimples or extrusion crack formation could be observed on the surface. Using the Constant Z strategy, a non-oriented surface texture was obtained in comparison with the circular–pocket and constant stepover–pocket auto border strategy. It can be concluded that there was an oscillation of the end of the cutter until the cutting edge had cut into the part. That means that the cutting by a ball end tool started at zero chip thickness and finished when it reached the minimum chip thickness. The spiral strategy did not perform well for the machining of the planar surfaces when the plowing effect was created. It can also be concluded that the spiral strategy is better for milling surfaces when the machined part includes a shallow region.
3D maps of the extracted residual scallop height for each strategy were observed when examining the surface texture. Obtained result of the residual scallop height for the spiral strategy corresponded with the bottom flatness deviation shown in Figure 23b. In the constant Z strategy, a non-oriented surface was obtained. It can be concluded that the constant Z strategy is not suitable for a planar surface, although it allows for a planar surface machining function. As a result, it would be more suitable for free surface milling where the tool path follows the surface contour at different Z heights.
The roughness parameter was the lowest for strategies with circular paths. Similar values were obtained for the strategies circular pocket and constant stepover-pocket auto border.
5. Conclusions
The aim of the research was to present how the surface texture can be negatively affected when a ball end mill is used. The test sample production was designed in the CAM system SolidCAM, and four different milling strategies were evaluated. The aim of the article was to compare the milling strategies when a pocket surface is milled and to evaluate the roughness parameters and geometrical deviations which resulted from the perpendicular tool position in the machining process. The article also described the effect of the perpendicular tool position on the surface texture and its influence on the roughness.
It is very interesting to evaluate the relationship between the tool and the machined surface while the cutting force is measured. Another interesting experiment could investigate the effect of the milling strategies on concave or convex surfaces in terms of cutting force with different milling strategies. Another point to examine is a change in the tool holder and a comparison of the machined surface texture and roughness parameters when the tool overhang is changing. These experiments are planned for the future. The presented article was conducted to test our assumptions and to obtain data for further research.
Author Contributions
Conceptualization, J.V. and T.T.; methodology, J.V. and T.T.; validation, J.V. and T.T.; formal analysis, J.V., T.T. and Ľ.K.; investigation, J.V.; resources, J.V.; writing—original draft preparation, J.V. and T.T.; writing—review and editing, J.V., T.T. and Ľ.K.; visualization, J.V. and T.T.; supervision, Ľ.K. and E.S.; project administration, Ľ.K.; funding acquisition, Ľ.K. and E.S. All authors have read and agreed to the published version of the manuscript.
Funding
This research was funded by The Ministry of Education, Science, Research and Sport of the Slovak Republic, grant number KEGA 036TUKE-4/2021, 021TUKE-4/2022, VEGA 1/0384/20, VEGA 1/0168/21.
Institutional Review Board Statement
Not applicable.
Informed Consent Statement
Not applicable.
Data Availability Statement
Data will be made available on reasonable request.
Conflicts of Interest
The authors declare no conflict of interest. The funders had no role in the design of the study; in the collection, analyses, or interpretation of data; in the writing of the manuscript, or in the decision to publish the results.
References
- Benardos, P.G.; Vosniakos, G.C. Predicting surface roughness in machining: A review. Int. J. Mach. Tools Manuf. 2003, 43, 833–844. [Google Scholar] [CrossRef]
- Ünüvar, A.; Can, A. A novel iso-scallop tool-path generation for efficient five-axis machining of free-form surfaces. Int. J. Adv. Manuf. Technol. 2010, 51, 1083–1098. [Google Scholar] [CrossRef]
- Langeron, J.M.; Duc, E.; Lartigue, C.; Bourdet, P. A new format for 5-axis tool path computation, using Bspline curves. Comput.-Aided Des. 2004, 36, 1219–1229. [Google Scholar] [CrossRef]
- Romeroa, P.E.; Doradoa, R.; Díaza, F.A.; Rubio, E.M. Influence of pocket geometry and tool path strategy in pocket milling of UNS A96063 alloy. Procedia Eng. 2013, 63, 523–531. [Google Scholar] [CrossRef]
- Choi, B.K.; Kim, B.H. Die-cavity pocketing via cutting simulation. Comput. Aided Des. 1997, 29, 837–846. [Google Scholar] [CrossRef]
- Li, R.; Yang, F.; Wang, X. Modeling and Predicting the Machined Surface Roughness and Milling Power in Scot’s Pine Helical Milling Process. Machines 2022, 10, 331. [Google Scholar] [CrossRef]
- Li, R.; Yao, Q.; Xu, W.; Li, J.; Wang, X. Study of Cutting Power and Power Efficiency during Straight-Tooth Cylindrical Milling Process of Particle Boards. Materials 2022, 15, 879. [Google Scholar] [CrossRef]
- Li, R.; He, C.; Xu, W.; Wang, X. Modeling and optimizing the specific cutting energy of medium density fiberboard during the helical up-milling process. Wood Mater. Sci. Eng. 2022, 1–8. [Google Scholar] [CrossRef]
- Quintana, J.; Ciurana, J.; Ribatallada, J. Surface Roughness Generation and Material Removal Rate in Ball End Milling Operations. Mater. Manuf. Process. 2010, 25, 386–398. [Google Scholar] [CrossRef]
- DIN4760; Form Deviations; Concepts; Classification System. Deutches Institut Fuer Normung, e.V.: Berlin, Germany, 1982.
- Vakondios, D.; Kyratsis, P.; Yaldis, S.; Antoniadis, A. Influence of milling strategy on the surface roughness in ball end milling of the aluminum alloy Al7075-T6. Measurement 2012, 45, 1480–1488. [Google Scholar] [CrossRef]
- Bas, G.; Demircioglu, P.; Durakbasa, N.; Osanna, P.H. A nanometrological management approach to assess the profile and the surface characteristics of the end milling tools by multi-measurement analysis. In Proceedings of the XX IMEKO World Congress. Metrology for Green Growth, Busan, Korea, 9−14 September 2012. [Google Scholar]
- Antoniadis, A.; Savakis, C.; Bilalis, N.; Balouktsis, A. Prediction of Surface Topomorphy and Roughness in Ball-End Milling. Int. J. Adv. Manuf. Technol. 2003, 21, 965–971. [Google Scholar] [CrossRef]
- Varga, J.; Toth, T.; Frankovský, P.; Dulebová, Ľ.; Spišák, E.; Zajačko, I.; Živčák, J. The influence of automated machining strategy on geometric deviations of machined surfaces. Appl. Sci. 2021, 11, 2353. [Google Scholar] [CrossRef]
- Jung, T.S.; Yang, M.Y.; Lee, K.J. A new approach to analysing machined surfaces by ball-end milling, part I. Int. J. Adv. Manuf. Technol. 2005, 25, 833–840. [Google Scholar] [CrossRef]
- Mizugaki, Y.; Hao, M.; Kikkawa, K. Geometric Generating Mechanism of Machined Surface by Ball-nosed End Milling. CIRP Ann.-Manuf. Technol. 2001, 50, 69–72. [Google Scholar] [CrossRef]
- Feng, H.Y.; Huiwen, L. Constant scallop-height tool path generation for three-axis sculptured surface machining. CAD Comput. Aided Des. 2002, 34, 647–654. [Google Scholar] [CrossRef]
- Mizugaki, Y.; Hao, M.; Kikkawa, K.; Terai, H. Theoretical Estimation of Machined Surface Profile Based on Cutting Edge Movement and Tool Orientation in Ball-nosed End Milling. Manuf. Technol. 2003, 52, 49–52. [Google Scholar] [CrossRef]
- Chen, J.-S.; Huang, Y.-K.; Chen, M.-S. A study of the surface scallop generating mechanism in the ball-end milling process. Int. J. Mach. Tools Manuf. 2005, 45, 1077–1084. [Google Scholar] [CrossRef]
- Quan, K.W.; Vickers, G.W. Ball-Mills Versus End-Mills for Curved Surface Machining. Int. J. Adv. Manuf. Technol. 1989, 111, 22–26. [Google Scholar] [CrossRef]
- López de Lacalle, L.N.; Arizmendi, M.; Fernández, J.; Lamikiz, A.; Gil, A.; Sánchez, J.A.; Campa, F.J.; Veiga, F. Model development for the prediction of surface topography generated by ball-end mills taking into account the tool parallel axis offset. Experimental validation. Ann. CIRP 2008, 57, 104. [Google Scholar] [CrossRef]
- Kuroda, M.; Tsukamoto, H.; Omokawa, H.; Egawa, T.; Koreta, N. Analysis of surface roughness generated by ball end mill machining. Int. J. Jpn. Soc. Precis. Eng. 1993, 59, 1537–1542. [Google Scholar] [CrossRef]
- Kruth, J.P.; Klewais, P. Optimization and dynamic adaptation of the cutter inclination during five-axis mill-ing of sculptured surfaces. Mater. Sci. 1994, 43, 443–448. [Google Scholar] [CrossRef]
- Capla, R.; Souza, A.F.; Brandão, L.C.; Coelho, R.T. Some effects of stock variations due to the use of 2 axes strategy on roughing. In Proceedings of the 18th International Congress of Mechanical Engineering, Ouro Preto, Brazil, 6–11 November 2005. [Google Scholar]
- Batista, M.F.; Brandão, L.C.; Coelho, R.T. The influence of some cutting parameters in finishing milling of hardened steel using a ball nose tool. In Proceedings of the 18th International Congress of Mechanical Engineering, Ouro Preto, Brazil, 6 November 2005. [Google Scholar]
- Arruda, E.M.; Brandão, L.C.; Filho, S.L.; Oliveira, J.A. Integrated optimization using mixture design to confirm the finishing of AISI P20 using different cutting strategies and ball nose end mills. Measurement 2014, 47, 54–63. [Google Scholar] [CrossRef]
- Wang, Z.; Hongyu, L.; Tianbiao, Y. Study on Surface Integrity and Surface Roughness Model of Titanium Alloy TC21 Milling Considering Tool Vibration. Appl. Sci. 2022, 12, 4041. [Google Scholar] [CrossRef]
- Liu, C.; Ren, C.Z.; Wang, G.F.; Yang, Y.W.; Zhang, L. Study on surface defects in milling Inconel 718 super alloy. J. Mech. Sci. Technol. 2015, 47, 1723–1730. [Google Scholar] [CrossRef]
- Wang, T.; Xie, L.J.; Wang, X.B. Simulation study on defect formation mechanism of the machined surface in milling of high volume fraction SiCp/Al composite. Int. J. Adv. Manuf. Technol. 2015, 79, 1185–1194. [Google Scholar] [CrossRef]
- Ramos, A.M.; Relvas, C.; Simoes, J.A. The influence of finishing milling strategies on texture, roughness and dimensional deviations on the machining of complex surface. J. Mater. Process. Technol. 2003, 136, 209–216. [Google Scholar] [CrossRef]
- Toh, C.K. Surface topography analysis in high speed finish milling inclined hardened steel. Precis. Eng. 2004, 28, 386–398. [Google Scholar] [CrossRef]
- Mikó, B.; Beňo, J.; Maňková, I. Experimental Verification of Cusp Heights when 3D Milling Rounded Surfaces. Acta Polytech. Hung. 2012, 9, 101–116. [Google Scholar]
- Vyboishchik, A.V. Modelling Topology of Freeform Surfaces with Ball-end Milling. Procedia Eng. 2016, 150, 761–767. [Google Scholar] [CrossRef]
- Li, Y.; Gu, P. Free-form surface inspection techniques state of the art review. CAD Comput. Aided Des. 2004, 36, 1395–1417. [Google Scholar] [CrossRef]
- Gapinski, B.; Grzelka, M.; Rucki, M. The accuracy analysis of the roundness measurement with coordinate measuring machines. In Proceedings of the XVIII Imeko World Congress, Metrology for a Suistainable Development, Rio de Janeiro, Brazil, 17−22 September 2006. [Google Scholar]
- Zheng, P.; Wu, J.; Zhang, L. Research of the On-Line Evaluating the Cylindricity Error Technology Based on the New Generation of GPS. Procedia Eng. 2017, 174, 402–409. [Google Scholar] [CrossRef]
- Nadolny, K.; Kaplonek, W. Analysis of Flatness Deviations for Austenitic Stainless Steel Work-pieces after Efficient Surface Machining. Mater. Sci. 2014, 14, 204–213. [Google Scholar] [CrossRef]
- Mikó, B.; Farkas, G.; Bodonyi, I. Investigation of Points Sampling Strategies in Case of Flatness. Cut. Tool Technol. Syst. 2019, 91, 143–156. [Google Scholar] [CrossRef]
- Kuo, J.; Weng, W. Multi-axis synchronization machining effects on free-form surface with image processing. Int. J. Adv. Manuf. Technol. 2020, 111, 1135–1146. [Google Scholar] [CrossRef]
- Liang, T.; Lu, D.; Yang, X.; Zhang, J.; Ma, X.; Zhao, W. Feed fluctuation of ball screw feed systems and its effects on part surface quality. Int. J. Mach. Tools Manuf. 2016, 101, 1–9. [Google Scholar] [CrossRef]
- Liang, X.; Zahngiang, L. Tool wear behaviors and corresponding machined surface topography during high-speed machining of Ti-6Al-4V with fine grain tools. Tribol. Int. 2018, 121, 321–332. [Google Scholar] [CrossRef]
- Vila, C.; Abellán-Nebot, J.V.; Siller-Carrillo, H.R. Study of Different Cutting Strategies for Sustainable Machining of Hardened Steels. Procedia Eng. 2015, 132, 1120–1127. [Google Scholar] [CrossRef]
- Ali, S.H.R.; Mohamd, O.M. Dimensional and Geometrical Form Accuracy of Circular Pockets Manufactured for Aluminum, Copper and Steel Materials on CNC Milling Machine Using CMM. Int. J. Eng. Res. Afr. 2015, 17, 64–73. [Google Scholar] [CrossRef]
- López De Lacalle, L.N.; Lamikiz, A.; Muñoa, J.; Salgado, M.A.; Sánchez, J.A. Improving the High-Speed Finishing of Forming Tools for Advanced High-Strength Steels (AHSS). Int. J. Adv. Manuf. Technol. 2005, 29, 49–63. [Google Scholar] [CrossRef]


Publisher’s Note: MDPI stays neutral with regard to jurisdictional claims in published maps and institutional affiliations. |
© 2022 by the authors. Licensee MDPI, Basel, Switzerland. This article is an open access article distributed under the terms and conditions of the Creative Commons Attribution (CC BY) license (https://creativecommons.org/licenses/by/4.0/).