Article

Compressive and Tensile Fracture Failure Analysis of Asphalt Mixture Subjected to Freeze–Thaw Conditions by Acoustic Emission and CT Scanning Technologies

College of Transportation, Jilin University, Changchun 130022, China
*
Authors to whom correspondence should be addressed.
Appl. Sci. 2022, 12(21), 10707; https://doi.org/10.3390/app122110707
Submission received: 30 September 2022 / Revised: 17 October 2022 / Accepted: 20 October 2022 / Published: 22 October 2022
(This article belongs to the Special Issue Advanced Technologies in Asphalt Materials)

Abstract

:
The cracking of bitumen pavement in seasonal frozen areas has direct and significant influences on its properties. In order to study the compressive and tensile fracture failure features of basalt fiber-reinforced asphalt mix after freeze–thaw (F-T) treatment, the load–displacement curves under the compression and tensile modes of asphalt mixture after F-T conditions were tested. As a real-time detection means, acoustic emission (AE) was used for testing asphalt mix under compression and tensile load modes. X-ray computed tomography (CT) was employed to represent and evaluate the interior void in F-T conditions. The results showed that, as F-T conditions continue, the compressive and tensile strength of the specimens at different temperatures decreases. The amplitude and count of AE signals with the time history of load level show different characteristics of change in various intervals. AE signal indirect parameters reveal that under compressive and tensile load modes there is a gradual deterioration of performance for asphalt mix due to the coupling interactions between tensile and shear cracks. The asphalt mixtures have different behavior in F-T conditions, which are attributable to interior meso-void characteristics based on CT analysis. This study is limited to the type and loading mode of asphalt mixture in order to quantitatively predict the performance of asphalt mixture.

1. Introduction

In seasonal frozen areas, asphalt pavement will suffer severe freeze–thaw (F-T) damage in the presence of water as well as temperature, which is the accumulation process of microdamage inside the bitumen materials determined by internal and external factors [1,2,3,4]. Under long-term F-T cycles, the asphalt and aggregate surface of asphalt pavement will peel off, and the damage will continue to accumulate, resulting in pavement looseness, peeling, potholes and other degradation [5,6,7,8], and the mechanical behaviours of bitumen are subject to varying degrees of decline.
At present, researchers have worked on F-T damage to asphalt mixture mainly by comparing and analyzing various properties of bitumen mix during the action of F-T conditions to explore F-T damage characteristics [9,10,11]. Huang et al. [12] studied the effect of the F-T cycle on bitumen mix with dense gradation and gap gradation and discussed the damage principle in the space of the bitumen mix in the whole treatment process. They concluded that bitumen mix with gap gradation has preferable F-T resistance. Cheng et al. [13] used diatomite and basalt fiber to improve the performance of asphalt mixture in seasonal freezing areas, analyzed the influence of the F-T cycle on its strength and strain energy through the indirect tensile test, and proposed the stress ratio of the linear zone as well as the nonlinear zone as an evaluation index. Gong et al. [14] used nanomaterials in asphalt mixture for improved freezing and thawing and carried out predictive analysis. You et al. [15] adopted interface bonding intensity for the evaluation of the bitumen mix in F-T conditions by considering the bonding of aggregate and bitumen. Wu et al. [16] studied the water stability as well as the permeability of bitumen mix in frozen conditions, and evaluated the degree of correlation using the grey correlation entropy analysis theory, which is important for early water damage and frost damage. Lovqvist et al. [17] proposed a multi-scale mechanical model to link F-T damage with mechanical property damage. Based on the energy damage and cohesion model, the influence of the F-T condition was simulated to evaluate its degree.
The above studies mainly characterize the F-T damage for bitumen from the perspective of macromechanical properties; it is difficult to reveal bitumen’s F-T damage mechanism. Some researchers began to discuss the frost failure mechanization for bitumen from a meso perspective, as well as via acoustic technology. Liu et al. [18] performed the model reconstruction of bitumen based on CT and DIP, used an indirect tensile experiment for determining its tensile strength, and proposed a research method for an asphalt mixture performance mechanism based on the evolution of pore fractal dimension. Ji et al. [19] analyzed the internal structure through CT images during the whole treatment process, and the results showed that its porosity as well as water content had a good relevance with mechanical strength for bitumen. Ahmad et al. [20] adopted CT scanning technology to discuss the relationship between micro characteristics and performances for a porous bitumen mix and then quantitatively analyzed their corresponding relationships. Carpinti et al. [21] discussed the self-similarity of microcrack distribution through the amplitude of acoustic emission signals so as to analyze the damage evolution of the structure. Qiu et al. [22,23] studied the correlation between the acoustic emission (AE) characteristics of asphalt mixture and its damage behavior. Jiao et al. [24] used clustering theory for classifying the failure mode of permeable bitumen based on the indirect parameters of acoustic emission signals, namely, RA and AF values.
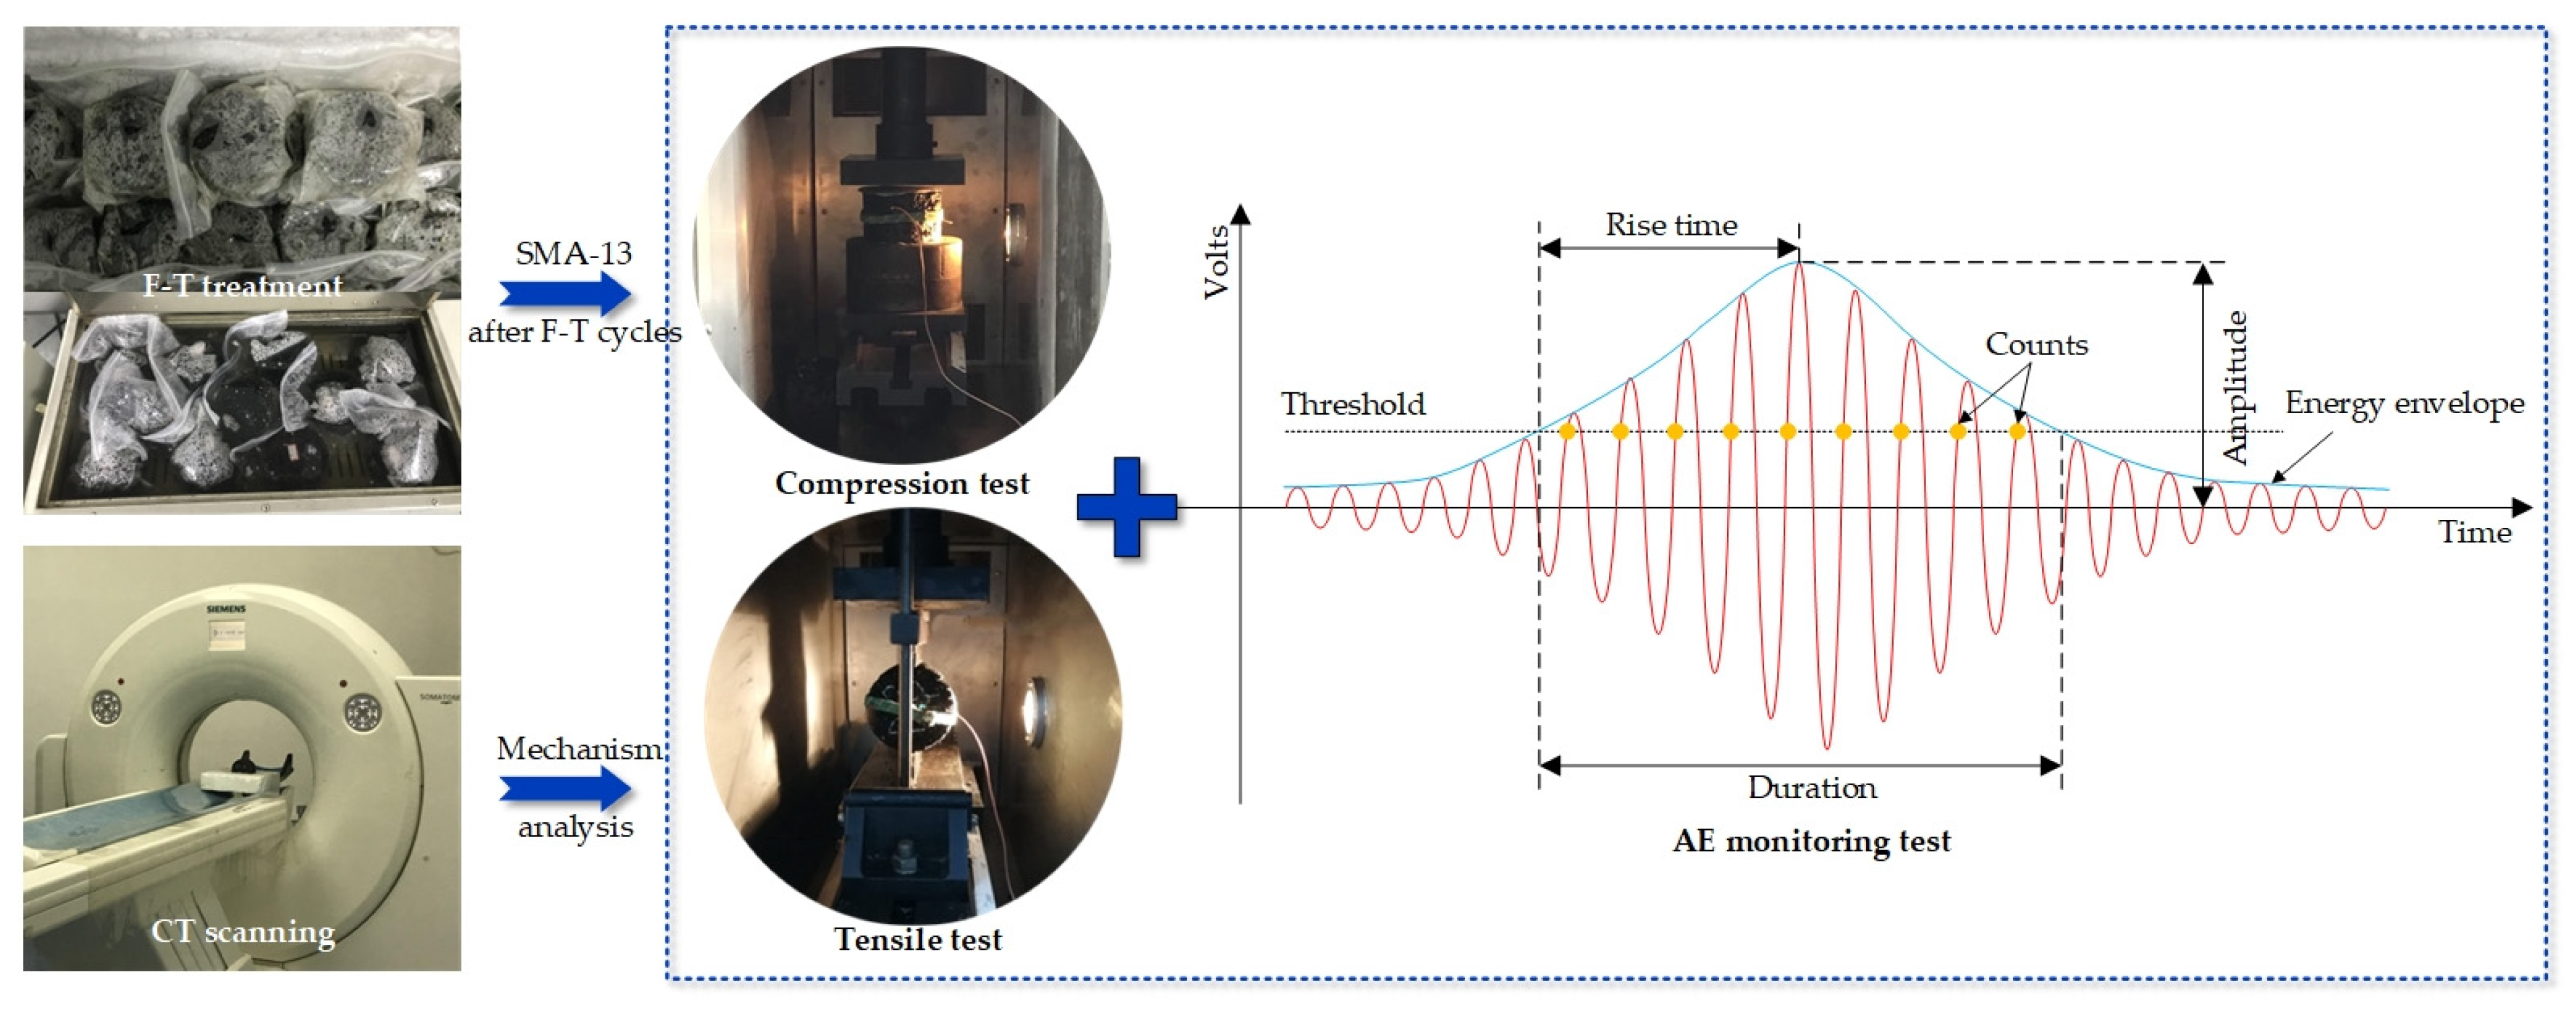
There are some research projects about F-T damage and its attenuation law with asphalt mixtures. However, damage evolution research is not comprehensive and systematic. The general objectives of this research are to investigate the effect of the F-T condition on the mechanical properties and fracture characteristics of asphalt mixture. The specific objective of this research is to explore the correlation between macromechanical properties and AE signal characteristics of SBS-modified asphalt mixture. The research innovation is that the damage development of macromechanical properties for asphalt mixture is revealed from the perspective of AE signal characteristics and meso volume characteristics. SMA-13 with basalt fiber was designed, and the load–displacement curves under compression and tensile modes of asphalt mixture subjected to F-T conditions were measured. The AE response of the asphalt mixtures under the compression and tensile load modes was measured via AE detection. The internal structure of SMA-13 can be obtained by using CT scanning technology. The research framework of this study is shown in Figure 1.

2. Materials and Methods

2.1. Raw Materials and Specimen Preparation

SBS-modified asphalt is widely used as pavement bitumen because of its excellent performance [25]. In this study, SBS-modified asphalt from Yingkou, China, has favorable properties, as shown in Table 1. Basalt and limestone were selected for aggregate, as well as mineral filler, respectively. Their physical parameters are presented in Table 2, Table 3 and Table 4. All parameters meet the requirements of Chinese standard (JTG F40-2004). Basalt fiber with a length of 6 mm and diameter of 13 μm was selected as a fiber stabilizer, and the basic performances are listed in Table 5.
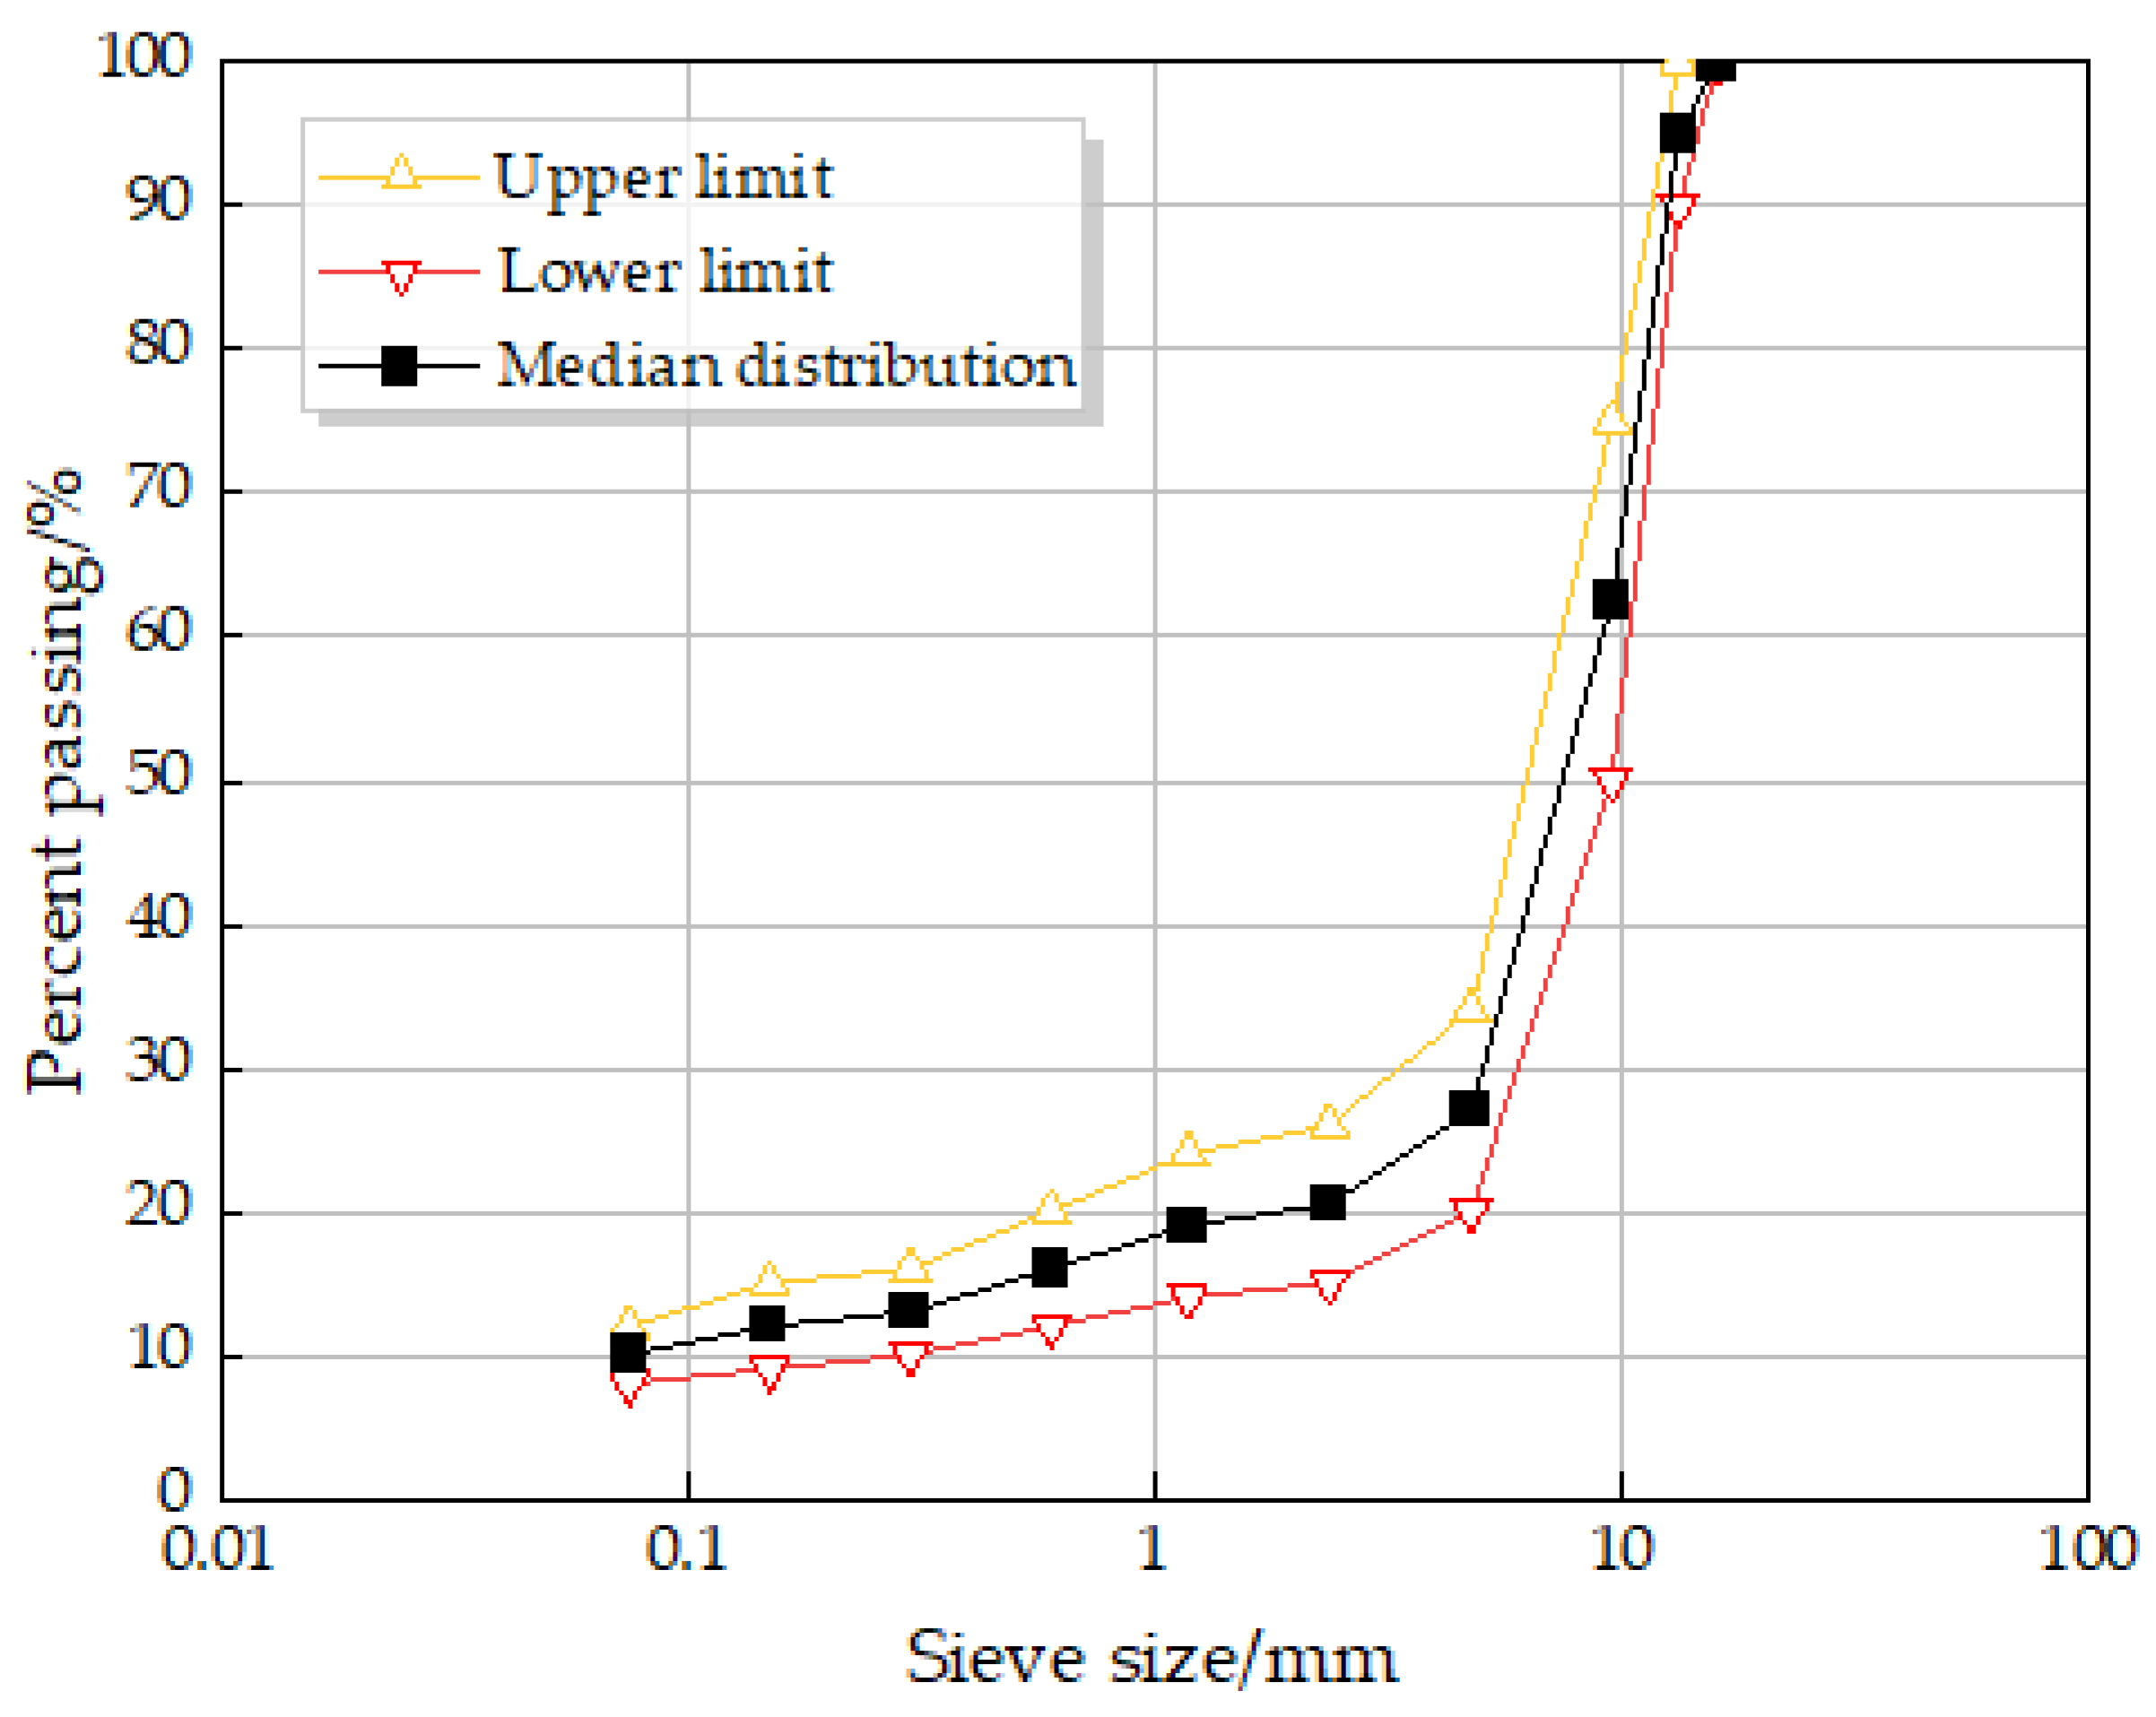
The stone mastic asphalt (SMA) mixture investigated is the same as the mixture investigated by previous studies [26,27]. The aggregate gradation, reported in Figure 2, is typical for pavement layers placed on Chinese motorways. At the same time, the sieve analysis was conducted following ASTM C136; the nominal maximum aggregate size (NMAS) for SMA mixtures is 13.2 mm. The mixing and compaction parameters of loose bitumen were obtained through SGC according to Wang et al. [28]. Moreover, the optimum asphalt binder content of the asphalt mixture was determined by the volumetric parameters of the asphalt mixture. The total SBS bitumen is 5.7% aggregate weight for all the mixtures. The cylindrical mix of ∅150 mm × 170 mm was made at the rotation angle of 1.25° and vertical pressure of 600 kPa. Finally, the cylindrical mix with a dimension of ∅100 mm × 150 mm was made by using a core drilling machine. Then, the experimental specimens were prepared after cutting the upper and lower surfaces.

2.2. Experimental Procedure

In this study, the prepared SMA-13 specimens were first treated with F-T treatment from zero to twenty-one times. The freezing condition was −18 °C for sixteen hours, and the thawing condition was 60 °C for eight hours. Then, a strain-controlled single-axis compression experiment was conducted at 50 °C to evaluate the compressive strength of bitumen. A strain-controlled splitting experiment was conducted at −10 °C to evaluate the cracking resistance according to Chinese Standard (JTG E20-2011 T0713/T0716). The compressive and tensile load conditions are the common loading modes of asphalt pavement. Therefore, single-axis compression at a higher temperature condition and cleaving at a lower temperature condition were performed to analyze the macromechanical properties of bitumen. At the same time, AE technology was adopted to monitor the response during the compressive and tensile fracture process. To study the F-T condition effects on pore structure, CT scanning and image processing technology were performed for asphalt mixtures subjected to F-T conditions. The experimental procedure is summarized in Figure 3.

3. Results and Discussion

3.1. Compressive and Tensile Response Analysis Subjected to F-T Conditions

The mechanical results for bitumen incorporating basalt fiber are plotted in Figure 4 for the whole F-T treatment process, including the single-axis compression test and splitting test. From Figure 4, as F-T cycles increase, the single-axis compressive strength gradually declines. Compared with the control group (that is, bitumen without treatment), after F-T conditions, the loss rates of the high-temperature single-axis compressive strength of the bitumen mix are 6.74%, 9.76%, 10.98%, 11.87%, 15.04%, 17.24% and 24.05%, respectively. In the F-T pre-treatment, the single-axis compressive intensity of the bitumen mix declines quickly and levels off in the period of 6–12 times. When freezing–thawing treatment reaches 15–18 cycles, the loss rate of single-axis compressive strength increases. From Figure 4, the splitting intensity for bitumen mix incorporating basalt fiber gradually declines as F-T treatment continues. Meanwhile, after F-T conditions, compared with the control group, the loss rates of the low-temperature splitting intensity for bitumen mix are 8.27%, 14.71%, 18.43%, 19.96%, 21.78%, 28.52% and 31.56%, respectively. In the F-T pre-treatment, the low-temperature splitting intensity continues to decline and gradually tends to be flat after F-T conditions, and splitting strength decreases obviously. The development law of frost damage in cleaving at a lower temperature condition is similar to the above single-axis compression at a higher temperature condition. These results corroborate the findings of much of the previous work on the performance degradation of asphalt mixture under F-T conditions.

3.2. Fracture Failure Process Analysis Subjected to F-T Conditions

3.2.1. Fracture Failure Evaluation by AE Index

(1)
Compressive fracture failure analysis under F-T cycles
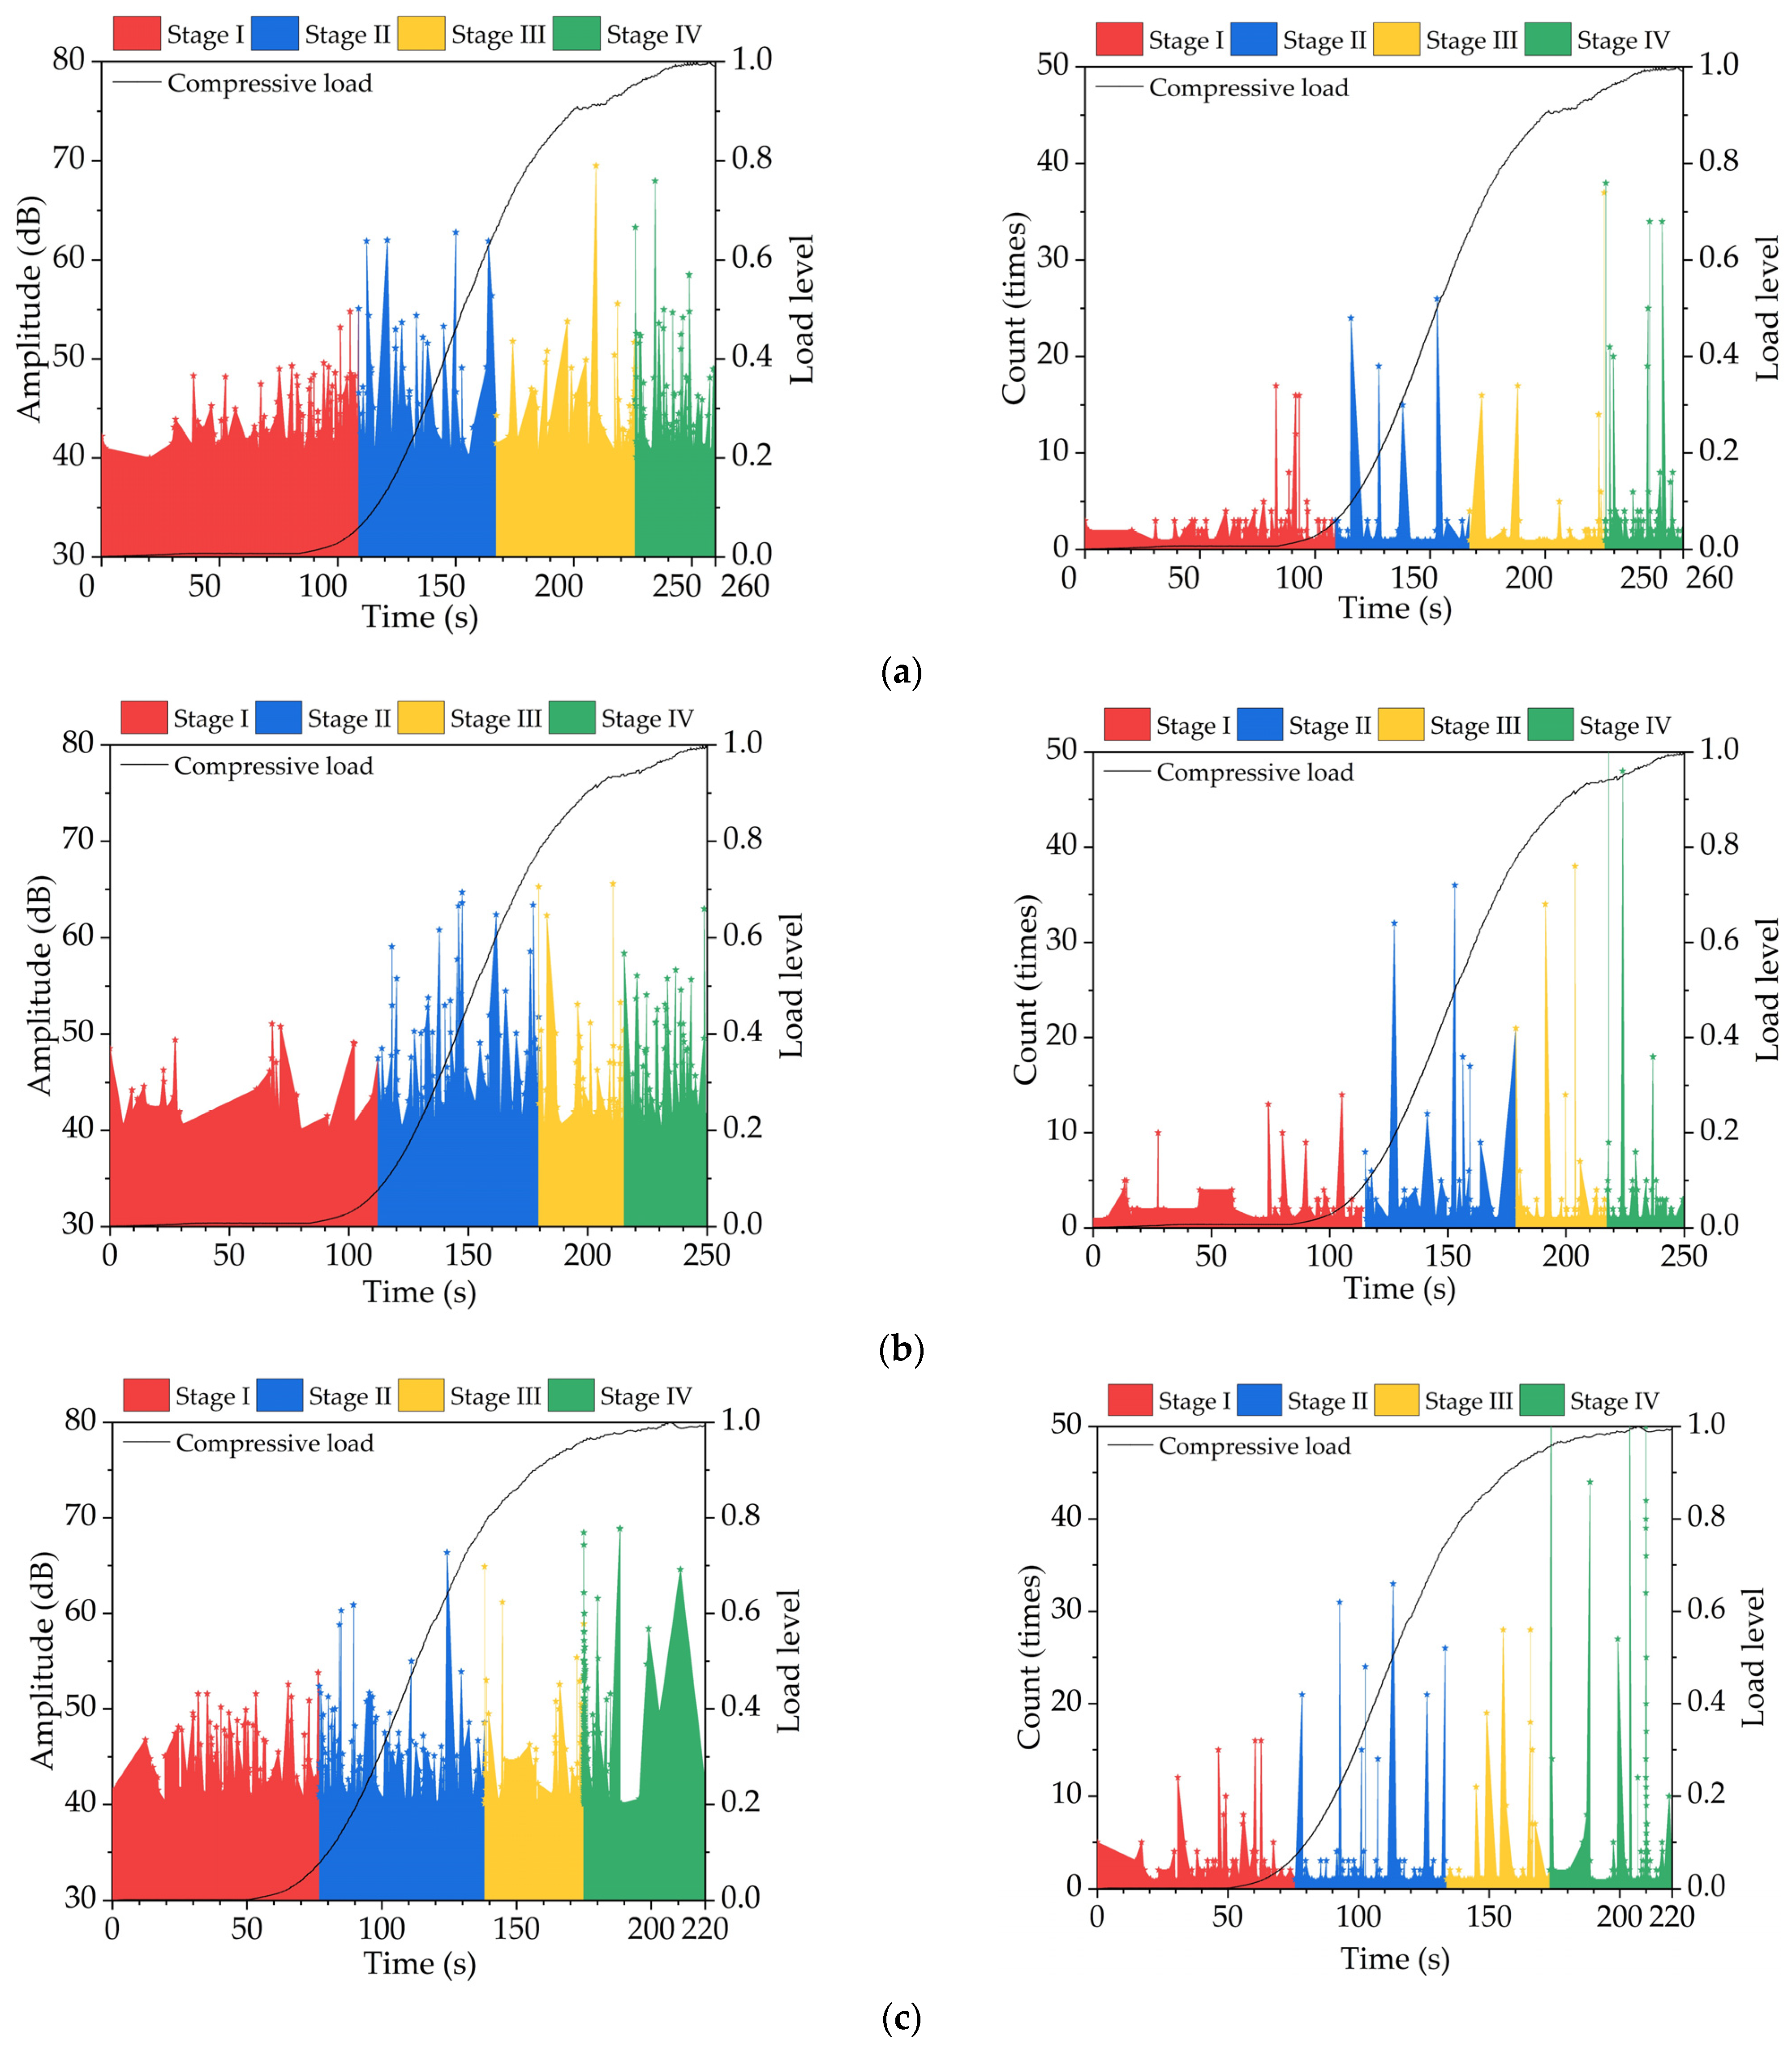
To facilitate comparative analysis, the load is usually standardized. In the high-temperature uniaxial compression test, the failure process of asphalt mixture could be divided into three parts on account of compressive loading versus loading time [29]. These three stages are described as: (1) the loading level is stable at a low level for a long time; (2) the loading level has an obvious inflection point and increases rapidly; (3) the loading level has an obvious inflection point again and gradually tends to be gentle, reaching the maximum value. By comparison, AE signal indexes are adopted to describe fracture process growth, particularly in identifying damage stages. Their difference is in the second stage according to the compressive load curve vs. loading time and could be further divided into another two stages, which is a new finding in comparison with previous studies.
Figure 5 shows the AE signal’s direct parameters (including amplitude and count) versus compressive load level for the asphalt mixture subjected to F-T conditions. As illustrated, the results of signal amplitude and the count would have more significant and detailed fracture stages accompanied by the load level with loading time. The variation trends of the AE signal’s direct parameters (including amplitude and count) for the asphalt mixture show a similar change trend for different F-T cycles. Combined with the intensity change in the AE signal’s direct parameters and load level change, the fracture failure process can be divided into several stages (I–IV), which is in accordance with the present results [30].
  • Stage I—micro-crack initiation:
Firstly, the smaller signal values of amplitude and count are observed, in which the amplitude values at Stage I are mainly distributed in the range of 40–50 dB, and the count values at this stage are mainly distributed in the range of 0–10 times. The reasons for the change in the AE signal’s direct parameters are mainly because of micro-crack formation inside the specimens under the action of compressive loading.
  • Stage II—micro-crack accumulation:
Then, the AE signal values of amplitude and count change obviously, in which the amplitude values at Stage II are mainly distributed in the range of 50–60 dB, and the count values at this stage are mainly distributed around 20 or 30 times. At this time, the load level is at the first inflection point (i.e., the boundary between red and blue areas) and then increases sharply. The AE signal is mainly caused by the number of micro-cracks in the specimen gradually increasing and the micro-damage continuing to accumulate.
  • Stage III—damage development:
Subsequently, the AE signal values of amplitude and count decrease a little, in which the amplitude values at Stage II are mainly distributed around 50 dB, and the count values at this stage are mainly distributed around 10 or 20 times. At this time, the second inflection point (i.e., the boundary between yellow and green areas) occurs in the load level of this stage. The AE signal is mainly caused by the load continuing to load, and the gradual accumulation of micro-crack leads to the rapid growth of interior damage.
  • Stage IV—macro-crack generation:
Finally, the AE signal values of amplitude and count change only slightly, but the compressive load level gradually becomes gentle and reaches the maximum value. At this stage, obvious macroscopic cracks appear on the asphalt mixture specimens.
(2)
Tensile fracture failure analysis under F-T conditions
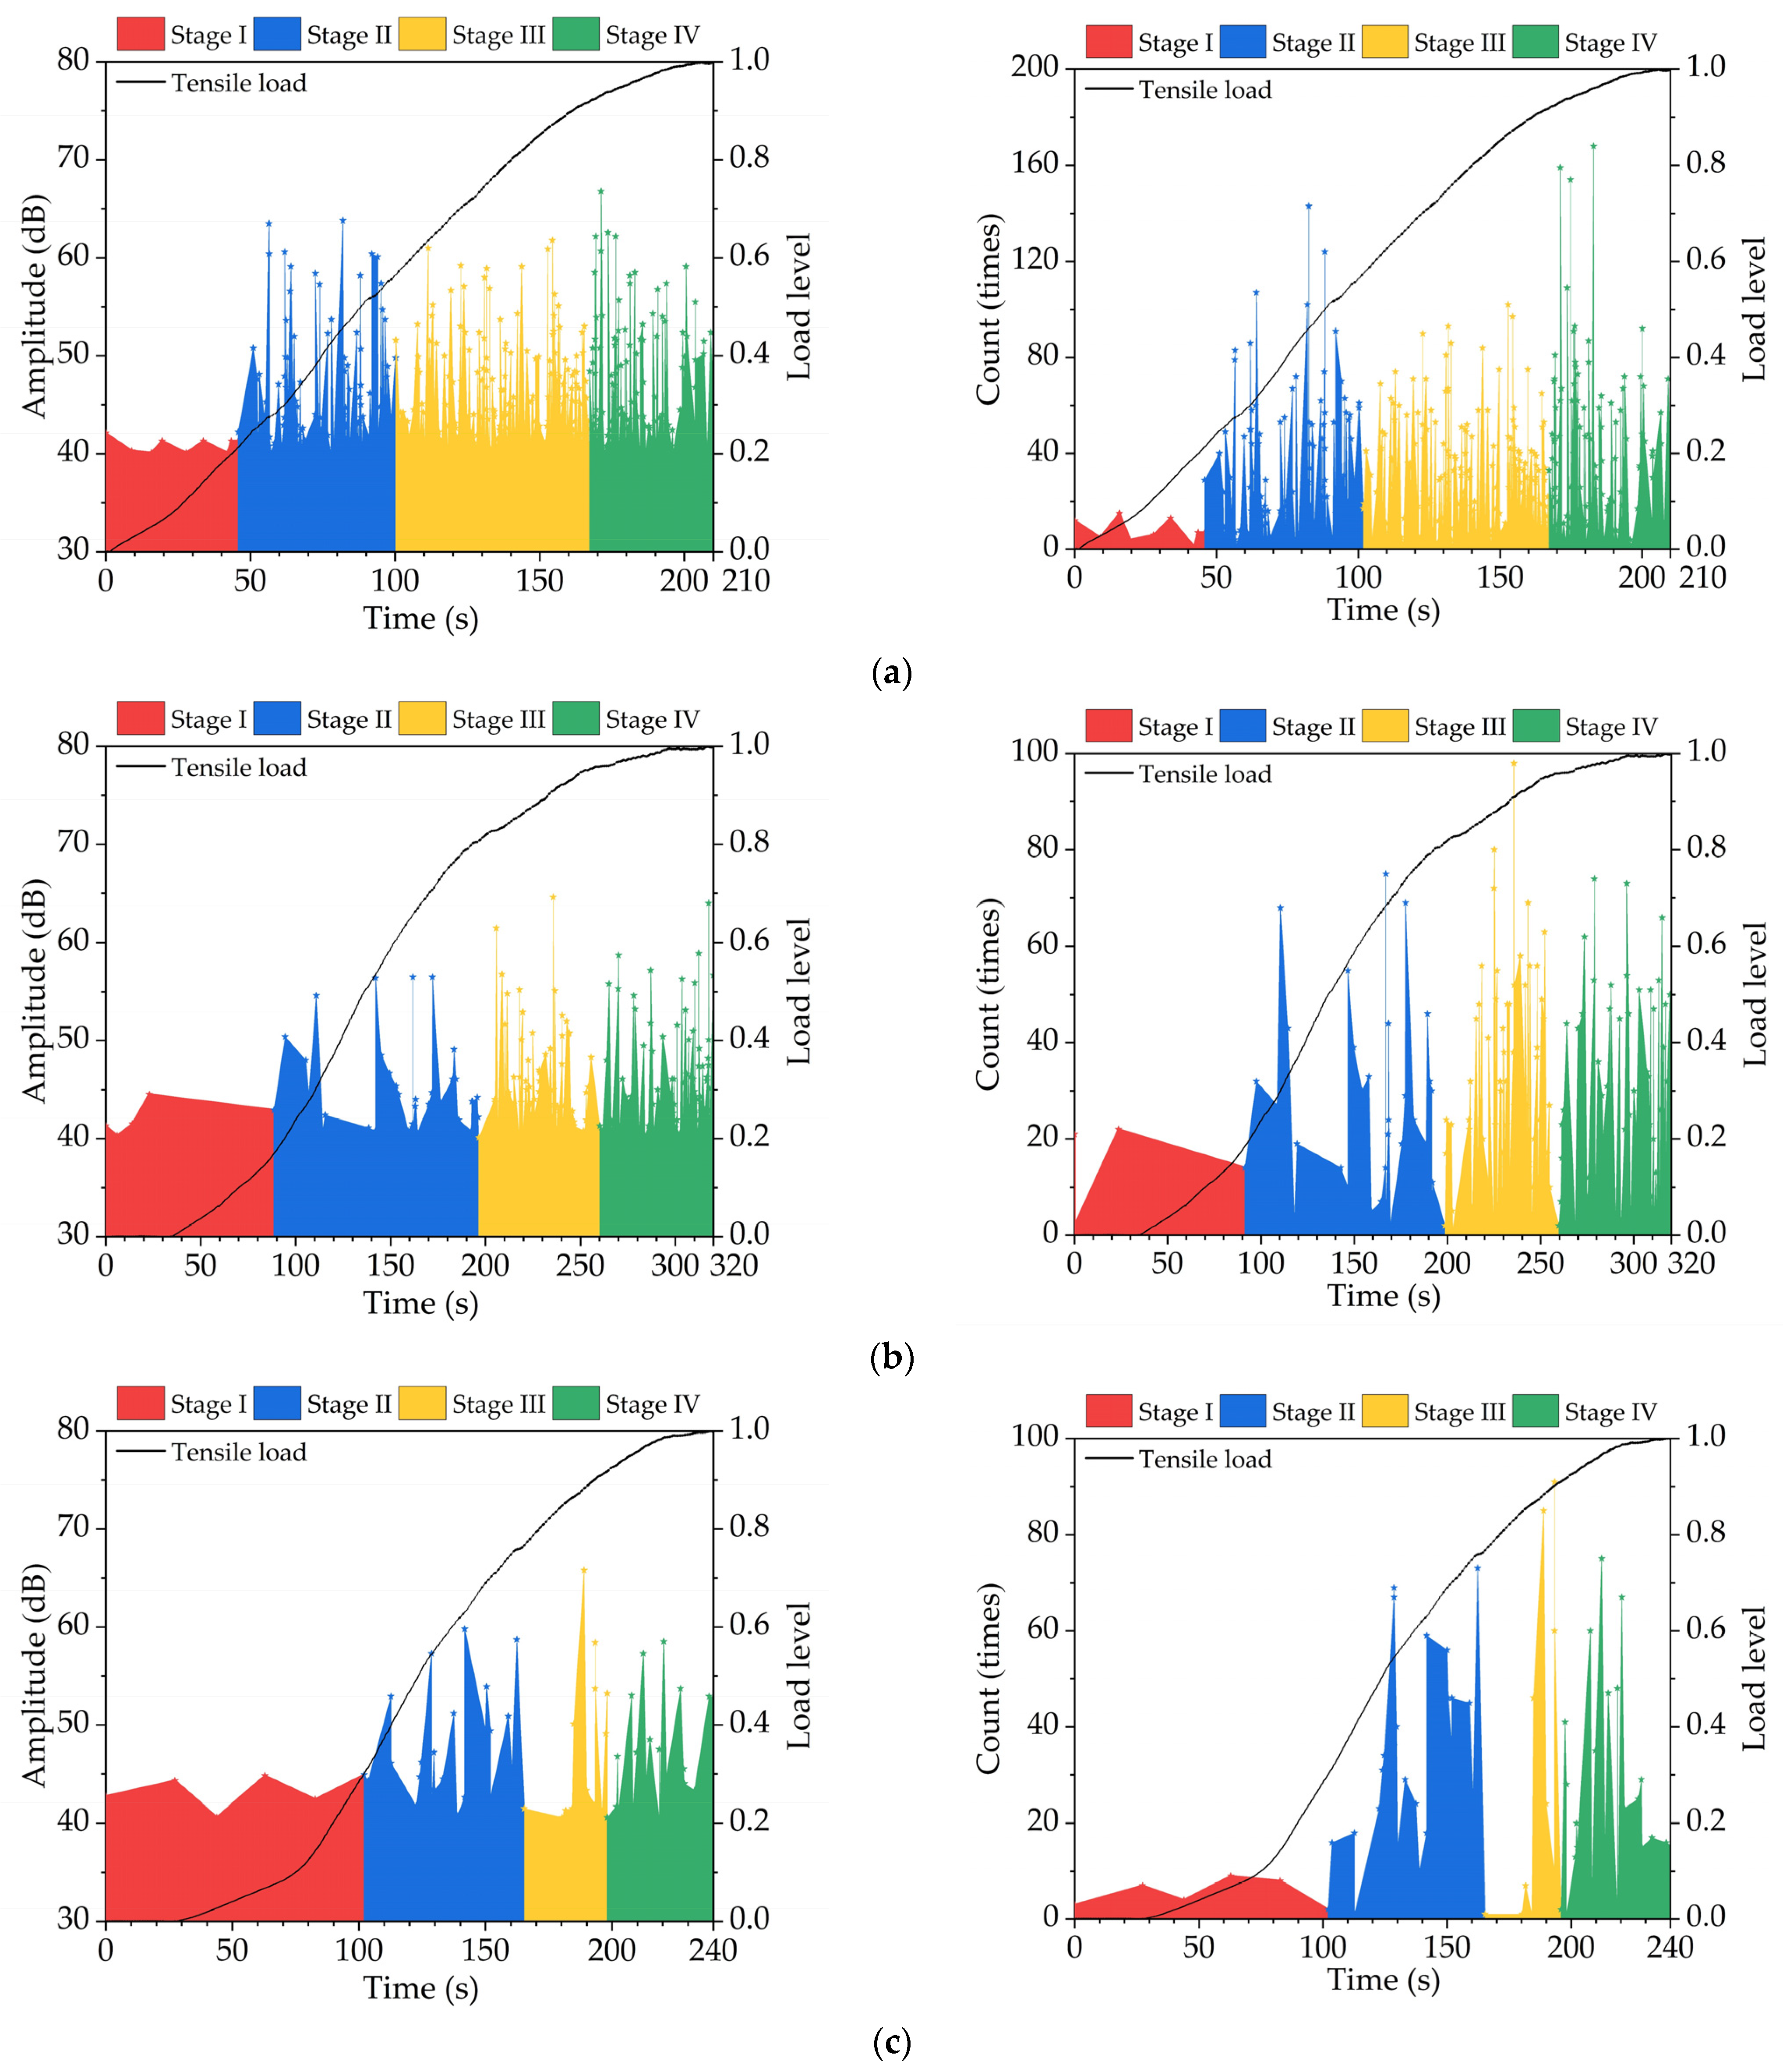
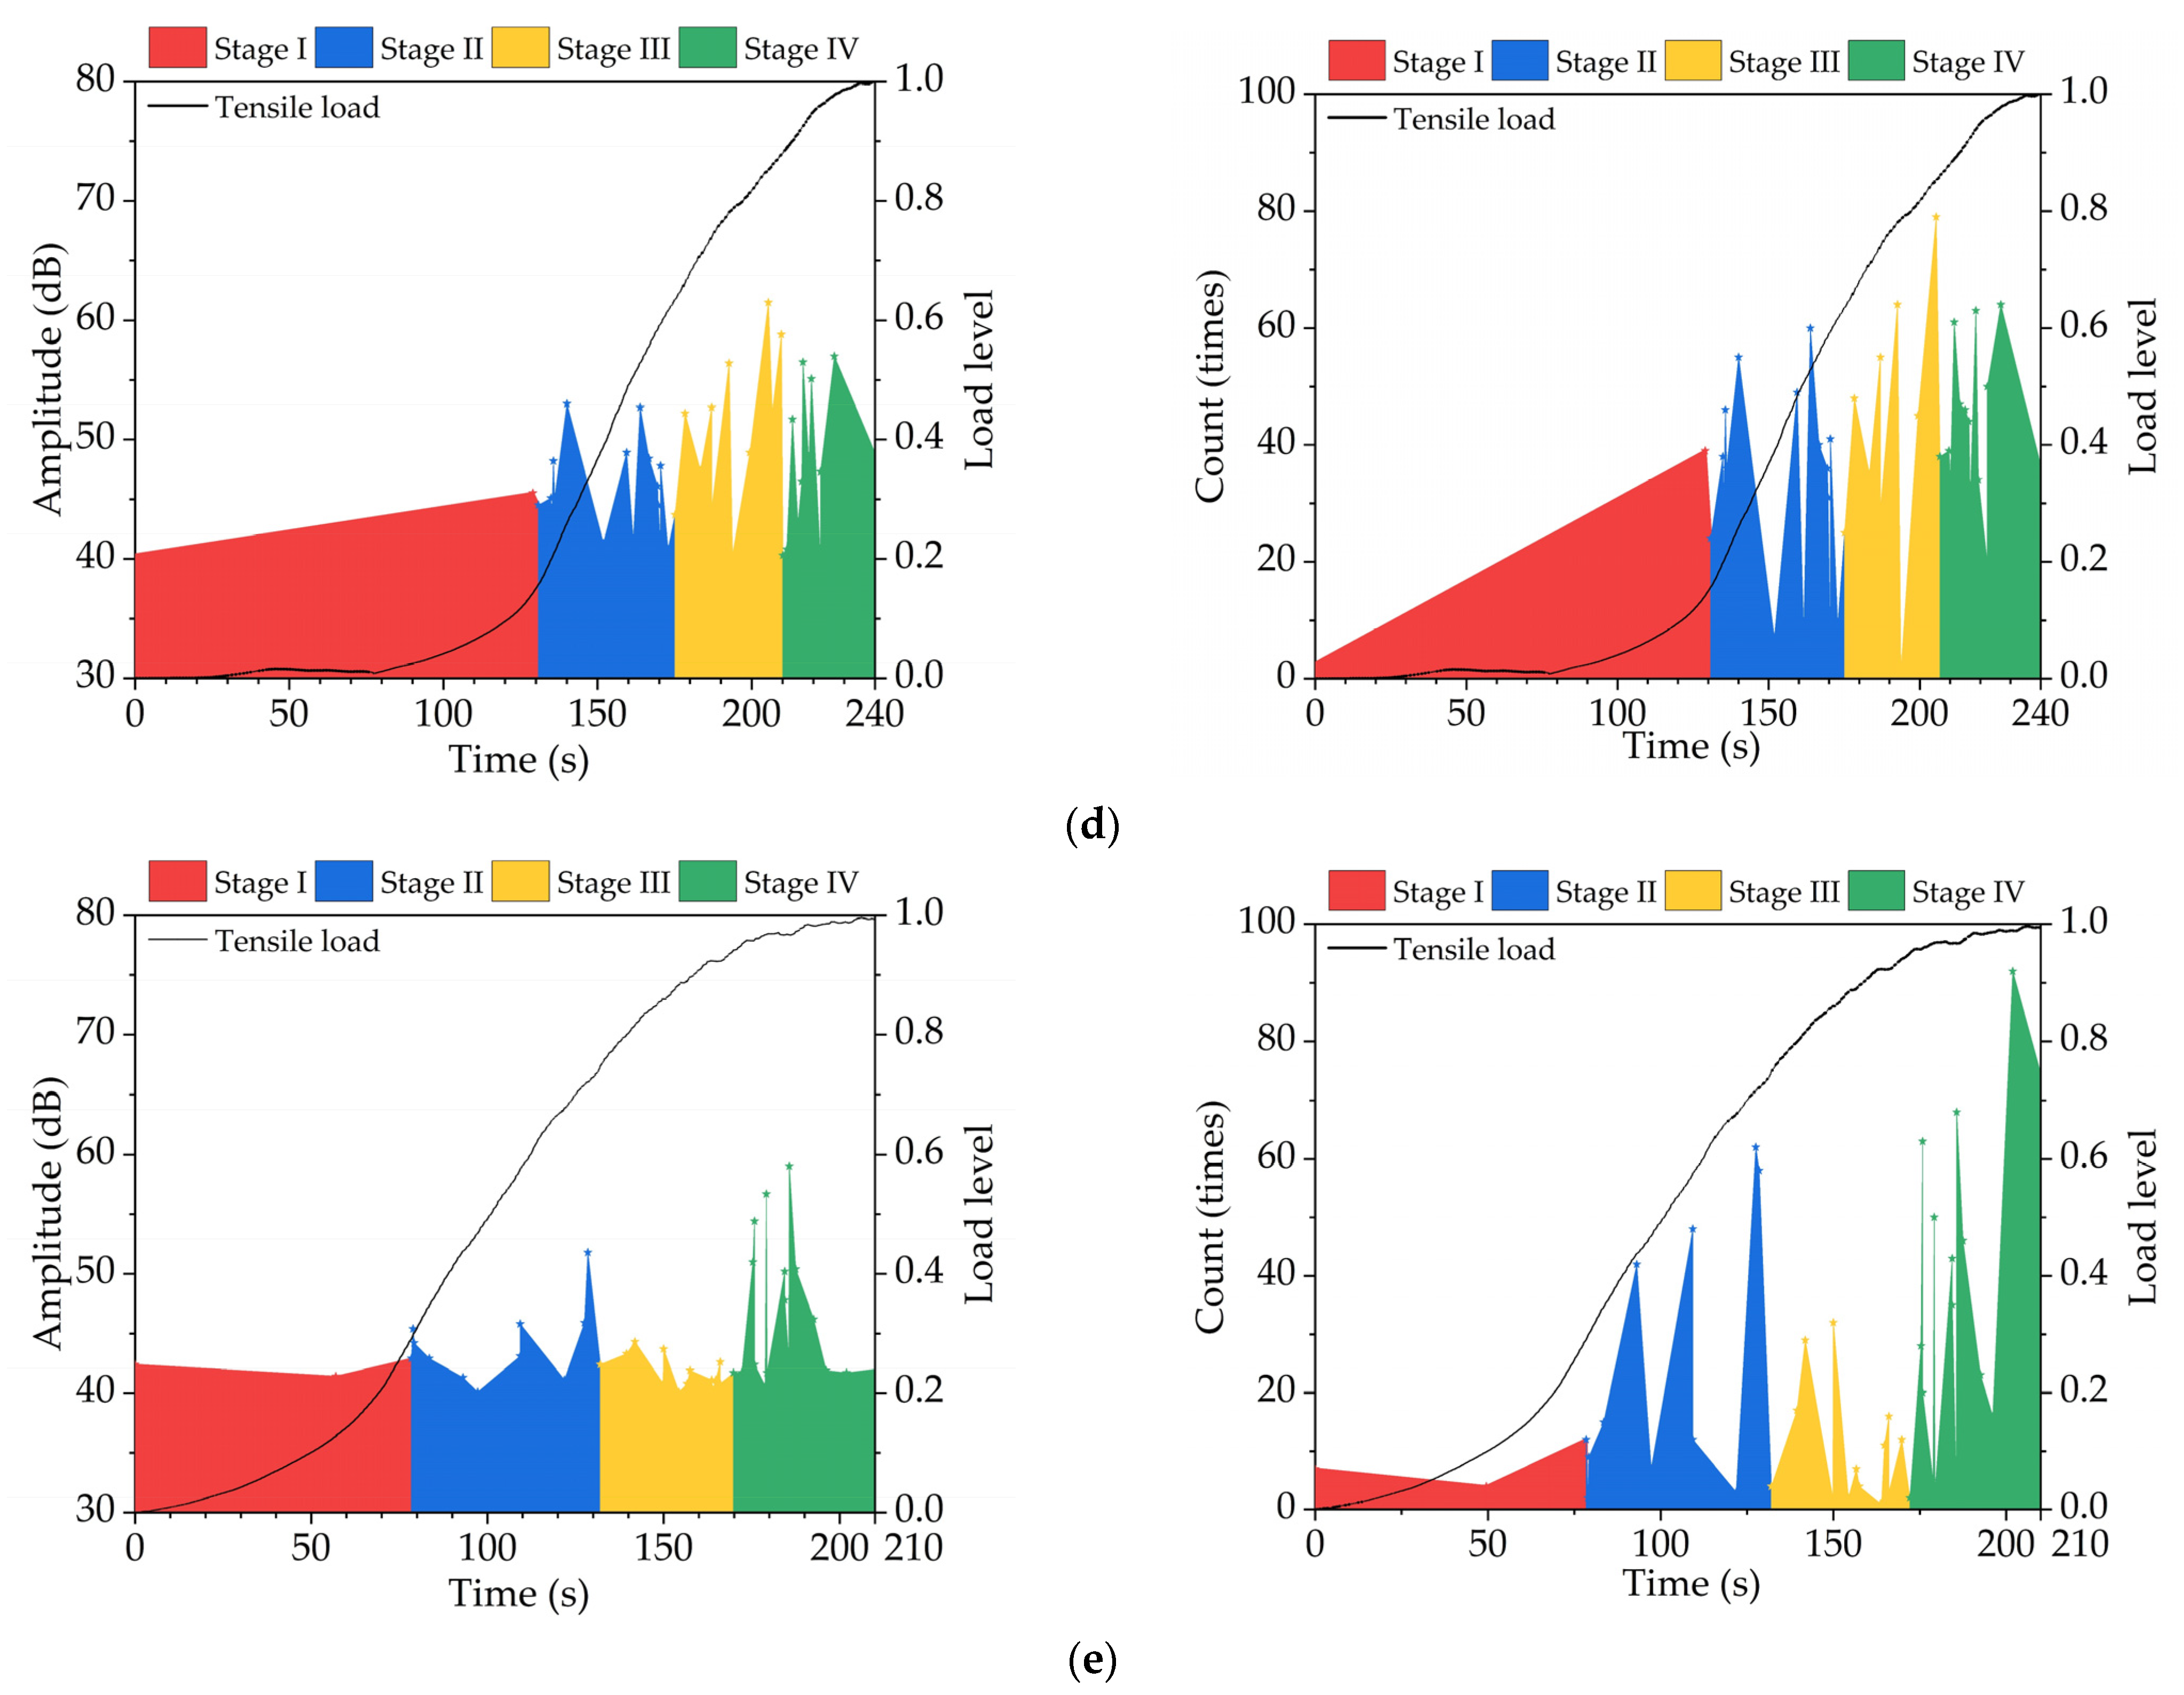
The AE signal’s direct parameters (including amplitude and count) versus tensile load level are plotted in Figure 6 for bitumen subjected to F-T conditions. As illustrated, the results of signal amplitude and the count would have more significant and detailed fracture stages accompanied by the load level with loading time. The variation trends of the AE signal’s direct parameters (including amplitude and count) for the asphalt mixture show a similar change tendency under F-T conditions. Combined with the intensity change in the direct parameters and the load level change, the fracture damage procedure can also be separated into four stages, i.e., (1) I—micro-crack initiation, (2) II—micro-crack accumulation, (3) III—damage development, and (4) IV—macro-crack generation. The development trend of these four stages under the tensile mode is similar to that under the compression mode.

3.2.2. Fracture Failure Process Analysis Based on AE Signal Indirect Parameters

Based on the correlation between the indirect parameters including average frequency (AF) and rise angle (RA), the fracture failure modes are classified and are calculated by the following equations:
AF = counts/duration,
RA = Rise time/Amplitude
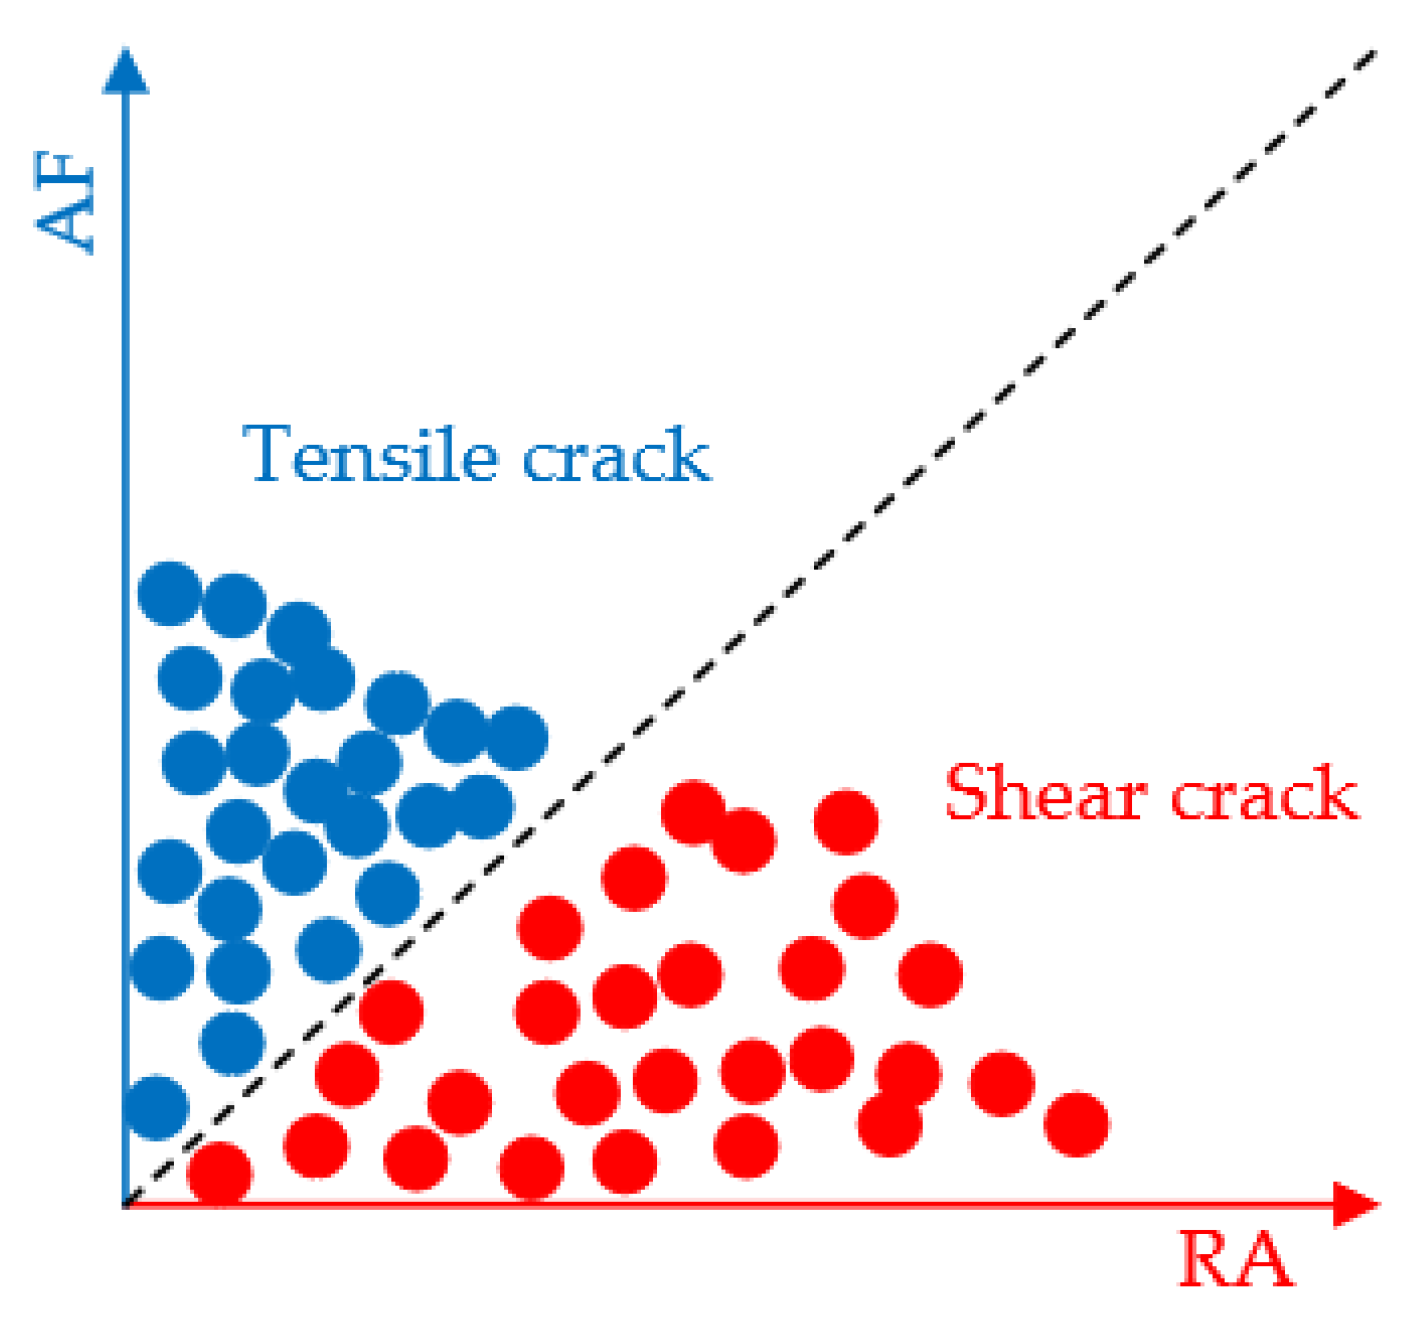
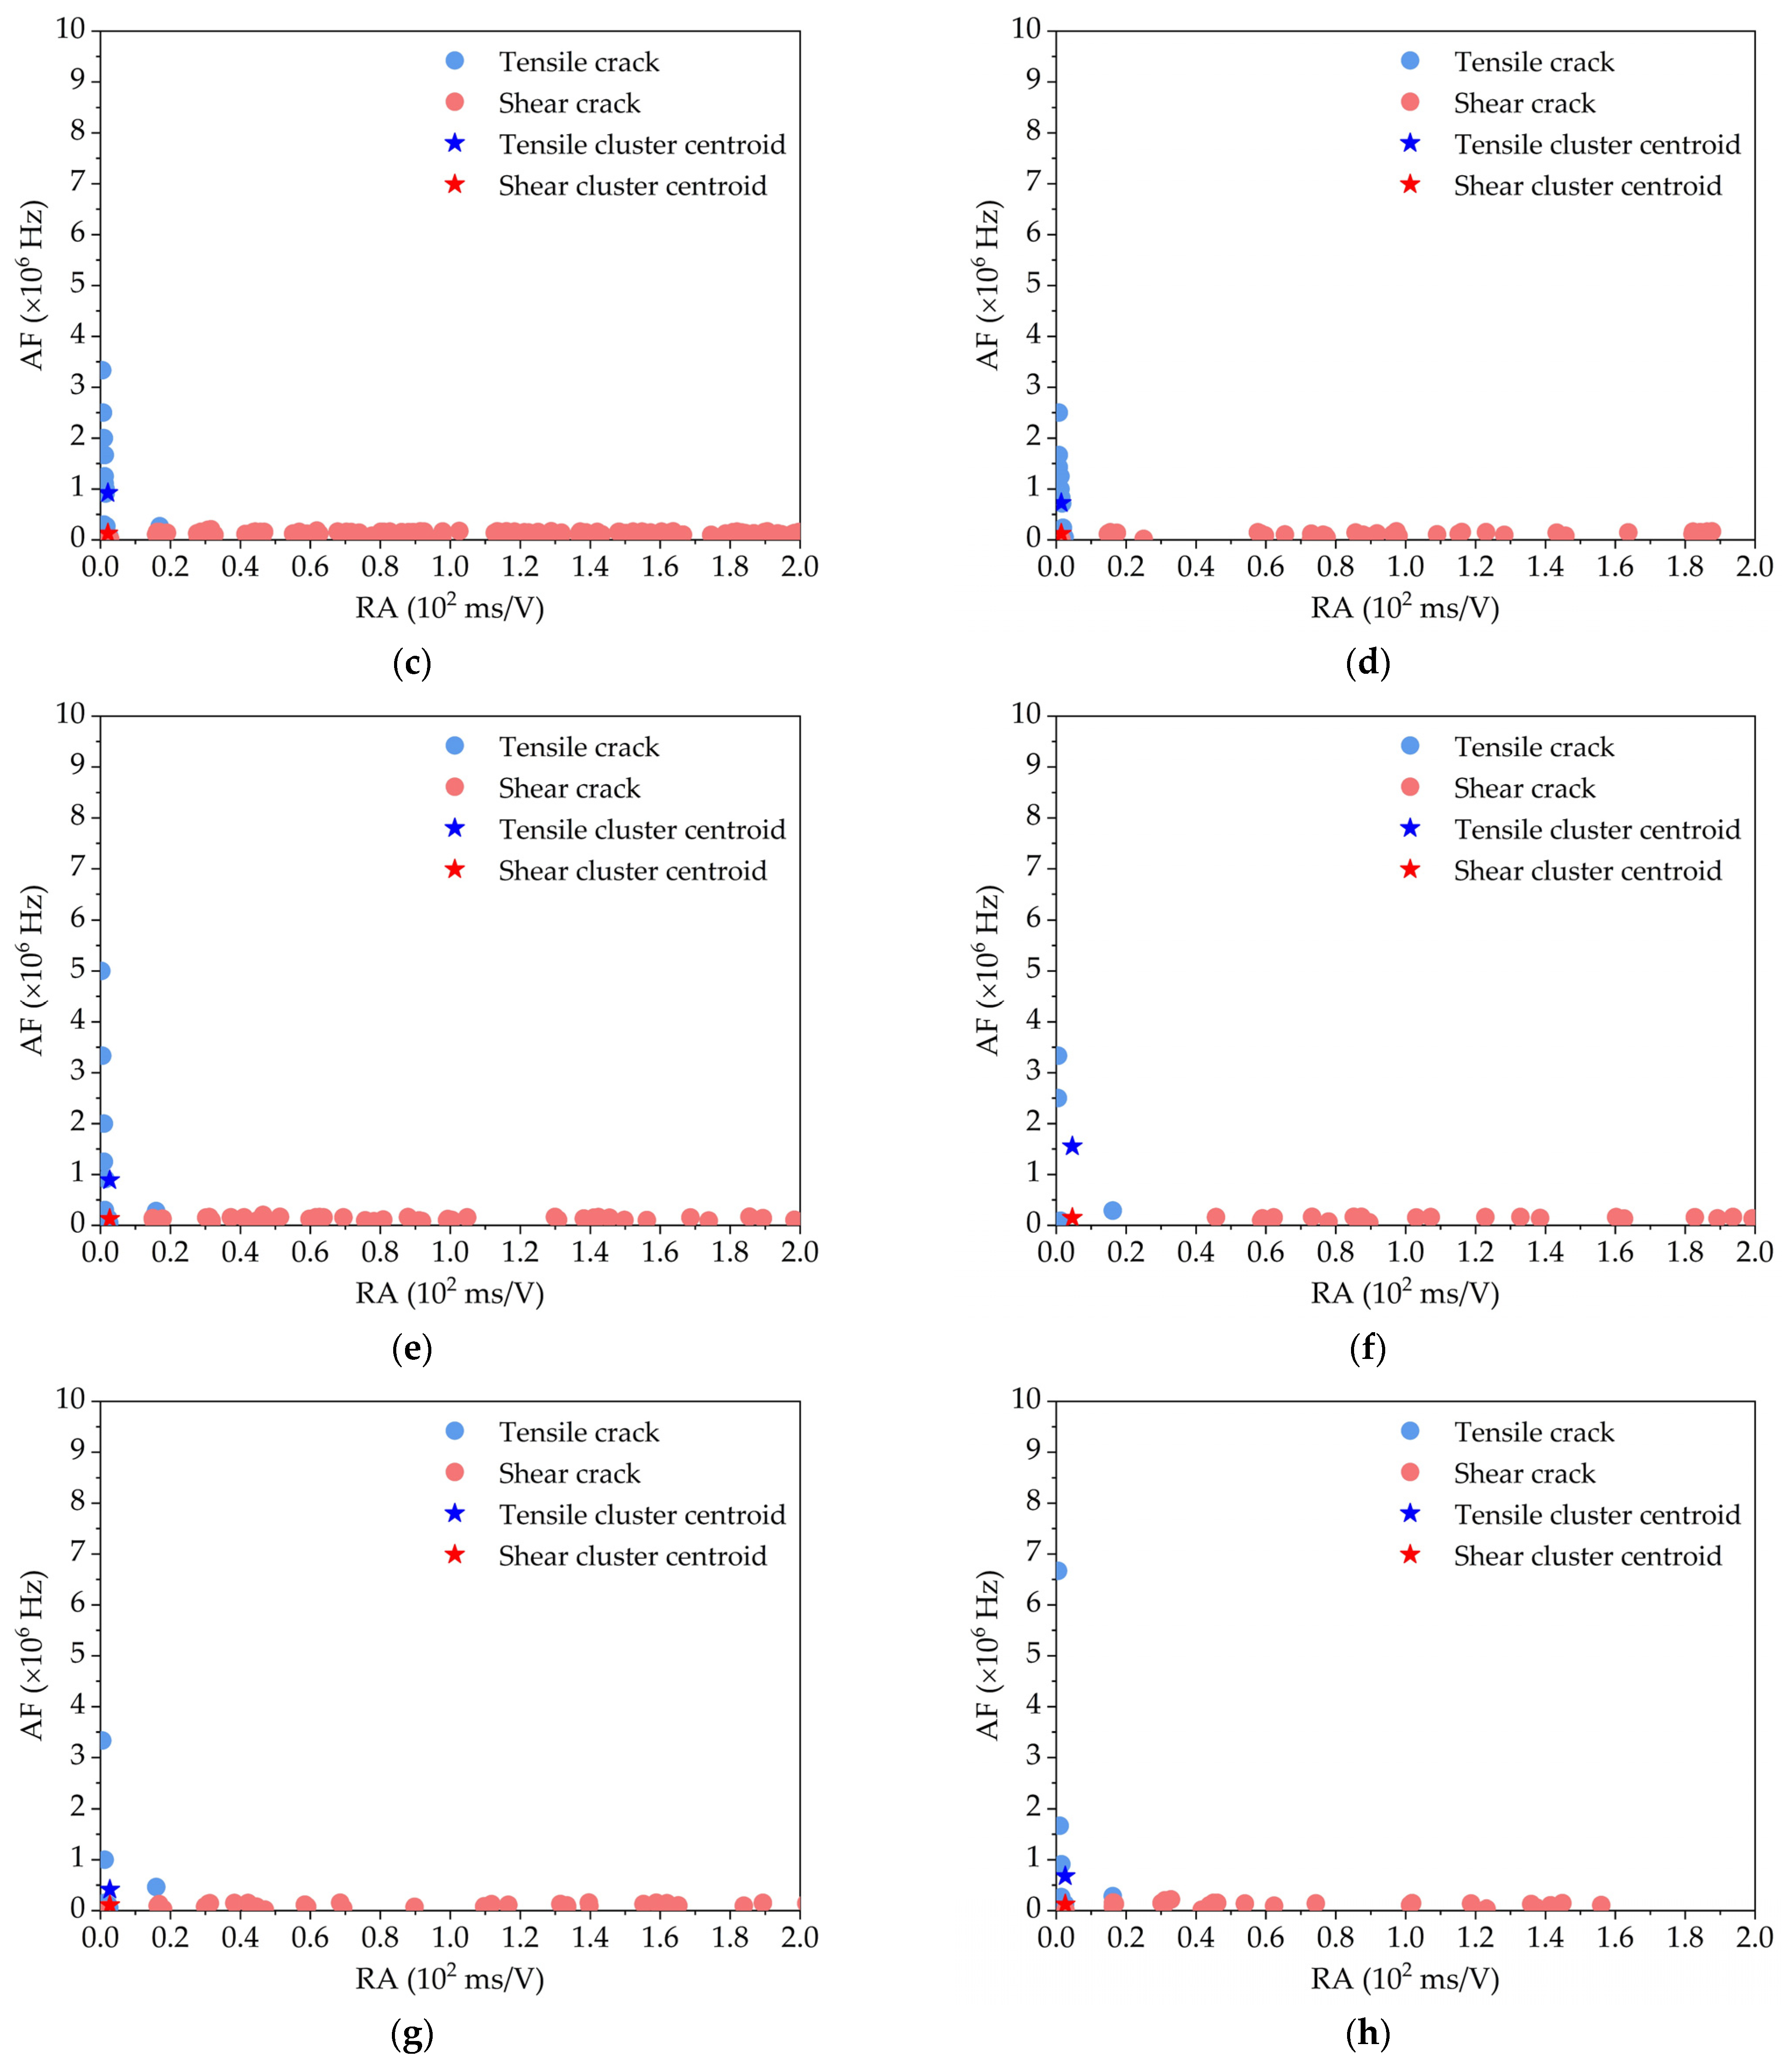
According to the comparative analysis between AF and RA, there are two kinds of fracture failure modes, i.e., the smaller RA and larger AF represent the tensile crack, and the larger RA and smaller AF indicate the shear crack, which is shown in Figure 7.
(1)
Compressive fracture failure analysis under F-T conditions
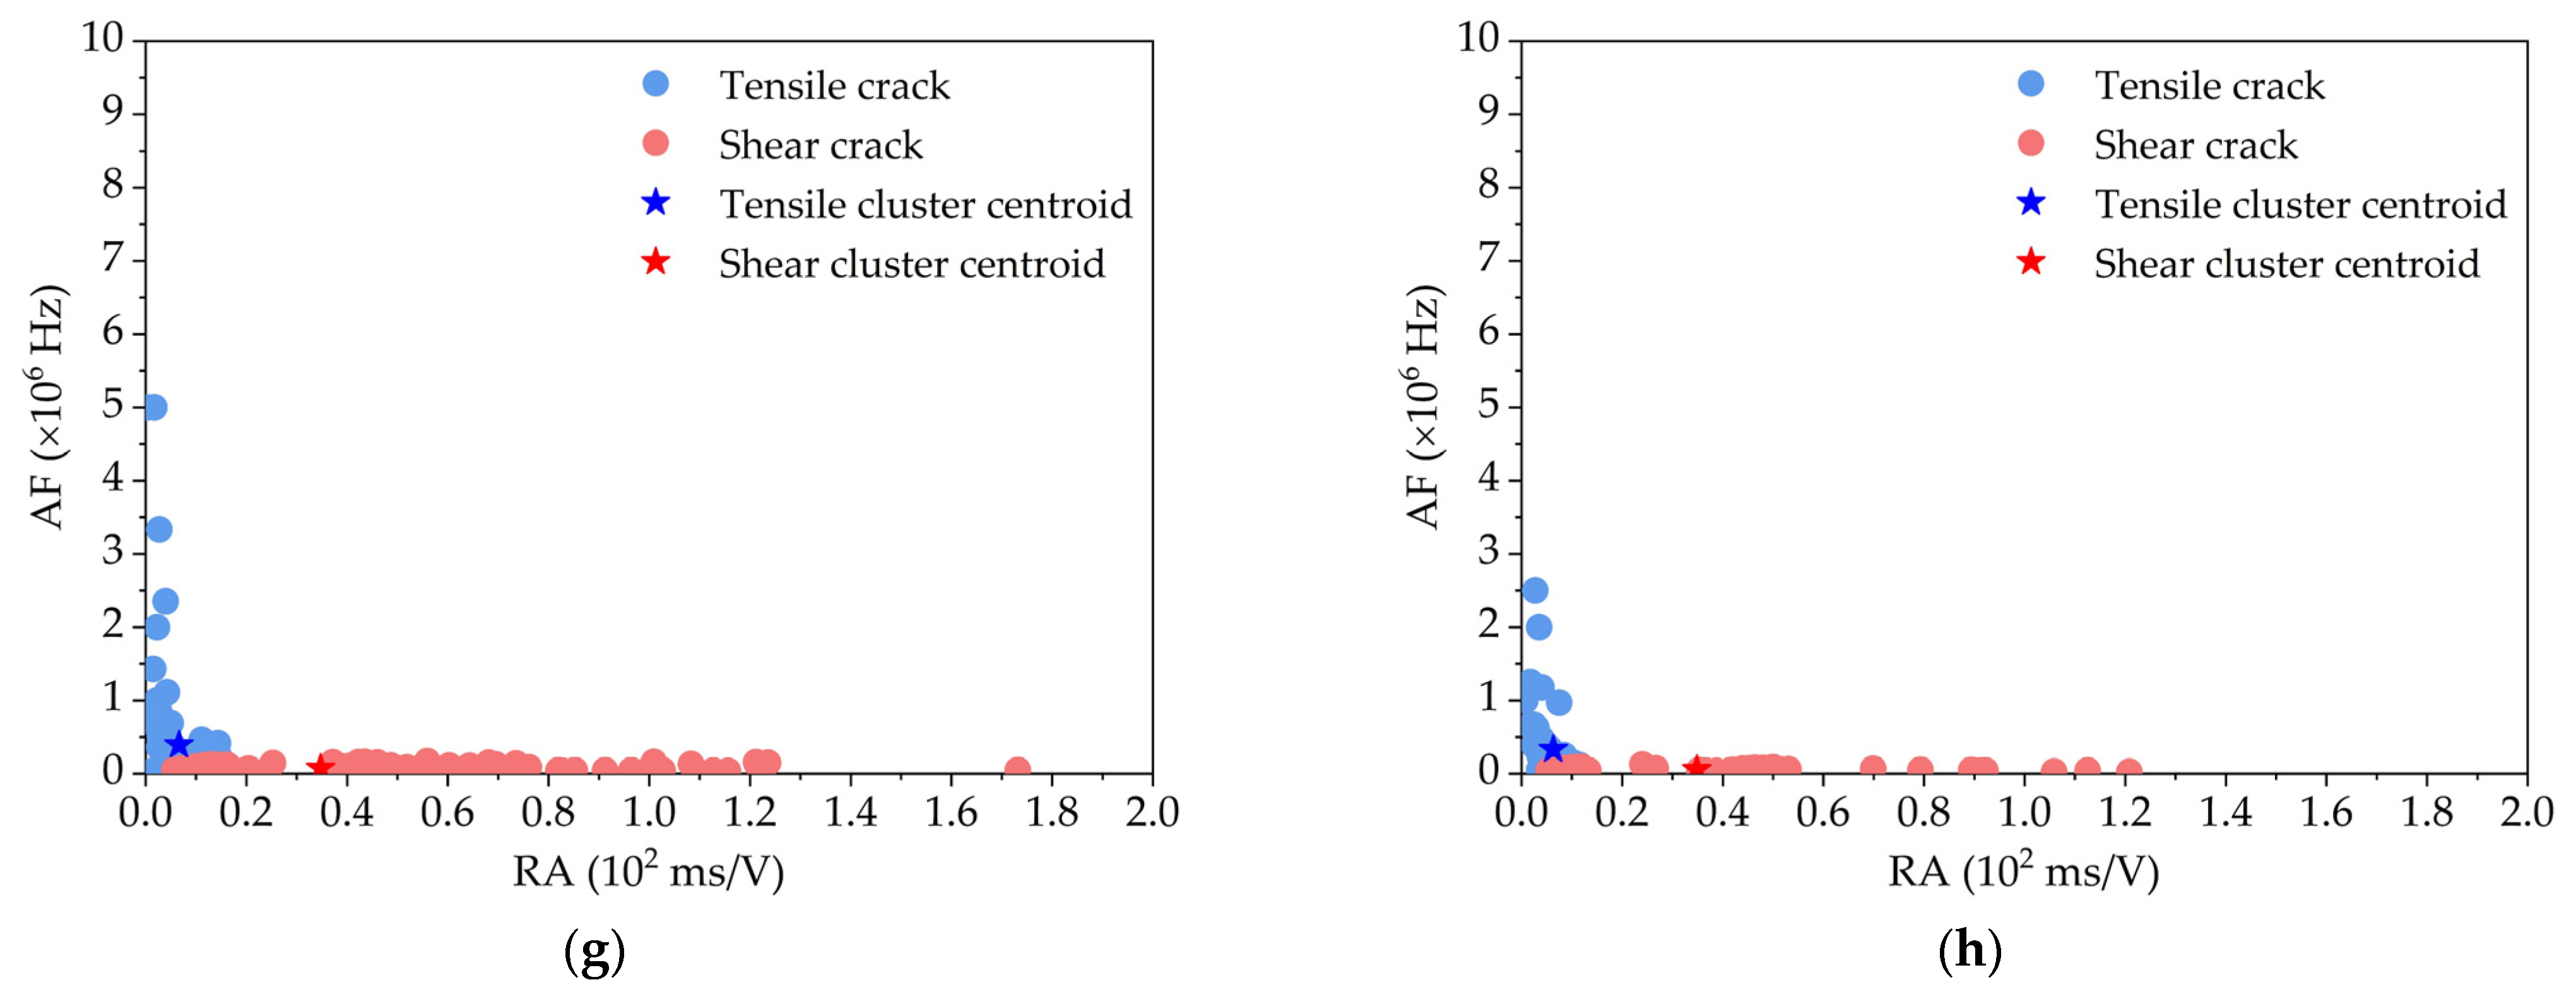
Figure 8 illustrates the relations between cumulative RA and AF values for bitumen specimens subjected to F-T conditions during the whole stage of compression load. The clustering center of the shear as well as the tensile cracks can be obtained by using the hierarchical cluster method. As the F-T condition continues, the failure mode of the bitumen specimens is mainly shear crack, in which the F-T condition continues; these data points of shear cracks successively account for 66.65%, 63.39%, 61.22%, 59.78%, 58.47%, 54.92%. 52.69% and 52.47% of the asphalt mixture. Based on the clustering algorithm, the cluster centroids of shear cracks and tensile cracks of the asphalt mixture present a certain decreasing tendency with F-T cycles. Therefore, under the effect of compression load, in the F-T pre-treatment, compression failure for the bitumen mix is mainly the shear failure mode. As the F-T condition continues, the failure mode changes to the combined effect of shear and tensile cracks. These findings are consistent with that of Jiao et al. [24].
(2)
Tensile fracture failure analysis under F-T conditions
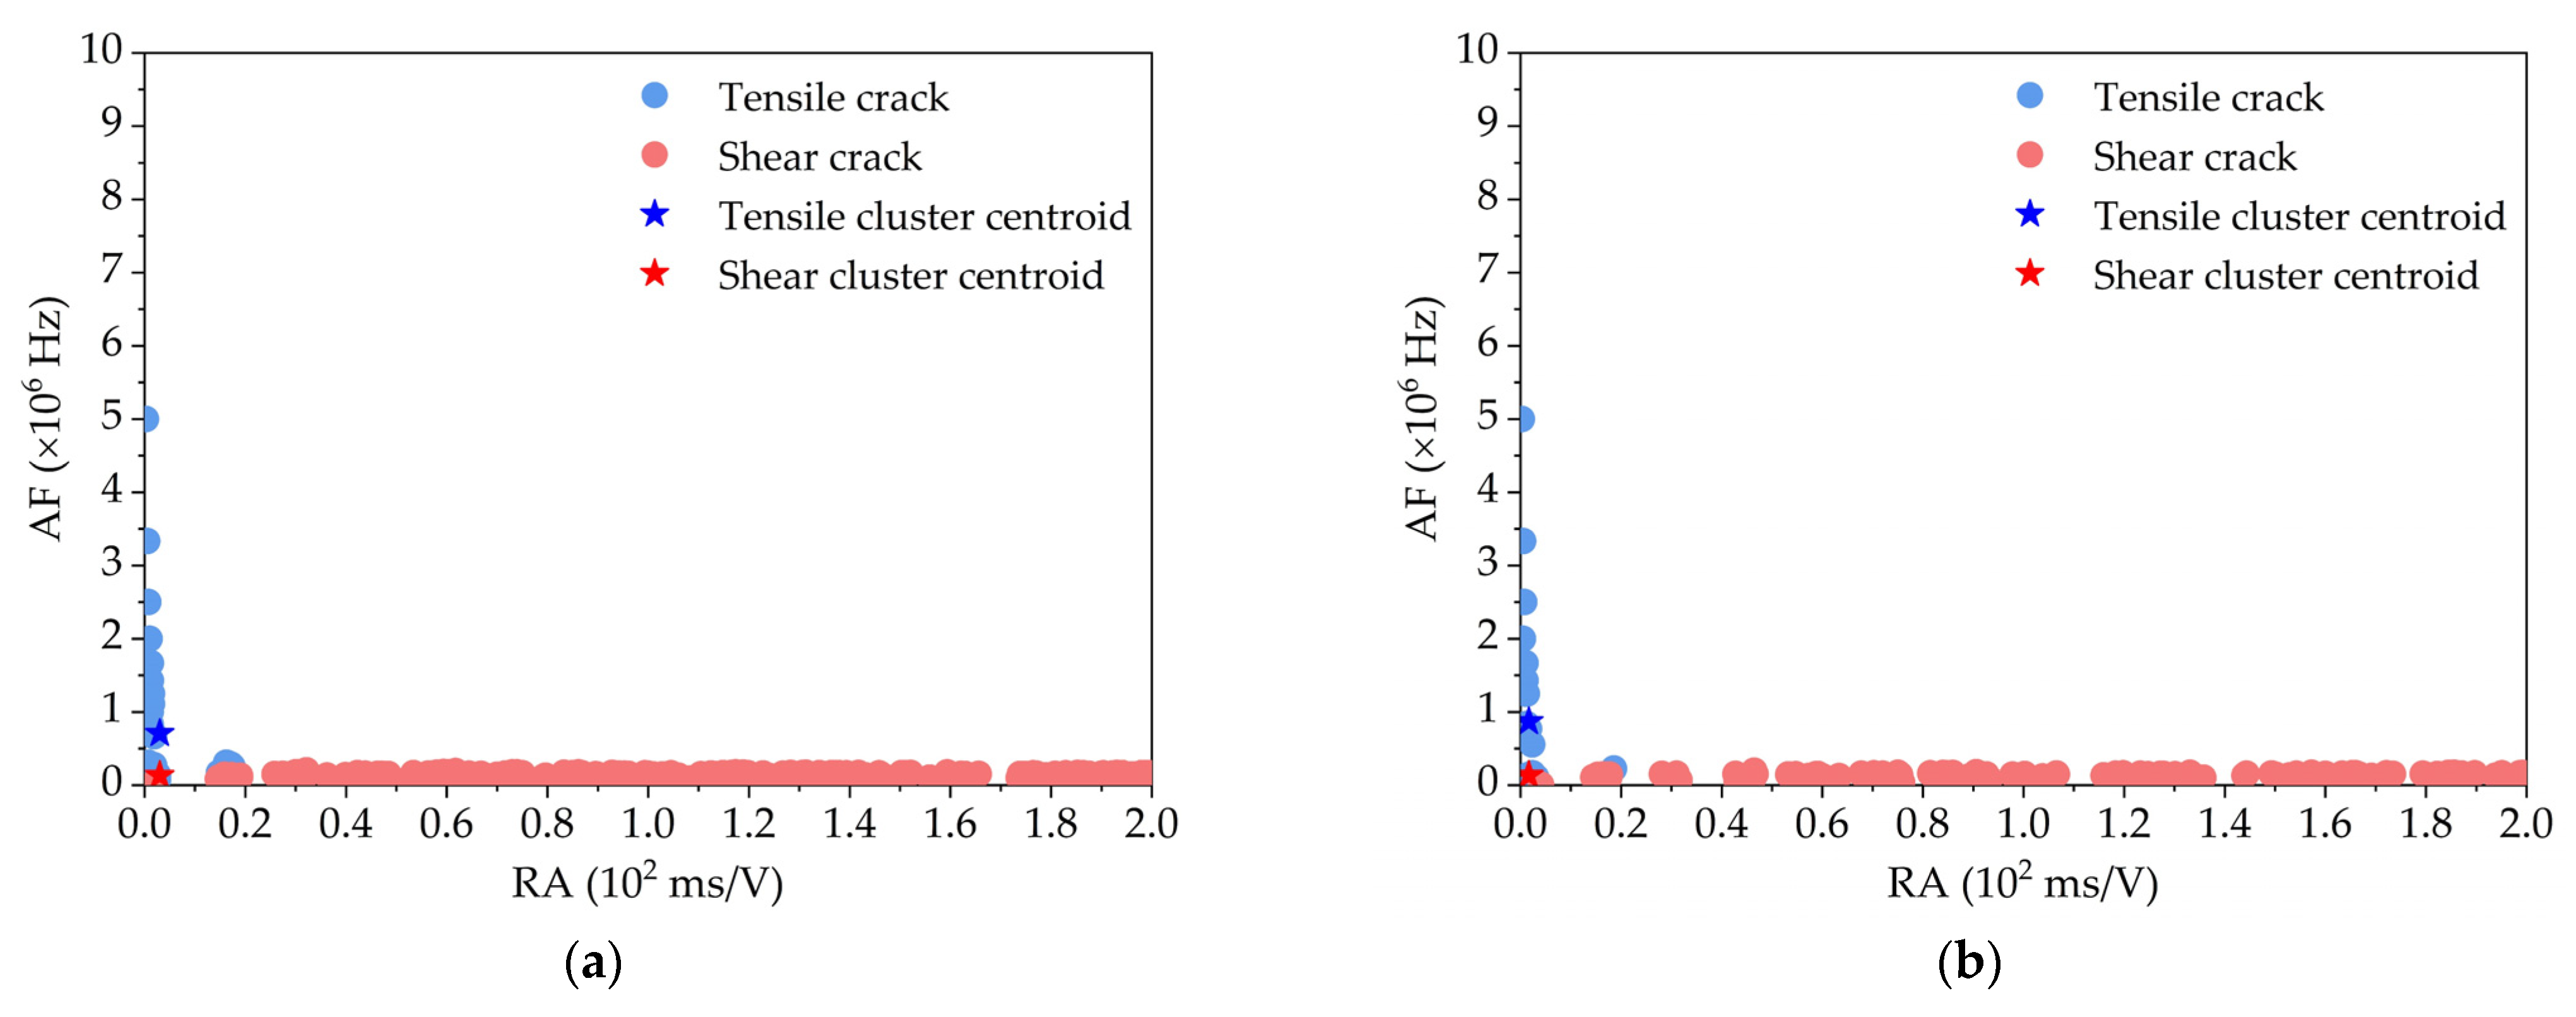
Figure 9 illustrates the relations between cumulative RA and AF values for bitumen specimens subjected to F-T conditions during the whole stage of tensile load. The cluster centroids of the shear and the tensile cracks are also calculated using the hierarchical cluster algorithm. The cluster centroids of shear cracks and tensile cracks present a certain decreasing tendency with the F-T condition. The failure mode of the asphalt mixture specimens is still mainly a shear crack. As the F-T condition continues, these data points of shear cracks successively account for 78.16 to 58.13% of asphalt mixture. As the F-T condition continues, the failure mode is changed from shear failure to shear and tension modes. These findings could provide an explanation for the fracture failure of asphalt mixture, contributing to the existing state of the art.

3.3. Fracture Damage Analysis Based on Meso-Characteristic Parameters

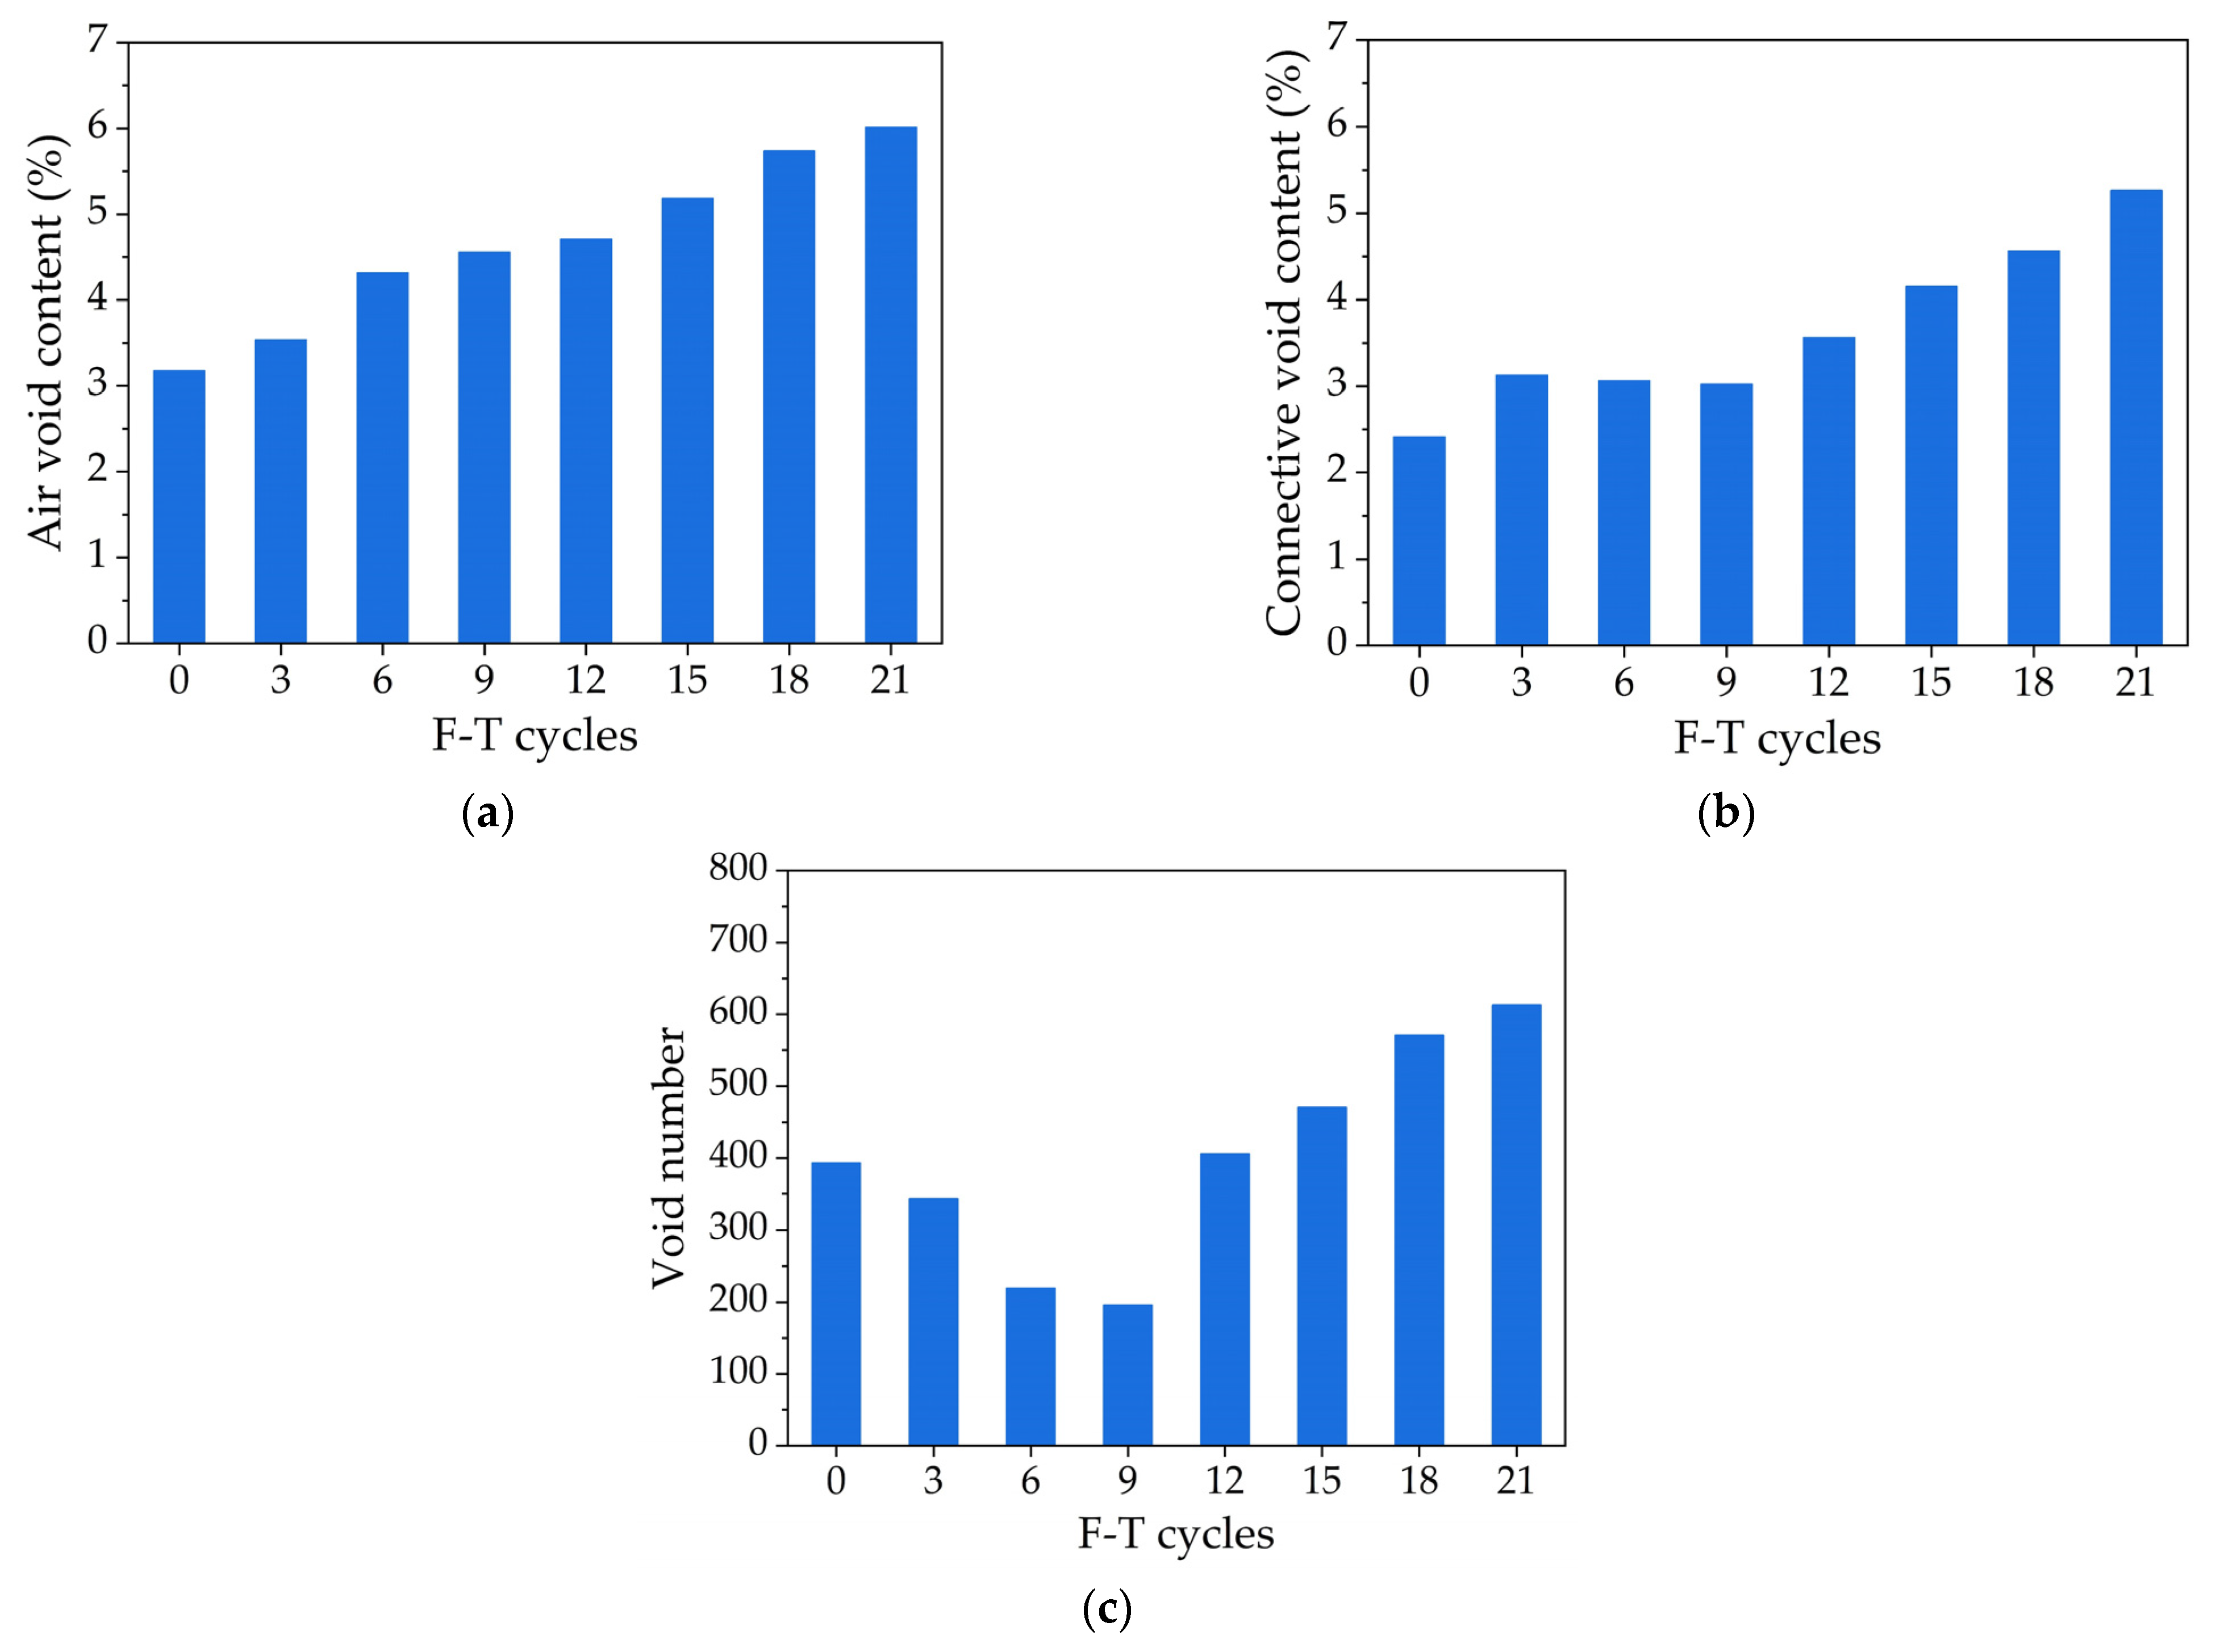
In this study, three parameters including air void content, connective void content and void number are used to quantitatively describe and evaluate the internal meso-structure of asphalt mixture specimens under F-T conditions and its influence. Air void content in asphalt mixture reflects its compactness to some extent. The higher the density, the lower the air void content in bitumen mix, and vice versa. Connective void content is connected with each other between voids and the edge of the end branch of voids, which can be regarded as a void cluster. The void number parameter can reflect the formation and development of its internal damage to a certain extent.
The internal structure of bitumen incorporating basalt fiber subjected to F-T conditions was scanned via CT scanning, varying with the interval of 0.6 mm along the vertical height of the specimen. Figure 10 compares the results of the air void content, connective void content and void number of the asphalt mixture in its middle section. For the air void content in Figure 10a, as the F-T condition continues, air void content for asphalt mixture incorporating basalt fiber becomes larger and larger, indicating that F-T treatment has an obvious impact on porosity for bitumen. By comparing the connective void content in bitumen subjected to different F-T conditions, from Figure 10b, the connective void content in the bitumen mix increases gradually as the F-T condition continues. As for the void number in Figure 10c, on the whole, the void number decreases first and then increases as the F-T condition continues.
The rise in air void content could be attributed to the continuous generation of new voids in bitumen specimens. Based on CT image processing results, the F-T cycle causes new voids inside the asphalt mixture specimen, and the existing voids gradually expand and develop, which eventually leads to the continuous development of F-T damage in bitumen. The rise in connective void content is mainly attributed to the development of connected voids. The F-T cycle will lead to the continuous generation of new voids in the asphalt mixture, which will raise air void content. With the gradual development of internal damage in bitumen, when the F-T condition goes to a certain extent, the new voids inside the asphalt mixture increase significantly, the generation of new voids dominates, and void number increases sharply, which also shows that the F-T damage of bitumen is getting progressively worse.

4. Conclusions

To clarify the effect of F-T conditions on compressive and tensile fracture failure characteristics, variations in compressive as well as tensile strength, and AE signal’s direct and indirect parameters were investigated based on the compressive and tensile tests and AE tests of SMA-13. Meanwhile, the effect of F-T condition on the internal void characteristics for bitumen was studied from a mesoscale, and meso-void characteristics were compared.
(1)
As the F-T condition continues, uniaxial compressive strength and tensile strength gradually decrease. When F-T cycles reached 21, the loss rate of the high-temperature uniaxial compressive strength at 50 °C for bitumen incorporating basalt fiber was 24.05%, and the tensile strength decreased by 31.56%, with the most serious loss. The F-T condition had a significant influence on asphalt pavement.
(2)
Under the action of compression and tensile load modes, the fracture failure process can be divided into four stages combined with signal index as well as loading level. In the loading pre-treatment, smaller values of amplitude and count are observed, which could be regarded as the micro-crack initiation stage. Then, the first and second inflection points occur in the load level, and the AE signal values of amplitude and count change obviously, which are called the micro-crack accumulation stage and damage development stage. Finally, the load level gradually becomes gentle, and obvious macroscopic cracks appear.
(3)
The time history of the AE signal values of amplitude and count shows stage features of fracture failure procedure for bitumen. According to the AE indirect index, fracture mode variation under compressive and tensile loading is related to failure, showing that the coupling interactions between tensile and shear cracks has a catalytic influence. AE technology could be used to characterize the performance change of asphalt mixtures.
(4)
Asphalt mixtures have different behaviours for the compressive and tensile strength and fracture failure characteristics based on AE when exposed to F-T conditions, which is attributed to different internal void topologies. During F-T conditions, new voids and cracks formed rapidly, and voids as well as cracks opened gradually.
This study reflected the fracture failure mode of asphalt mixture based on AE technology for asphalt pavement in seasonal frozen areas. The mechanical properties and fracture characteristics of asphalt mixture in the F-T condition were also revealed. Through this study, the performance deterioration law of asphalt pavement could be grasped in advance and used for the maintenance of asphalt pavement in seasonal freezing areas to achieve sustainable economic development. Due to the limits of the type and loading mode of asphalt mixture, the quantitative prediction of the performance of asphalt mixture using AE signal parameters and CT volume characteristics will be investigated in the future.

Author Contributions

Conceptualization, W.W.; Methodology, W.W. and J.L.; Validation, J.L.; Formal Analysis, W.X. and J.L.; Investigation, W.X. and J.L.; Writing—Original Draft Preparation, W.W.; Writing—Review and Editing, W.X. and J.L.; Project Administration, W.W.; Funding Acquisition, W.W. All authors have read and agreed to the published version of the manuscript.

Funding

This research was funded by the Scientific and Technological Project of Science and Technology Department of Jilin Province (grant number: 20210508028RQ), National Natural Science Foundation of China (grant number: 52208438), Scientific Research Project of Department of Education of Jilin Province (grant number: JJKH20221019KJ), China Postdoctoral Science Foundation (grant number: 2021T140262), Key Project of Department of Transportation of Heilongjiang Province (grant number: 2022-1, 2022-2).

Institutional Review Board Statement

Not applicable.

Informed Consent Statement

Not applicable.

Data Availability Statement

Not applicable.

Conflicts of Interest

The authors declare no conflict of interest.

References

  1. Cui, S.C.; Guo, N.S.; Wang, L.; You, Z.P.; Tan, Y.Q.; Guo, Z.X.; Luo, X.D.; Chen, Z. Effect of freeze-thaw cycles on the pavement performance of sbs modified and composite crumb rubber modified asphalt mixtures. Constr. Build. Mater. 2022, 342, 127799. [Google Scholar] [CrossRef]
  2. Wang, W.S.; Tan, G.J.; Liang, C.Y.; Wang, Y.; Cheng, Y.C. Study on viscoelastic properties of asphalt mixtures incorporating sbs polymer and basalt fiber under freeze-thaw cycles. Polymers 2020, 12, 1804. [Google Scholar] [CrossRef]
  3. Haghighatpour, P.J.; Aliha, M.R.M. Assessment of freezing and thawing cycle (ftc) effects on mixed mode i/iii fracture toughness and work of fracture of hma asphalt mixtures. Theor. Appl. Fract. Mec. 2022, 118, 103261. [Google Scholar] [CrossRef]
  4. Rafiq, W.; Musarat, M.A.; Altaf, M.; Napiah, M.; Sutanto, M.H.; Alaloul, W.S.; Javed, M.F.; Mosavi, A. Life cycle cost analysis comparison of hot mix asphalt and reclaimed asphalt pavement: A case study. Sustainability 2021, 13, 4411. [Google Scholar] [CrossRef]
  5. Wang, W.S.; Cheng, Y.C.; Ma, G.R.; Tan, G.J.; Sun, X.; Yang, S.T. Further investigation on damage model of eco-friendly basalt fiber modified asphalt mixture under freeze-thaw cycles. Appl. Sci. 2019, 9, 60. [Google Scholar] [CrossRef] [Green Version]
  6. Xu, G.; Yu, Y.H.; Cai, D.G.; Xie, G.Y.; Chen, X.H.; Yang, J. Multi-scale damage characterization of asphalt mixture subject to freeze-thaw cycles. Constr. Build Mater. 2020, 240, 117947. [Google Scholar] [CrossRef]
  7. Lou, B.W.; Sha, A.M.; Barbieri, D.M.; Liu, Z.Z.; Zhang, F.; Jiang, W.; Hoff, I. Characterization and microwave healing properties of different asphalt mixtures suffered freeze-thaw damage. J. Clean Prod. 2021, 320, 128823. [Google Scholar] [CrossRef]
  8. Tan, G.J.; Wang, W.S.; Cheng, Y.C.; Wang, Y.; Zhu, Z.Q. Establishment of complex modulus master curves based on generalized sigmoidal model for freeze-thaw resistance evaluation of basalt fiber-modified asphalt mixtures. Polymers 2020, 12, 1698. [Google Scholar] [CrossRef] [PubMed]
  9. Meng, A.X.; Xu, H.N.; Feng, X.L.; Tan, Y.Q. Feasibility of freeze-thaw damage analysis for asphalt mixtures through dynamic nondestructive testing. Constr. Build Mater. 2020, 233, 117220. [Google Scholar] [CrossRef]
  10. Guo, Z.X.; Wang, L.; Feng, L.; Guo, Y.Y. Research on fatigue performance of composite crumb rubber modified asphalt mixture under freeze thaw cycles. Constr. Build Mater. 2022, 323, 126603. [Google Scholar] [CrossRef]
  11. Badeli, S.; Carter, A.; Dore, G.; Saliani, S. Evaluation of the durability and the performance of an asphalt mix involving aramid pulp fiber (apf): Complex modulus before and after freeze-thaw cycles, fatigue, and tsrst tests. Constr. Build Mater. 2018, 174, 60–71. [Google Scholar] [CrossRef]
  12. Huang, T.; Qi, S.; Yang, M.; Lv, S.T.; Liu, H.F.; Zheng, J.L. Strength criterion of asphalt mixtures in three-dimensional stress states under freeze-thaw conditions. Appl. Sci. 2018, 8, 1302. [Google Scholar] [CrossRef] [Green Version]
  13. Cheng, Y.C.; Yu, D.; Tan, G.J.; Zhu, C.F. Low-temperature performance and damage constitutive model of eco-friendly basalt fiber-diatomite-modified asphalt mixture under freeze-thaw cycles. Materials 2018, 11, 2148. [Google Scholar] [CrossRef] [PubMed] [Green Version]
  14. Gong, Y.F.; Bi, H.P.; Tian, Z.H.; Tan, G.J. Pavement performance investigation of nano-tio2/caco3 and basalt fiber composite modified asphalt mixture under freeze-thaw cycles. Appl. Sci. 2018, 8, 2581. [Google Scholar] [CrossRef] [Green Version]
  15. You, L.Y.; You, Z.P.; Dai, Q.L.; Xie, X.F.; Washko, S.; Gao, J.F. Investigation of adhesion and interface bond strength for pavements underlying chip-seal: Effect of asphalt-aggregate combinations and freeze-thaw cycles on chip-seal. Constr. Build Mater. 2019, 203, 322–330. [Google Scholar] [CrossRef]
  16. Wu, H.N.; Li, P.; Nian, T.F.; Zhang, G.H.; He, T.; Wei, X.Y. Evaluation of asphalt and asphalt mixtures’ water stability method under multiple freeze-thaw cycles. Constr. Build Mater. 2019, 228, 117089. [Google Scholar] [CrossRef]
  17. Lovqvist, L.; Balieu, R.; Kringos, N. A micromechanical model of freeze-thaw damage in asphalt mixtures. Int. J. Pavement Eng. 2021, 22, 1017–1029. [Google Scholar] [CrossRef] [Green Version]
  18. Liu, P.F.; Hu, J.; Falla, G.C.; Wang, D.W.; Leischner, S.; Oeser, M. Primary investigation on the relationship between microstructural characteristics and the mechanical performance of asphalt mixtures with different compaction degrees. Constr. Build Mater. 2019, 223, 784–793. [Google Scholar] [CrossRef]
  19. Ji, J.; Yao, H.; Yuan, Z.K.; Suo, Z.; Xu, Y.; Li, P.F.; You, Z.P. Moisture susceptibility of warm mix asphalt (wma) with an organic wax additive based on x-ray computed tomography (ct) technology. Adv. Civ. Eng. 2019, 2019, 7101982. [Google Scholar] [CrossRef]
  20. Ahmad, K.A.; Hassan, N.A.; Abdullah, M.E.; Bilema, M.A.M.; Usman, N.; Al Allam, A.M.; Bin Hainin, M.R. Image processing procedure to quantify the internal structure of porous asphalt concrete. Multidiscip. Model Mater. 2019, 15, 206–226. [Google Scholar] [CrossRef]
  21. Carpinteri, A.; Lacidogna, G.; Puzzi, S. Prediction of cracking evolution in full scale structures by the b-value analysis and yule statistics. Phys. Mesomech. 2008, 11, 260–271. [Google Scholar] [CrossRef]
  22. Qiu, X.; Xu, J.X.; Xu, W.Y.; Yang, Q.; Wang, F.; Yuan, J. Diagnosis of damage evolution process for asphalt mixtures using pattern recognition with acoustic emission signals. Constr. Build Mater. 2021, 280, 122536. [Google Scholar] [CrossRef]
  23. Qiu, X.; Xu, J.X.; Xiao, S.L.; Yang, Q. Acoustic emission parameters and waveforms characteristics of fracture failure process of asphalt mixtures. Constr. Build Mater. 2019, 215, 135–147. [Google Scholar] [CrossRef]
  24. Jiao, Y.B.; Zhang, Y.; Zhang, M.S.; Fu, L.X.; Zhang, L.D. Investigation of fracture modes in pervious asphalt under splitting and compression based on acoustic emission monitoring. Eng. Fract. Mech. 2019, 211, 209–220. [Google Scholar] [CrossRef]
  25. Islam, S.K.S.; Singh, S.K.; Ransinchung, R.N.G.D.; Ravindranath, S.S. Performance deterioration of sbs-modified asphalt mix: Impact of elevated storage temperature and sbs concentration of modified binder. J. Mater. Civil Eng. 2022, 34, 04021475. [Google Scholar] [CrossRef]
  26. Tan, G.J.; Wang, W.S.; Cheng, Y.C.; Wang, Y.; Zhu, Z.Q. Master curve establishment and complex modulus evaluation of sbs-modified asphalt mixture reinforced with basalt fiber based on generalized sigmoidal model. Polymers 2020, 12, 1586. [Google Scholar] [CrossRef] [PubMed]
  27. Awan, H.H.; Hussain, A.; Javed, M.F.; Qiu, Y.J.; Alrowais, R.; Mohamed, A.M.; Fathi, D.; Alzahrani, A.M. Predicting marshall flow and marshall stability of asphalt pavements using multi expression programming. Buildings 2022, 12, 314. [Google Scholar] [CrossRef]
  28. Wang, W.S.; Cheng, Y.C.; Zhou, P.L.; Tan, G.J.; Wang, H.T.; Liu, H.B. Performance evaluation of styrene-butadiene-styrene-modified stone mastic asphalt with basalt fiber using different compaction methods. Polymers 2019, 11, 1006. [Google Scholar] [CrossRef] [PubMed] [Green Version]
  29. Liang, C.Y.; Ma, J.C.; Zhou, P.L.; Ma, G.R.; Xu, X. Fracture damage properties of sbs-modified asphalt mixtures reinforced with basalt fiber after freeze-thaw cycles using the acoustic emission approach. Appl. Sci. 2020, 10, 3301. [Google Scholar] [CrossRef]
  30. Tan, G.J.; Zhu, Z.Q.; Wang, W.S.; Wu, C.L.; Ou, J.; Cui, G.J.; Zhang, D.M. Flexural ductility and crack-controlling capacity of polypropylene fiber reinforced ecc thin sheet with waste superfine river sand based on acoustic emission analysis. Constr. Build Mater. 2021, 277, 122321. [Google Scholar] [CrossRef]
Figure 1. The flowchart of this study.
Applsci 12 10707 g001
Figure 2. Aggregate gradations of investigated mixtures.
Applsci 12 10707 g002
Figure 3. The experimental procedure of this study.
Applsci 12 10707 g003
Figure 4. The compressive and tensile strength results under F-T conditions.
Applsci 12 10707 g004
Figure 5. The AE direct parameters (amplitude and count) versus compressive load level for asphalt mixture subjected to F-T condition: (a) AE amplitude/count vs. load level under 0 cycle; (b) AE amplitude/count vs. load level under 3 cycles; (c) AE amplitude/count vs. load level under 9 cycles; (d) AE amplitude/count vs. load level under 15 cycles; (e) AE amplitude/count vs. load level under 21 cycles.
Applsci 12 10707 g005aApplsci 12 10707 g005b
Figure 6. The AE direct parameters (amplitude and count) versus tensile load level for asphalt mixture subjected to F-T conditions: (a) AE amplitude/count vs. load level under 0 cycle; (b) AE amplitude/count vs. load level under 3 cycles; (c) AE amplitude/count vs. load level under 9 cycles; (d) AE amplitude/count vs. load level under 15 cycles; (e) AE amplitude/count vs. load level under 21 cycles.
Applsci 12 10707 g006aApplsci 12 10707 g006b
Figure 7. The crack classification based on RA and AF.
Applsci 12 10707 g007
Figure 8. Compressive fracture mode classification based on the AE indirect parameters for asphalt mixture subjected to F-T conditions: (a) 0 cycle; (b) 3 cycles; (c) 6 cycles; (d) 9 cycles; (e) 12 cycles; (f) 15 cycle; (g) 18 cycles; (h) 21 cycles.
Applsci 12 10707 g008aApplsci 12 10707 g008b
Figure 9. Tensile fracture mode classification based on the AE indirect parameters for asphalt mixture subjected to F-T conditions: (a) 0 cycle; (b) 3 cycles; (c) 6 cycles; (d) 9 cycles; (e) 12 cycles; (f) 15 cycle; (g) 18 cycles; (h) 21 cycles.
Applsci 12 10707 g009aApplsci 12 10707 g009b
Figure 10. Distribution of internal meso-void characteristics of asphalt mixture under F-T conditions: (a) air void content; (b) connective void content; (c) void number.
Applsci 12 10707 g010
Table 1. Technical properties of SBS-modified asphalt.
IndexUnitResults
Penetration0.1 mm (@ 25 °C, 100 g, 5 s)72
Ductilitycm (@ 15 °C, 5 cm/min)45
Softening point°C60.5
Densityg/cm31.018
Flash point°C262
RTFOT
Mass loss%−0.094
Penetration ratio% (@ 25 °C)66.9
Table 2. Basic physical parameters of coarse aggregate.
IndexUnitResultsStandard Limits
Crushing value%13.6≤26
Los Angeles abrasion value%17.9≤28
Apparent
Specific
Gravity
13.2 mm-2.836≥2.6
9.5 mm2.805
4.75 mm2.726
Water
Absorption
13.2 mm%0.6≤2.0
9.5 mm0.28
4.75 mm0.7
Table 3. Basic physical parameters of fine aggregate.
IndexUnitResultsStandard Limits
Apparent specific gravity-2.723≥2.5
Water absorption%0.64-
Angularity (flow time)s39.9≥30
Sand equivalent%68≥60
Table 4. Basic physical parameters of mineral filler.
IndexUnitResultsStandard Limits
Apparent densityt/m32.712≥2.5
Hydrophilic coefficient-0.63<1
Water content%0.3≤1
Plastic index%2<4
Granular composition<0.6 mm%100100
<0.15 mm92.590~100
<0.075 mm81.875~100
Table 5. Basic performances of basalt fiber.
IndexUnitResults
Lengthmm6
Diameterµm13
Specific gravityg/cm32.55~2.65
Tensile strengthMPa≥3000
Elongation at break%3.2
Publisher’s Note: MDPI stays neutral with regard to jurisdictional claims in published maps and institutional affiliations.