Article

Investigation of the Fatigue Life of Bottom-Up Cracking in Asphalt Concrete Pavements

1
The College of Post and Telecommunication of WIT, Wuhan 430073, China
2
School of River and Ocean Engineering, Chongqing Jiaotong University, Chongqing 400074, China
3
School of Civil Engineering and Architecture, Chongqing University of Science and Technology, Chongqing 401331, China
4
School of Civil Engineering and Architecture, Wuhan Institute of Technology, Wuhan 430074, China
*
Author to whom correspondence should be addressed.
Appl. Sci. 2022, 12(23), 12119; https://doi.org/10.3390/app122312119
Submission received: 1 November 2022 / Revised: 22 November 2022 / Accepted: 23 November 2022 / Published: 26 November 2022
(This article belongs to the Special Issue Advanced Technologies in Asphalt Materials)

Abstract

:
Traditionally, fatigue cracking in asphalt pavement means fatigue failure, which is the basis for controlling the design thickness of asphalt pavements. In fact, the fatigue failure of asphalt pavements includes three stages: fatigue cracking, crack expansion, and structural failure. Therefore, this paper aims to investigate the fatigue life of the bottom-up cracking of asphalt concrete (AC) pavements considering the different stages of fatigue failure. The dynamic modulus of AC of different grades was experimentally determined. The tensile stresses at the bottom of the AC layer were evaluated by embedding the tested dynamic modulus into a numerical simulation, which can be used to calculate the fatigue cracking life. Then, overlay tests (OTs) at different temperatures were conducted to obtain the fracture parameters A and n from the asphalt mixture. The crack propagation life was calculated via the Paris formula based on the fracture parameters A and n . The analysis results showed that an increase in AC thickness could effectively improve the fatigue crack life of the pavement structure, and the proportion of crack propagation life to fatigue crack life at different temperatures varied significantly. Therefore, when analyzing and calculating the fatigue life of pavement structures, besides the fatigue cracking life, the crack propagation life after cracking should also be considered, which is very important for accurately calculating the entire fatigue life of asphalt pavement structures. This will offer guidance for asphalt pavement thickness design.

1. Introduction

Asphalt pavement is a paramount type of pavement and has been widely used around the world due to its excellent road performance, convenient rehabilitation measures, and comfortable driving conditions. With the rapid development of national economies and the further growth of modern road transportation demand, a considerable amount of asphalt pavement has been built. Therefore, some problems of early distresses for asphalt pavement are also obvious. Traditional thinking suggests that pavements will fail structurally in one of two ways, either deformation resulting from subgrade failure or bottom-up fatigue cracking. Distresses concentrated in the asphalt concrete (AC) layer can lead to the failure of the pavement structure over time. The maximum tensile stresses are commonly developed at the bottom of the AC layer under repetitive loadings. As a result, cracks usually initiate at the bottom of the asphalt layer and start propagating to the surface of the pavement. This so-called bottom-up fatigue cracking is one of the main failure modes in asphalt pavements. Bottom-up cracking may occur in concrete pavements with an increase in traffic loads and environmental effects. Cracking in concrete pavements can produce serious damage in pavements since it induces water penetration into the pavement structure and foundation. For state departments of transportation, the accurate prediction of flexible pavement service life in terms of potential fatigue cracking is crucial for pavement design, maintenance, and rehabilitation.
To this end, some researchers have conducted many studies to predict fatigue cracking. Li et al. [1] investigated the fatigue cracking of expressway asphalt pavement, which highlighted that asphalt pavement is subjected to repeated actions of driving loads and temperature loads. When the action times reached a certain number, fatigue cracking would occur. However, cracks are hard to spot until they reach the surface of the road. Therefore, it is very difficult to study the characteristics of fatigue cracks on the actual pavement. With the development of computer technology, it is possible for researchers to study fatigue cracking by numerical analysis. Due to the singularity of the crack tip, the results calculated from the traditional strength theory are unreasonable. Therefore, fracture mechanics can be introduced to study the fractures. Ge et al. [2] obtained the stress intensity factor (SIF) at the crack tip based on fracture mechanics, and used SIF to reflect the stress distribution at the crack tip. Uzan et al. [3] presented a mechanistic model for predicting the performance of asphalt mixtures in terms of crack propagation rate, fatigue life assessment, and permanent deformation characteristics. Ceylan et al. [4] used the neural networks (NN) approach to model the SIF as cracks grow upward through a hot-mix asphalt (HMA) overlay because of both the load and thermal effects with and without the reinforcing interlayers. Several cases under both thermal loading and traffic loading were considered, and the NN models had significantly higher accuracy in predicting the SIFs compared with the nonlinear regression approach. Based on seminal investigations of the integer transform, Hu et al. [5] proposed the modelling tensile strain response in asphalt pavements in bottom-up and/or top-down fatigue crack initiation. The Texas A&M Transportation Institute developed a correlation between the number of cycles to failure and the fracture energy index using overlay tests (OTs) [6,7]. Zhou and Scullion et al. [6] summarized how crack initiation is related to crack propagation and provided both the theory and validation for the usefulness of OT to assess fatigue cracking. Hiltunen and Roque [8] proposed the new mechanics-based thermal cracking performance model, and the calibrated model can be used to establish performance-based specification limits based on material properties or the parameters determined from the new mixture test. At present, the fatigue crack growth formula proposed by Paris and Erdogan [9] based on experiments was the most widely used formula to study fatigue crack growth life, which was also known as the famous Paris formula. In the 1970s, Majidzadeh et al. [10,11] introduced the principle and method of fracture mechanics into the study of pavement structure cracking. Moghadas et al. [12] applied fracture mechanics to qualitatively analyze the mechanism of geotextiles for preventing crack propagation. Lytton [13] presented the fracture properties of asphaltic concrete under fatigue loading and illustrated the thermal contraction conditions and the way it is altered by the addition of geotextiles. Abo-Qudais and Shatnawi [14] predicted the number of cycles that cause fracturing in hot-mix asphalt (HMA) based on the number of cycles upon which the slope of the accumulated strain switched from a mode of decreasing to increasing and evaluated the effect of aggregate gradation and temperature on fatigue behaviors of hot-mix asphalt. Doh et al. [15] developed a numerical prediction model for fatigue life by modifying the crack growth rate using the Paris law with the horizontal deformation rate to compare the relative performance of the material based on experimental test results. Wei et al. [16] proposed an accurate and efficient model using the discrete element method and the digital image processing technique to investigate the fracture evolution of an asphalt mixture at low temperatures, which was well compared and verified via acoustic emission activities. Additionally, the fatigue crack life of asphalt pavements has also been investigated by many researchers. Zhou et al. [17] used some index parameters as the main prediction variables of asphalt pavement fatigue cracking modeling and obtained the prediction model for fatigue cracking life. Zheng et al. [18] proposed a method to predict the pavement fatigue crack initiation life and the fatigue life of a typical high modulus asphalt concrete (HMAC) overlay pavement, which runs the risk of bottom-up cracking; this was predicted and validated. Obviously, concealed failures (e.g., bottom-up cracks) are, by definition, difficult to identify and localize. In order to identify the concealed cracks (particularly bottom-up cracks) and monitor their growth over time, a supervised machine learning (ML)-based method for the identification and classification of the SHS of a differently cracked road pavement based on its vibroacoustic signature was set up [19]. The stress intensity principle was used to determine the locations and lengths of the cracks, and the hidden bottom-up cracks were detected, which has significantly impacted the current pavement detection practice [20]. From the above literature analysis, researchers have carried out extensive studies on the crack initiation and propagation prediction of asphalt pavement. However, these studies have generally focused on crack initiation or propagation for predicting fatigue cracking. In fact, the fatigue failure of asphalt pavement includes three stages: fatigue cracking, crack expansion, and structural failure. Therefore, the pavement structure design should fully consider the different stages of fatigue failure.
In view of the above reasons, this paper aimed to obtain the fatigue life of bottom-up cracks in asphalt pavements, including fatigue cracking and crack propagation. OTs at different temperatures were conducted to obtain the fracture parameters A and n of the asphalt mixture, and crack propagation life was further calculated via the Paris formula. Additionally, the dynamic modulus of AC of different grades was also experimental determined, and related numerical simulation was performed to evaluate the tensile stress at the bottom of the AC layer, which can be used to calculate the fatigue cracking life. Therefore, the fatigue cracking life of asphalt pavements can be predicted considering the different stages of fatigue failure, and some suggestions for pavement structure design can be provided.

2. Experimental Study of the Dynamic Modulus and OT of Asphalt Pavements

2.1. Test Materials

In order to obtain the fatigue life of bottom-up cracks in asphalt pavements, including fatigue cracking and crack propagation, the OTs at different temperatures need to be conducted to obtain the fracture parameters A and n of the asphalt mixture and the dynamic modulus of AC of different grades can be used to evaluate the tensile stress at the bottom of the AC layer. These parameters will be utilized to determine fatigue cracking and crack propagation. In this paper, an AH-70 common matrix asphalt was used in the laboratory mixture test; the coarse aggregate and fine aggregate are limestones and the gradation was composite grading. The technical specifications of AH-70 are shown in Table 1. Three common asphalt mixtures (AC-13, AC-20, and AC-25) were adopted in the following experiments. The selection of AC at all levels is shown in Table 2, and the asphalt/stone ratios were 4.7%, 4.1%, and 3.8%, respectively. Through testing, the basic performance indexes of asphalt and aggregate could meet the basic requirements of the Technical Specifications for Construction of Highway Asphalt Pavement JTG F40-2004 [21].

2.2. Dynamic Modulus Test

The asphalt pavement is not subjected to the constant external force of practical vehicle loads, and the effect of vehicle load and temperature always work together on the road. Therefore, in order to calculate the fatigue life of a pavement structure more accurately, the dynamic modulus was substituted into the model instead of the static modulus to obtain the mechanical response inside the pavement structure.
The test preparation and process are as follows:
(1)
According to the mix proportion (of the asphalt mixture obtained by the Superpave test method), the temperature of the mixer was raised to 155 °C in advance and kept warm. The aggregate was placed in the oven at 165 °C and a constant temperature for 4–6 h of drying, and the asphalt was placed in the oven at 135 °C at a constant temperature for 2–3 h for the flow stage. Then, the aggregate was poured into the blender and stirred for 60 s, as shown in Figure 1a. Then the asphalt was added quickly and continually stirred for 60 s. At last, the mineral powder was added and continually stirred for 60 s. After mixing, the asphalt mixture was placed in the oven at 135 ± 5 °C for 2 h for aging. This process was used to simulate the short-term aging phenomenon in the transportation process;
(2)
After the short-term aging, the required quality of the hot asphalt mixture was weighed according to the sampling method in the specification (four-point method), and then they were evenly poured into the rotary compaction test mold, which was kept warm at 165 °C in the oven in advance. A Superpave gyratory compactor (SGC) rotary compactor was used for molding, as shown in Figure 1b. After cooling for 15 min, the specimen was demolded and left at an indoor temperature for at least 8 h;
(3)
A Φ 100 × 170 mm cylinder was drilled from a cylinder specimen with dimensions of Φ 150 × 170 mm by a core-taking machine, as shown in Figure 1c. In the process of coring, it is essential to ensure that the drill bit of the coring machine was perpendicular to the ground. According to different types of mixture, the rotation speed, descent speed, and water spraying amount of the drill bit were reasonably adjusted to ensure that the specimen was parallel, with no grooves, a smooth surface, and being perpendicular to the two end faces;
(4)
A double-sided saw was used to form a test specimen with a height of 150 ± 2.0 mm, as shown in Figure 1d;
(5)
After the above process was completed, the physical parameters (the diameter, height, density, and voidage) of the specimen were measured, and then the specimen was placed in a ventilated place at room temperature for at least two days to dry the specimen.
Three temperatures, including −10 °C, 0 °C, and 25 °C, and a loading frequency of 0.1 Hz were selected for this test. It is notable that, as for the 37 °C and 54 °C in the test specification, this paper mainly studies the ability of asphalt mixture to resist fatigue cracking at a low temperature; thus, the higher temperatures are not considered in the test. The dynamic modulus test follows ASTM D3497 and AASHTO TP62-03. The selection of 0.1 Hz mainly considers the standard frequency of the OT specification. Generally, the OT is loaded by the displacement control mode and the loading period is set as 10 s. In order to keep the consistent frequency of the two tests, the frequency in the dynamic modulus test is selected as 0.1 Hz.
As shown in Table 3, the dynamic moduli of the asphalt mixture with three grades (AC-13, AC-20, and AC-25) and three temperatures (25 °C, 0 °C, and −10 °C) at 0.1 Hz were obtained.

2.3. Overlay Test

The asphalt mixture was mixed according to the asphalt/stone ratio determined by the Superpave test method, and a cylindrical specimen with a height of 62 mm and a diameter of 150 mm was formed by a SGC rotary compacting instrument Then, a cylindrical specimen with a thickness of 38 mm and a diameter of 150 mm was cut with a double-sided cutting saw. Finally, the specimen was cut (76 mm wide, 38 mm thick, and 150 mm long). The specimen processing used for the OT was shown in Figure 2. The target porosity of the specimen was 7 ± 1%.
In this study, a UTM-100 multifunctional servo-hydraulic material testing machine was used for the OT. The equipment can carry out different module tests by replacing different types of sensors. The front and side of the test are shown in Figure 2c,d. The temperatures for the OT were 25 °C, 0 °C, and −10 °C, respectively. The test was terminated when the maximum load attenuation of the first cycle was 93 % or the maximum number of cycles before the test was 1000. The OT results are shown in Table 4.
The relationship between the maximum load of a single circle and the number of load cycles can be obtained through the OT data, as shown in Figure 3.
The following could be found from the OTs:
(1)
When the temperature dropped from 25 °C to −10 °C, the load cycles of the AC-20 and AC-13 asphalt mixtures decreased sharply. With a decrease in temperature, the crack resistance of both the AC-20 and AC-13 asphalt mixture gradually deteriorated, which was consistent with the fact that the asphalt pavement was prone to cracking in a low-temperature environment;
(2)
In the early stages of the OT, the test load decreased rapidly with the increase in the number of load cycles. When the number of cycles continued to increase, the decline rate of the maximum load in a single circle gradually slowed down, and the curve gradually tended to level; that is, the attenuation rate of the load slowed down. The reason was that the stress transferred to the crack tip decreased with the increase in crack length at the same maximum tensile displacement before the instability failure of the structure, so the crack propagation became more and more difficult.
It can be observed that there is an abrupt change in the curves in Figure 3c,d at 0 °C, which is not a sudden phenomenon. When the temperature was −10 °C, the test load decreased rapidly to find stability within fewer cycle numbers, and several data points were actually very discrete. When the temperature was 0 °C, the test load decreased rapidly with the increase in the number of load cycles, but the number of load cycles was more than that at −10 °C. There seemed to be an abrupt change in the early stage of the curves, which was the same variability as it was at −10 °C. Only a few data points at −10 °C did not look so obvious. However, the basic reason may be that the asphalt mixture is heterogeneous and obviously is affected by low temperature. Data mutation easily occurs in the process of crack development, such as the fracture of stone.

3. Evaluating the Tensile Stress and Fracture Parameters A and n

3.1. Tensile Stress by Numerical Simulation

In order to accurately calculate the fatigue cracking life of an asphalt mixture, we need to obtain the tensile stress at the bottom of each structural layer of the asphalt pavement. Therefore, the tensile stress-controlled fatigue cracking model recommended in Specifications for the Design of Highway Asphalt Pavement (JTG D50-2017) [22] was selected to calculate the fatigue cracking life. In this paper, commercial software ANSYS was used to establish a three-dimensional model of the pavement structure and obtain the tensile stress of each layer of the asphalt pavement. The viscoelastic element VISCO89 was used for the model surface, which supported stress rigidization and was only suitable for small strain and small displacement analysis. The node SOLID95 with a 3D unit entity was used at the base level. According to the existing research results, incomplete continuity was assumed between the base layer and surface layer, and the friction coefficient was 0.5. The surface layer of the model was assumed to be not completely continuous, and the friction coefficient was 0.7 [23], which can accurately obtain the mechanical response of the pavement structure under a load. The load calculated by the model was the recommended standard axle load, BZ-100, in asphalt pavement design. The ANSYS calculation model is shown in Figure 4.
The pavement structure was established by a 3D coordinate system, and the model was divided into three layers of asphalt pavement, two layers of base, and a soil base. The soil base was used to limit the displacement in the X-Y-Z directions. Both sides of the model limited the displacement in the X direction. The displacement in the Y direction was restricted before and after the model, and the driving direction was consistent with the Y direction. Because the fatigue crack of asphalt pavement was the transverse crack perpendicular to the middle line of road, the maximum tensile stress at the bottom of asphalt layer in the Y direction (driving direction) was selected as the calculated stress of the fatigue life of the crack. Three pavement structures commonly used in practice were selected to investigate fatigue life, namely structures A, B, and C. The combination of pavement structure thickness was as follows:
Structure A: 4 cm upper layer + 5 cm middle layer + 6 cm lower layer + 40 cm base layer + 600 cm soil foundation.
Structure B: 4 cm upper layer + 6 cm middle layer + 8 cm lower layer + 40 cm base layer + 600 cm soil foundation.
Structure C: 6 cm upper layer + 8 cm middle layer + 10 cm lower layer + 40 cm base layer + 600 cm soil foundation.
When the numerical model was used to calculate the mechanical response of the pavement structure, the dynamic modulus obtained by the above test was selected as the modulus of the surface layer. If the base was semirigid, the modulus of the base was 4000 MPa and the modulus of the soil was 40 MPa. If the base was flexible, the modulus of the base was 1000 MPa, and the modulus of the soil was 40 MPa. The numerical results at the bottom of each structural layer of the flexible base of the asphalt pavement at 25 °C, 0 °C, and −10 °C are shown in Table 5 and Table 6.

3.2. Calculation of Fracture Parameters A and n

As mentioned in the previous introduction, the Paris formula (proposed for fracture mechanics) is used to estimate the fatigue life at the crack propagation stage, as shown in Equation (1):
d c d N = A ( Δ K ) n
The integral Equation (2) can be obtained by the transformation of the above Equation (1):
C 0 C i d c A ( Δ K ) n d c = 0 N p N = N p
where, c is the crack length; N is the number of load cycles; A and n are the parameters related to materials; Δ K is the variation range of the stress intensity factor. The OT model is shown in Figure 5. The base layer is assumed to be nondeformable, and this OT model aims to study the crack propagation of the AC layer.
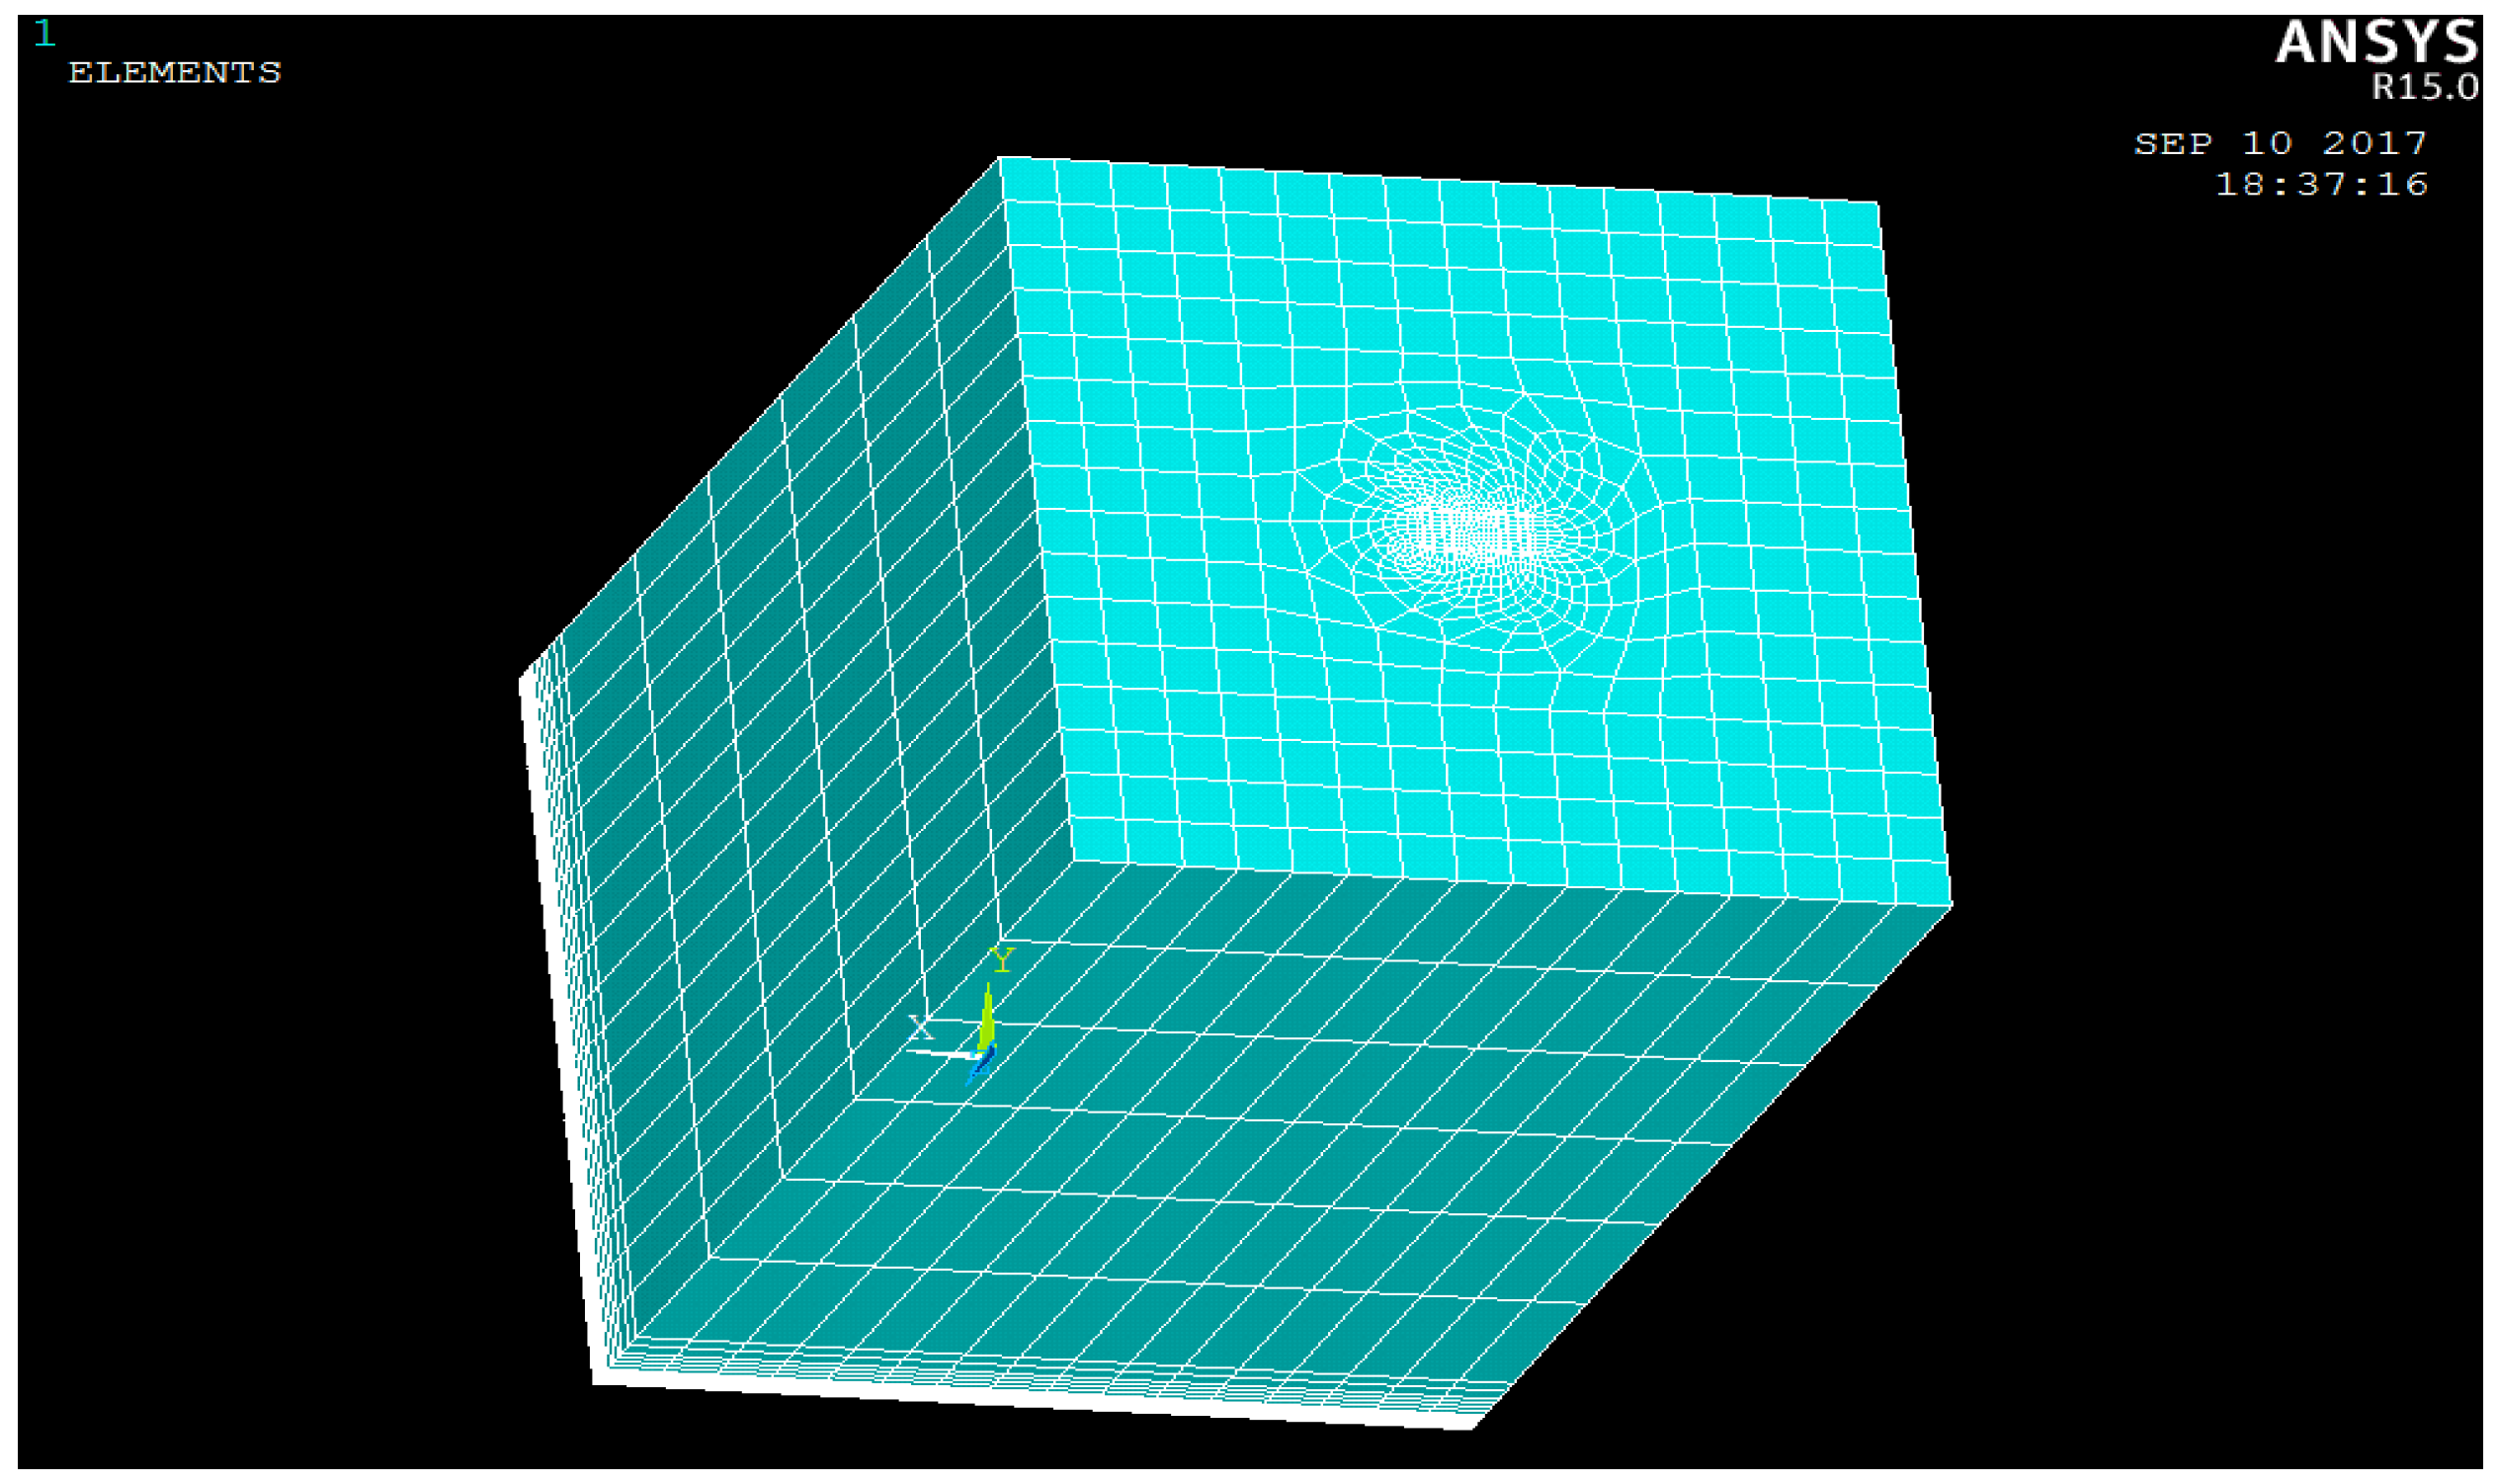
According to Equation (2), the extension life of the cracks can be obtained when the fracture parameters A and n are known. However, in order to obtain the fracture parameters of an asphalt mixture, the relationship between the stress intensity factor (SIF) and fracture length should be obtained first. Therefore, the finite element analysis software ANSYS was adopted to establish the calculation model of the OT method, as shown in Figure 6. The model used SOLID95 with intermediate nodes to establish cracks in the middle, and SOLID45 was used to establish other parts (except the cracks). The left side of the model limited the displacement in the X, Y, and Z directions, while the right side limited the displacement in the Y and Z directions. Fixed constraints were used between the upper and lower layers.
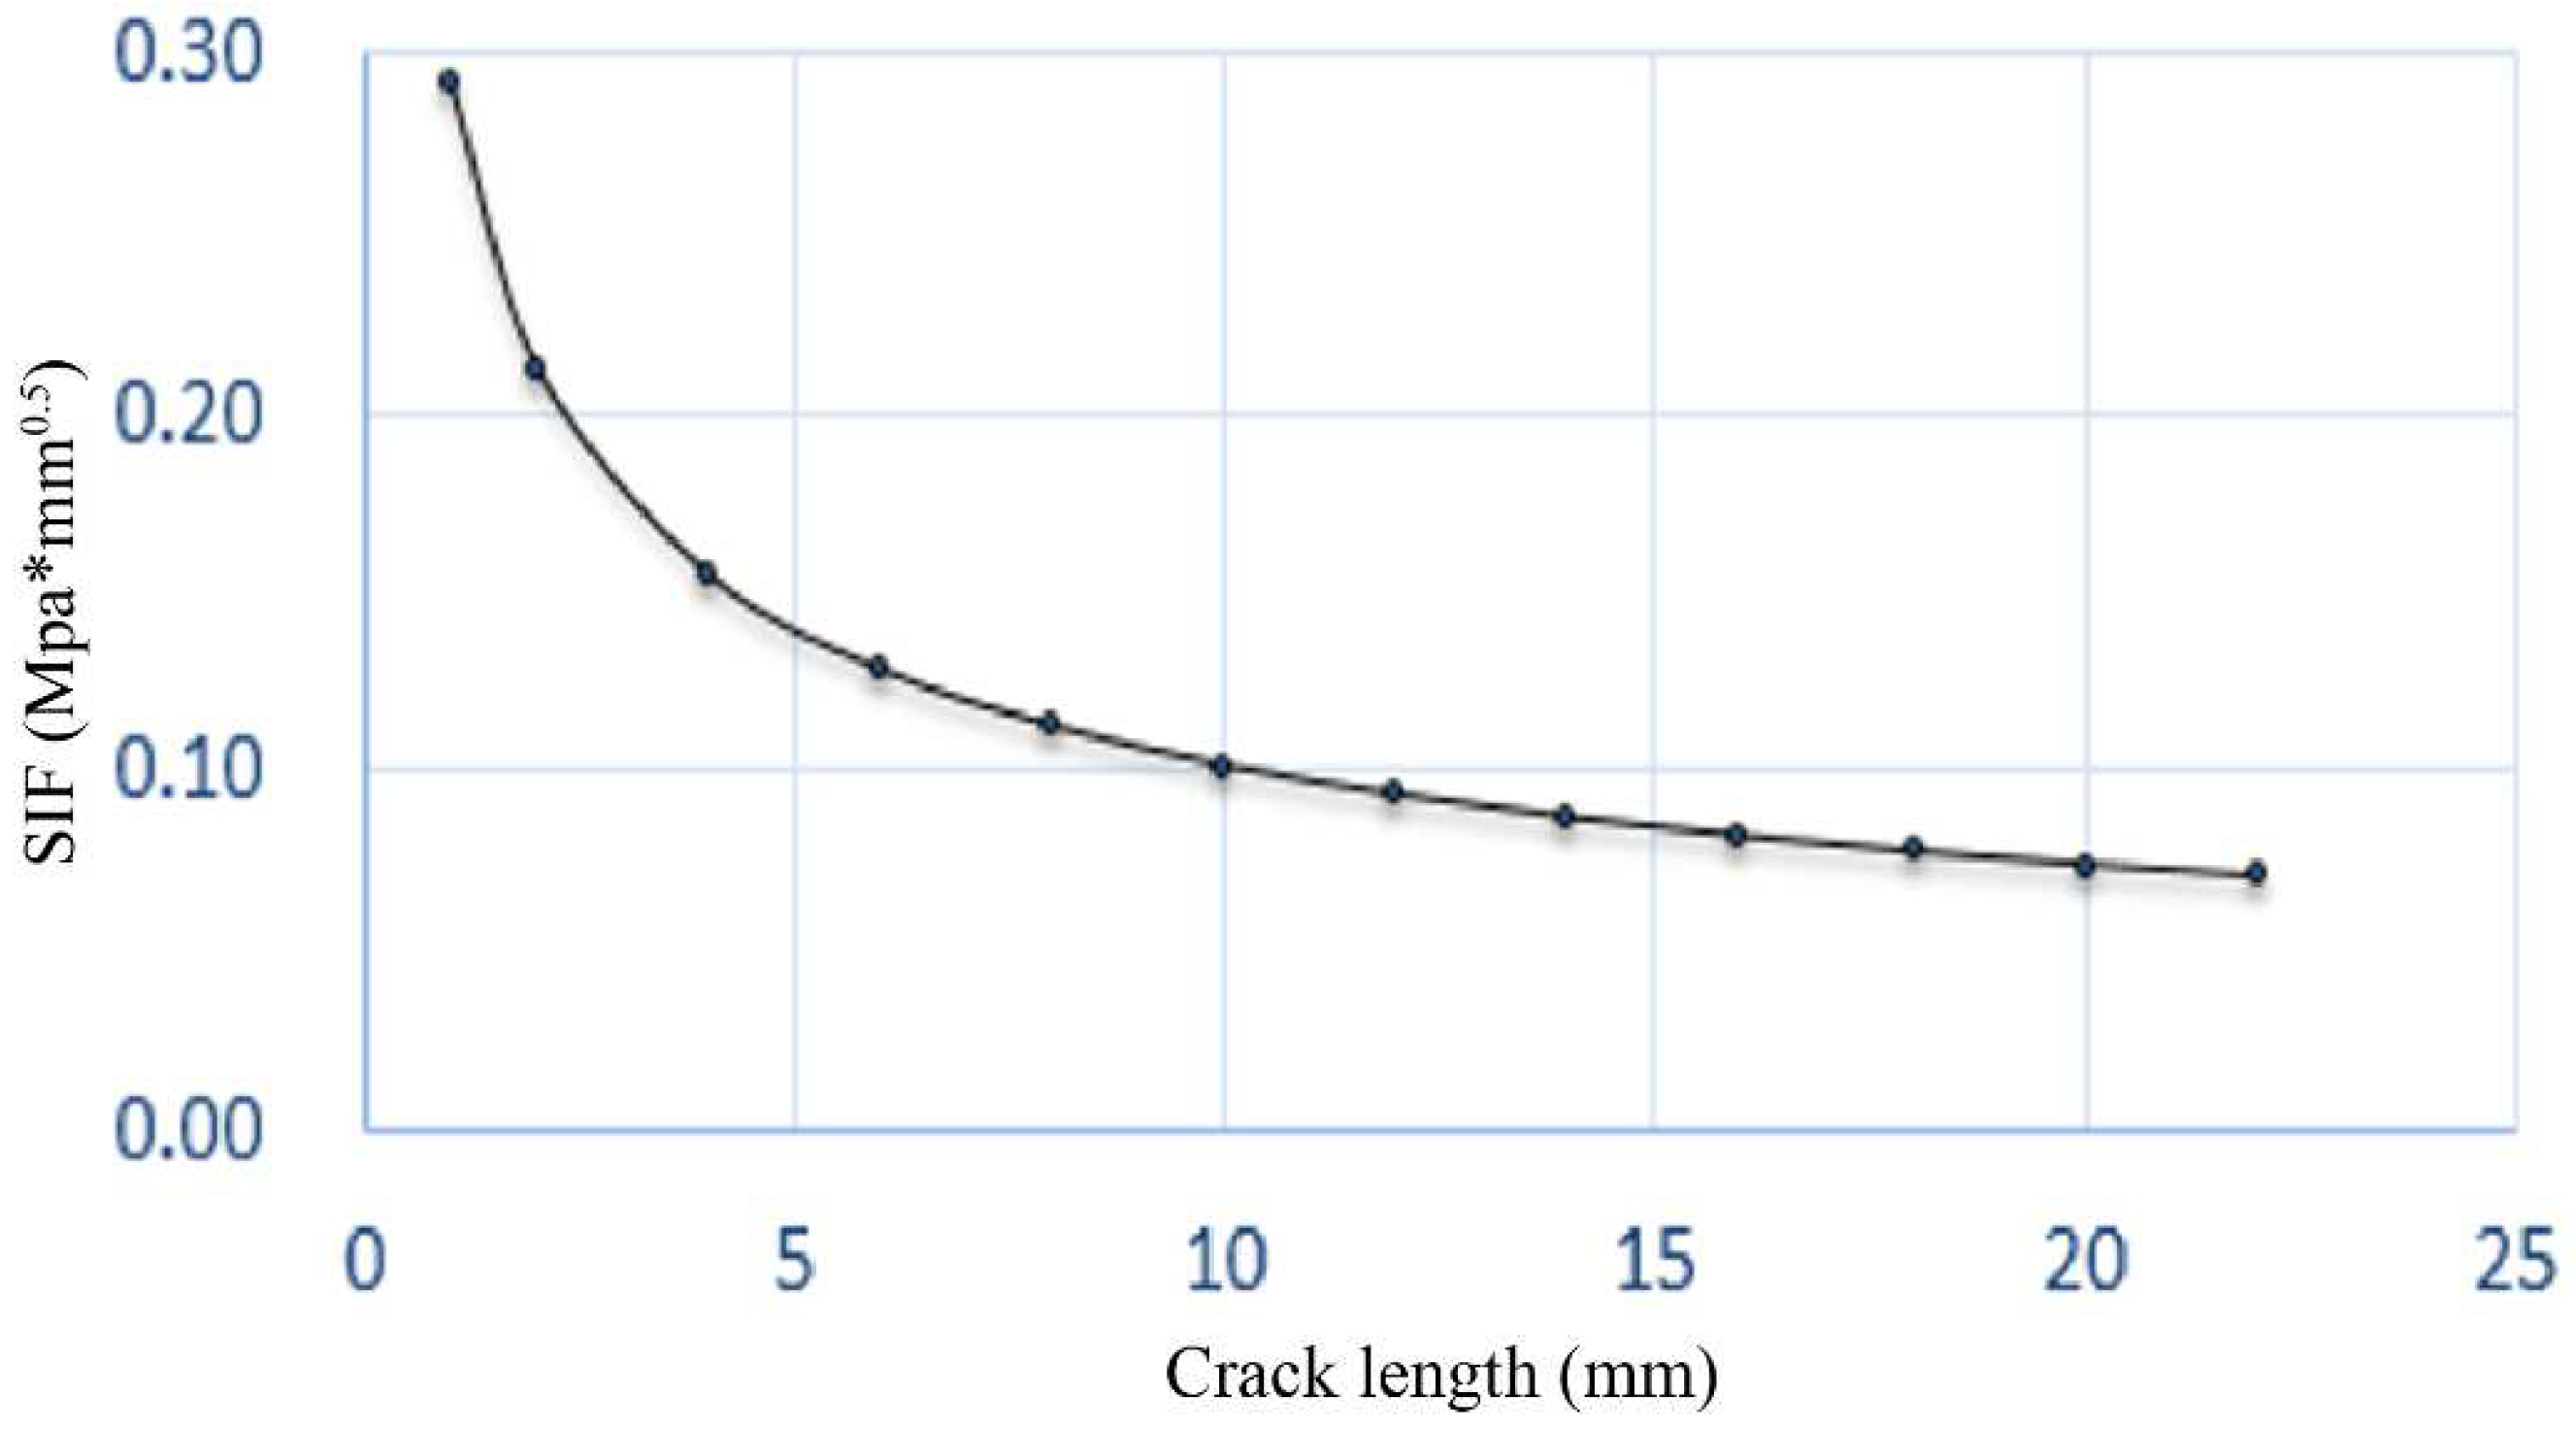
The model was used to analyze the variation in SIF with crack propagation under test conditions. According to the study of Wang et al. [24], when the dynamic modulus was 1 MPa and the maximum opening displacement was 1 mm, the relationship between SIF and crack length can be obtained, as shown in Figure 7.
Certainly, for any combination of the maximum opening displacement and dynamic modulus, the SIF is proportional to the magnitude of dynamic modulus; therefore, SIF can be obtained by regression calculation, as shown in Equation (3).
S I F = 0.2911 × E × M O D × c 0.4590
where S I F is the stress intensity factor; E is the dynamic modulus; M O D is the maximum crack opening displacement; c is the crack length.
Before using OT to analyze the relationship between the maximum load of a single circle and crack length, the relationship curve obtained by the OTs should be analyzed first, as shown in Figure 8. It can be found that the initial crack was generated from the 2 mm gap reserved at the bottom, and the reduction in the load for each cycle was due to crack generation and expansion.
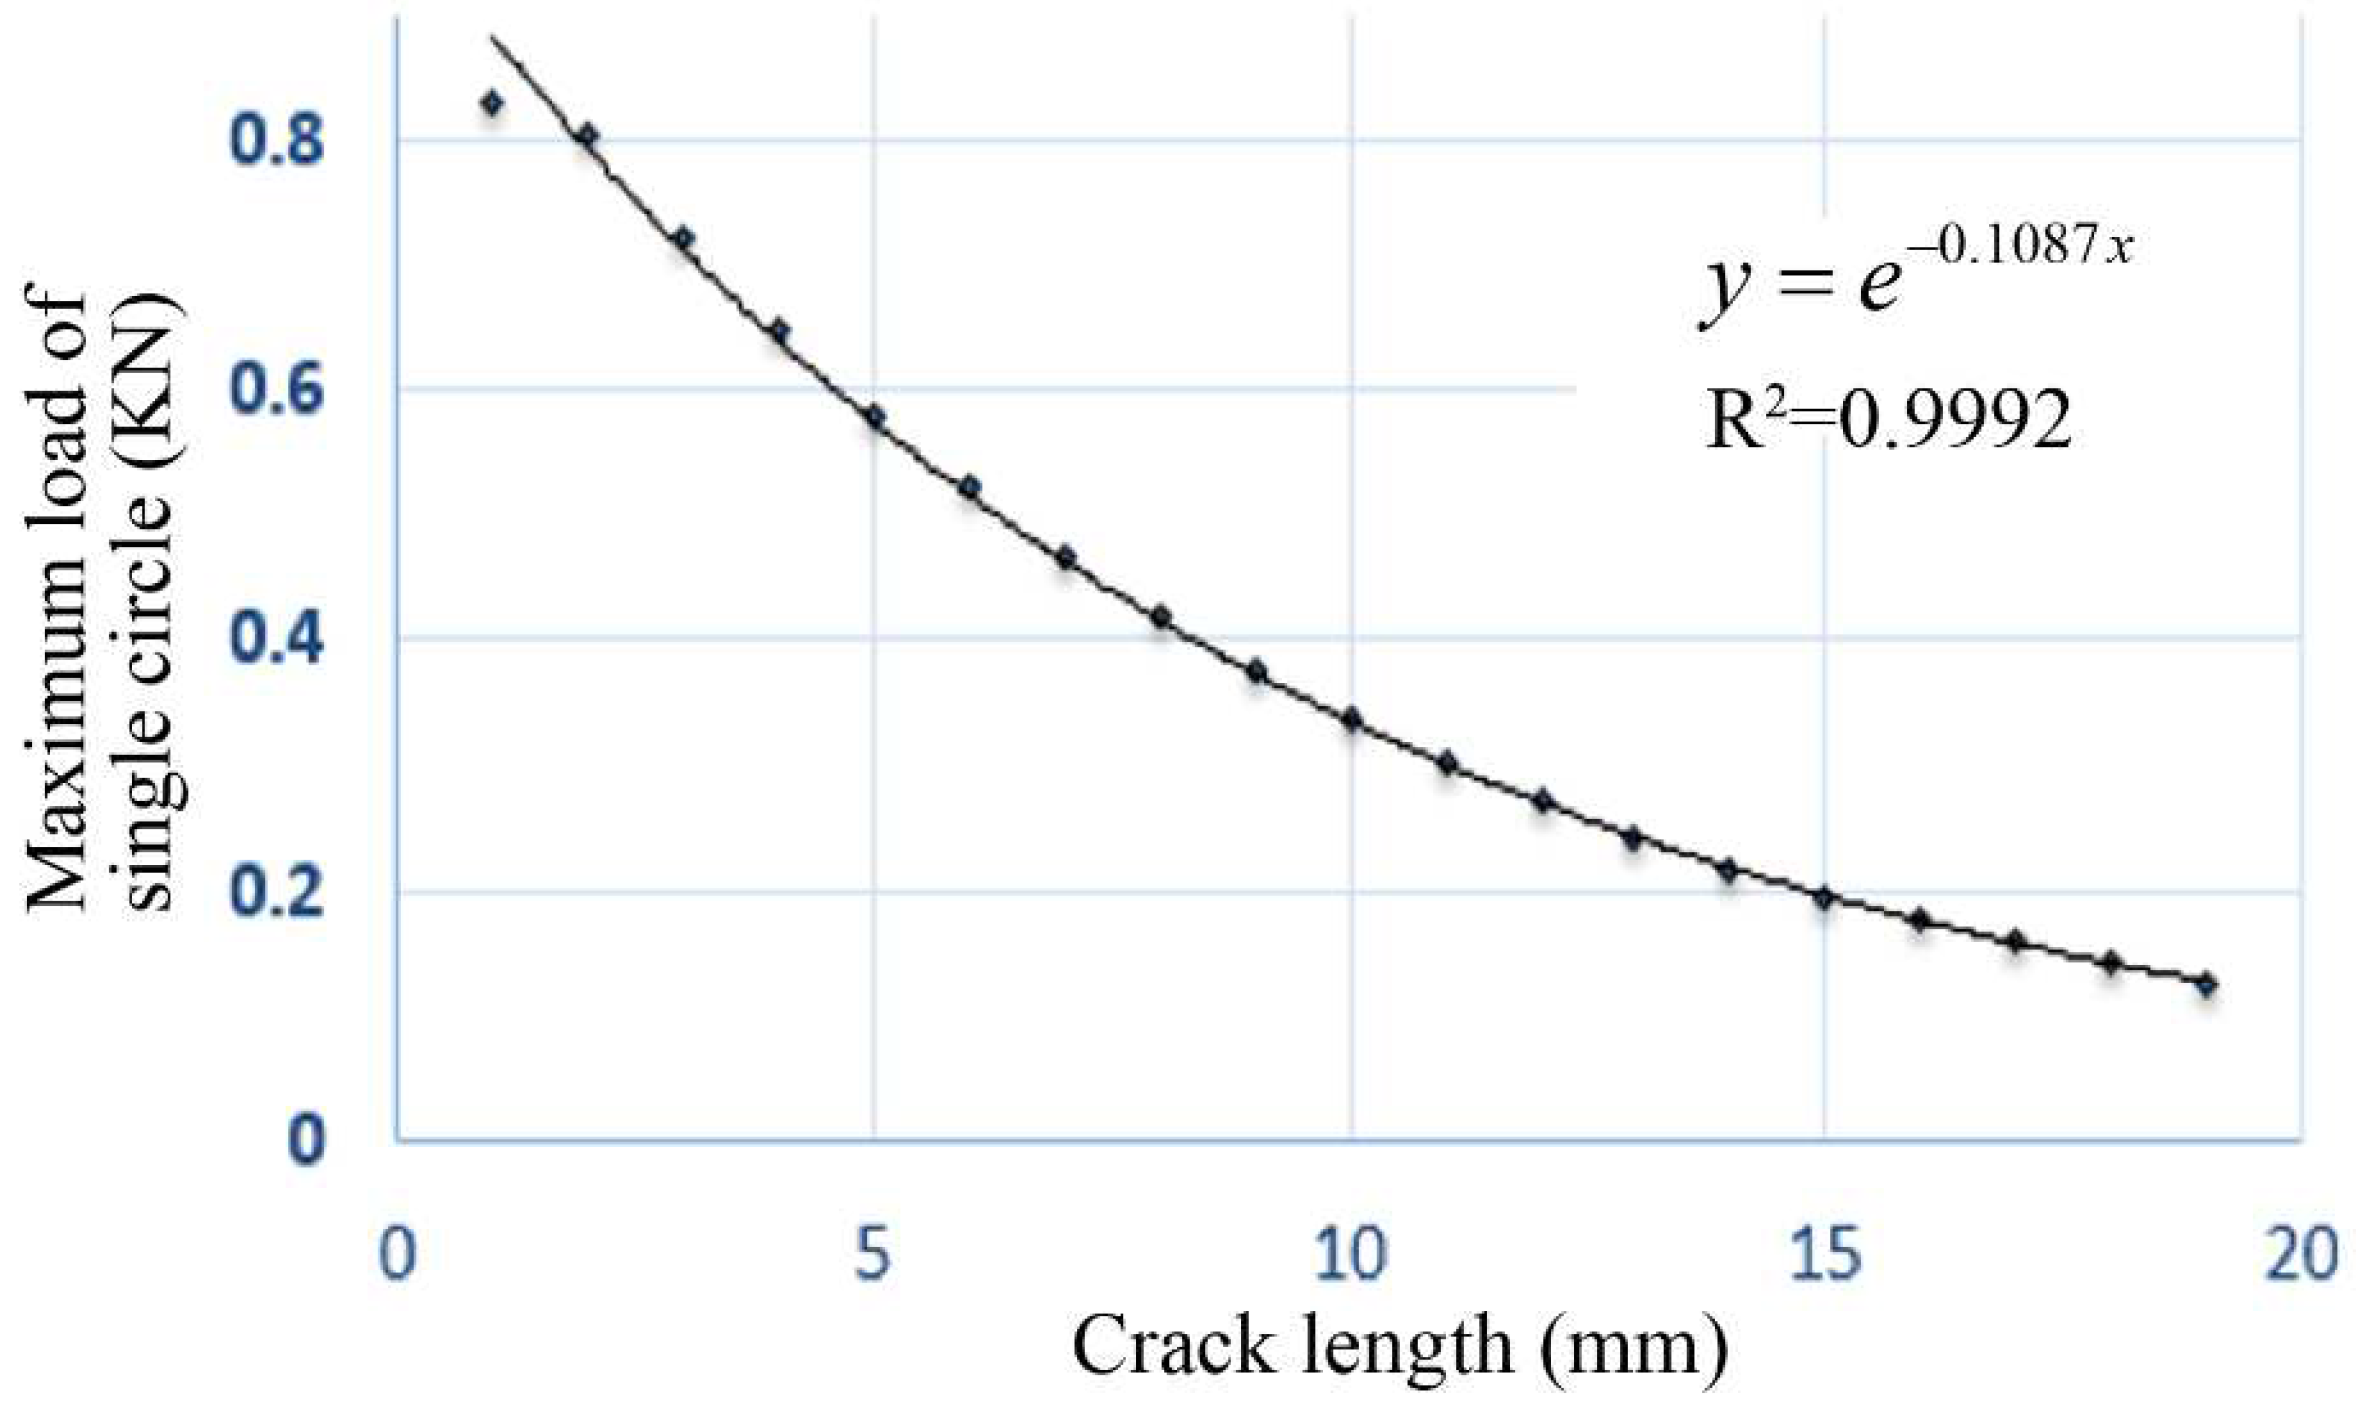
On the basis of the above discussion, in the OTs, the load required for each crack opening to the maximum tensile displacement in the OTs was proportional to the modulus of the asphalt mixture and inversely proportional to the length of the crack propagation. Therefore, if the maximum load of a single circle was assumed to be 1 kN, and the corresponding crack length was 0 mm, then this meant that the crack had not yet occurred. When the load became 0 kN, the crack penetrated the specimen. As shown in Figure 9, the relationship curve between the maximum load of a single circle and crack length can be obtained.
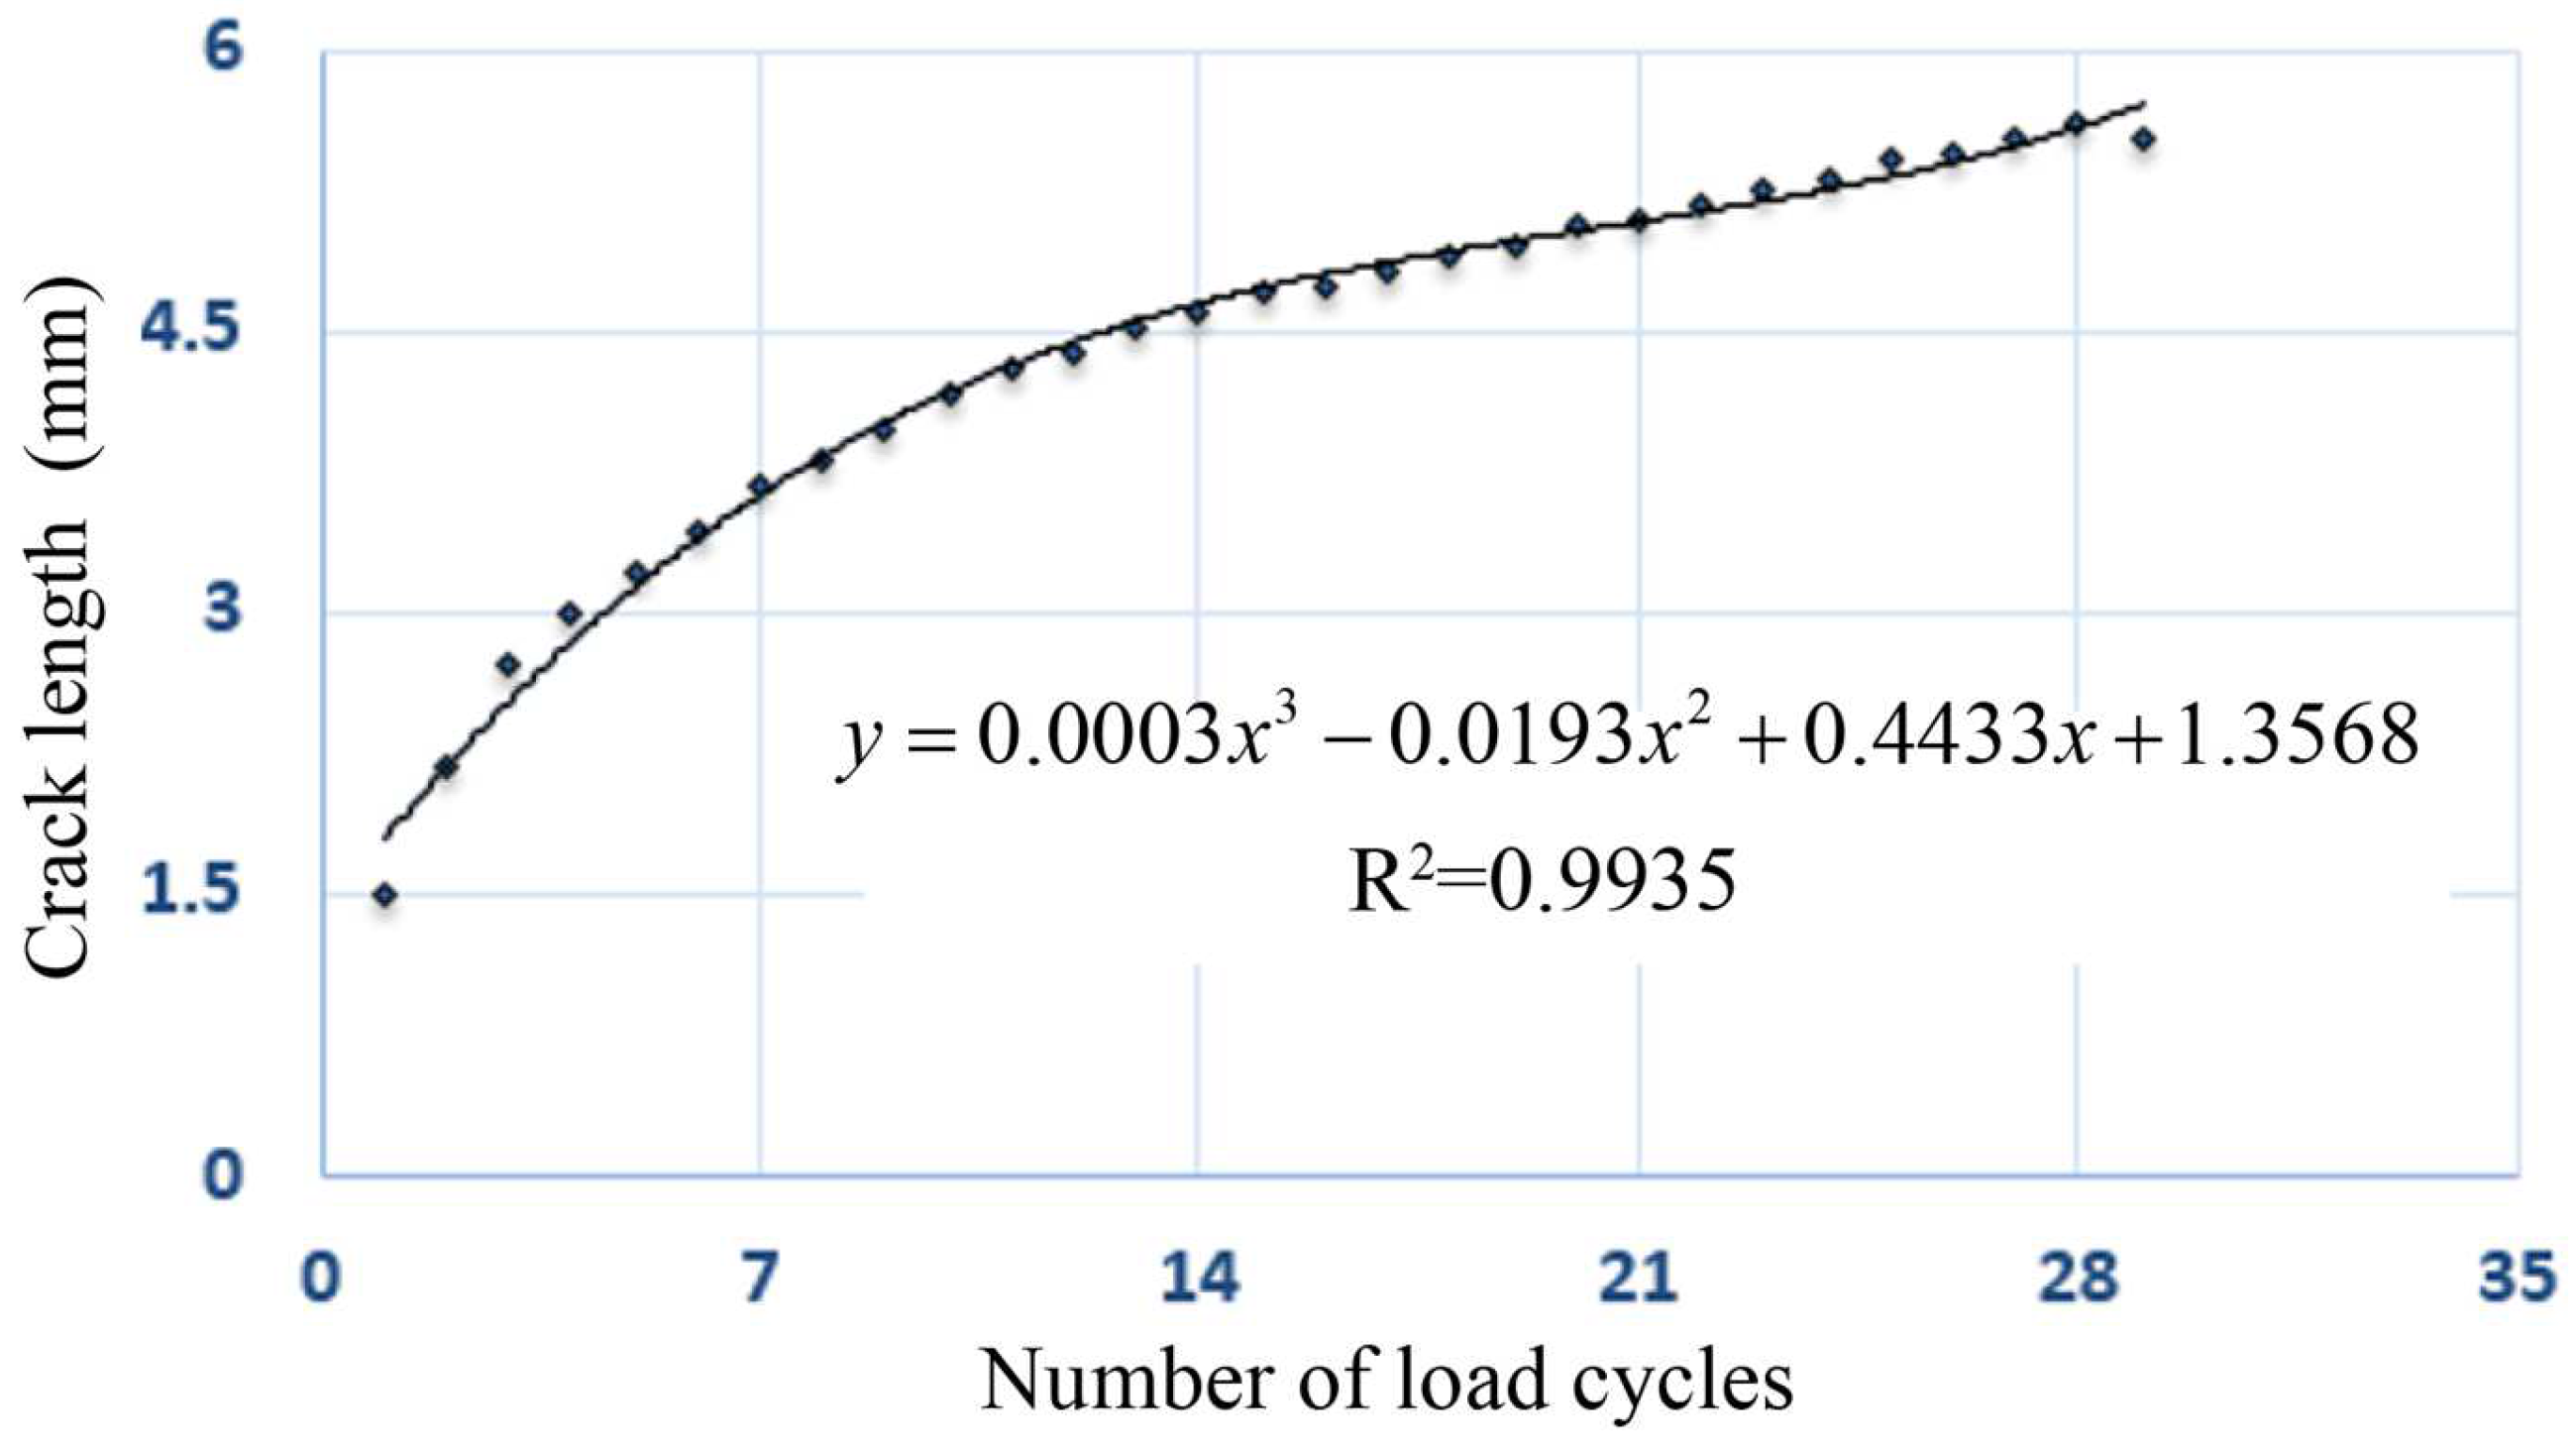
According to Equation (3), the relationship between the maximum load of a single circle and number of load cycles and the relationship between the maximum load of a single circle and crack length have been obtained. Therefore, the relationship curve between crack length and the number of load cycles is also obtained, as shown in Figure 10.
Based on the above relationship between crack length and the number of load cycles, the expression d c d N can be obtained. The relationship between SIF and crack change rate d c d N can be calculated, as shown in Figure 11.
Combined with the regression equation shown in Figure 11 and the Paris formula, A = 2 × 10⁻⁶ and n = 2.428 were obtained. OT data were processed by the above method, and the values for the parameters A and n were obtained, as shown in Table 7.

4. Prediction of Fatigue Crack Life of Asphalt Pavements

In the above Section 2 and Section 3, we have obtained the tensile stresses at the bottom of an AC layer with different grading based on the dynamic modulus test and numerical simulation, as well as the fracture parameters A and n based on the OTs at different temperatures. Therefore, the fatigue cracking life and the crack propagation life of an AC layer can be calculated based on some calculation models or theories in this section.

4.1. Fatigue Cracking Life

Various fatigue cracking models of asphalt pavements have been mentioned. However, to keep consistent with the design specifications in China, the fatigue model recommended specifications for the Design of Highway Asphalt Pavement [22] was adopted in this paper, as shown in Equation (4).
N i = 280 δ 4.5
where δ is tensile stress, and N i is fatigue cracking life.
The tensile stresses at the bottom of a semirigid base of an asphalt concrete pavement and the flexible base of an asphalt concrete pavement are substituted into the fatigue equation to calculate the fatigue cracking life of each layer of the asphalt layer.
When the temperature is 25 °C, 0 °C, and −10 °C, the fatigue cracking life of each structural layer of the flexible base of the asphalt concrete pavement is shown in Table 8, respectively.
When the temperature is 25 °C, 0 °C, and −10 °C, the fatigue cracking life of each structural layer of the semirigid base in asphalt concrete pavement is shown in Table 9, respectively.
It can be seen from Table 5, Table 6, Table 8, and Table 9 that the fatigue cracking life increased with the increase in asphalt surface thickness and increased sharply with the decrease in tensile stress. The fatigue life increased from 1 × 10⁷ to 2.4 × 10⁸ when the tensile stress decreased from 0.16 to 0.08 (these tensile stresses at the bottom have been obtained in Figure 5 and Figure 6). Therefore, it can be concluded that the tensile stress at the bottom of the asphalt layer decreased with the increase in surface thickness. The fatigue life of asphalt pavements can be improved by increasing the surface thickness, but this method will increase the construction cost. Therefore, the pavement structure design needs a reasonable thickness value.

4.2. Crack Propagation Life

It can be known that fatigue crack life includes fatigue cracking and fatigue propagation, which are the relatively accurate cracking life of asphalt pavement before fracture and instability. The crack propagation life can be obtained by the Paris formula. When calculating the propagation life of cracks via the Paris formula, two assumptions should be made: (1) the initial fracture length at the fracture propagation stage is assumed to be 5 mm; (2) in the process of fracture propagation, the fracture angle remains constant and develops vertically upward.
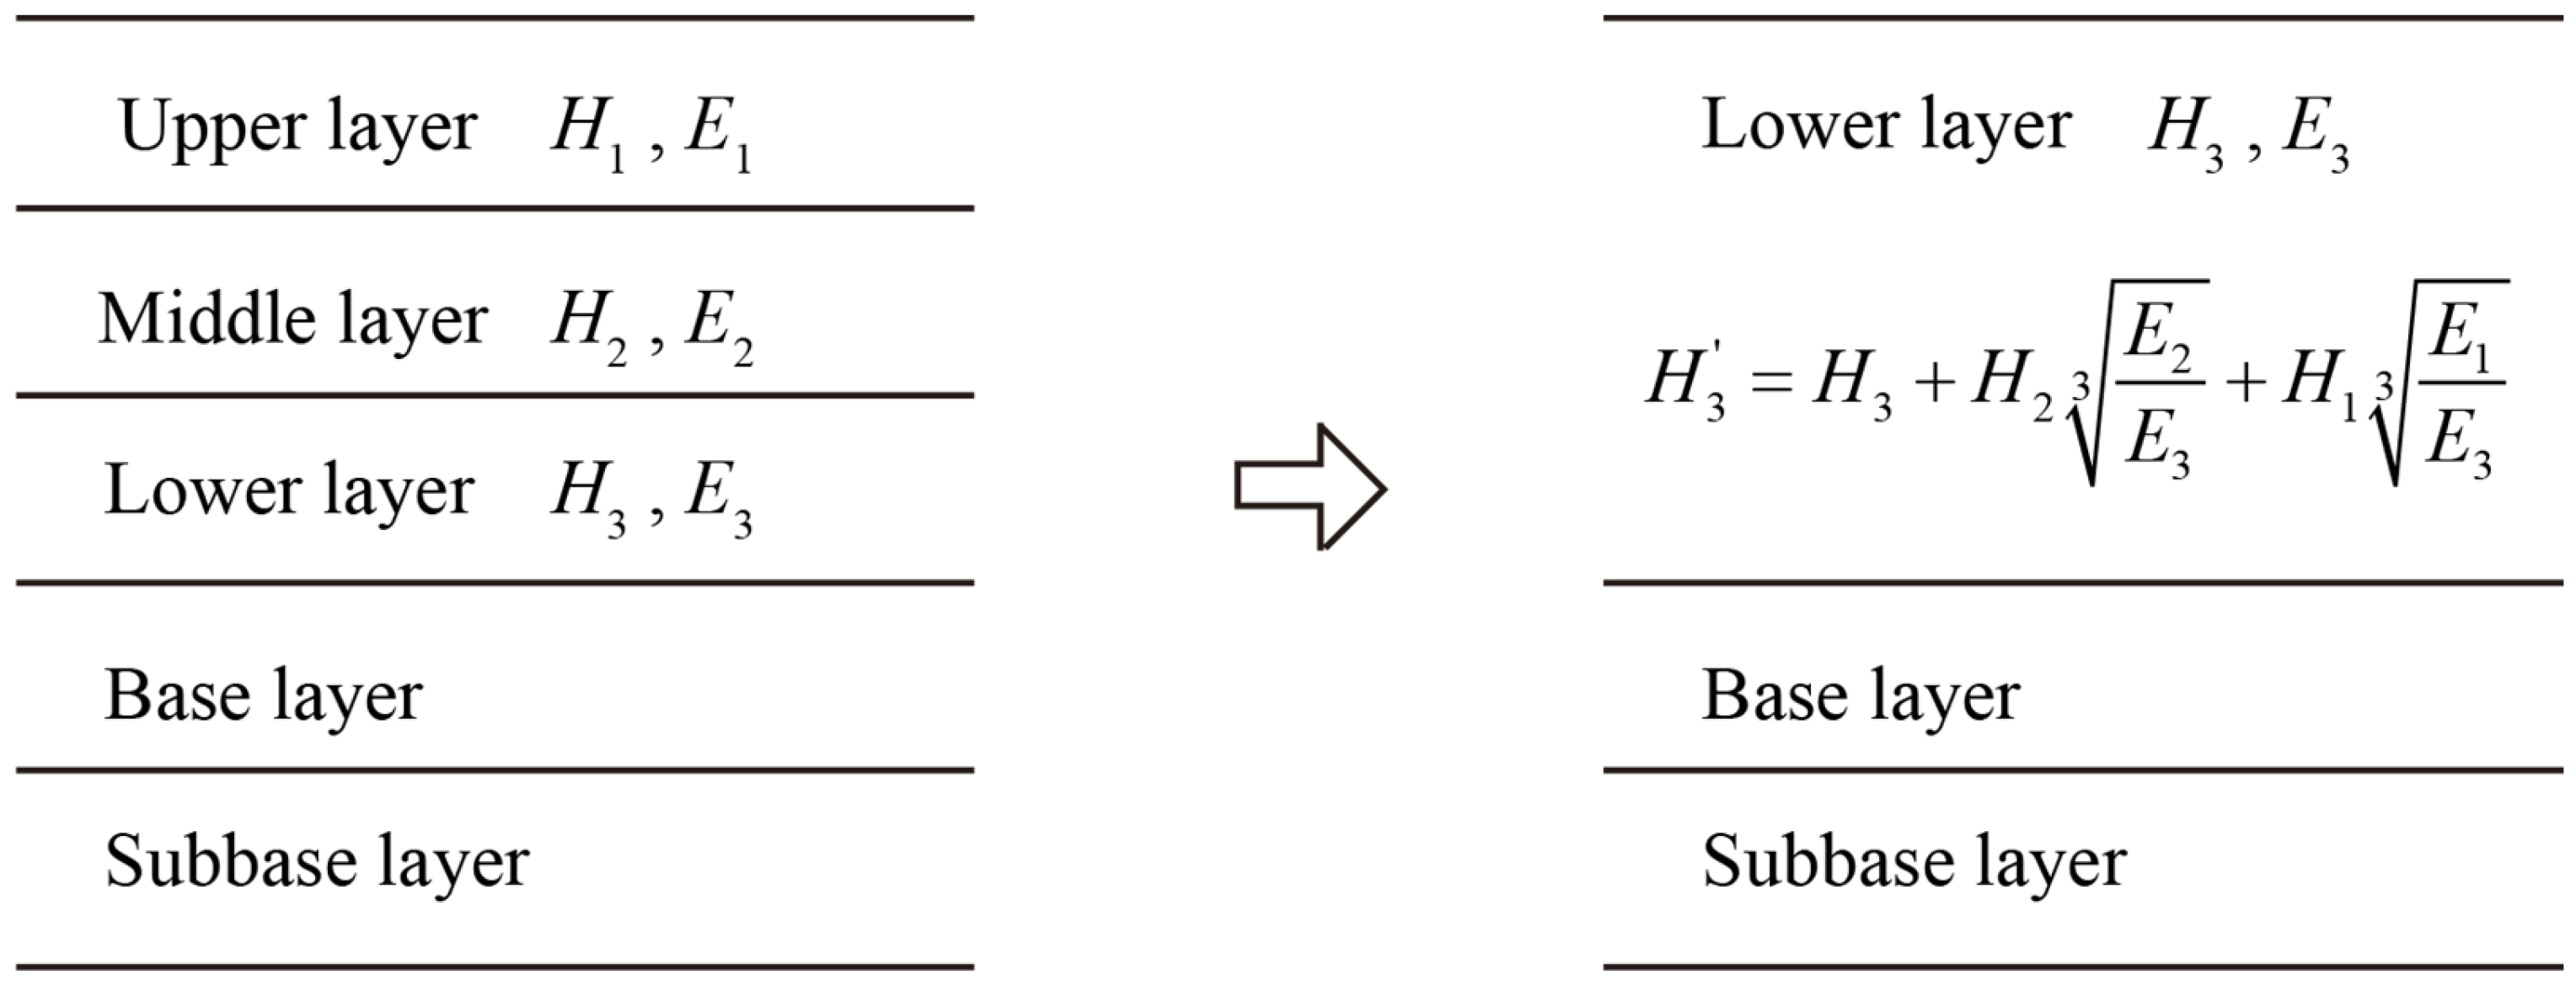
From the beginning of fatigue crack formation, cracks gradually spread to the middle layer and the upper layer under the action of temperature and load, and eventually run through the entire pavement structure. Therefore, in order to facilitate the calculation for crack propagation life, different structural layers need to be transformed into the same structural layer through certain transformations. The equivalent surface thickness theory proposed by Odemark et al. was used to carry out this conversion, which considered the influence of the change in the SIF in the mixture. When cracks eventually penetrated the entire surface thickness, the method would transform the lower and middle surface layers into the equivalent thickness of the upper layer, and the modulus remained unchanged, as shown in Figure 12.
It is worth noting that there are two basic assumptions before the thickness conversion between the different layers is carried out: (1) only the elastic state of the first part of the dynamic modulus is considered, and the asphalt mixture is considered as quasielastic; therefore, the relationship between stress and strain is linear; (2) the surface layer is completely connected with the other layer, without considering the influence of contact between asphalt layers on crack propagation.
Therefore, according to the equivalent layer thickness transformation theory, three surface layer structures, A, B, and C, are respectively transformed into the equivalent thicknesses related to the upper layer [25]:
For structure A: H 1 = H 1 + H 2 E 2 E 1 3 + H 3 E 3 E 1 3 = 17.9 cm
For structure B: H 1 = H 1 + H 2 E 2 E 1 3 + H 3 E 3 E 1 3 = 21.7 cm
For structure C: H 1 = H 1 + H 2 E 2 E 1 3 + H 3 E 3 E 1 3 = 28.7 cm
The Paris formula is transformed into an integral formula and is combined with the equivalent thickness of structures A, B, and C; then, the crack propagation life of the asphalt pavement structure with different surface layers can be calculated. When calculating the crack propagation life, the initial crack length was assumed to be 5 mm and the crack ran through the whole pavement structure. Therefore, the crack propagation life of different asphalt pavement structures under 25 °C, 0 °C, and −10 °C are shown in Table 10, respectively.
It can be seen from Table 10 that the crack propagation life of the asphalt pavement increased with the increase in surface thickness. For the sample with the same grade and the same oil content, the crack propagation life decreased sharply with the decrease in temperature. When the temperature dropped from 25 °C to 0 °C, the crack propagation life of the three layers decreased by more than 300 times. When the temperature dropped from 0 °C to −10 °C, the crack propagation life of the three layers decreased by more than 600 times. This phenomenon has the same variation trend with the number of load cycles of the OTs at different temperatures in the room.

4.3. Fatigue Crack Life

In view of the above study, fatigue cracking life and crack propagation life should be considered in the whole life of any crack formed. Therefore, the entire fatigue crack life N can be obtained by adding the fatigue cracking life N i and fatigue propagation life N p , as shown in Table 11 and Table 12.
From Table 11, it can be seen that, for the flexible base of the asphalt pavement surface, the surface thickness of structure B increased by 30 mm relative to structure A at 25 °C, and the fatigue crack life of the pavement structure increased by 9 × 10⁷ times. Compared with structure A, the surface thickness of structure C increased by 90 mm, and the fatigue crack life of the pavement structure increased by 1.5 × 10⁸ times. We can thus know that the fatigue crack life of the pavement structure only increased by less than 2.0 times when the surface thickness increased by 3.0 times. When the room temperature was 25 °C, the crack propagation life of structures A, B, and C accounted for about 97.4%, 76.3%, and 87.3% of the entire fatigue life, respectively. Therefore, the crack propagation life of the pavement structure at 25 °C may be much longer than the fatigue cracking life. When the room temperature was −10 °C, the fatigue cracking life of structures A, B, and C accounted for 99.8% of the entire fatigue life. Therefore, the crack propagation life of the pavement structure at low temperatures (−10 °C) was far less than the fatigue cracking life.
It can be seen from Table 12, for the semirigid base of the asphalt pavement surface, the surface thickness of structure B increased by 30 mm relative to structure A at 25 °C, and the fatigue crack life of the pavement structure increased by 7 × 10⁷ times. Compared with structure A, the surface thickness of structure C increased by 90 mm, and the fatigue crack life of the pavement structure increased by 3.4 × 10⁸ times. We know that the fatigue crack life of the pavement structure only increased by less than 4.8 times when the surface thickness increased by 3.0 times. When the room temperature was 25 °C, the crack propagation life of structures A, B, and C accounted for about 88.2%, 76.3%, and 52.7% of the entire fatigue life, respectively. Therefore, the crack propagation life of the pavement structure at 25 °C may be much longer than the fatigue cracking life for these three commonly used pavement structures. When the room temperature was −10 °C, the fatigue cracking life of structures A, B, and C accounted for 99.8% of the entire fatigue life. Therefore, the crack propagation life of the pavement structure at a low temperature (−10 °C) was far less than the fatigue cracking life of the pavement.
From the analysis of Table 11 and Table 12, it can be seen that the entire fatigue life of the pavement structure can be increased by increasing the thickness of the asphalt surface, both in terms of the flexible base of the asphalt pavement and the semirigid base of the asphalt pavement. Therefore, it is an ideal choice to increase the thickness of the asphalt surface appropriately to improve the service life of the pavement. Certainly, considering the cost, the reasonable thickness is worth further study.
When the room temperature was 25 °C, the crack propagation life of the three kinds of asphalt pavement accounted for more than 50% of the entire fatigue life of both the flexible base of the asphalt pavement and the semirigid base of the asphalt pavement. In contrast, when the room temperature was low (0 °C and −10 °C), the crack propagation life of the three kinds of asphalt pavement was less than 1% of the entire fatigue life of both the flexible base of the asphalt pavement and the semirigid base of asphalt pavement.
Therefore, the proportion of crack propagation life to the entire fatigue life is different at different temperatures. When analyzing and calculating the fatigue crack life of the pavement structure at 25 °C, crack fatigue propagation should be considered. In contrast, crack fatigue propagation life can be ignored at low temperatures (0 °C and −10 °C). The current pavement structure design methods only consider the crack formation stage, which is not accurate. Therefore, in order to accurately obtain the entire fatigue life of the cracks, both the fatigue cracking life and the crack propagation life should be considered.

5. Conclusions

In this paper, three types of asphalt pavement structures that are commonly used in practical engineering were selected to investigate the fatigue life of the bottom-up cracking of asphalt pavement, and the main conclusions are as follows:
(1)
The proportion of fatigue propagation life to the fatigue life of cracks at different temperatures varied significantly. Therefore, it is essential to consider the fatigue propagation life of cracks at different temperatures for accurately calculating the entire fatigue life of asphalt pavement structures. That is, the fatigue life calculation model of a pavement structure can be expressed as N = N i + N p ;
(2)
For the fatigue life of a pavement structure, the crack propagation life decreased sharply with the decrease in temperature. When the temperature dropped from 25 °C to 0 °C, the crack propagation life of the three types of surface layer structures decreased by more than 300 times. When the temperature dropped from 0 °C to −10 °C, the crack propagation life of the three types of surface layer structures decreased by more than 600 times;
(3)
The increase in asphalt surface thickness can effectively improve the fatigue crack life of a pavement structure. Therefore, it is an ideal choice to increase the thickness of an asphalt surface appropriately for improving the service life of pavements. Certainly, high AC thicknesses might make the pavement vulnerable to top-down cracking, and considering the cost, understanding a reasonable thickness is worth further study.

Author Contributions

Conceptualization and methodology, G.C. and Y.Z.; formal analysis, G.C.; investigation, X.H.; resources, J.Y. and Y.Z.; data curation, J.Y. and G.C.; writing—original draft preparation, Y.Z.; writing—review and editing, Y.Z.; project administration, J.L.; funding acquisition, J.Y. and Y.Z. All authors have read and agreed to the published version of the manuscript.

Funding

The authors gratefully acknowledge the support provided by the National Natural Science Foundation of China (Nos. 52108304 and 52108117), Special Funding of Chongqing Postdoctoral Research Programs (No. 2021XM3045), China Postdoctoral Science Foundation (No. 2022M710540) and Chongqing Natural Science Foundation (No. 2022NSCQ-MSX3349).

Institutional Review Board Statement

The study did not require ethical approval.

Informed Consent Statement

The study did not involve humans.

Data Availability Statement

The original contributions presented in the study are included in the article; further inquiries can be directed to the corresponding author.

Conflicts of Interest

The authors declare that they have no known competing financial interests or personal relationships that could have appeared to influence the work reported in this paper.

References

  1. Li, W.S.; Zhang, Y. Study on the fatigue cracking of expressway asphalt pavement. J. Inn. Mong. Agric. Univ. 2007, 28, 169–172. [Google Scholar]
  2. Ge, R.G.; Yue, Y.; Mao, Z.M.; Cao, S.Y. Calculate the stress intensity factor by the finite element software ANSYS. J. Hunan City Univ. Nat. Sci. 2009, 18, 10–12. [Google Scholar]
  3. Uzan, J.; Sides, A.; Perl, M. Viscoelastoplastic model for predicting performance of asphaltic mixtures. Transp. Res. Rec. 1985, 1043, 78–89. [Google Scholar]
  4. Ceylan, H.; Gopalakrishnan, K.; Lytton, R.L. Neural networks modeling of stress growth in asphalt overlays due to load and thermal effects during reflection cracking. J. Mater. Civ. Eng. 2011, 23, 221–229. [Google Scholar] [CrossRef] [Green Version]
  5. Hu, X.D.; Walubita, L.F. Modelling tensile strain response in asphalt pavements: Bottom-up and/or top-down fatigue crack initiation. Road Mater. Pavement Des. 2009, 10, 125–154. [Google Scholar] [CrossRef]
  6. Zhou, F.; Hu, S.; Scullion, T. Development and verification of the overlay tester based fatigue cracking prediction approach (with discussion). In Asphalt Paving Technology: Association of Asphalt Paving Technologists-Proceedings of the Technical Sessions; The Texas A&M University System: College Station, TX, USA, 2007; Volume 76, pp. 627–662. [Google Scholar]
  7. Walubita, L.F.; Faruk, A.; Koohi, Y.; Luo, R.; Scullion, T.; Lytton, R. The Overlay Tester (OT): Comparison with Other Crack Test Methods and Recommendations for Surrogate Crack Test; Rep. No. FHWA/TX-13/0-6607-2; A&M Transportation Institute: College Station, TX, USA, 2013. [Google Scholar]
  8. Hiltunen, D.R.; Roque, R. A mechanics-based prediction model for thermal cracking of asphaltic concrete pavements (with discussion). J. Assoc. Asph. Paving Technol. 1994, 63, 81–117. [Google Scholar]
  9. Paris, P.C.; Erdogan, F.A. A critical analyses of crack propagation laws. J. Basic Eng. 1963, 85, 528–534. [Google Scholar] [CrossRef]
  10. Majidzadeh, K.; Kaufmann, E.M.; Ramsamooj, D.V. Application of fracture mechanics in the analysis of pavement fatigue. Assoc. Asph. Paving Technol. Proc. 1971, 40, 227–246. [Google Scholar]
  11. Majidzadeh, K.; Kauffmann, E.M.; Saraf, C.L. Analysis of Fatigue of Paving Mixtures from the Fracture Mechanics Viewpoint; ASTM Special Technical Publications; ASTM International: West Conshehoken, PA, USA, 1971; Volume 508, pp. 67–83. [Google Scholar]
  12. Moghadas, N.F.; Toolabi, S.F.E. Study of critical cracking condition in Asphalt overlay. In Proceedings of the 10th International Conference on Asphalt Pavements, Québec, Canada; 2006; Volume 1, pp. 67–75. [Google Scholar]
  13. Lytton, R.L. Use of geotextiles for reinforcement and strain relief in asphalt concrete. Geotext. Geomembr. 1989, 8, 217–237. [Google Scholar] [CrossRef]
  14. Abo-Qudais, S.; Shatnawi, I. Prediction of bituminous mixture fatigue life based on accumulated strain. Constr. Build. Mater. 2007, 21, 1370–1376. [Google Scholar] [CrossRef]
  15. Doh, Y.S.; Baek, S.H.; Kim, K.W. Estimation of relative performance of reinforced overlaid asphalt concretes against reflection cracking due to bending more fracture. Constr. Build. Mater. 2009, 23, 1803–1807. [Google Scholar] [CrossRef]
  16. Wei, H.; Li, J.; Wang, F.; Zheng, J.; Tao, Y.; Zhang, Y. Numerical investigation on fracture evolution of asphalt mixture compared with acoustic emission. Int. J. Pavement Eng. 2022, 23, 3481–3491. [Google Scholar] [CrossRef]
  17. Zhou, L.; Ling, J.M.; Lin, X.P. Prediction model for fatigue crack of asphalt pavement with environmental factors considered. China J. Highw. Transp. 2013, 26, 47–52. [Google Scholar]
  18. Zheng, M.; Li, P.; Yang, J.; Li, H.; Qiu, Y.; Zhang, Z. Fatigue life prediction of high modulus asphalt concrete based on the local stress-strain method. Appl. Sci. 2017, 7, 305. [Google Scholar] [CrossRef] [Green Version]
  19. Praticò, F.G.; Fedele, R.; Naumov, V.; Sauer, T. Detection and monitoring of bottom-up cracks in road pavement using a machine-learning approach. Algorithms 2020, 13, 81. [Google Scholar] [CrossRef] [Green Version]
  20. Alshandah, M.; Huang, Y.; Lu, P.; Tolliver, D. Bottom-up crack detection in concrete pavements using in-pavement strain sensors. In Sensors and Smart Structures Technologies for Civil, Mechanical, and Aerospace Systems 2018; SPIE: Bellingham, WA, USA, 2018; Volume 10598, pp. 616–625. [Google Scholar]
  21. JTG F40-2004; Technical Specification for Construction of Highway Asphalt Pavement. People’s Communications Publishing House: Beijing, China, 2004.
  22. JTG D50-2017; Specifications for Design of Highway Asphalt Pavement. People’s Communications Publishing House: Beijing, China, 2017.
  23. Luo, R.; Huang, X.M. Calculation on the stress intensity factor for the bottom crack of asphalt layer in asphalt pavement considering partial constraint by weight function. Chin. J. Geotech. Eng. 2001, 23, 610–613. [Google Scholar]
  24. Wang, Z.Y. Selecting and Optimizing of Test Method Performance Based on Low Temperature Performance of Asphalt Crack Propagation Test Method Performance; Wuhan Institute of Technology: Wuhan, China, 2014. [Google Scholar]
  25. Pugno, N.; Ciavarella, M.; Cornetti, P.; Carpinteri, A. A generalized Paris’ law for fatigue crack growth. J. Mech. Phys. Solids 2006, 54, 1333–1349. [Google Scholar] [CrossRef]
Figure 1. Experimental equipment; (a) asphalt mixture mixing pot; (b) rotary compactor; (c) indoor core machine; (d) grinding of specimen.
Applsci 12 12119 g001
Figure 2. Fabrication of the OT specimen: (a) OT specimen; (b) paste OT specimen; (c) the front view OT; (d) the side view OT.
Applsci 12 12119 g002
Figure 3. OT results: (a) AC-13 (−10 °C); (b) AC-20 (−10 °C); (c) AC-13 (0 °C); (d) AC-20 (0 °C); (e) AC-20 (25 °C); (f) AC-20 (25 °C).
Applsci 12 12119 g003
Figure 4. Schematic diagram of 3D model.
Applsci 12 12119 g004
Figure 5. Schematic diagram of the OT model.
Applsci 12 12119 g005
Figure 6. Numerical calculation model based on the OTs.
Applsci 12 12119 g006
Figure 7. The variation in SIF with crack propagation.
Applsci 12 12119 g007
Figure 8. The relationship between the maximum load of a single circle and the number of load cycles.
Applsci 12 12119 g008
Figure 9. Normalized curve between the maximum load of a single circle and crack length.
Applsci 12 12119 g009
Figure 10. The relationship between crack length and the number of load cycles.
Applsci 12 12119 g010
Figure 11. The relationship between crack change rate and SIF.
Applsci 12 12119 g011
Figure 12. Schematic diagram of pavement structure and equivalent layer thickness conversion.
Applsci 12 12119 g012
Table 1. Test results of asphalt raw materials.
Test ItemsMeasured Data AH-70Technical Requirements AH-70Test Method
Penetration (25 °C, 100 g, 5 s, 0.1 mm)79.460–80T0604
Softening point (°C)46.76≥46T0606
Ductility (10 °C) (cm)147.5≥20T0605
Ductility (15 °C) (cm)>200≥100
60 °C Dynamic viscosity (Pa.s)297≥180T0620
Asphalt flash point (°C)284≥46T0611
Residual needle penetration ratio (25 °C)82.1≥61T0604
Residual ductility (10 °C) (cm)8.5≥6T0605
Residual ductility (15 °C) (cm)33≥15T0605
Table 2. Asphalt mixture selection gradation.
Mass Percentage (%) through the Square Hole Screen (mm)
Specifications26.5191613.29.54.752.361.180.60.30.150.075
AC-1310010099.795.176.838.429.123.017.312.210.47.9
AC-2010099.191.173.354.930.323.618.714.210.08.66.6
AC-2599.179.073.065.752.736.732.023.715.010.28.26.8
Table 3. Dynamic modulus at different gradations and temperatures.
GradationAC-13AC-20AC-25
Temperature (°C)250−10250−10250−10
Dynamic Modulus (MPa)83214,69025,149149713,00921,916185015,81315,813
Table 4. OT results at different gradations and temperatures.
GradationAC-13AC-20
Temperature25 °C0 °C−10 °C25 °C0 °C−10 °C
OT results1000971010007242
Table 5. Tensile stress at the bottom of each structure layer of asphalt pavement with a flexible base.
Pavement StructurePitch Depth (mm)Tensile Stress at the Bottom of Layers (Mpa)
25 °C0 °C−10 °C
A0–400.630.670.69
40–900.380.380.41
90–1500.200.230.31
B0–400.430.530.56
40–1000.210.240.27
100–1800.110.160.19
C0–600.560.570.58
60–1400.280.290.31
140–2400.120.140.16
Table 6. Tensile stress at the bottom of each structure layer of the asphalt pavement with a semirigid base.
Pavement StructurePitch Depth (mm)Tensile Stress at the Bottom of Layers (Mpa)
25 °C0 °C−10 °C
A0–400.290.310.33
40–900.220.260.28
90–1500.140.180.19
B0–400.290.300.30
40–1000.210.230.24
100–1800.110.130.15
C0–600.270.270.30
60–1400.160.180.21
140–2400.080.100.14
Table 7. Fracture parameter calculation.
TemperatureAC-13AC-20
AnAn
25 °C1 × 10−62.5722 × 10−62.428
0 °C2 × 10−62.1281 × 10−51.906
−10 °C6 × 10−62.5155 × 10−52.620
Table 8. Fatigue cracking life of each structural layer of the flexible base of asphalt pavement.
Pavement StructurePitch Depth (mm) Cracking Life N i (time)
25 °C0 °C−10 °C
A0–40224016971487
40–9021,78421,78315,475
90–150391,312208,63254,454
B0–4012,49048743804
40–100314,175172,269101,396
100–1805,766,2171,068,115492,909
C0–60380535133249
60–14086,08973,51354,454
140–2403,898,0051,947,9681,068,115
Table 9. Fatigue cracking life of each structural layer of the semirigid base in asphalt pavement.
Pavement StructurePitch Depth (mm) Cracking Life N i (time)
25 °C0 °C−10 °C
A0–4073,51354,45441,100
40–90254,833120,16486,088
90–1501,947,968628,683492,909
B0–4073,51363,11263,112
40–100314,174208,632172,269
100–1805,766,2162,719,0231,428,062
C0–60101,396101,39663,112
60–1401,068,115628,683314,174
140–24024,168,6888,854,3771,947,968
Table 10. Crack propagation life for each structure of asphalt pavements.
Pavement StructureCo
(mm)
Ci
(mm)
25 °C0 °C−10 °C
E
(MPa)
MOD
(mm)
N p ( time ) E
(MPa)
MOD
(mm)
N p ( time ) E
(MPa)
MOD
(mm)
N p ( time )
A5408320.62514,628,09914,6900.62547,99825,1490.62578
55014970.62513,0090.62521,9160.625
56018500.62515,8130.62525,8430.625
B5408320.62518,600,39414,6900.62558,39025,1490.62597
56014970.62513,0090.62521,9160.625
58018500.62515,8130.62525,8430.625
C5608320.62526,937,40714,6900.62580,36325,1490.625134
58014970.62513,0090.62521,9160.625
510018500.62515,8130.62525,8430.625
Table 11. Entire fatigue crack life of flexible base asphalt pavement surface.
Pavement StructureTemperature (°C) N i ( time ) N p ( time ) N
A25391,31214,628,0991.5 × 108
0208,63247,9982.6 × 106
−1054,454785.5 × 105
B255,766,2171,860,03942.4 × 108
01,068,11558,3901.1 × 106
−10492,909974.9 × 106
C253,898,00826,937,4073 × 108
01,947,96880,3632 × 107
−101,068,1151341 × 107
Table 12. Entire fatigue crack life of semirigid base asphalt pavement surface.
Pavement StructureTemperature (°C) N i ( time ) N p ( time ) N
A251,947,96814,628,0991.7 × 108
0628,68347,9986.8 × 106
−10492,909784.9 × 106
B255,766,21618,600,3942.4 × 108
02,719,02358,3902.8 × 107
−101,428,062971.4 × 107
C2524,168,68826,937,4075.1 × 108
08,854,37780,3638.9 × 107
−101,947,9681341.9 × 107
Publisher’s Note: MDPI stays neutral with regard to jurisdictional claims in published maps and institutional affiliations.