Article

The Impact of RES Development in Poland on the Change of the Energy Generation Profile and Reduction of CO2 Emissions

1
Mineral and Energy Economy Research Institute, Polish Academy of Sciences, Wybickiego St. 7A, 31-261 Cracow, Poland
2
Faculty of Organization and Management, Silesian University of Technology, Roosevelta St. 26, 41-800 Zabrze, Poland
3
Faculty of Electrical Engineering, Częstochowa University of Technology, Dąbrowskiego St. 69, 42-201 Częstochowa, Poland
*
Authors to whom correspondence should be addressed.
Appl. Sci. 2022, 12(21), 11064; https://doi.org/10.3390/app122111064
Submission received: 6 October 2022 / Revised: 27 October 2022 / Accepted: 28 October 2022 / Published: 1 November 2022
(This article belongs to the Special Issue The Transition toward Clean Energy Production)

Abstract

:
The COVID-19 pandemic with subsequent economic fluctuations during consecutive epidemics waves and preventive measures in the form of lockdowns, and Russia’s invasion of Ukraine have had a meaningful impact on the European economy, including the energy market. These events have caused an increase in the prices of many products, including fossil fuels, and also a lack of their availability. The changes inspired the authors to conduct research on the current situation in Poland in the field of renewable energy and coal. The paper describes the research on the impact of the development of RES (mainly photovoltaic sources) on the change in the energy generation profile in the case of Poland. The article analyzes the impact of RES (renewable energy sources) on the reduction of CO2 emissions. The conducted analysis was based on the historical similarity of the replacement of conventional (carbon) sources by PV (photovoltaics) by determining in how many cases (%), a specific carbon source will be displaced. Based on the prepared forecast, it was determined that by the end of the year, the installed capacity in PV will reach the level of 11,213 MWp (in wind energy, it will be 7875 MWp). Replacement (reduction of consumption) of approximately 1.5 million Mg of hard coal and 2.87 million Mg of lignite was concluded to be possible (~4.4% and 6.3% of the hard-coal and lignite volume used for energy production). Limiting this volume of hard coal and lignite will also reduce CO2 emissions in the entire NPS by 5.24 million Mg (−5%) in 2022.

1. Introduction

In recent years, fluctuations in the European and global economy, caused by several factors that were not previously predictable, have been observed. These included the COVID-19 pandemic with subsequent economic fluctuations during consecutive epidemic waves and preventive measures in the form of lockdowns, and Russia’s invasion of Ukraine, which had a dramatic impact on the European economy. These events primarily resulted in the breaking of supply chains and the introduction of an embargo on many products (including fossil fuels), which translated into a rapid increase in their prices and, in extreme cases, the lack of their availability.
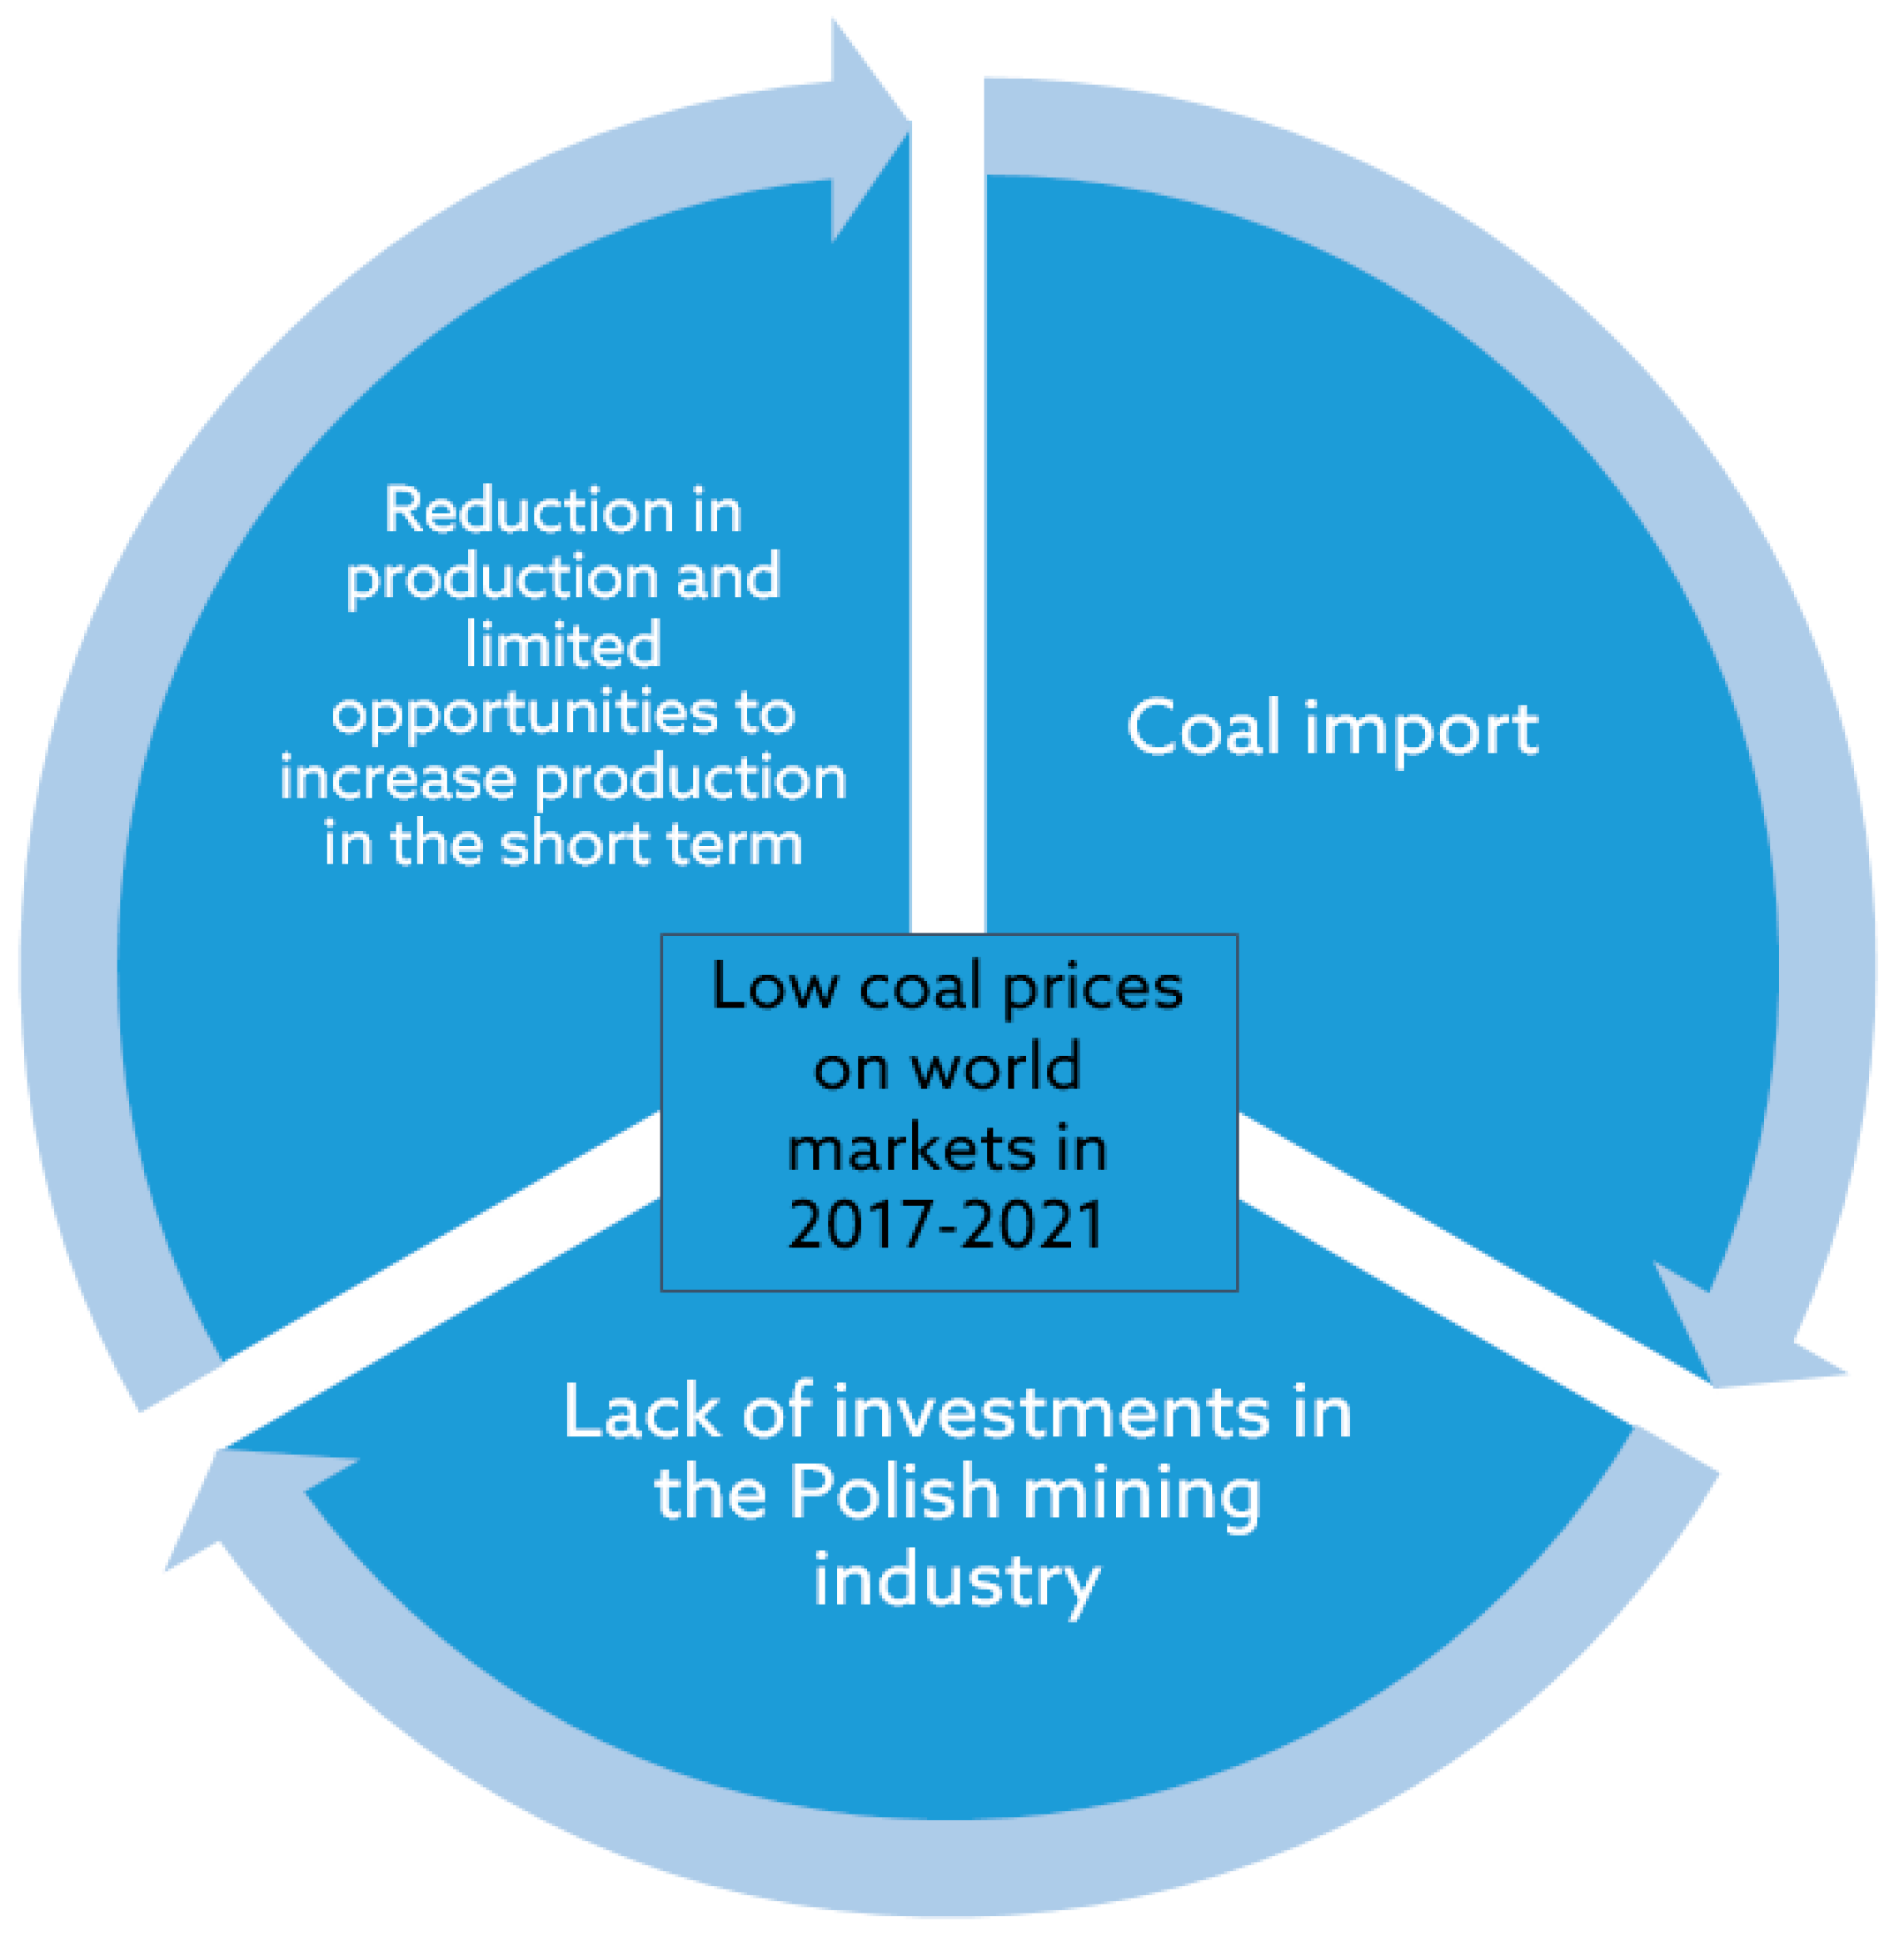
Poland, despite one of the largest hard-coal deposits (total proved reserves at end of 2020) in Europe (22.53 billion Mg) [1], has become its importer since 2017 (Figure 1). This was caused by increasingly difficult exploitation conditions (deep underground mines with many natural hazards), gradual withdrawal from hard coal in the energy industry and the availability of cheap raw material, mainly from Russia. The diagram of the couplings that occurred in the above-mentioned range is presented in Figure 2.
The import of hard coal from Russia to Poland decreased from 12.9 million Mg in 2018 to 9.1 million Mg in 2020. According to the data of the Industrial Development Agency (ARP), 8% of the volume of coal imported from Russia in 2020 was used for the production of electricity, mainly in combined heat and power plants, which need coal of better quality that is difficult to produce from Polish deposits. When translating these shares into the upcoming years, it can be assumed that there will be a gap of about 1 million Mg of hard coal, which will have to be replaced in the upcoming years in the production of electricity. One of the solutions is to replace this volume with the rapidly developing renewable energy sources (RES) in Poland, especially PV sources.
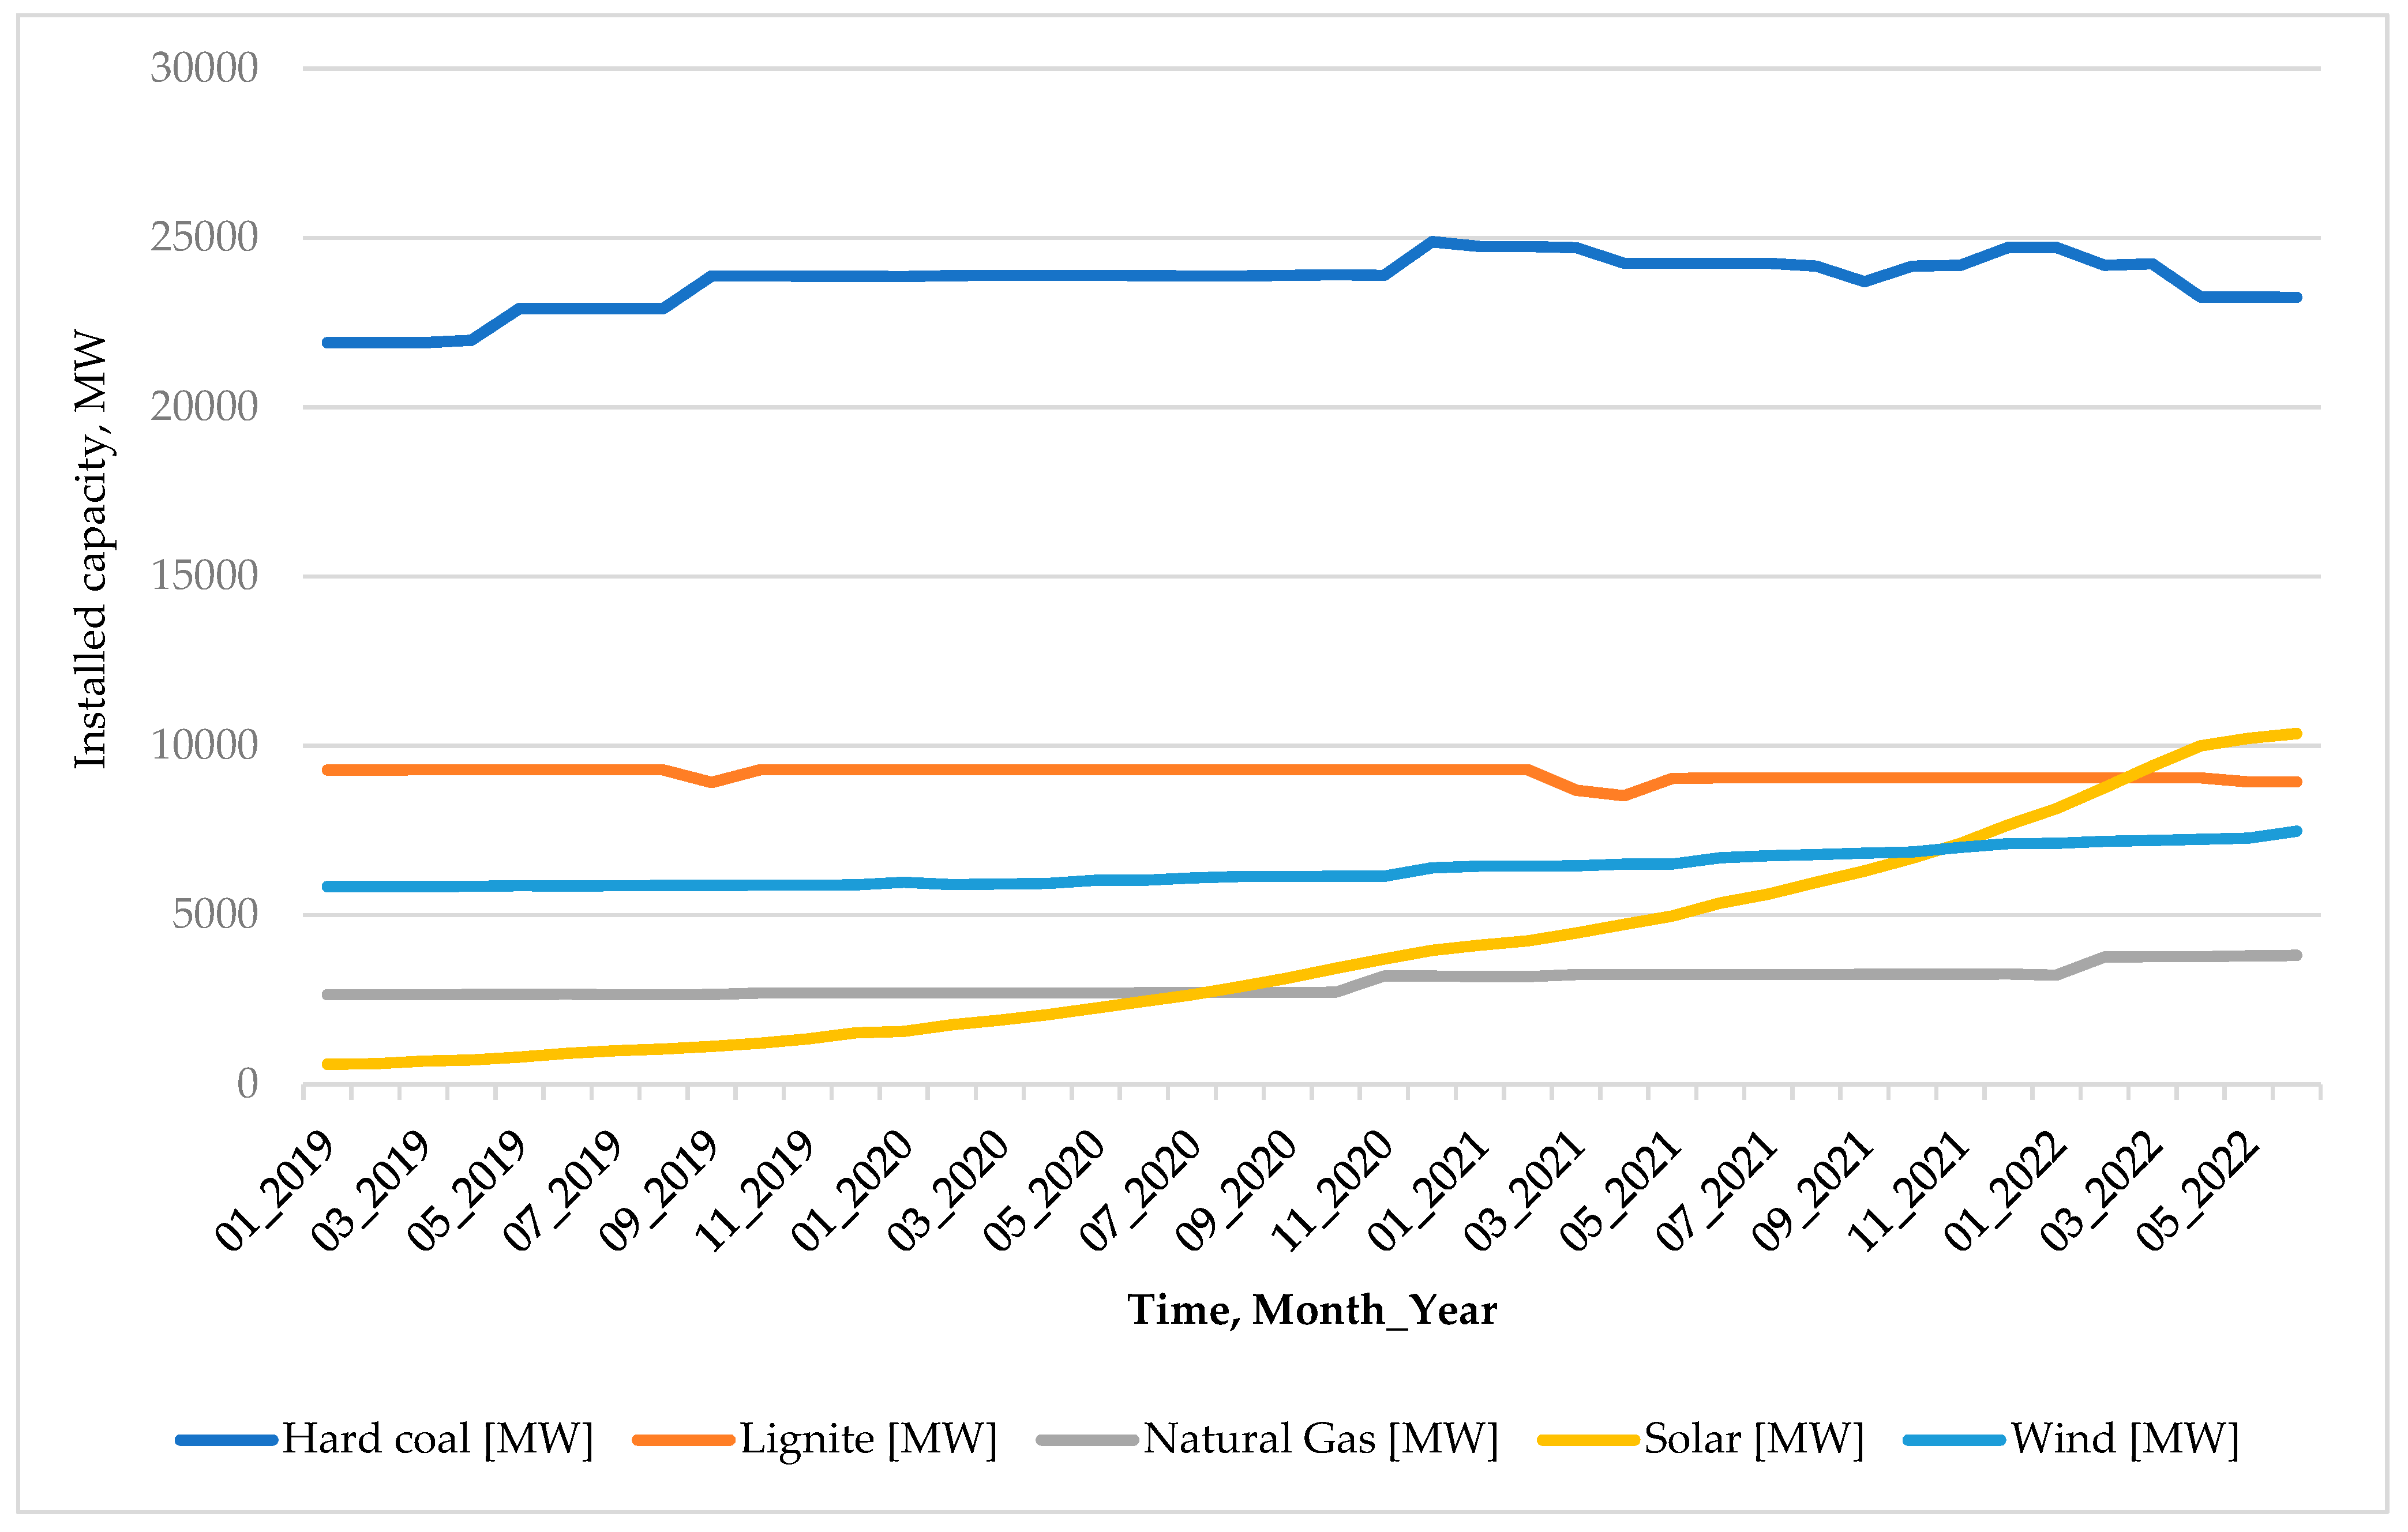
According to data from Energy Market Agency (ARE) [2], at the end of June 2022 (Figure 3) the total installed capacity in PV amounted to 10.36 GWp (an increase year by year over 93%) and in wind energy 7.48 GWp (an increase every year by 11.7%). In the period of January 2019–June 2022, photovoltaics recorded the largest increase in installed capacity among all electricity generation technologies in Poland (by over 1600%).
Significant increases in installed capacity were also observed in the case of natural gas thermal power plants (+44%) and wind farms (+28%). Conventional coal-fired power plants increased their capacity by 6%, while the installed capacity in those that use lignite, decreased by 4% (closure of power units at the Pątnów power plant).
In 2020, domestic electricity consumption was lower than in 2019, due to the COVID-19 pandemic and the preventive measures imposed by lockdown [3]. In the following year, an increase in demand for electricity along with an increase in its production in the country was observed—and 819 GWh was imported at the end of 2021 (Table 1). A comparative analysis of the first 6 months of 2022 with the previous year shows a slight increase (1.21%) in electricity consumption with a significant increase in production (7.25%), which translated into a positive balance of intersystem (international) exchange at the level of 1 708 GWh. The large increase in the volume of energy production from renewable sources (mainly PV and wind) by almost 55% is also worth noting. Maintaining the upward trend from the first 6 months, domestic energy consumption should not exceed 177 TWh with a positive international exchange balance.
The aim of the research is to assess the impact of RES development in Poland on changing the energy generation profile and reducing CO2 emissions by determining which conventional energy sources will be replaced.

2. Literature Review on Current Tendency on Renewable and Coal Energy

The COVID-19 pandemic and the Russian invasion of Ukraine have had a significant impact on the European market, including the energy market. There have been changes in the supply chains of energy raw materials and the technical infrastructure, enabling the production of energy from conventional and unconventional sources. For this reason, in this year (2022), there have been different forecasts and predictions for the generation of energy from coal and renewable energy in individual countries, as well as throughout Europe and the world.
According to the forecast results of Raheem et al., energy consumption in the G20 countries from 2022 to 2026 of all non-renewable sources other than coal has an increasing trend during the forecast period—with the United States, Russia and China being the largest consumers [4]. Furthermore, natural gas is the most consumed non-renewable energy source, whereas hydroelectricity is the least consumed in the analyzed time. The U.S. was the largest consumer of nuclear energy, whereas Argentina consumed only 0.1 exajoules of nuclear energy—placing it at the end of nuclear energy consumers. The authors of [5] used the traditional grey model (GM)(1,1) and extended the model by the extrapolation method. They proposed an optimized grey prediction model and deduced the time response equation. The model was applied to forecast the next five years’ consumption of China, India, and the United States, as the world’s top three coal consumers. According to the results, coal consumption in China and India will continue to increase over the next five years, while in the United States it will decline. Since the findings are consistent with the current development of the three countries, the optimized prediction model can effectively predict the coal consumption of these countries. The study of [6] presents projections of total energy consumption based on correlation analysis, autoregressive modelling and cluster analysis until 2050. The simulated results project is a slight increase in energy consumption in Europe compared to the other regions under study. The most significant increase in energy consumption is expected in the Middle East. The research indicates the risk of exceeding the energy consumption volume, compared to the forecasts of international organizations that were formed in previous years. In another study [7], the authors investigated the consumption of coal up to 2030 using a new hybrid method of WOANFIS (whale optimization algorithm and adaptive neurofuzzy inference system). The future global coal consumption was predicted up to 2030 by the proposed method. According to the results, it is possible to evaluate the performance of the WOANFIS method using the MSE (Mean Squared Error), MAE (Mean Absolute Error), STD (error standard deviation), RMSE (Root Mean Squared Error), and correlation coefficient (R2) between the output of the WOANFIS and the actual dataset. The global coal consumption can be successfully evaluated.
In the literature, there is also some research on the individual countries’ coal consumption forecasts. Most studies, using different approaches, concern China’s energy, for example [8,9,10,11]. When it comes to other countries, the forecasts of non-renewable energy sources in 2022 are discussed by [12,13] for Turkey, by [14] for Korea and by [15] for India. Referring to countries in the European Union, the authors of [16] analyzed the impact on the economy of Germany of a potential Russian gas shutoff and [17] proposed a way to overcome the dependence for natural gas on Russia. When it comes to Poland, the authors of [18,19,20] wrote about energy policy, ref. [21] analyzed domestic hard-coal sales, ref. [22] discussed the phase out of hard coal, ref. [23] conducted a discourse on strategic reserves in Poland, refs. [24,25,26] studied green scenarios for Poland and [27,28,29] discussed the energy transformation in Poland.
On the other hand, several articles on renewable energy have also been written this year (2022). There are papers on climate policy uncertainty and world renewable energy index volatility forecasting [30], ultra-short-term spatiotemporal forecasting of renewable resources: an attention temporal convolutional network-based approach [31], weather forecasting for renewable energy system [32] and modelling the evolution of wind and solar power infeed forecasts [33]. In reference to photovoltaics, the authors of [34] presented forecasting intra-hour solar photovoltaic energy by assembling wavelet-based time-frequency analysis with deep learning neural networks, ref [35] proposed a hybrid model for renewable energy and load forecasting based on data mining and EWT, ref [36] presented solar and wind power generation forecasts using elastic net in time-varying forecast combinations and [37] showed combining transfer learning and constrained long short-term memory for power generation forecasting of newly constructed photovoltaic plants. For other renewable energy sources, there are articles in the literature on wind energy [33,36,38], hydro energy [39] and other types of renewables [40]. There are also papers from 2022 on the development of renewable energy in the individual countries, such as China [41,42,43], Australia [44], Turkey [45], India [46], Germany [47], Spain [48] and many more. In Poland, the above-mentioned development of capacity in photovoltaics was analyzed by Duda et al. using surveys [49], by Cader et al. using Regional Intelligent Specialization parameters [50] and by Olczak et al. using NPV analyses for rack, different size, different value of azimuth and tilt angle [51,52].
Based on the literature review, it can be claimed that there are many new current predictions and much research about both the global and domestic use of conventional and unconventional resources. The use of individual RES is growing in some countries, but in others, the process of energy transformation, especially decreasing the share of coal energy production, is gradual. With reference to the above-mentioned world political and economic changes, the authors decided to conduct research on the current situation in Poland in the field of renewable energy and coal. Namely, this article describes research on the impact of RES development on the change in the energy generation profile in the case of Poland. The article analyzes the impact of RES on the reduction of CO2 emissions. The paper is divided into 5 sections. Section 3 describes the methodology of the research. Section 4 includes the results of the conducted study. Section 5 summarizes the paper with conclusions.

3. Methodology

The purpose of creating the methodology is to determine how the development of renewable energy sources in Poland (in this case PV sources, which are more predictable than wind sources on the whole-region scale) influences the change in the energy generation profile and thus (with a large reduction in the share of carbon sources) on the reduction of CO2 emissions.
The conducted analysis is based on the historical similarity of the replacement of conventional (carbon) sources by PV by determining in how many cases (%) a specific carbon source will be replaced (Figure 4). It will also allow determination of the reduction of CO2 emissions within the National Power System (NPS) and the demand for hard coal. In the case of demand exceeding the domestic production, the analysis will allow determination of the volume of imports.
The universal access to electricity requires efficient operation of an extensive system for its generation, transmission and distribution. In Poland, over 80% of electricity is generated in thermal power plants (mainly lignite or hard coal), with an increasing share of generation from renewable energy sources. It is still not possible to store a large volume of electricity (excluding pumped storage power plants), which in practice means that at any time the amount of energy produced in power plants must be equal to the energy consumed by consumers. In Polish conditions, this translates into a reduction in electricity production in thermal power plants on sunny and windy days (hours) by replacing their production potentials with RES. Analogically, it works also in opposite conditions: during windless and cloudy days (nights), almost all of the demand is covered by coal power plants (with a small share of hydropower plants, flow and pumped storage, and natural gas and biomass thermal power plants).
For individual energy sources (hard coal, lignite, photovoltaics), important for the analysis, the average emissivity was determined according to Formula (1) as the following:
S E = P P S E E P C P
where:
S E —source emissivity, millions of tonnes CO2/TWh;
P P S E —power plants source emission, based on EU ETS Data, millions of tonnes CO 2 ;
E P C P —energy production on coal power plants, based on ARE Data [53], TWh.
Domestic electricity consumption in 2021 increased by 5.36% per annum and amounted to 174.4 TWh. In the same period, total electricity production increased by 13.97% year on year to 173.58 TWh. Thus, the balance of international exchange amounted to 0.82 TWh (the majority of imports). In 2021, 93.04 TWh of electricity was produced from hard coal (an increase by 30% year on year), 45.37 TWh from lignite (an increase by 19.5% year on year), 13.37 TWh in gas power plants (decrease by 4%), and in wind farms14.23 TWh (increase by 0.4% year on year).
According to EU ETS data, in 2021 the production of electricity from hard coal resulted in the emission of 82 million tons of CO2 (which, with the production reported by Polskie Sieci Elektroenergetyczne S.A. (PSE) [54,55], gives an average emission of SE at the level of 880 kg CO2/MWh), from lignite 50 million tons of CO2 (SE value 1100 kg CO2/MWh) and emissions caused by electricity production from natural gas 7 million tons of CO2 (525 kg CO2/MWh). On the other hand, according to the Intergovernmental Panel on Climate Change (IPCC) report from 2014 [56], the average equivalent of renewable energy sources (mainly related to their production and maintenance) is 11 kg CO2/MWh for wind turbines and 44 kg CO2/MWh for photovoltaic panels. This value may be slightly different for specific installations, which results, among others, from their productivity, location or investment scale [57].
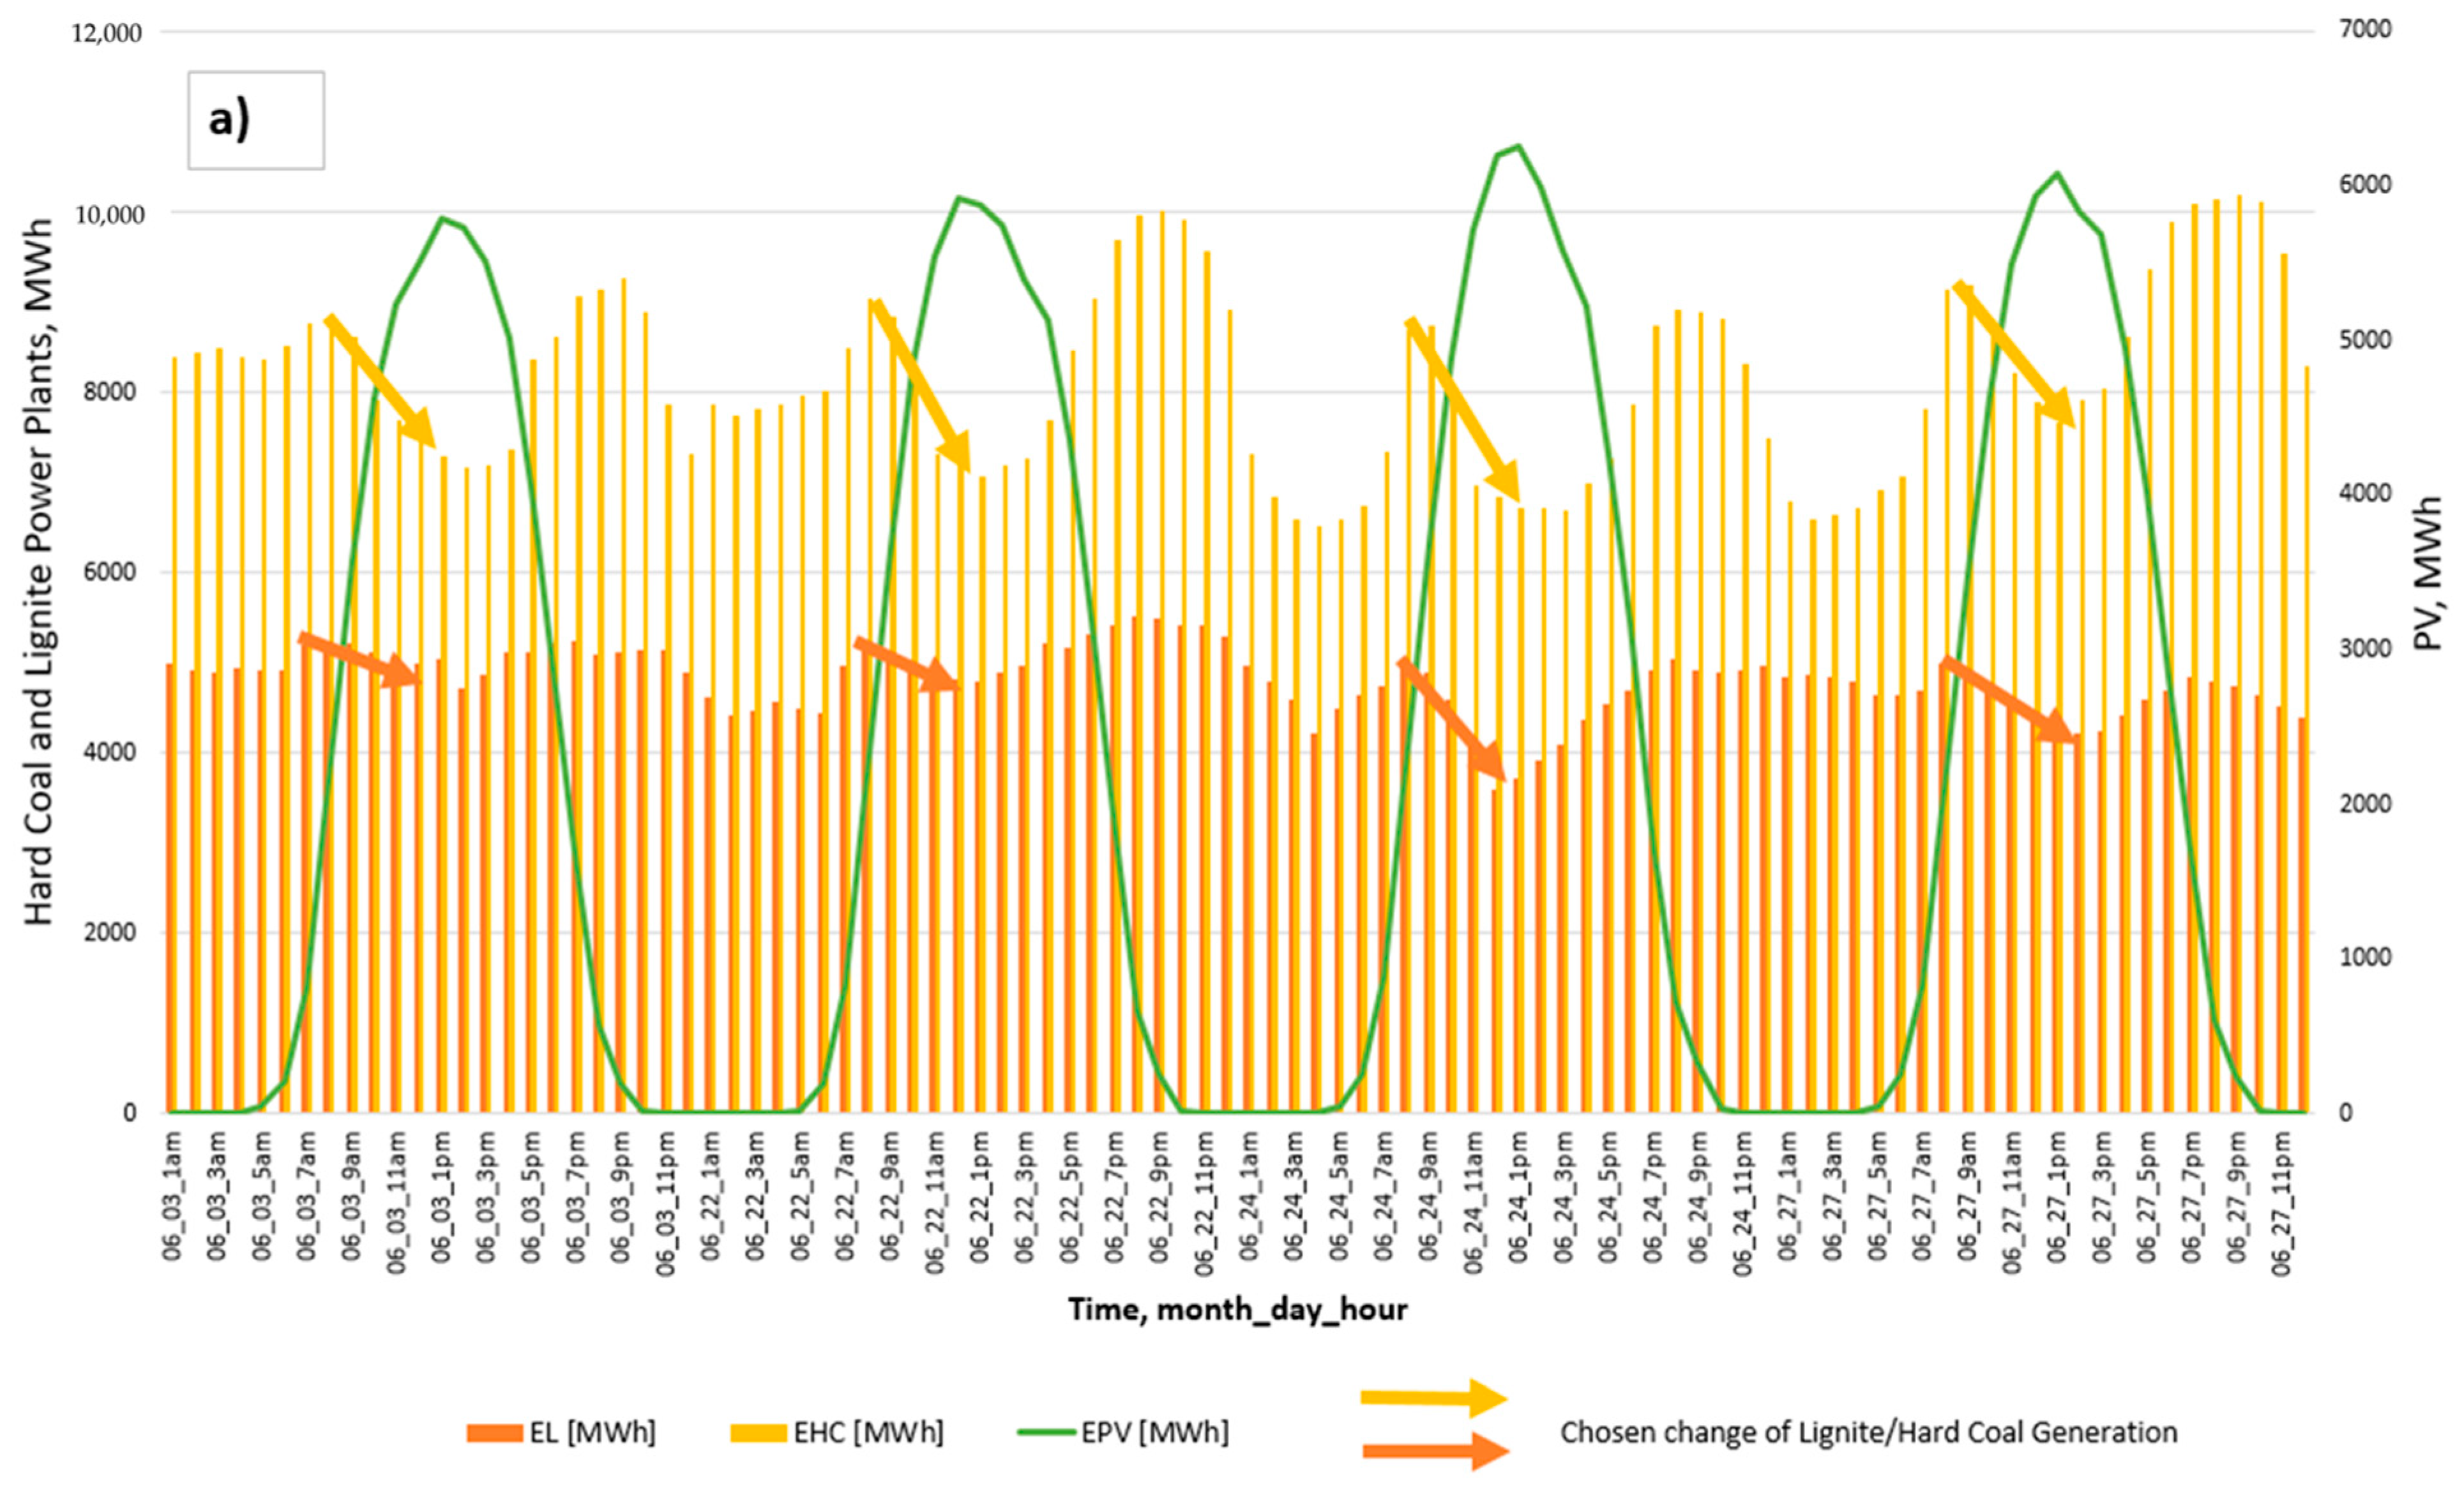
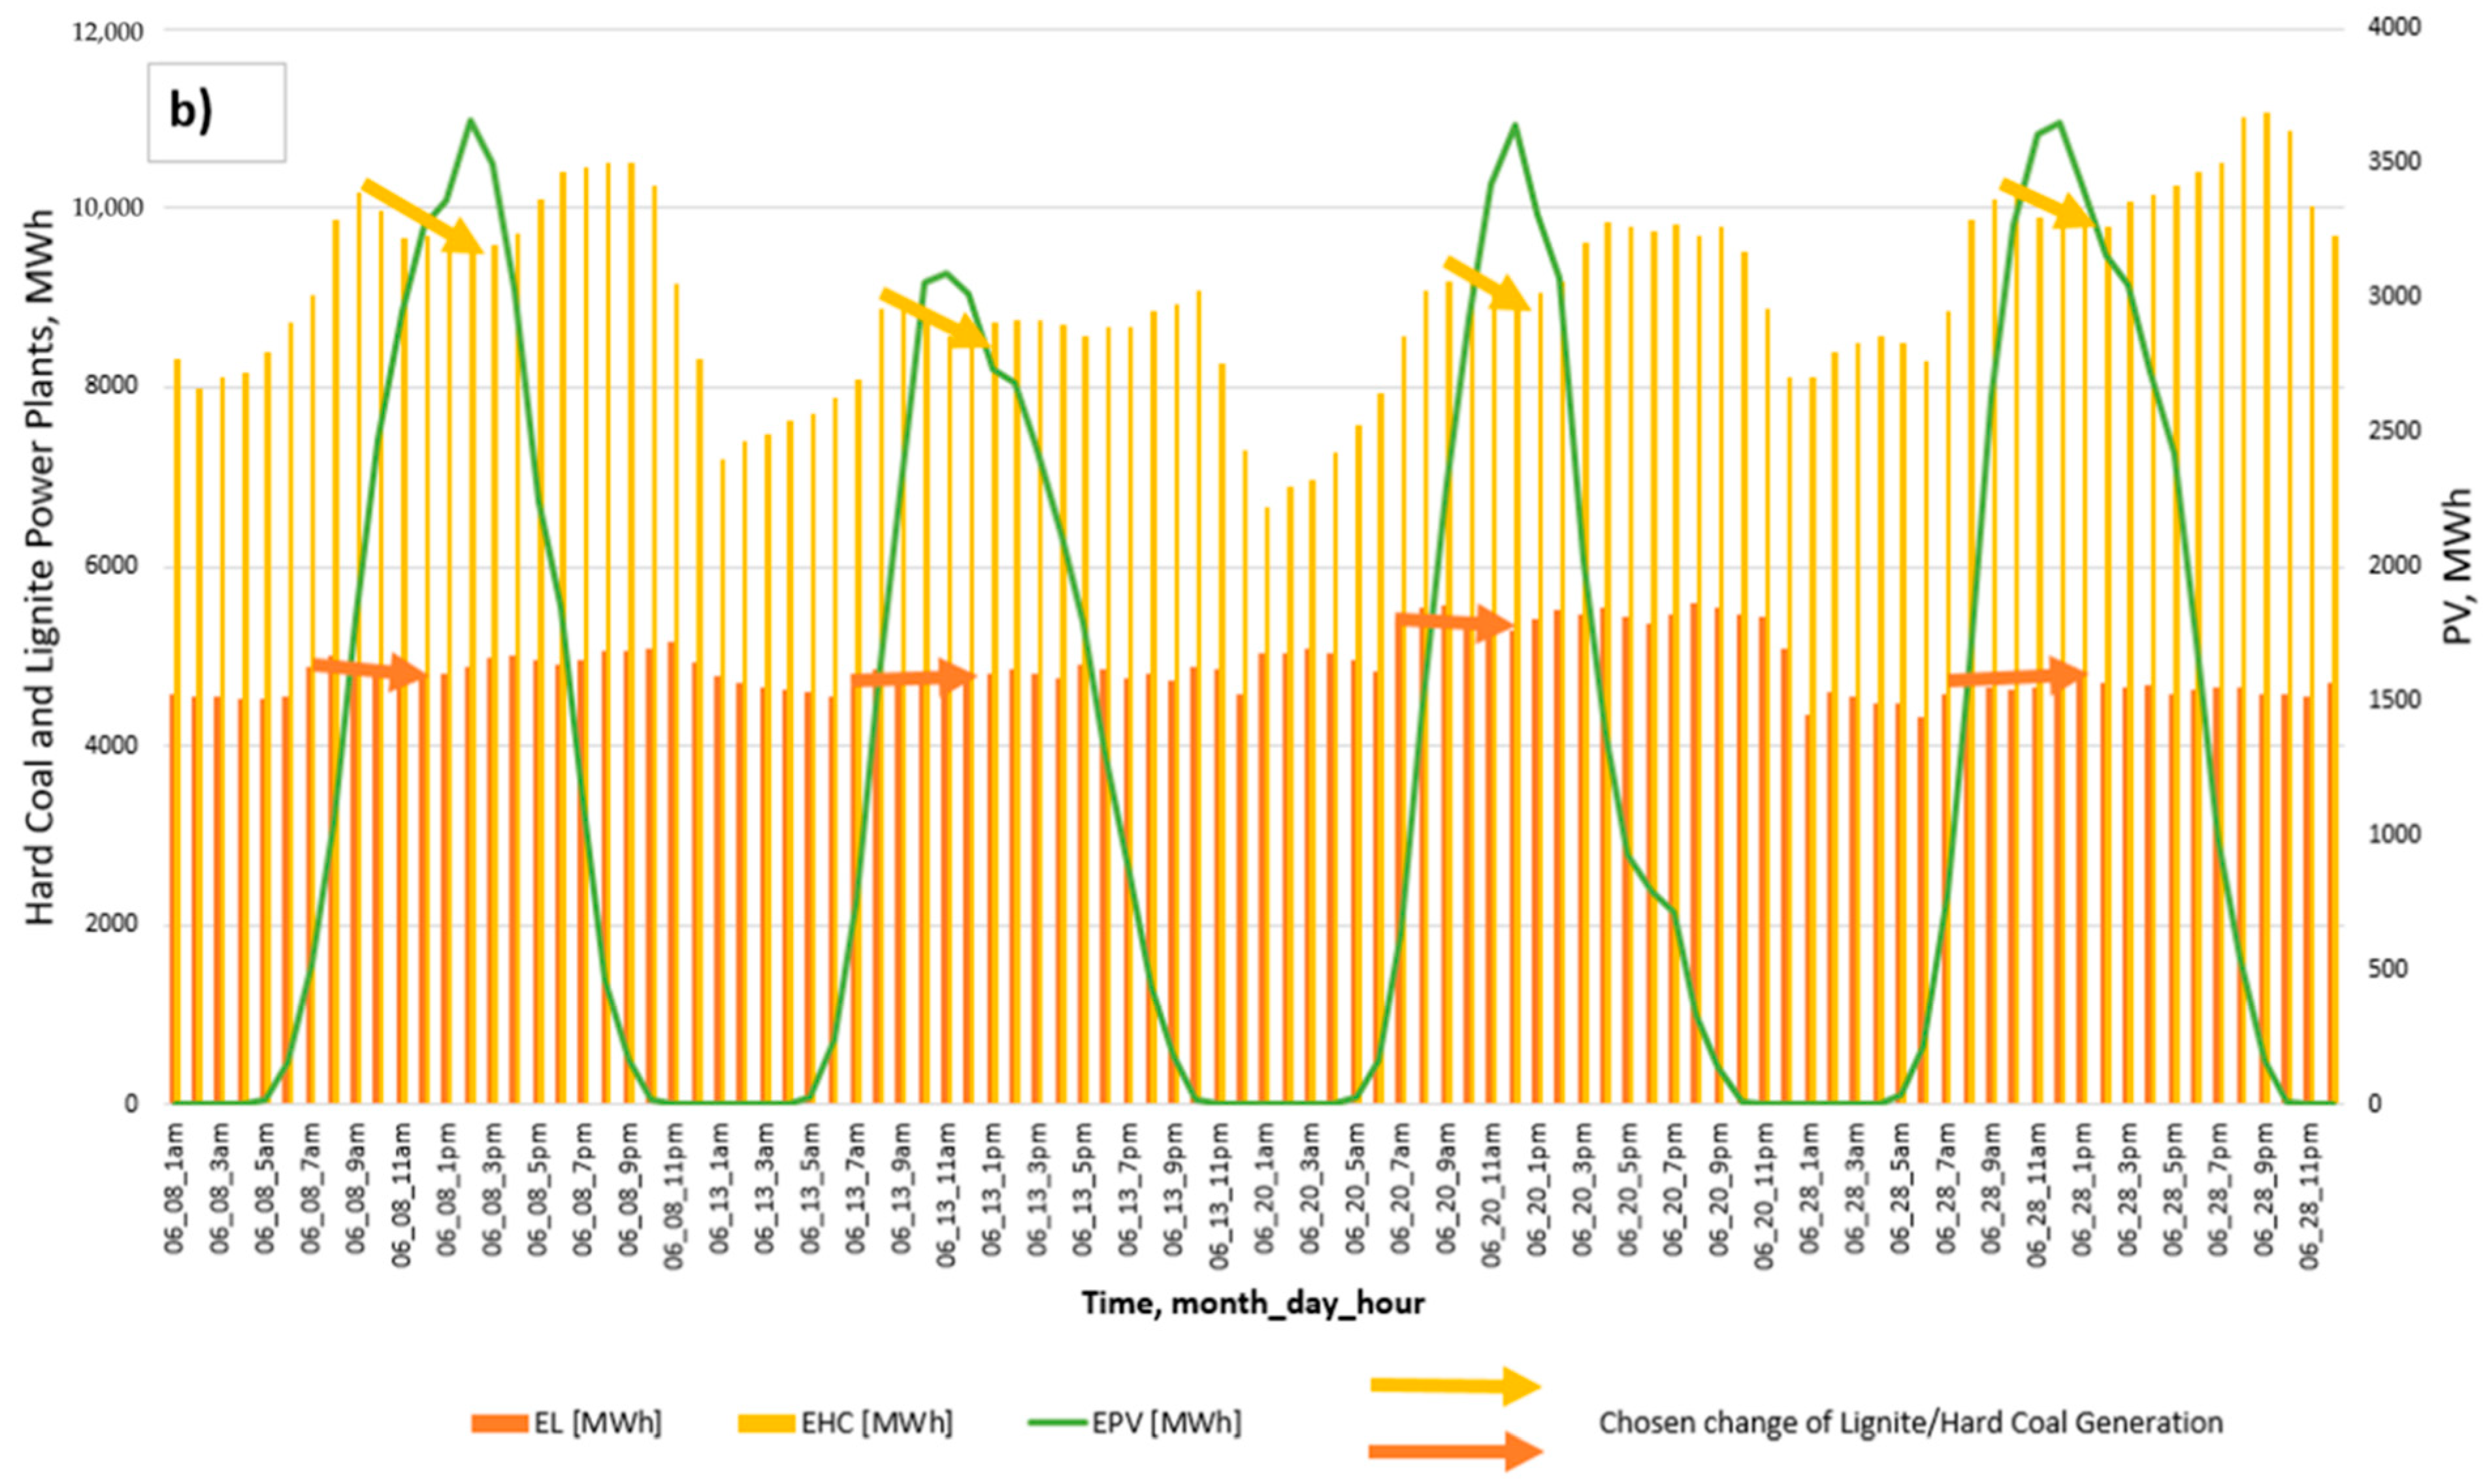
The figure below (Figure 5) shows the impact of PV electricity production on the change in energy production from conventional sources (lignite and hard coal) in the morning power demand peak. For the purposes of describing the phenomenon, four days with the largest and the smallest volume of electricity production (June 2022) from PV were selected. All eight of the selected days were workdays (Monday–Friday). Based on the obtained results, it can be concluded that days with maximum PV production volumes translated into a significant decrease in production in hard-coal power plants (−15.5%) and a relatively lower decrease in lignite power plants (−10.8%) by comparing the difference in generation between 8 am and 12 pm. In the case of the four days with the lowest PV production, these drops were much smaller and amounted to −3.61% for hard coal; for lignite they reached an average of only −0.17%. On this basis, it can be concluded that the high values of electricity production from PV displace the generation in coal-fired units in the first place, and to a lesser extent in those fired with lignite. This is due to two main factors: first, the problem with lignite storage (work in a continuous system: excavator–conveyor belt–power plant) and management pressure to limit the consumption of hard coal due to the cessation of its import from Russia.
To estimate changes in the electricity generation profile in Poland, the data provided by PSE—the transmission system operator—were used. These data are aggregated by types of generating units and, in the case of thermal power plants, for specific blocks of these power plants (Table 2).
In the case of renewable sources, the characteristic indicators are the utilization rate of the installed capacity and the self-consumption of the produced energy. In the case of wind energy in Polish conditions, there is practically no self-consumption, which results from its nature and specificity, where large wind turbines are connected to the grid and not to prosumer installations, as in the case of PV. According to data from ARE [58], such pro-consumer photovoltaic installations connected to the grid at the end of May 2022 in Poland were 1,104,597, with an average installed power of 7.4 kWp. The average annual self-consumption coefficient for these prosumers is estimated at the level of approx. 37% of the energy produced in the PV installation. Formula (2) presents the monthly installed capacity utilization ratio for photovoltaic and wind sources.
P U F ( m ) = M P n ( m ) I P n ( m ) · d ( m ) · 24
where:
PUF—monthly power utilization factor, %;
m—month of analyses;
M P n —monthly production, based on PSE Data, GWh;
I P n —installed power source, based on ARE Data, GWp;
n—technology (PV, HC or L);
d —number of days in the month.
Since 1 April 2022, the method of settlement for photovoltaic prosumers has changed in Poland. Until then, the electricity produced by prosumers was settled in the discount system. The prosumer could return a surplus to the grid and, if necessary, collect up to 80% of its volume, so the power grid was de facto for him an energy store [57,59,60]. After the April amendment to the RES Act, new prosumers make their settlements in the net-billing system. The generated electricity is sold to the grid, and its shortage is purchased by the prosumer at market prices. The proposed changes will have a significant impact on the reduction of prosumer investments in photovoltaics in the coming months. The issue of wind-energy development is different, as it has been significantly limited since May 2016 due to the introduction of the so-called “10H” rule. Pursuant to the Act, a wind farm could not be built at a distance less than 10 times the height of the turbine (including raised blades) from residential buildings, forms of nature protection and forest complexes. Currently (June 2022), there are works on new regulations, according to which the Local Development Plan will be able to define a distance of a wind farm from a residential building, other than that determined by the “10H” rule, but with an absolute minimum distance of 500 m.
For the purposes of the forecast for the development of photovoltaic sources, it was assumed that by the end of the year, photovoltaics will grow by a constant volume (estimated on the basis of the average increase in installed capacity after the introduced changes to the RES Act). According to a report by the U.S. Department of Energy, the investment time in a new onshore wind farm ranges from 2 to 4 years [61]. Therefore, it was assumed that the changes will not translate into an increase in investments in this segment by the end of the year; an increase of 5.1% estimated based on data from the last 6 months was assumed for the calculation. The proposed forecast of the installed capacity is presented in the table below (Table 3).
The utilization factor for the installed capacity in the following months, based on historical data, and the auto-consumption ratio (36% for PV and 0% for wind energy), was also assumed.
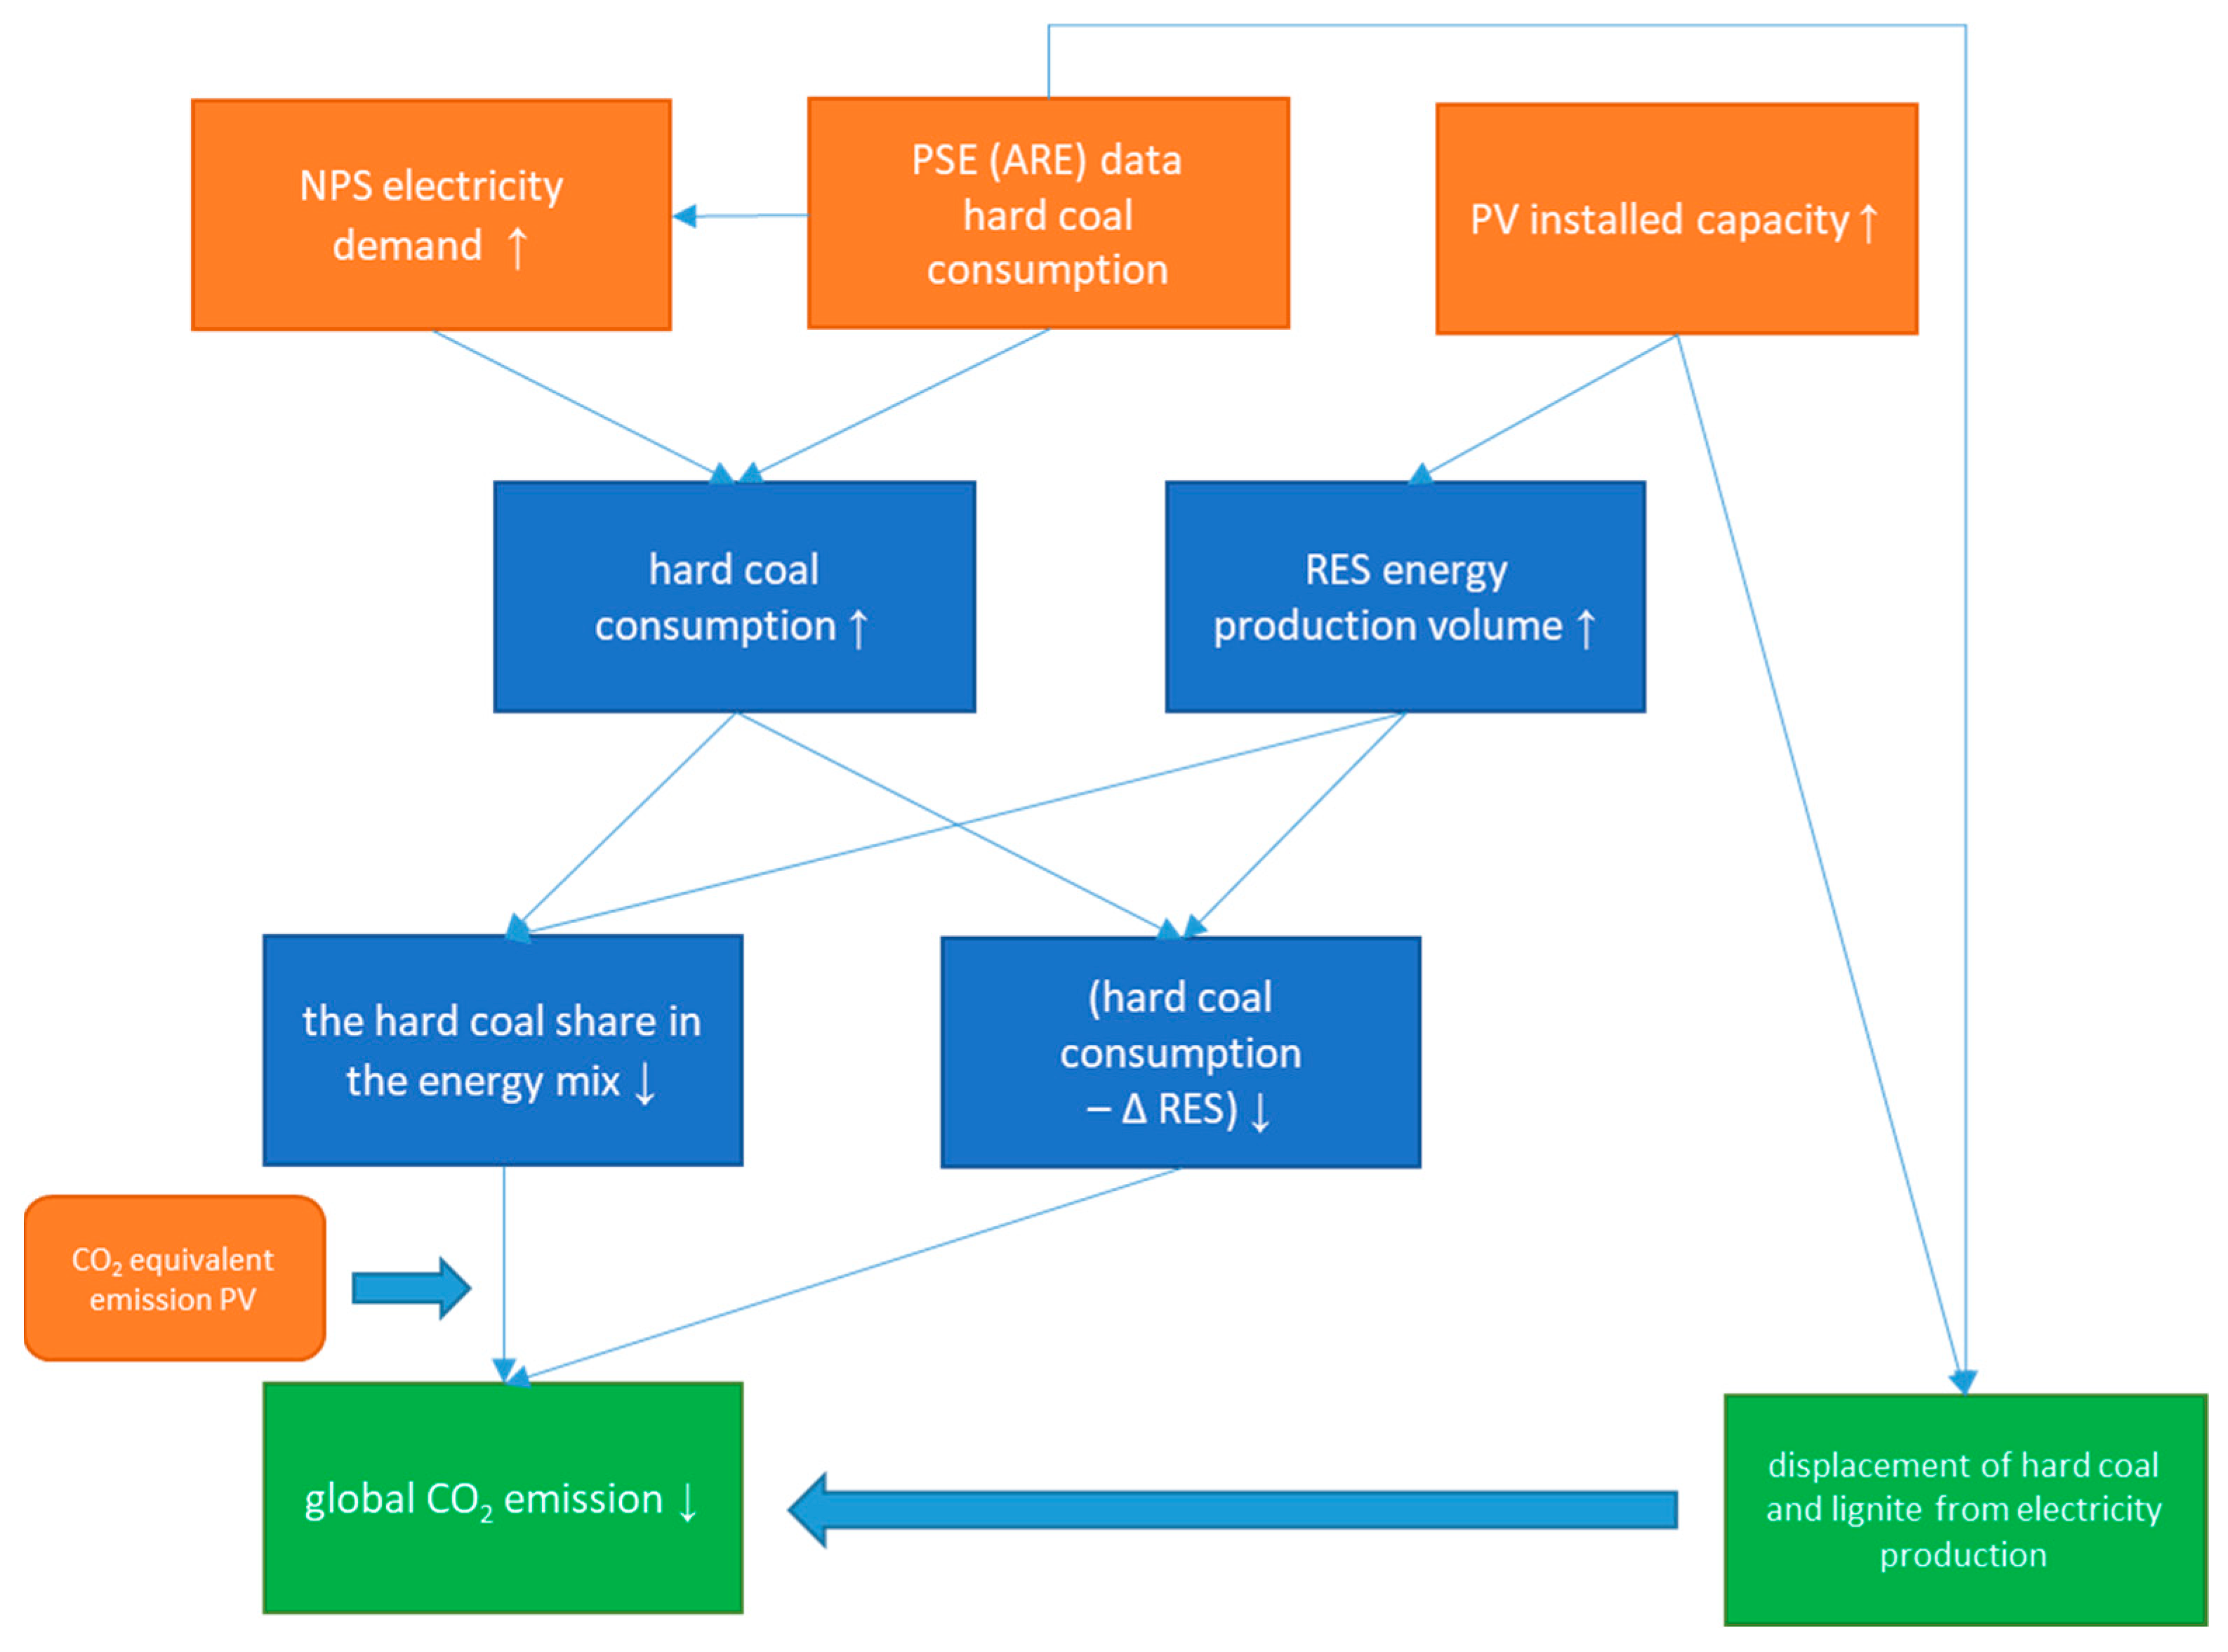
To determine the impact of photovoltaic sources on the reduction of generation in conventional sources (hard-coal and lignite power plants), the Replacement Indicator-REP was formulated. The algorithm of its creation is presented in the figure below (Figure 6).
For its estimation, data on energy production according to generation technology from 2021 and the first half of 2022 were analyzed. The main assumption of its occurrence is the simultaneous hourly decrease in generation in coal-fired and lignite-fired units with an increase in production in PV installations. All hours of the day were analyzed, although over 96% of the above conditions were met between 8 am and 2 pm; it was expected due to the increase in production in PV installations, and it also coincides with the morning peak in electricity demand. The hourly replacement rate (REP) was then aggregated into daily, monthly (3) and annual (4) values.
R E P ( m ) = i = 1 n d R E P ( d )
where:
REP(m)—monthly replacement factor, GWh;
REP(d)—daily replacement factor, GWh;
nd—number of days in the month.
R E P ( y ) = i = 1 12 R E P ( m )
where:
REP(y)—yearly replacement factor, GWh;
REP(m)—daily replacement factor, GWh.
To estimate the change in the profile of electricity generation by renewable energy sources (in that case PV) of specific conventional sources, coefficients for replacing the volume of electricity production in lignite and hard-coal power plants were introduced into the methodology (Equations (5) and (6)).
R E P V ( L ) = Δ P V · S L G
where:
R E P V ( L ) —replaced volume of electrical production on lignite power plants, GWh;
Δ P V —projected increase PV in energy production in 2022, TWh;
S L G —Share of Lignite Generation Replacement (Equation (7)), %.
R E P V ( H C ) = Δ P V · S H C G
where:
R E P V ( H C ) —replaced volume of electrical production on hard-coal power plants, GWh;
Δ P V —projected increase PV in energy production in 2022, TWh;
S H C G —Share of Hard Coal Generation Replacement (Equation (8)), %.
S L G = Δ E L R E P
where:
SLG—share of Lignite Generation Replacement, %;
Δ E L —energy generation difference on Lignite Power Plants (see Figure 6), GWh;
R E P —replacement factor, GWh.
S H C G = Δ E H C R E P
where:
SHCG—share of Hard Coal Generation Replacement, %;
Δ E H C —energy generation difference on Hard Coal Power Plants (see Figure 6), GWh;
R E P —replacement factor, GWh.
C C U P = F C P E C P
where:
CCUP—coal consumption per unit of power, millions of tonnes/TWh;
F C —fired coal, based on ARE Data, millions of tonnes;
P E C P —produced energy from coal plant, based on PSE Data, TWh.
In 2020, 70.12 TWh was produced from 32.2 million Mg of hard coal. Based on these data, 0.46 million Mg of hard coal should be burned for the production of 1 TWh of electricity. The remaining part of the hard-coal volume (power coal—a total of 21 million Mg) was used for heat production in combined heat and power plants and by other domestic recipients, mainly for heating single-family houses and food production. In the same year, 34.42 TWh was produced from 45.9 million Mg of lignite, which gives 1 TWh = 1.33 million Mg of lignite.
According to PSE data, 4.616 TWh from photovoltaics was delivered to the grid in 2021. In the period from 1 January 2021 to 30 June 2021, PV delivered 2329 TWh to the grid, and in the analogical period of 2022 almost twice as much, i.e., 4.599 TWh.

4. Results

Development of RES in Poland

The table below (Table 4) presents the aggregated REP for the subsequent months of 2021 and the first half of 2022. In 2021, the annual REP replacement factor was 145.1 GWh and described 3.1% of all PV generation that year. However, in the first half of 2022, REP already amounted to 172.4 GWh and accounted for 3.7% of all PV production.
It should be mentioned here that despite only 3.7% of the description of the entire PV production, REP explains the share of replacing individual sources (hard coal vs. lignite) with electricity production from PV installations. In the absence of such generation in the Polish power system, the only solution is to increase production from conventional sources (mainly thermal sources fired with hard coal and lignite). There is also a potential for importing energy from abroad, although it is limited by the possibilities of transmission networks.
The chart below (Figure 7) shows the installed capacity utilization factor (PUF, Equation (2)) in photovoltaics and wind turbines in 2019–2022, with data for photovoltaics from April 2020 to June 2022.
In the period of January 2019–June 2022, the aggregated annual coefficient of utilization of the installed capacity (PUF) for PV sources was 12.7%, and for wind energy it was 28.2%.
Applying the previously presented forecast of the installed capacity and the utilization factor of the installed capacity in 2022, the PV should produce 10.03 TWh, which means an increase of 5.414 TWh (∆PV) year on year, assuming the unchanged share in the replacement of hard-coal production in relation to lignite (60.2% to 39.8%) until the end of the year. The increase in the volume of PV energy will reduce the consumption of hard coal in the commercial power industry by approximately 1.5 million Mg and 2.87 million Mg of lignite.
Using the Formula (10) and the aforementioned unit emissivity, the total emissivity of coal sources, which according to the forecast will be replaced in 2022 by production from PV installations, was calculated.
E m C O 2 = S E · R E P V ( n )
where:
E m C O 2 —emission of CO2, millions of tonnes;
S E —source emissivity, millions of tonnes CO2/TWh;
R E P V ( n ) —replaced volume of electrical production, TWh.
Based on the increase in photovoltaic energy production (ΔPV), calculated year-on-year, the CO2 emission reduction from hard coal would be 2.87 million Mg CO2 (from the production of 3.260 TWh of electricity), while from lignite the emission reduction would be 2.37 million Mg CO2 (based on the production of 2.154 TWh of electricity). With the unit emission (SE) of 44 kg CO2/MWh for photovoltaic installations, this reduces the total emission by 5 million Mg CO2 per year. This means that the value of the real coefficient of CO2 emissions reduction through the production of energy from photovoltaics in Poland in 2022 was 0.923 Mg CO2/MWh. It is a higher value than the official reduction emission factor for renewable energy in Poland (0.78 Mg CO2/MWh).
The practical value of the research is to determine the methodology and real values concerning the energy replaced by photovoltaic sources. This can be used to determine the future demand for fossil fuels and plan the development of photovoltaic sources on a national scale.

5. Conclusions

The article analyzes the market of hard coal used to generate electricity in utility power plants and combined heat and power plants in Poland. In 2020, 32.2 million Mg of hard coal was used to produce electricity, of which approximately 1 million Mg was imported from Russia. Last year, there was a significant—41%—increase in the installed capacity in RES (from 14,203 MWp to 20,060 MWp). The highest increase was recorded in PV installations (93.5% year on year), most of which were prosumer installations. Based, among others, on data from the EU ETS, the emissions of conventional coal power plants in Poland were analyzed and compared with the unit emissions (SE, tonnes CO2/TWh) of renewable sources.
A proprietary methodology for determining the replacement of specific conventional sources by an increase in installed capacity in PV installations was developed. Based on the prepared forecast, it was determined that by the end of the year, the installed capacity in PV will reach the level of 11.2 GWp (in wind energy it will be 7.9 GWp). Based on the forecasts of PV generation and electricity consumption (as well as the international trade balance), it can be claimed that this will allow replacing (reduce consumption) about 1.5 million Mg of hard coal and 2.87 million Mg of lignite. Limiting this volume of hard coal and lignite will also reduce CO2 emissions in the entire NPS by 5.24 million Mg in 2022. The real CO2 emission reduction factor for PV energy production in 2022 was obtained as 0.923 Mg CO2/MWh.
The limitations of the study (method) are the following:
  • The developed method can be used in the case of a limited share of energy production from RES among other technologies. The value of the instantaneous energy produced from RES cannot exceed or be equal to the value of energy consumption (in such cases, a part of energy production from RES would be lost);
  • The method applies only to sources that are significantly more emissive (e.g., in terms of CO2) than those proposed, e.g., it cannot be used to analyze the dependence of displacement of various types of technologies among RES.
In addition, the projected increase in wind turbine electricity production (~4 TWh) will also contribute to the reduction of CO2 emissions in Poland. This will constitute the direction of further research to estimate the specific conventional sources that will be replaced by wind energy and, consequently, the volume of CO2 emission reduction.

Author Contributions

Conceptualization, J.K. and P.O.; methodology, J.K., M.S. and P.O.; software, M.S. and K.S.; validation, P.O., M.S. and K.S.; formal analysis, J.K. and K.S.; investigation, J.K., P.O., M.S. and K.S.; resources, J.K., P.O., M.S. and K.S.; data curation, J.K.; writing—original draft preparation, J.K. and K.S.; writing—review and editing, M.S. and K.S.; visualization, J.K and M.S.; supervision, J.K.; project administration, J.K. and K.S.; funding acquisition, M.S. and K.S. All authors have read and agreed to the published version of the manuscript.

Funding

This publication was funded by Silesian University of Technology, Department of Production Engineering, Faculty of Organization and Management, grant number BK-288/ROZ3/2022/(13/030/BK_22/0070).

Institutional Review Board Statement

Not applicable.

Informed Consent Statement

Not applicable.

Data Availability Statement

Not applicable.

Conflicts of Interest

The authors declare no conflict of interest.

References

  1. Statistical Review of World Energy. Statistical Review of World Energy, 70th ed.; BP p.I.c.: London, UK, 2021. [Google Scholar]
  2. Agencja Rynku Energii, S.A. Informacja Statystyczna o Energii Elektrycznej. Available online: https://www.are.waw.pl/badania-statystyczne/wynikowe-informacje-statystyczne/publikacje-miesieczne#informacja-statystyczna-o-energii-elektrycznej (accessed on 2 August 2022).
  3. Kaczmarzewski, S.; Matuszewska, D.; Sołtysik, M. Analysis of Selected Service Industries in Terms of the Use of Photovoltaics before and during the COVID-19 Pandemic. Energies 2022, 15, 188. [Google Scholar] [CrossRef]
  4. Raheem, I.; Mubarak, N.M.; Karri, R.R.; Manoj, T.; Ibrahim, S.M.; Mazari, S.A.; Nizamuddin, S. Forecasting of energy consumption by G20 countries using an adjacent accumulation grey model. Sci. Rep. 2022, 12, 1–23. [Google Scholar] [CrossRef]
  5. Tong, M.; Dong, J.; Luo, X.; Yin, D.; Duan, H. Coal consumption forecasting using an optimized grey model: The case of the world’s top three coal consumers. Energy 2022, 242, 122786. [Google Scholar] [CrossRef]
  6. Hajiyev, N.; Abdimomynova, A.; Trukhan, D. Global and local aspects of world energy consumption: Forecast and risks. Proc. Inst. Civ. Eng. 2022, 1–32. [Google Scholar] [CrossRef]
  7. Jalaee, M.S.; GhasemiNejad, A.; Jalaee, S.A.; Amani Zarin, N.; Derakhshani, R. A Novel Hybrid Artificial Intelligence Approach to the Future of Global Coal Consumption Using Whale Optimization Algorithm and Adaptive Neuro-Fuzzy Inference System. Energies 2022, 15, 2578. [Google Scholar] [CrossRef]
  8. Duan, H.; Luo, X. A novel multivariable grey prediction model and its application in forecasting coal consumption. ISA Trans. 2022, 120, 110–127. [Google Scholar] [CrossRef]
  9. Wang, X. Research on the prediction of per capita coal consumption based on the ARIMA–BP combined model. Energy Rep. 2022, 8, 285–294. [Google Scholar] [CrossRef]
  10. Wang, Q.; Zhang, F.; Li, R.; Li, L. Forecasting China’s energy demand post-COVID-19 pandemic: Insights from energy type differences and regional differences. Energy Strateg. Rev. 2022, 42, 100881. [Google Scholar] [CrossRef]
  11. Wu, W.-Z.; Hu, Z.; Qi, Q.; Zhang, T. An MPA-based optimized grey Bernoulli model for China’s petroleum consumption forecasting. Complex Intell. Syst. 2022, 1–15. [Google Scholar] [CrossRef]
  12. Demircioğlu, M.; Eşİyok, S. Energy consumption forecast of Turkey using artificial neural networks from a sustainability perspective. Int. J. Sustain. Energy 2022, 1–15. [Google Scholar] [CrossRef]
  13. Seker, M.; Karta, N.U.; Karadirek, S.; Gulludag, C.B. The application of different optimization techniques and Artificial Neural Networks (ANN) for coal-consumption forecasting: A case study. Gospod. Surowcami Miner. Resour. Manag. 2022, 38, 77–111. [Google Scholar]
  14. Shin, S.-Y.; Woo, H.-G. Energy Consumption Forecasting in Korea Using Machine Learning Algorithms. Energies 2022, 15, 4880. [Google Scholar] [CrossRef]
  15. Pradeep, K.; Likhita, T. Machine-Learning Based Approach to Predict Energy Consumption of India States. In Proceedings of the 2022 6th International Conference on Computing Methodologies and Communication (ICCMC), Erode, India, 29–31 March 2022; pp. 1153–1156. [Google Scholar]
  16. Lan, T.; Sher, G.; Zhou, J. The Economic Impacts on Germany of a Potential Russian Gas Shutoff; International Monetary Fund: Washington, DC, USA, 2022; p. 144. [Google Scholar]
  17. Halser, C.; Paraschiv, F. Pathways to Overcoming Natural Gas Dependency on Russia—The German Case. Energies 2022, 15, 4939. [Google Scholar] [CrossRef]
  18. Malec, M. The prospects for decarbonisation in the context of reported resources and energy policy goals: The case of Poland. Energy Policy 2022, 161, 112763. [Google Scholar] [CrossRef]
  19. Kaczmarek, J. The Balance of Outlays and Effects of Restructuring Hard Coal Mining Companies in Terms of Energy Policy of Poland PEP 2040. Energies 2022, 15, 1853. [Google Scholar] [CrossRef]
  20. Stecuła, K.; Brodny, J. Role and meaning of coal mining in poland. In Proceedings of the International Multidisciplinary Scientific GeoConference Surveying Geology and Mining Ecology Management, SGEM, Albena, Bulgaria, 30 June 2018; Volume 18, pp. 801–808. [Google Scholar]
  21. Rybak, A.; Włodarczyk, E. Impact of Sustainable Development and Environmental Protection on the Volume of Domestic Hard Coal Sales in Poland. Energies 2022, 15, 443. [Google Scholar] [CrossRef]
  22. Sokołowski, J.; Frankowski, J.; Mazurkiewicz, J.; Lewandowski, P. Hard coal phase-out and the labour market transition pathways: The case of Poland. Environ. Innov. Soc. Transit. 2022, 43, 80–98. [Google Scholar] [CrossRef]
  23. Tokarski, S. Bloki 200 plus Rezerwa strategiczna, czy schyłek eksploatacji? Nowa Energ. 2022, 83, 42–45. [Google Scholar]
  24. Dyczko, A.; Jagodziński, A.M.; Woźniak, G. Green Scenarios: Mining Industry Responses to Environmental Challenges of the Anthropocene Epoch: International Mining Forum 2021; CRC Press: Boca Raton, FL, USA, 2022; ISBN 1000684393. [Google Scholar]
  25. Dyczko, A.; Ryś, K.; Radosz, Ł.; Woźniak, G. Current Reclamation Practices and their Successfulness. In Green Scenarios: Mining Industry Responses to Environmental Challenges of the Anthropocene Epoch; CRC Press: Boca Raton, FL, USA, 2022; pp. 361–372. ISBN 100327160X. [Google Scholar]
  26. Stecuła, K.; Brodny, J. Decision-making possibilities in the field of excavated material quality shaping in terms of environmental protection, I. E. how to be greener in mining. In Proceedings of the International Multidisciplinary Scientific GeoConference Surveying Geology and Mining Ecology Management, SGEM, Albena, Bulgaria, 30 June 2018; Volume 18, pp. 243–250. [Google Scholar]
  27. Dyczko, A.; Kamiński, P.; Stecuła, K.; Prostański, D.; Kopacz, M.; Kowol, D. Thermal and mechanical energy storage as a chance for energy transformation in Poland. Polityka Energ. 2021, 24, 43–60. [Google Scholar] [CrossRef]
  28. Kulpa, J.; Kamiński, P.; Stecuła, K.; Prostański, D.; Matusiak, P.; Kowol, D.; Kopacz, M.; Olczak, P. Technical and Economic Aspects of Electric Energy Storage in a Mine Shaft—Budryk Case Study. Energies 2021, 14, 7337. [Google Scholar] [CrossRef]
  29. Tokarski, S. Transformacja energetyczna–zapotrzebowanie na źródła energii pierwotnej w perspektywie 2040 r. Co się zmieni po wybuchu wojny na Ukrainie? Nowa Energ. 2022, 2, 10–16. [Google Scholar]
  30. Liang, C.; Umar, M.; Ma, F.; Huynh, T.L.D. Climate policy uncertainty and world renewable energy index volatility forecasting. Technol. Forecast. Soc. Change 2022, 182, 121810. [Google Scholar] [CrossRef]
  31. Liang, J.; Tang, W. Ultra-Short-Term Spatiotemporal Forecasting of Renewable Resources: An Attention Temporal Convolutional Network Based Approach. IEEE Trans. Smart Grid 2022, 13, 1. [Google Scholar] [CrossRef]
  32. Meenal, R.; Binu, D.; Ramya, K.C.; Michael, P.A.; Vinoth Kumar, K.; Rajasekaran, E.; Sangeetha, B. Weather forecasting for renewable energy system: A review. Arch. Comput. Methods Eng. 2022, 29, 2875–2891. [Google Scholar] [CrossRef]
  33. Li, W.; Paraschiv, F. Modelling the evolution of wind and solar power infeed forecasts. J. Commod. Mark. 2022, 25, 100189. [Google Scholar] [CrossRef]
  34. Rodríguez, F.; Azcárate, I.; Vadillo, J.; Galarza, A. Forecasting intra-hour solar photovoltaic energy by assembling wavelet based time-frequency analysis with deep learning neural networks. Int. J. Electr. Power Energy Syst. 2022, 137, 107777. [Google Scholar] [CrossRef]
  35. Zhang, J.; Zhang, Q.; Li, G.; Wu, J.; Wang, C.; Li, Z. Hybrid Model for Renewable Energy and Load Forecasting Based on Data Mining and EWT. J. Electr. Eng. Technol. 2022, 17, 1517–1532. [Google Scholar] [CrossRef]
  36. Nikodinoska, D.; Käso, M.; Müsgens, F. Solar and wind power generation forecasts using elastic net in time-varying forecast combinations. Appl. Energy 2022, 306, 117983. [Google Scholar] [CrossRef]
  37. Luo, X.; Zhang, D.; Zhu, X. Combining transfer learning and constrained long short-term memory for power generation forecasting of newly-constructed photovoltaic plants. Renew. Energy 2022, 185, 1062–1077. [Google Scholar] [CrossRef]
  38. Shirzadi, N.; Nasiri, F.; El-Bayeh, C.; Eicker, U. Optimal dispatching of renewable energy-based urban microgrids using a deep learning approach for electrical load and wind power forecasting. Int. J. Energy Res. 2022, 46, 3173–3188. [Google Scholar] [CrossRef]
  39. Malhan, P.; Mittal, M. A novel ensemble model for long-term forecasting of wind and hydro power generation. Energy Convers. Manag. 2022, 251, 114983. [Google Scholar] [CrossRef]
  40. Khaleel, M.M.; Alsharif, A.; Imbayah, I.I.K. Renewable Energy Technologies: Recent Advances and Future Predictions. African J. Adv. Pure Appl. Sci. 2022, 1, 58–64. [Google Scholar]
  41. Mastoi, M.S.; Munir, H.M.; Zhuang, S.; Hassan, M.; Usman, M.; Alahmadi, A.; Alamri, B. A Comprehensive Analysis of the Power Demand–Supply Situation, Electricity Usage Patterns, and the Recent Development of Renewable Energy in China. Sustainability 2022, 14, 3391. [Google Scholar] [CrossRef]
  42. Abbasi, K.R.; Shahbaz, M.; Zhang, J.; Irfan, M.; Alvarado, R. Analyze the environmental sustainability factors of China: The role of fossil fuel energy and renewable energy. Renew. Energy 2022, 187, 390–402. [Google Scholar] [CrossRef]
  43. Ding, S.; Tao, Z.; Li, R.; Qin, X. A novel seasonal adaptive grey model with the data-restacking technique for monthly renewable energy consumption forecasting. Expert Syst. Appl. 2022, 208, 118115. [Google Scholar] [CrossRef]
  44. Abu-Salih, B.; Wongthongtham, P.; Morrison, G.; Coutinho, K.; Al-Okaily, M.; Huneiti, A. Short-term renewable energy consumption and generation forecasting: A case study of Western Australia. Heliyon 2022, 8, e09152. [Google Scholar] [CrossRef]
  45. Korkmaz, O.; Önöz, B. Modelling the Potential Impacts of Nuclear Energy and Renewables in the Turkish Energy System. Energies 2022, 15, 1392. [Google Scholar] [CrossRef]
  46. Patel, B.G.; Patel, S. Impact of Renewable Energy on Indian Economy: A Review. Infrastruct. Dev. Pract. Policy 2022, 3, 157–163. [Google Scholar]
  47. Basmadjian, R.; Shaafieyoun, A. ARIMA-based Forecasts for the Share of Renewable Energy Sources: The Case Study of Germany. In Proceedings of the 2022 3rd International Conference on Smart Grid and Renewable Energy (SGRE), Doha, Qatar, 20–22 March 2022; pp. 1–6. [Google Scholar]
  48. Lima, M.A.F.B.; Fernández Ramírez, L.M.; Carvalho, P.; Batista, J.G.; Freitas, D.M. A comparison between deep learning and support vector regression techniques applied to solar forecast in Spain. J. Sol. Energy Eng. 2022, 144, 1–12. [Google Scholar] [CrossRef]
  49. Duda, J.; Kusa, R.; Pietruszko, S.; Smol, M.; Suder, M.; Teneta, J.; Wójtowicz, T.; Żdanowicz, T. Development of Roadmap for Photovoltaic Solar Technologies and Market in Poland. Energies 2022, 15, 174. [Google Scholar] [CrossRef]
  50. Cader, J.; Olczak, P.; Koneczna, R. Regional dependencies of interest in the “My Electricity” photovoltaic subsidy program in Poland. Polityka Energ. Energy Policy J. 2021, 24, 97–116. [Google Scholar] [CrossRef]
  51. Olczak, P.; Żelazna, A.; Stecuła, K.; Matuszewska, D.; Lelek, Ł. Environmental and economic analyses of different size photovoltaic installation in Poland. Energy Sustain. Dev. 2022, 70, 160–169. [Google Scholar] [CrossRef]
  52. Olczak, P.; Komorowska, A. An adjustable mounting rack or an additional PV panel? Cost and environmental analysis of a photovoltaic installation on a household: A case study in Poland. Sustain. Energy Technol. Assess. 2021, 47, 101496. [Google Scholar] [CrossRef]
  53. Agencja Rynsku Energii S.A. Statystyka Elektroenergetyki Polskiej. Available online: https://www.are.waw.pl/badania-statystyczne/wynikowe-informacje-statystyczne/publikacje-roczne#statystyka-elektroenergetyki-polskiej (accessed on 5 August 2022).
  54. EMBER. Top 10 EU Emitters All Coal Power Plants in 2021. Available online: https://ember-climate.org/insights/research/top-10-emitters-in-the-eu-ets-2021/ (accessed on 5 August 2022).
  55. European Environmental Agency. EU Emissions Trading System (ETS) Data Viewer. Available online: https://www.eea.europa.eu/data-and-maps/dashboards/emissions-trading-viewer-1 (accessed on 5 August 2022).
  56. Pachauri, R.K.; Meyer, L.A. Climate Change 2014: Synthesis Report; Contribution of Working Groups I, II and III to the Fifth Assessment Report of the Intergovernmental Panel on Climate Change; Intergovernmental Panel on Climate Change: Geneva, Switzerland, 2014. [Google Scholar]
  57. Olczak, P.; Żelazna, A.; Matuszewska, D.; Olek, M. The “My Electricity” Program as One of the Ways to Reduce CO2 Emissions in Poland. Energies 2021, 14, 7679. [Google Scholar] [CrossRef]
  58. Mikroinstalacje w Polsce Stan na 31 Maja 2022 Roku. Available online: http://www.ptpiree.pl/energetyka-w-polsce/energetyka-w-liczbach/mikroinstalacje-w-polsce (accessed on 8 August 2022).
  59. Wróbel, J.; Sołtysik, M.; Rogus, R. Selected elements of the Neighborly Exchange of Energy-Profitability evaluation of the functional model. Polityka Energ. 2019, 22, 53–64. [Google Scholar] [CrossRef]
  60. Zdonek, I.; Tokarski, S.; Mularczyk, A.; Turek, M. Evaluation of the Program Subsidizing Prosumer Photovoltaic Sources in Poland. Energies 2022, 15, 846. [Google Scholar] [CrossRef]
  61. Christol, C.; Oteri, F.; Laurienti, M. Land-Based Wind Energy Siting: A Foundational and Technical Resource; National Renewable Energy Lab. (NREL): Golden, CO, USA, 2021.
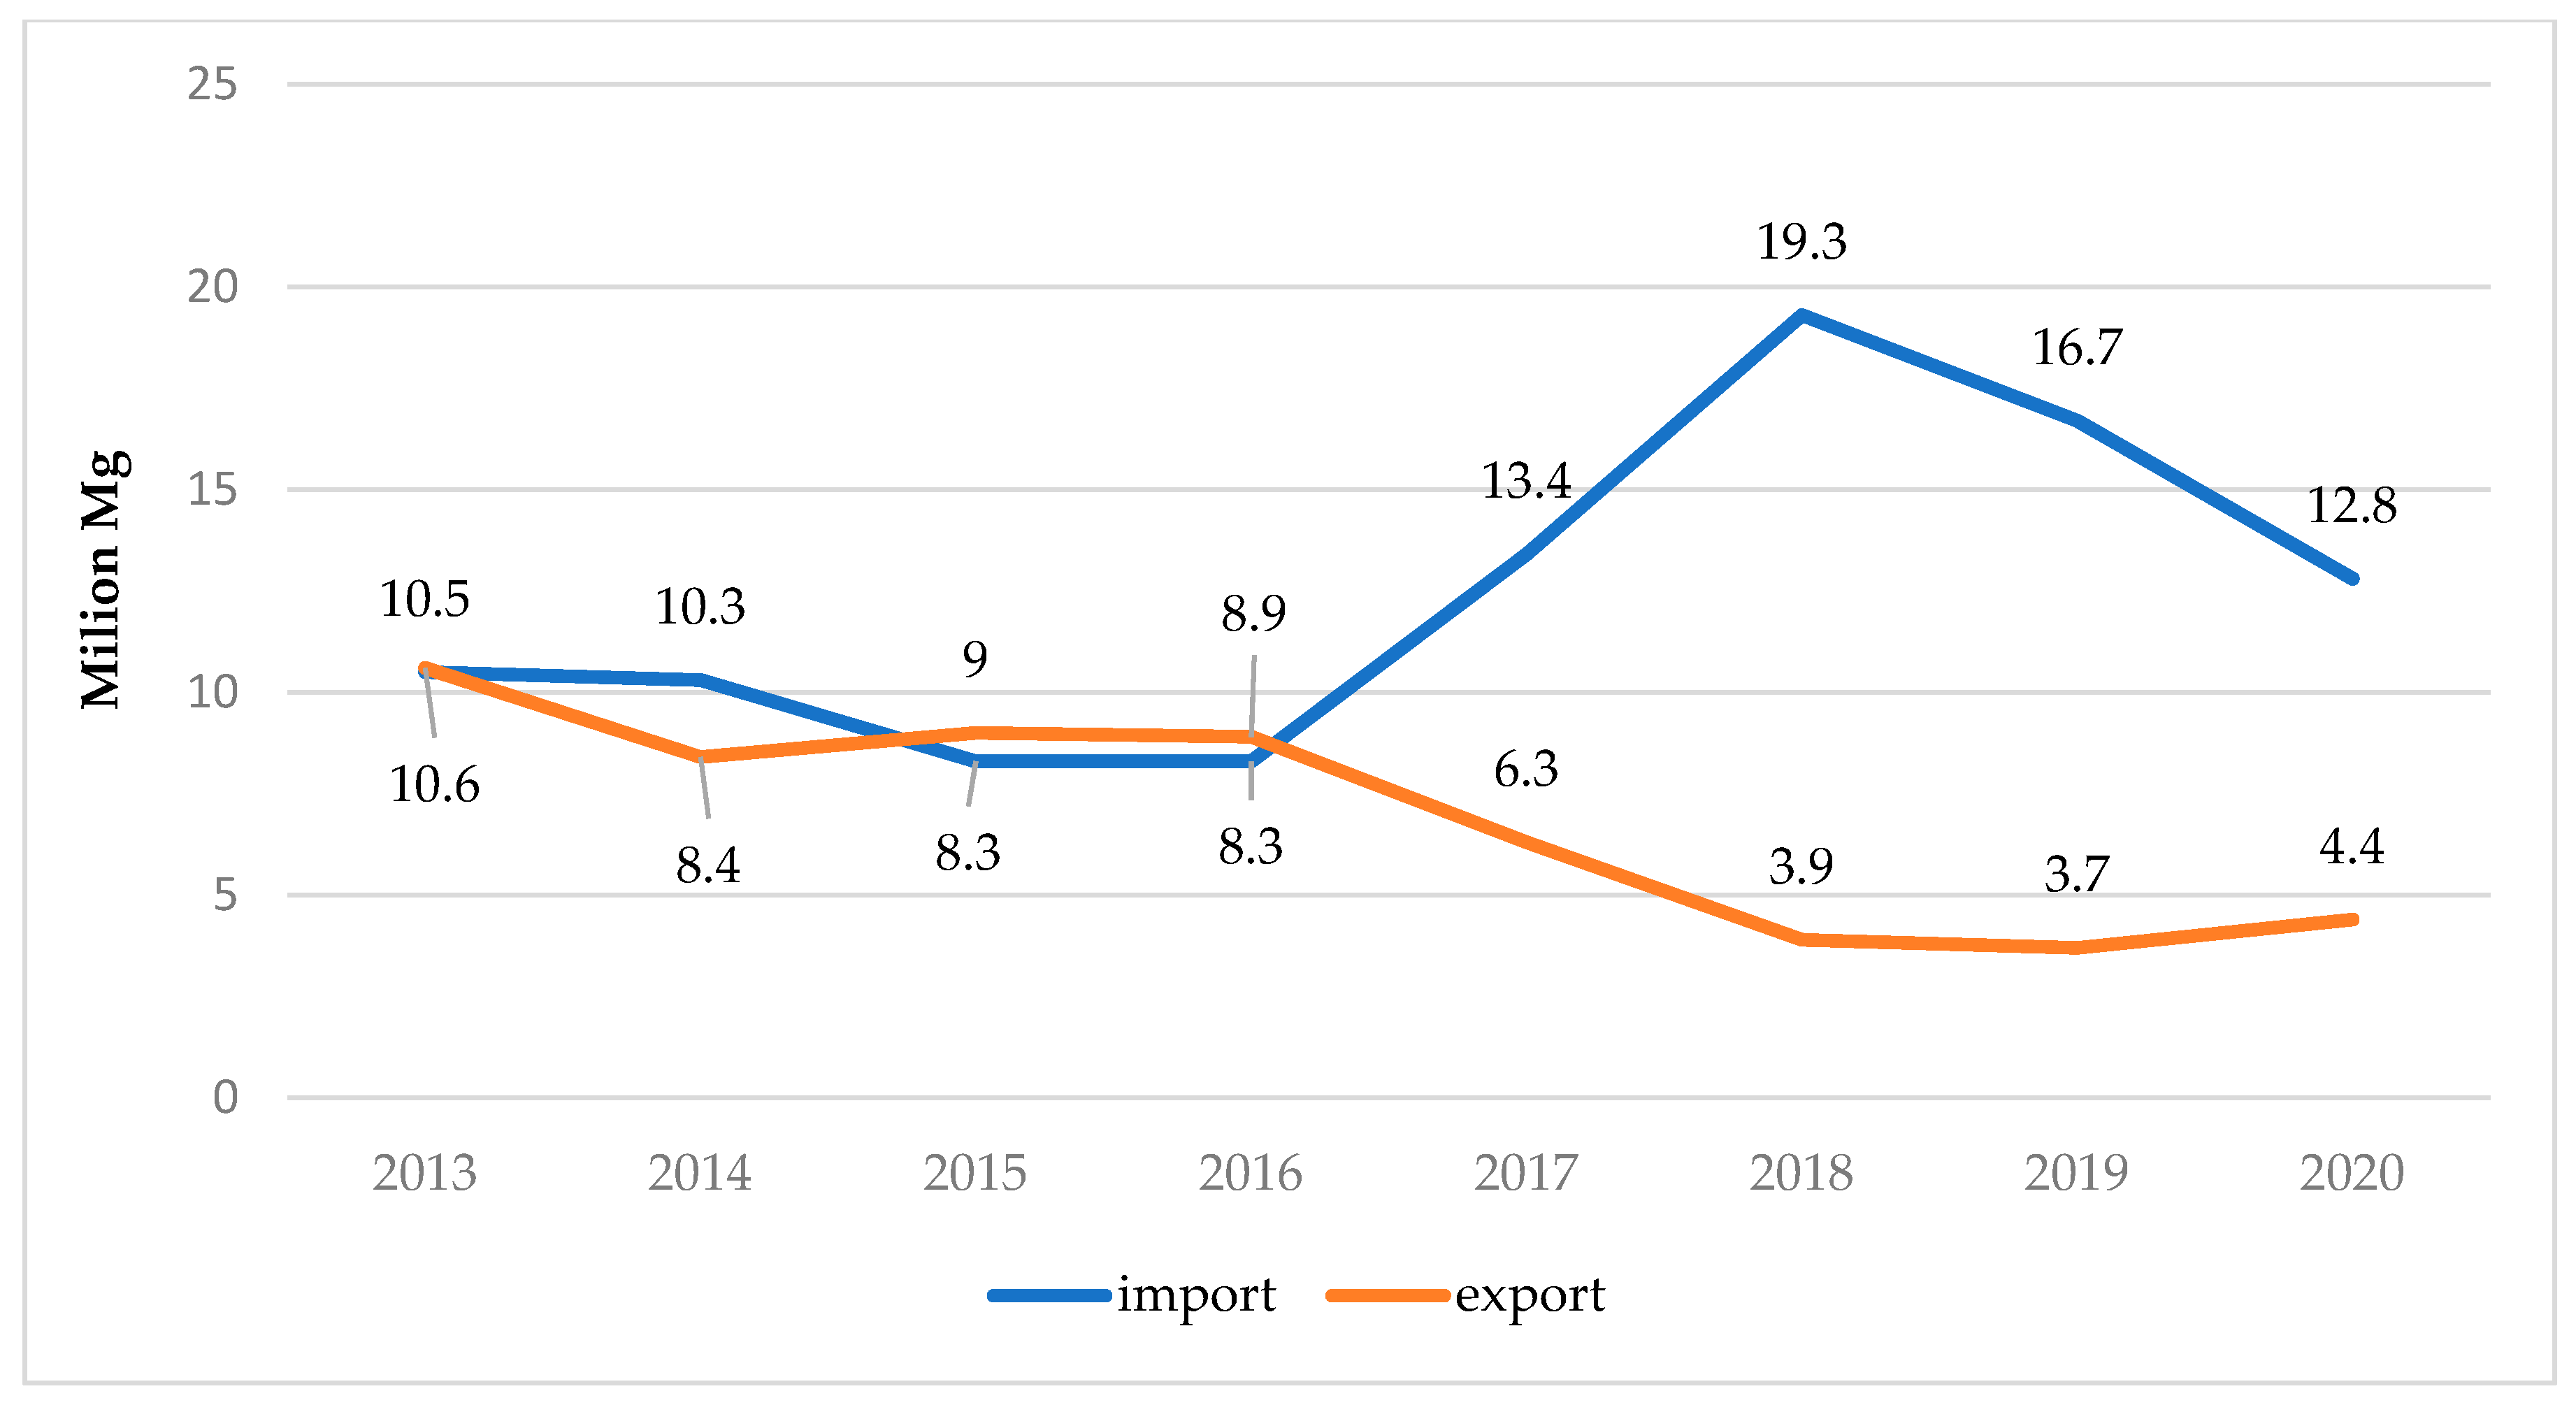
Figure 1. Export and import of hard coal in Poland.
Applsci 12 11064 g001
Figure 2. The impact of low prices and availability of coal on the increase in its import to Poland.
Applsci 12 11064 g002
Figure 3. Installed electric power in Poland by fuel.
Applsci 12 11064 g003
Figure 4. Simplified algorithm of the proposed methodology.
Applsci 12 11064 g004
Figure 5. Hourly electricity production from lignite, hard coal and photovoltaics. (a) Four days in June 2022 with the highest production of PV energy. (b) Four days in June 2022 with the lowest production of PV energy.
Applsci 12 11064 g005aApplsci 12 11064 g005b
Figure 6. Algorithm for calculating the coefficient of replacement of conventional sources by PV installations.
Applsci 12 11064 g006
Figure 7. Coefficient of utilization of the installed capacity of RES sources (PV and wind) in 2019–2022.
Applsci 12 11064 g007
Table 1. Total electricity production and consumption by source in Poland (in GWh).
Energy (GWh)201920202021I-VI 2021I-VI 2022
Production158,767152,308173,58383,09289,117
Consumption169,391165,532174,40286,36587,409
Balance (Export in +, Import −)−10,624−13,224−819−32731708
from RES14,34416,37218,98410,74916,652
Table 2. Total electricity production by source in Poland.
Year (Period)Lignite, GWhNatural Gas, GWhHard Coal, GWhPV, GWhWind Onshore, GWh
201937,77111,12976,225*14,566
202034,42312,69370,184175715,156
202141,55812,80180,299461615,251
I-VI 202221,503533437,084460010,544
* No data for PV.
Table 3. Installed capacity forecast (from July 2022) for selected renewable energy sources in Poland (red color–predictive value).
Month/YearIPPV (MWp)IPWind (MWp)
01/202281477118
02/202287687185
03/202294017212
04/202299987242
05/202210,2227277
06/202210,3647483
07/202210,5057547
08/202210,6477611
09/202210,7887676
10/202210,9307742
11/202211,0717808
12/202211,2137875
Table 4. Monthly REP, SLG and SHCG results.
PeriodREP(m)EL [MWh]Share of REP(m) to Total PV GenerationSLGSHCG
I.2021305368,7344.4%39.0%61.0%
II.20216416139,7464.6%44.2%55.8%
III.202113,981301,8924.6%33.7%66.3%
IV.202121,924444,1434.9%43.7%56.3%
V.202122,869607,3523.8%48.7%51.3%
VI.202116,280767,8922.1%44.5%55.5%
VII.202110,807685,0251.6%37.0%63.0%
VIII.202112,855550,5772.3%32.0%68.0%
IX.202114,156471,2773.0%31.4%68.6%
X.202117,175348,7324.9%26.7%73.3%
XI.20212628131,1202.0%39.5%60.5%
XII.2022296599,0643.0%29.6%70.4%
2021145,1094,615,5543.1%38.3%61.7%
I.20223370134,0282.5%32.8%67.2%
II.202214,514279,5535.2%43.3%56.7%
III.202238,865795,4744.9%36.6%63.4%
IV.202237,801845,8244.5%42.2%57.8%
V.202239,0261,212,8593.2%45.9%54.1%
VI.202238,8281,332,1032.9%33.7%66.3%
I-VI 2022172,4044,599,8413.7%39.8%60.2%
Publisher’s Note: MDPI stays neutral with regard to jurisdictional claims in published maps and institutional affiliations.