Abstract
Soil thrust is a traction force of an off-road tracked vehicle. Existing soil thrust assessment methods assume that a continuous shear failure plane exists along the soil-track interface. However, recent experimental works revealed that the soil beneath the track is divided into soil blocks; each soil block is sheared independently. This study proposed a new total soil thrust assessment method based on the block-shaped failure mechanism, and the total soil thrust predicted by the proposed and the existing methods was compared. The results showed that the existing method showed a greater maximum soil thrust at a lower slip rate than the proposed method. When the soil exhibited a hardening behavior, the total soil thrust in the existing method was always greater than that in the proposed method. However, when the soil exhibited softening behavior or hump behavior, the total soil thrust in the existing method was greater than that in the proposed method until a specific slip ratio, after which the latter became greater. Unlike the existing method, the proposed method can consider the difference in soil thrust with the grouser shape ratio, showing that the total soil thrust increased as the grouser height increased and the shape ratio decreased.
1. Introduction
Continuous tracks have lower drive autonomy (e.g., steerability and manoeuverability) than wheels; however, they provide a large ground contact area, which reduces the ground contact pressure and increases traction. Therefore, continuous tracks are preferred for heavy vehicles that move on unpaved terrains (i.e., off-road) [1,2]. On-road vehicles utilize the entire engine thrust as their traction, but the traction of an off-road tracked vehicle is limited by the soil shearing [3]. During operation, the engine thrust is transmitted to the ground through the continuous track, resulting in a shear displacement and associated shear force at the soil-track interface. In the field of terramechanics, they are called the slip displacement and soil thrust, respectively. In most cases, the soil thrust is very small compared to the engine thrust; thus, the soil thrust determines the traction of an off-road tracked vehicle [1,3,4].
The shear force of the soil increases as the shear displacement increases until the soil fails. Therefore, a large slip displacement (i.e., a large shear displacement) is required to develop a large soil thrust (i.e., a large shear force). However, the slip displacement prevents the rotation of the continuous track from being converted into the movement of the vehicle; hence, a large slip displacement reduces the driving efficiency. In other words, to improve the tractive performance of an off-road tracked vehicle, sufficient soil thrust must be developed to drive the vehicle with minimum slip displacement.
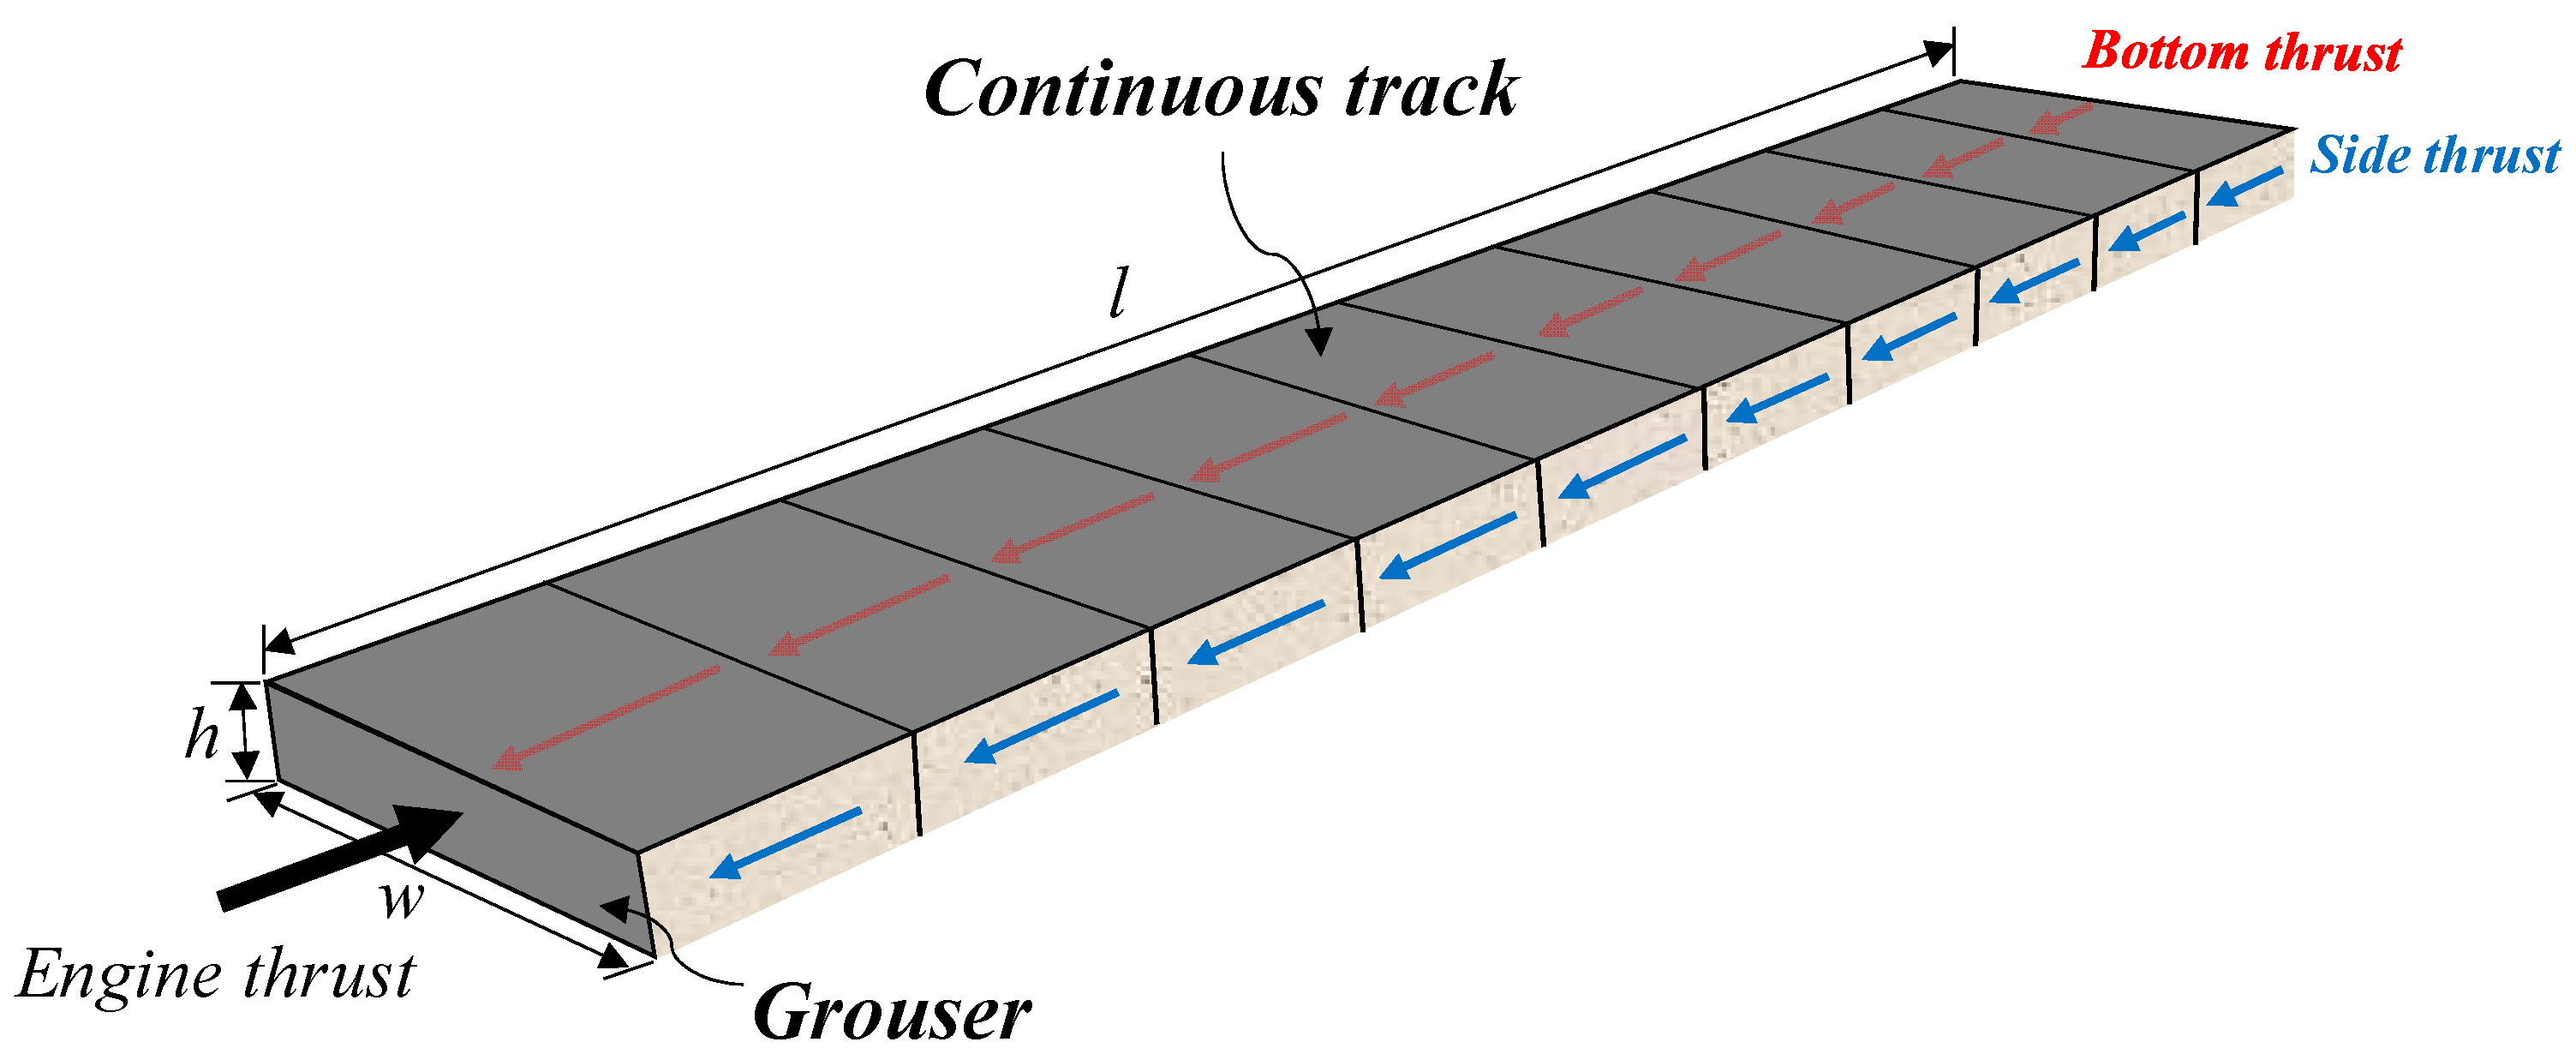
Continuous tracks are usually equipped with grousers to increase traction [1]. Grousers are protruding pads attached to the outer surface of continuous tracks, which increases the soil thrust by generating additional shear force on the side of the track [1,3,4]. As shown in Figure 1, in a continuous track with a grouser, the soil thrusts are developed at the bottom and sides of the soil-track interface (hereafter referred to as bottom thrust and side thrust, respectively). Based on the assumption that a continuous shear failure plane exists along the soil-track interface, the total soil thrust in a continuous track was calculated by differentiating the shear stress developed at the soil-track interface with respect to the area on the bottom (=wl) and the side (=2 lh) [1,2,3,4].
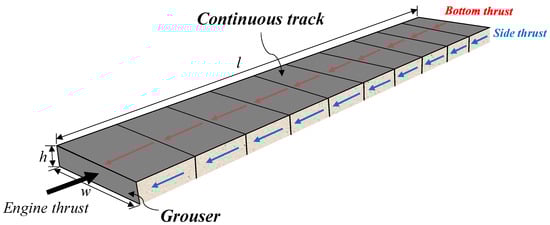
Figure 1.
Schematic diagram of soil thrust development at the soil-track interface.
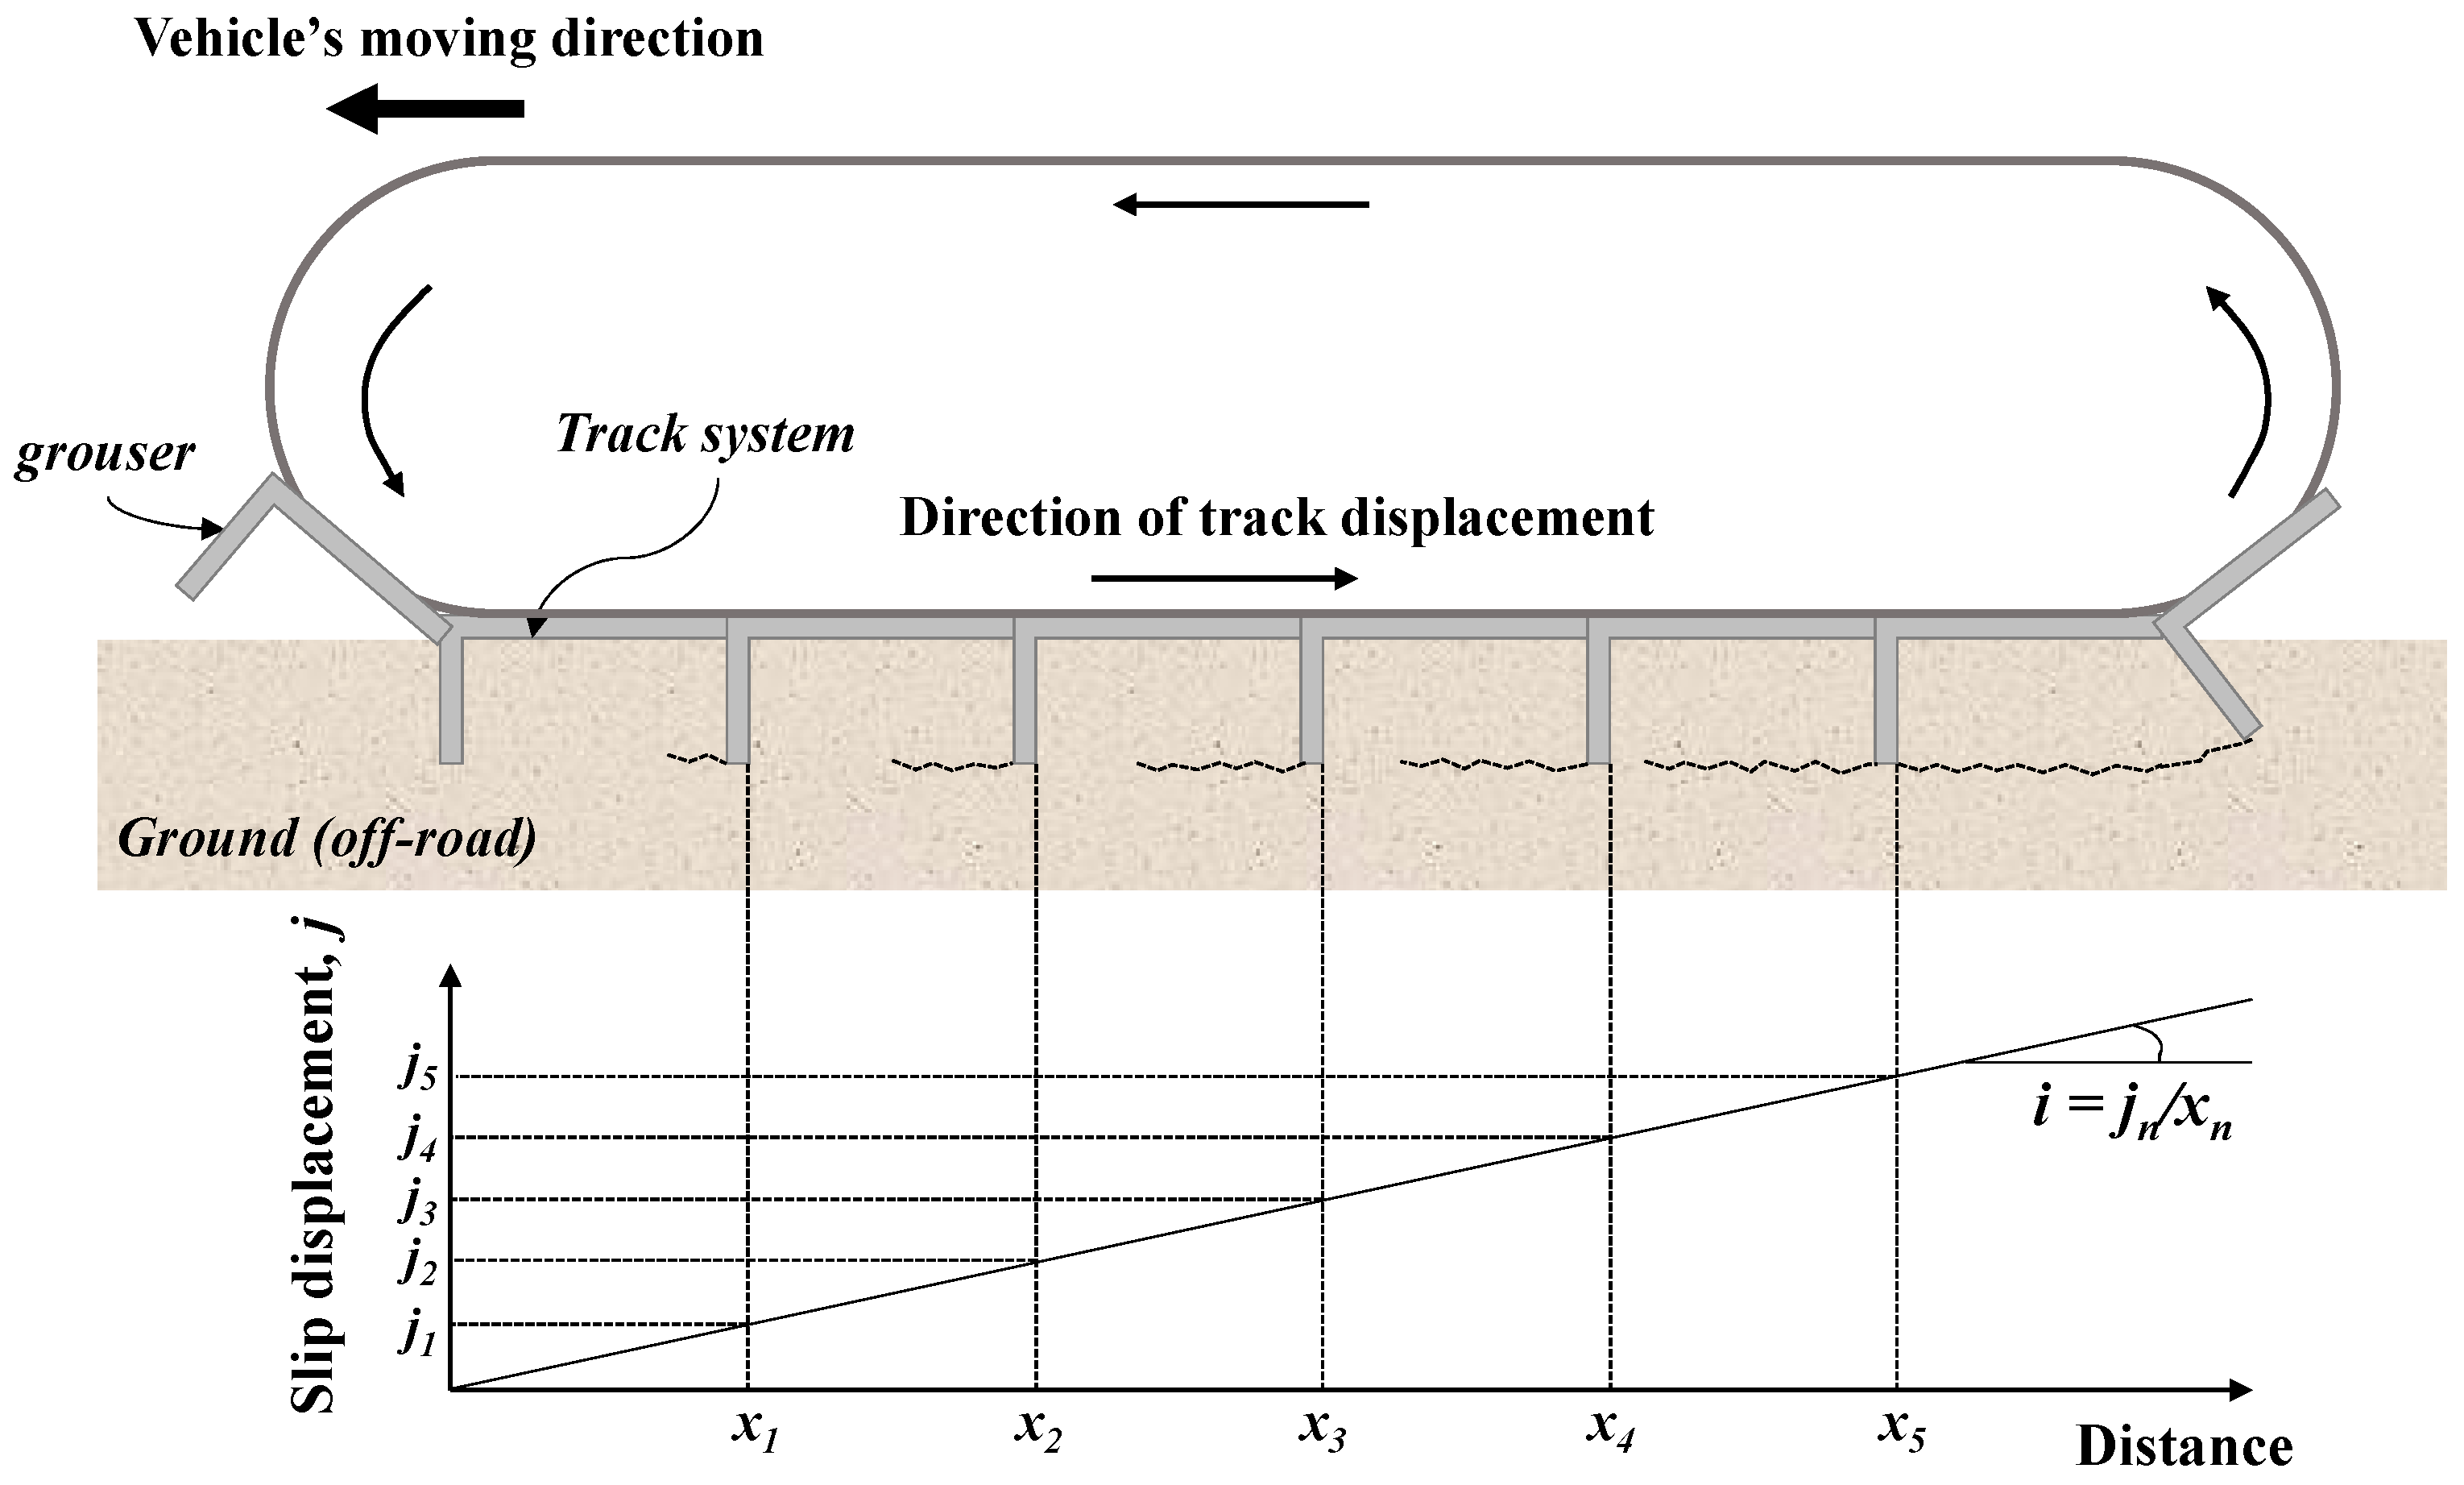
Over the last decade, however, several researchers [5,6,7,8,9,10] have conducted model track tests, revealing that the soil beneath the continuous track is divided into separate sections. While shearing, rectangular soil blocks are formed between adjacent grousers; each soil block is sheared independently. That is, the shear failure plane at the soil-track interface is not continuous, but segmented. The magnitude of slip displacement and soil thrust experienced by each soil block varies with location. As shown in Figure 2, the soil block located at the front, according to the direction the vehicle moves, experiences little slip displacement (the state where soil shearing is not advanced); hence, the soil thrust is small. The shearing at the soil-track interface increases toward the rear end, resulting in a large slip displacement. Therefore, to obtain the total soil thrust of a continuous track accurately, the soil thrusts of varying magnitudes developed in each soil block must be calculated and added separately. However, the existing method for evaluating the total soil thrust of a continuous track [1,2,3,4] does not consider the independent behaviors of the soil blocks. This results in overestimating the soil thrust, because it calculates the total soil thrust based on the rear end track where the largest slip displacement and soil thrust are likely to occur.
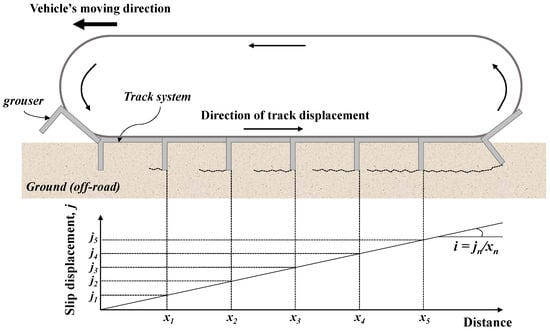
Figure 2.
Schematic diagram of slip displacement on the soil-track interface.
To address this, as a continuation of the abovementioned studies [5,6,7,8,9,10], we explored a new total soil thrust assessment method for a continuous track considering the independent shearing of soil blocks at the soil-track interface. First, a total soil thrust assessment method was proposed based on the block-shaped failure mechanism [5,6,7,8,9,10] and the shear force-shear displacement relationship [11,12,13,14]. Subsequently, the total soil thrust of a continuous track was evaluated under various soil and vehicular conditions using the method proposed in this study and the existing evaluation method [4], and the difference was analyzed. Particular attention was given to the analysis of changes in soil thrust according to grouser geometries (height and spacing).
The structure of this paper is as follows. Section 2 presents the scope of this study. In Section 3, the new total soil thrust assessment method is proposed, and in Section 4, the soil thrust evaluation conditions are presented. In Section 5, the total soil thrusts evaluated using the proposed and the existing evaluation methods were compared, and the change in soil thrust according to the geometries of the grouser was analyzed. The summary and conclusions of this study are presented in Section 6.
2. Scope of the Study
As mentioned above, this study, which reveals independent shearing of soil blocks, is an extension of previous studies [5,6,7,8,9,10]. Therefore, the total soil thrust assessment method proposed in this study follows the scope of previous studies [5,6,7,8,9,10].
There are two types of stiffness classification for continuous tracks (and grousers): flexible (e.g., rubber) and rigid (i.e., steel); the stiffness affects the traction mechanism of continuous tracks [1]. This study considers rigid tracks commonly used in industrial and agricultural vehicles and assumes the track (and grousers) to be a rigid body [15]. In this case, the normal pressure on the track is assumed to be uniformly distributed along the track contact area.
Previous studies [5,6,7,8,9,10] have revealed the block-shaped failure mechanism through the model track tests in granular soil or mixed soil (not cohesive soil). According to Baek et al. [16] and Woo and Baek [17], there are two different failure modes (block-shaped and wedge-shaped) in the development of soil thrust on cohesive soil; thus, this study considers granular soil and mixed soil, not cohesive soil.
The continuous track transfers vehicular loads to the ground surface; the vehicle’s weight is vertically transmitted, while the engine thrust is laterally transmitted, generating the soil thrust. Figure 3 shows the vehicular load of an individual grouser and the block-shaped failure plane. Soil thrust is developed on the bottom and side of the soil block. Referring to previous studies [3,4,5,6,7,8,16,17], the interface thickness (i.e., shear band thickness) and volumetric changes of the interface were not considered when evaluating the soil thrust. This is because the interface thickness is not significant compared to the soil-track interface area (i.e., shearing area), and the volumetric changes are taken into consideration when assessing the motion resistance of vehicles [18,19,20].
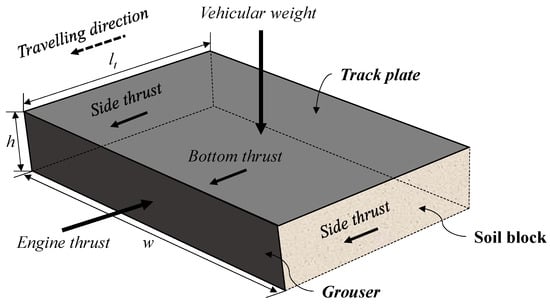
Figure 3.
Schematic diagram of the vehicular load of an individual grouser and the block-shaped failure plane.
The ground is subject to the repetitive vehicular loads of continuous track. In order to predict the soil thrust more realistically, the response to repetitive vehicular loads of ground should be considered. However, like the previous terramechanic studies [3,4,5,6,7,8,16,17], this study adopted monotonic load conditions when evaluating the soil thrust. As recent research works [21,22,23,24] explore soil and soil-material interface behaviors under repetitive loads (cyclic or dynamic loads), it is expected that the results of studies can be applied to the evaluation of the soil thrust in the field of terramechanics.
3. Soil Thrust Assessment Method for Continuous Tracks
3.1. Existing Soil Thrust Assessment Method
When an off-road tracked vehicle travels, an engine thrust is transmitted to the ground via continuous track, resulting in soil thrust on the bottom and side of the track. As the soil thrust is the shear force of the soil, it can be calculated from the integration of the shear stress over the shearing area on the bottom and side of the track system. Based on the theory of elasticity, Bekker [4] expressed the maximum values of soil thrust, as shown in Equation (1).
where Fmax is the maximum soil thrust, c and ϕ are the cohesion and friction angle of the soil, respectively, σv’ is the effective vertical stress acting on the bottom of the continuous track, w and l are the width and length of the soil-track interface, respectively, and h is the height of the grouser.
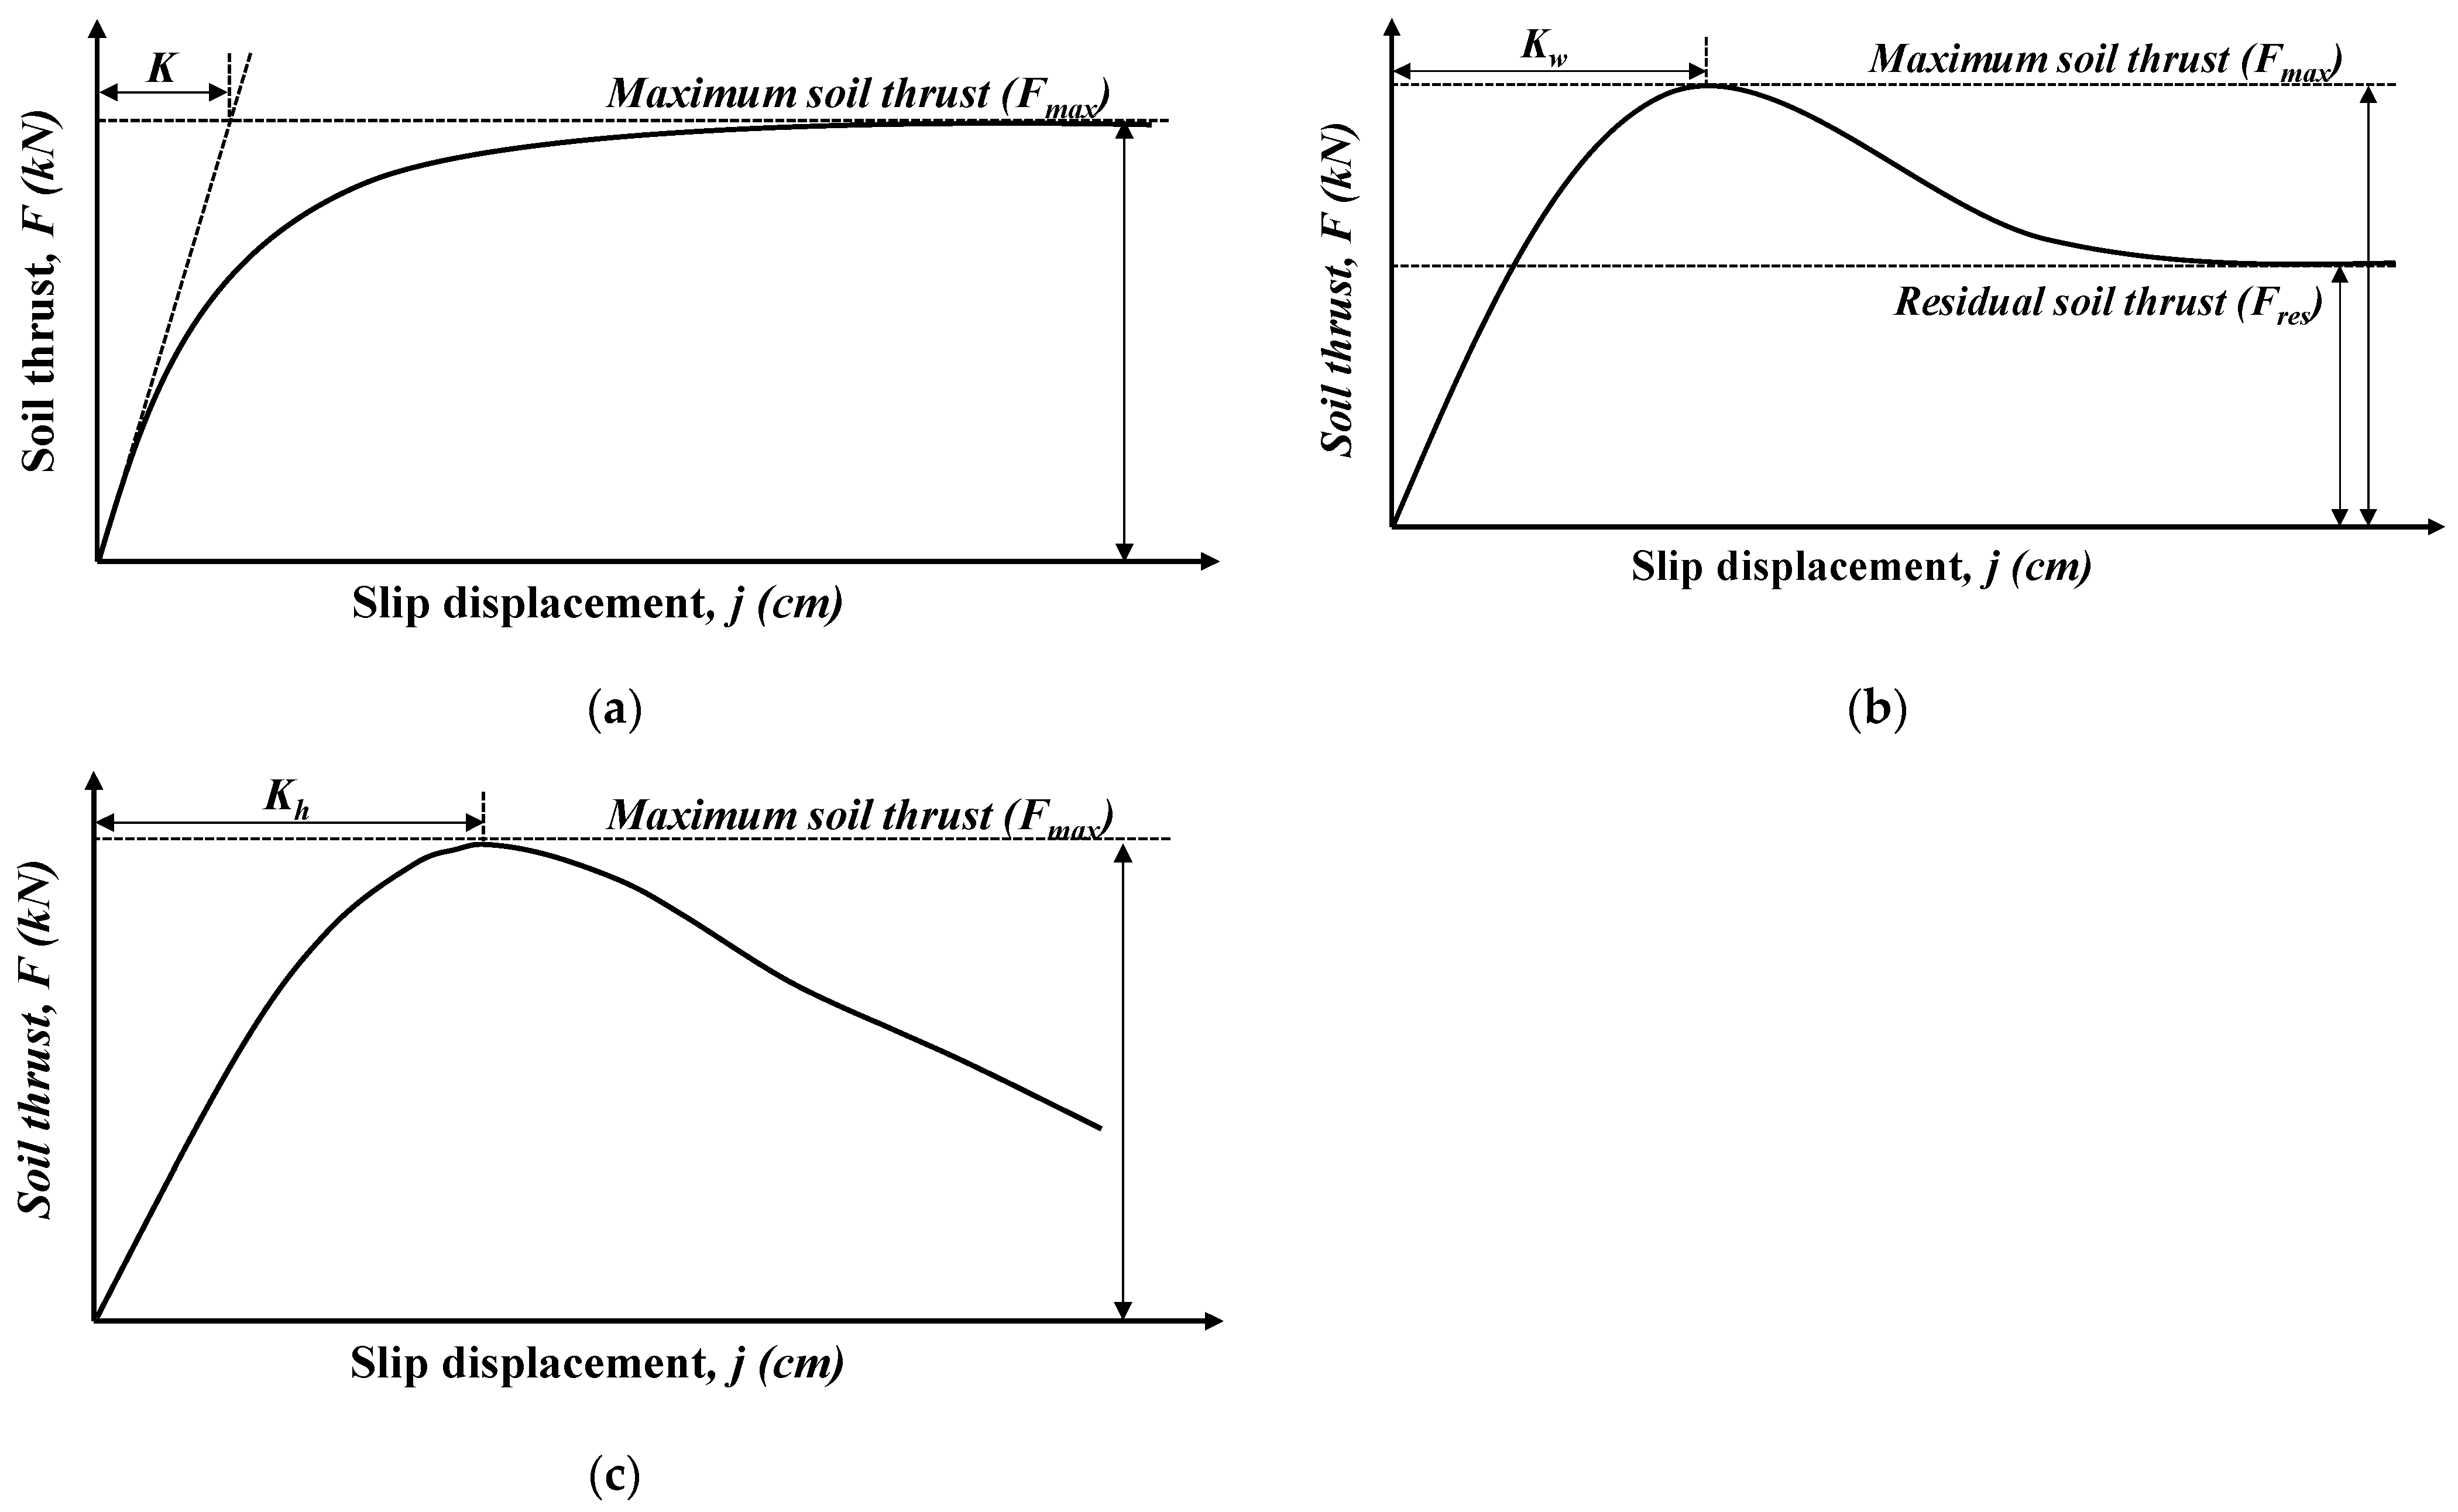
Figure 4 illustrates the three different behaviors exhibited by soil thrust-slip displacement relationships: hardening, softening, and hump [3]. Hardening and softening behaviors occur mainly in loose and dense soils, respectively [25], and the hump behavior is mainly observed in muskeg mat. In this study, the soil thrust-slip displacement relationships proposed by Janosi and Hanamoto [11] and Wong [12] were used to represent hardening (Figure 4a) and softening behaviors (Figure 4b), respectively, and are given in Equations (2) and (3), respectively. The soil thrust-slip displacement relationship proposed by Wong and Perston-Thomas [13] and Wong [14] was adopted to represent hump behavior (Figure 4c). It is given in Equation (4).
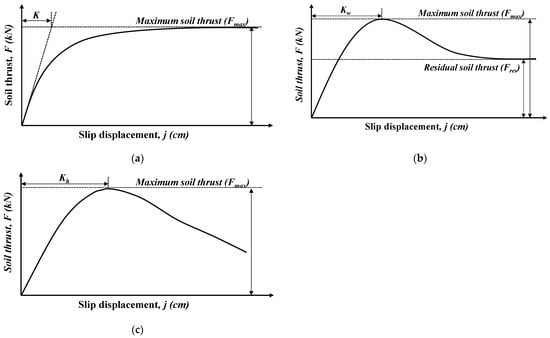
Figure 4.
Soil thrust and slip displacement relationships exhibiting (a) hardening behavior, (b) softening behavior, and (c) hump behavior.
Here, j is the slip displacement, K, Kw, and Kh are the shear deformation constants (the shear displacement required to develop the maximum soil thrust), and Kr is the ratio of the maximum soil thrust (Fmax) to the residual soil thrust (Fres) (Fmax/Fres). Fmax is determined using Equation (1), and F is the soil thrust when the slip displacement is j.
Bekker [4] defined the slip ratio i as the ratio of the continuous track displacement x to the slip displacement j generated when the continuous track moved by x (i = j/x). In other words, if the slip ratio is 0 (i.e., j = 0), all the displacements of the continuous track are converted to the displacement of the vehicle, and if the slip ratio is 1 (i.e., j = x), the vehicle is idling. In literature [2,3,4], the total slip displacement j generated by the continuous track is calculated as the product of the total distance covered by the continuous track along the ground (that is, length of the soil-track interface l) and the slip ratio i (i.e., j = il). The total soil thrust (Ft) is obtained by substituting the total slip displacement (i.e., j = il) into Equations (2)–(4). Equations (5)–(7) present the total soil thrust of the continuous track showing hardening, softening and hump behaviors, respectively, under a slip ratio of i.
As described above, the relationship between the total soil thrust and slip ratio of the off-road tracked vehicle can be expressed using the ground characteristics and the geometries of the continuous track and grouser. Using Equations (5)–(7), the total soil thrust according to the slip ratio can be evaluated to predict the driving performance and driving efficiency of a grouser-attached off-road tracked vehicle.
However, as mentioned previously, (see Figure 2), this method does not consider the change in soil thrust according to location of the grousers. This results in an overestimation of total soil thrust. Another limitation of the previous method is that the soil thrust does not change with the grouser spacing. Although the shape ratio (lt/h), the ratio of the grouser spacing (lt) to its height (h), has a significant impact on the soil thrust [1,26], total soil thrust calculated through the previous method is the same regardless of the shape ratio.
3.2. Proposed Method for Evaluating the Soil Thrust of a Continuous Track
As shown in Figure 3, at the soil-track interface, rectangular soil blocks are formed between adjacent grousers and each of them is independently sheared [5,6,7,8,9]. This means that the shear failure plane at the soil-track interface is not continuous but divided into separate sections (i.e., separate soil blocks). The soil block located at the front in the traveling direction of the off-road tracked vehicle experiences little slip displacement and soil thrust without much shearing, and the slip displacement and soil thrust increase as shearing progresses toward the rear.
As shown in Figure 2, when the off-road tracked vehicle travels with a slip ratio i, the slip displacement (jn) occurring in the grouser (i.e., soil block) that is separated by a specific distance (xn) from the first point of the soil-track interface can be expressed as the product of the slip ratio and the distance (jn = ixn). If the grouser spacing is lt, the total length l of the soil-track interface is divided into N = l/lt soil blocks and each block is separately sheared. The distance between the first block of the soil-track interface and the soil block at the nth position is Therefore, the slip displacement occurring in the soil block at the nth position from the first block of the soil-track interface can be expressed as follows.
Additionally, in Equation (1), if the length l of the soil-track interface is replaced with lt, the maximum soil thrust Fmax developed on each soil block can be obtained; it is given in Equation (9).
By substituting the slip displacement from Equation (8) and maximum soil thrusts from Equation (9) in Equations (2)–(4), the soil thrust (Fn) generated by the soil block at the nth position from the first block of the soil-track interface can be calculated. Fn under hardening, softening, and hump behaviors under the slip ratio i are given in Equations (10)–(12), respectively.
The total soil thrust of the continuous track can be evaluated as the sum of the soil thrusts developed in each soil block. Therefore, the total soil thrusts on the off-road vehicle under hardening, softening, and hump behaviors are as shown in Equations (13)–(15), respectively.
The driving force and driving efficiency can be predicted by evaluating the total soil thrust according to the slip ratio of the off-road tracked vehicle to which the grouser is attached. Unlike the previous studies, Equations (13)–(15) were derived after incorporating the differences in soil thrusts according to the grouser spacing (lt). In other words, obtaining the optimal grouser shape ratio is possible by analyzing the change in the total soil thrust according to the shape ratio (lt/h), which has a significant impact on the soil thrust of an off-road tracked vehicle.
4. Analysis Conditions
4.1. Soil Parameters
As can be seen from Equations (5)–(7) and (13)–(15), the soil parameters c, ϕ, K, Kw, Kh, and Kr are required to evaluate the total soil thrust of the continuous track. Wong [3] presented the soil parameters of a variety of mineral terrains distributed in Eastern Ontario, Canada through the bevameter test. In the field of terramechanics, the bevameter test has become the most widely used method for evaluating field or ground characteristics since Bekker [27] developed it. It evaluates the shearing and pressure-sinkage behaviors of the ground through a shear test with a shear ring and a loading test with a penetration plate, respectively. In this study, soils exhibiting hardening, softening, and hump behaviors were selected based on a previous study by Wong [3] (LETE sand, sandy loam, and muskeg mat, respectively).
Table 1 shows the soil parameters. Among the sand-based soils, hardening behavior was observed in LETE sand with relatively small shear strength parameters, and softening behavior was observed in sandy loam with relatively large shear strength parameters. Themuskeg mat showed hump behavior and the magnitude of slip displacement (i.e., Kh) required to obtain the maximum soil thrust was higher compared to other soils.

Table 1.
Soil parameters for the evaluation of soil thrust of continuous tracks obtained by Wong [3].
4.2. Vehicle Parameters
As can be seen from Equations (5)–(7) and (13)–(15), the geometries of the continuous track and grouser and the weight of the vehicle are required to evaluate the total soil thrust of a continuous track. In this study, the soil thrusts on the crawler excavators EC145E and EC380E manufactured by Volvo Construction Equipment were evaluated. EC140E weighs 14.1 tons and uses a pair of continuous tracks with 600-mm wide and 3000-mm long bases to drive. EC380E weighs 38.5 tons and has a pair of continuous tracks with a base of 600 mm in width and 4200 mm in length. As shown in Figure 5, the continuous tracks of EC145E and EC380E receive vertical loads of 7.05 tons and 19.25 tons, respectively, which are half the weight of the vehicles.
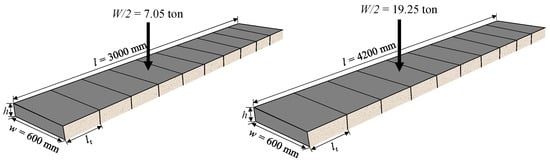
Figure 5.
Schematic diagram of the soil-track contact area of Volvo EC145E (left) and Volvo EC380E (right).
To evaluate the effect of grouser shape ratio on soil thrust, twenty-one types of grousers were applied to each vehicle (i.e., EC145E and EC380E). Each type had a different height and shape ratio (ratio of grouser height to the spacing). The difference in weight of the grouser was not considered, as it was judged to be insignificant compared to the weight of the vehicle (14.1 tons and 38.5 tons). The heights (25 mm, 50 mm, 70 mm) and shape ratios of the grouser applied in the evaluation (1.5, 2.0, 2.5, 3.0, 4.0, 5.0, 7.5) were based on the height (about 25–70 mm) and shape ratios (about 2.3–3.9) of commercial grousers from Hyundai steel and ArcelorMittal, the representative grouser manufacturers.
5. Results and Discussion
In this section, the relationship between total soil thrust and slip ratio was presented; and the maximum soil thrust according to the shape of the grouser was quantitatively analyzed. Total soil thrust-slip ratio relationship of the continuous track was evaluated using the proposed method and the existing method proposed by Bekker [4]. By substituting the aforementioned soil parameters and vehicle parameters into Equations (5)–(7), (13)–(15), the total soil thrust-slip ratio relationships were derived. In addition, the total soil thrust-slip ratio relationship when the grouser was not attached to the off-road vehicle (h = 0) was also calculated and used in the analysis of the effect of grousers. When a grouser is attached, the soil thrust is determined by the shear force (c and ϕ) developed along the soil block; however, when a grouser is not attached, the soil thrust is determined by the shear force at the contact-surface between the continuous track and the ground (soil-track adhesion and friction coefficient). Therefore, after determining the adhesion force and friction coefficient of the soil-track to be 2/3rd of c and ϕ shown in Table 1, the values were substituted into Equations (5)–(7) to derive the total soil thrust-slip ratio relationship when no grousers were attached. In general, the tractive performance of an off-road tracked vehicle under slip ratios in the range of 0–0.2 is widely used as an evaluation index [3]. Hence, the total soil thrust-slip ratio relationship in this study was determined for slip ratios in the range of 0–0.2.
5.1. Relationships between Total Soil Thrust and Slip Ratio
Figure 6, Figure 7, Figure 8, Figure 9, Figure 10 and Figure 11 show the relationship between the total soil thrust and the slip ratio of the off-road tracked vehicle operating on the soil exhibiting hardening behavior, softening behavior and hump behaviors, respectively. The weight and size of an off-road tracked vehicle only affect the magnitude of the soil thrust, and the trend of the soil thrust and slip ratio relationship (difference between the soil thrusts and slip ratio relationships evaluated using the proposed method and the existing theory) was not affected. Therefore, in the case of EC380E, the result of using a grouser with a height of 70 mm is representatively shown.
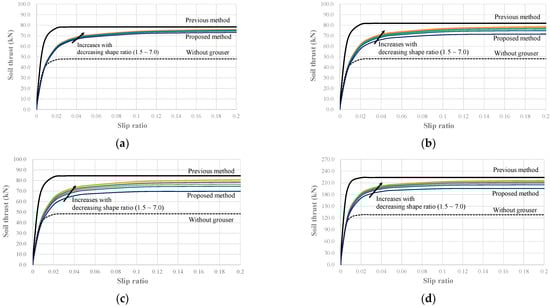
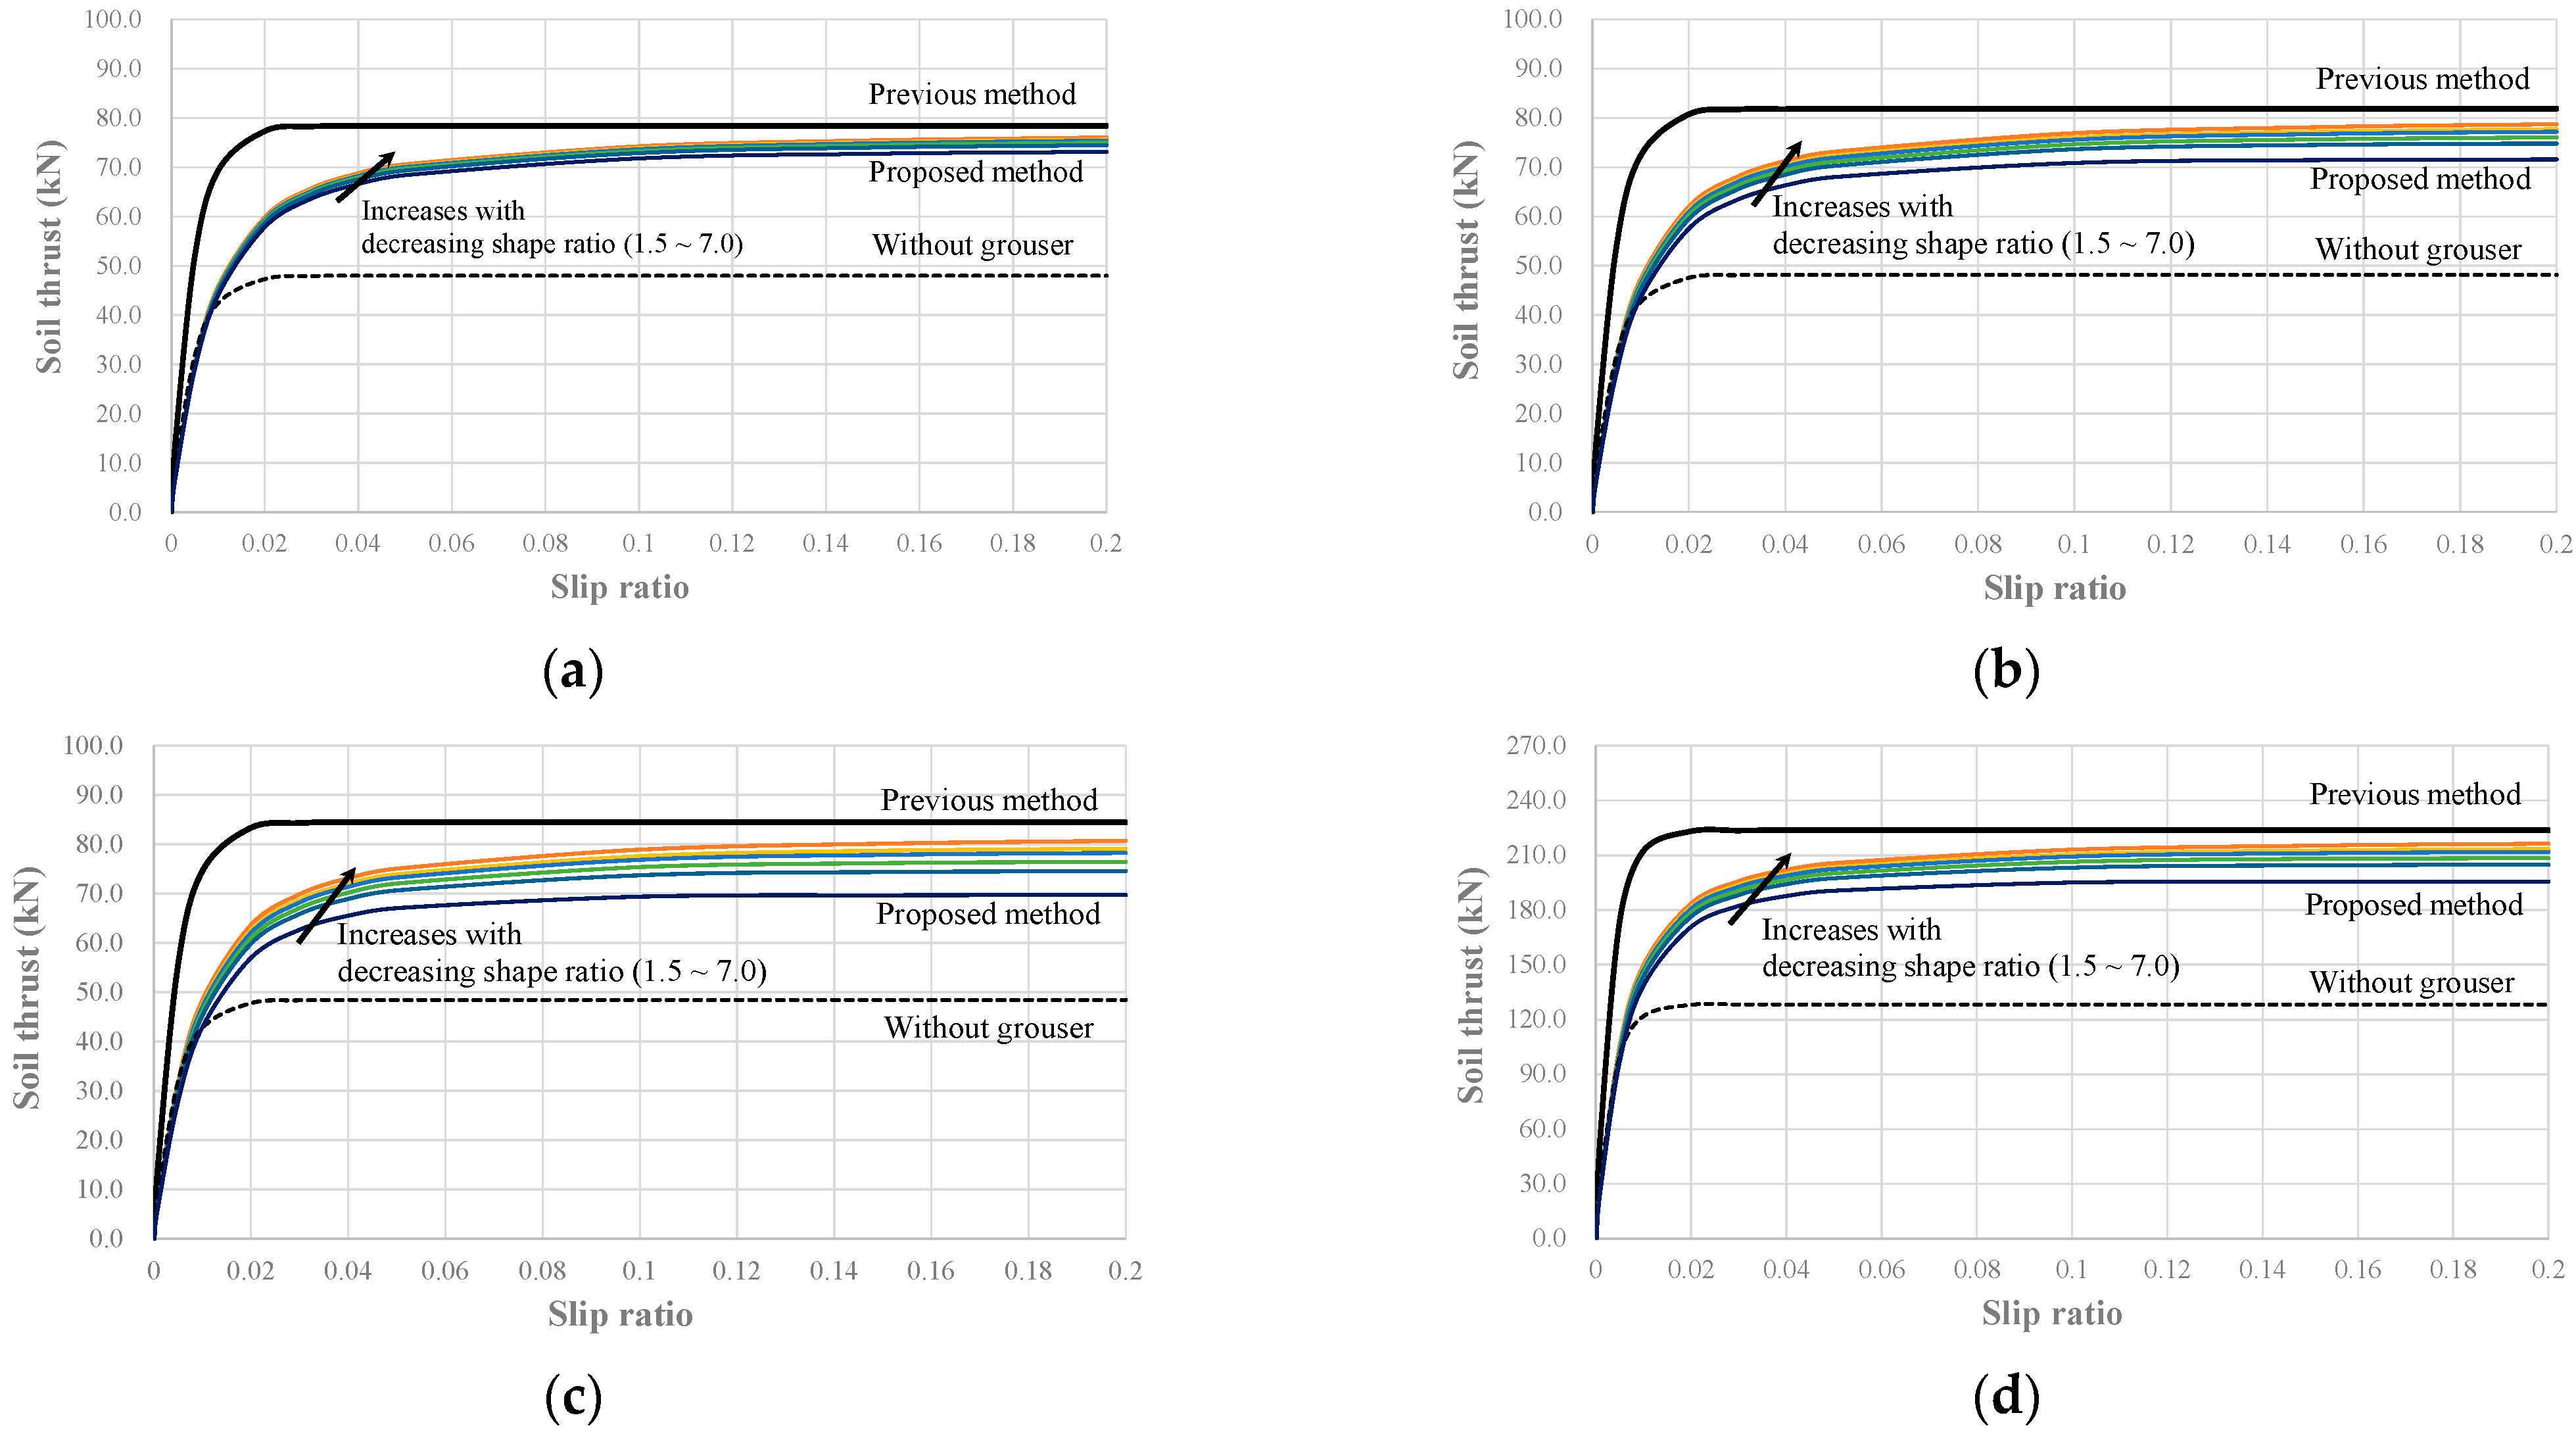
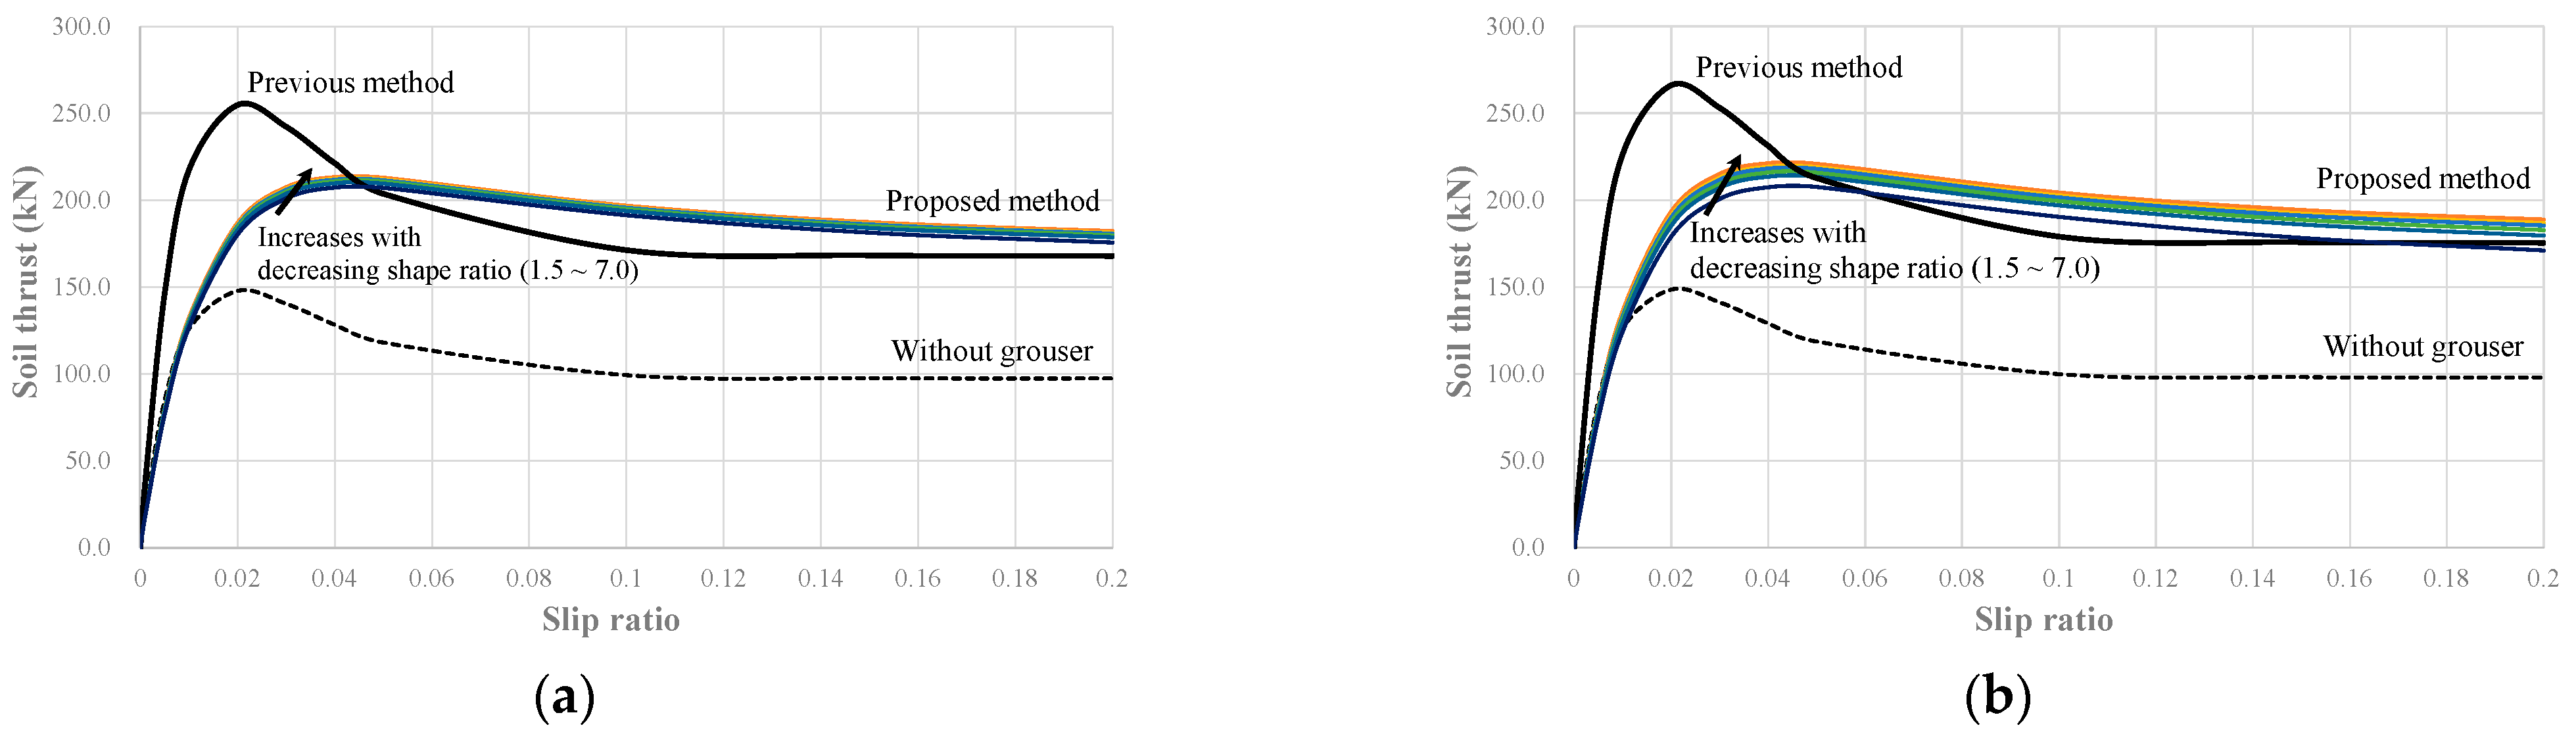
Figure 6.
Soil thrust and slip displacement curves in soils exhibiting hardening behavior (c = 0.96 kPa, , K = 1.14): EC145E with a grouser height of (a) 25 mm, (b) 50 mm (c) 70 mm: (d) EC380E with 70 mm grouser height.
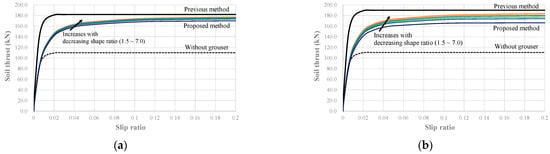
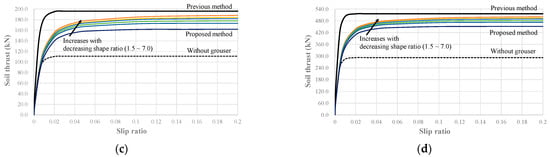
Figure 7.
Soil thrust and slip displacement curves in soils exhibiting hardening behavior (c = 1.39 kPa, , K = 1.13): EC145E with a grouser height of (a) 25 mm, (b) 50 mm (c) 70 mm: (d) EC380E with 70 mm grouser height.
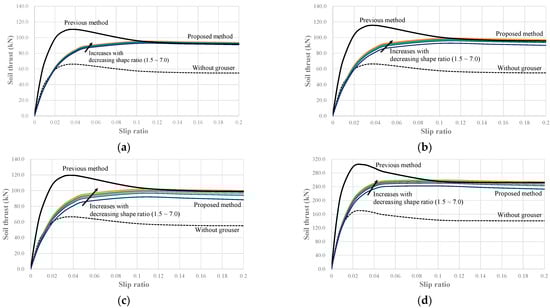
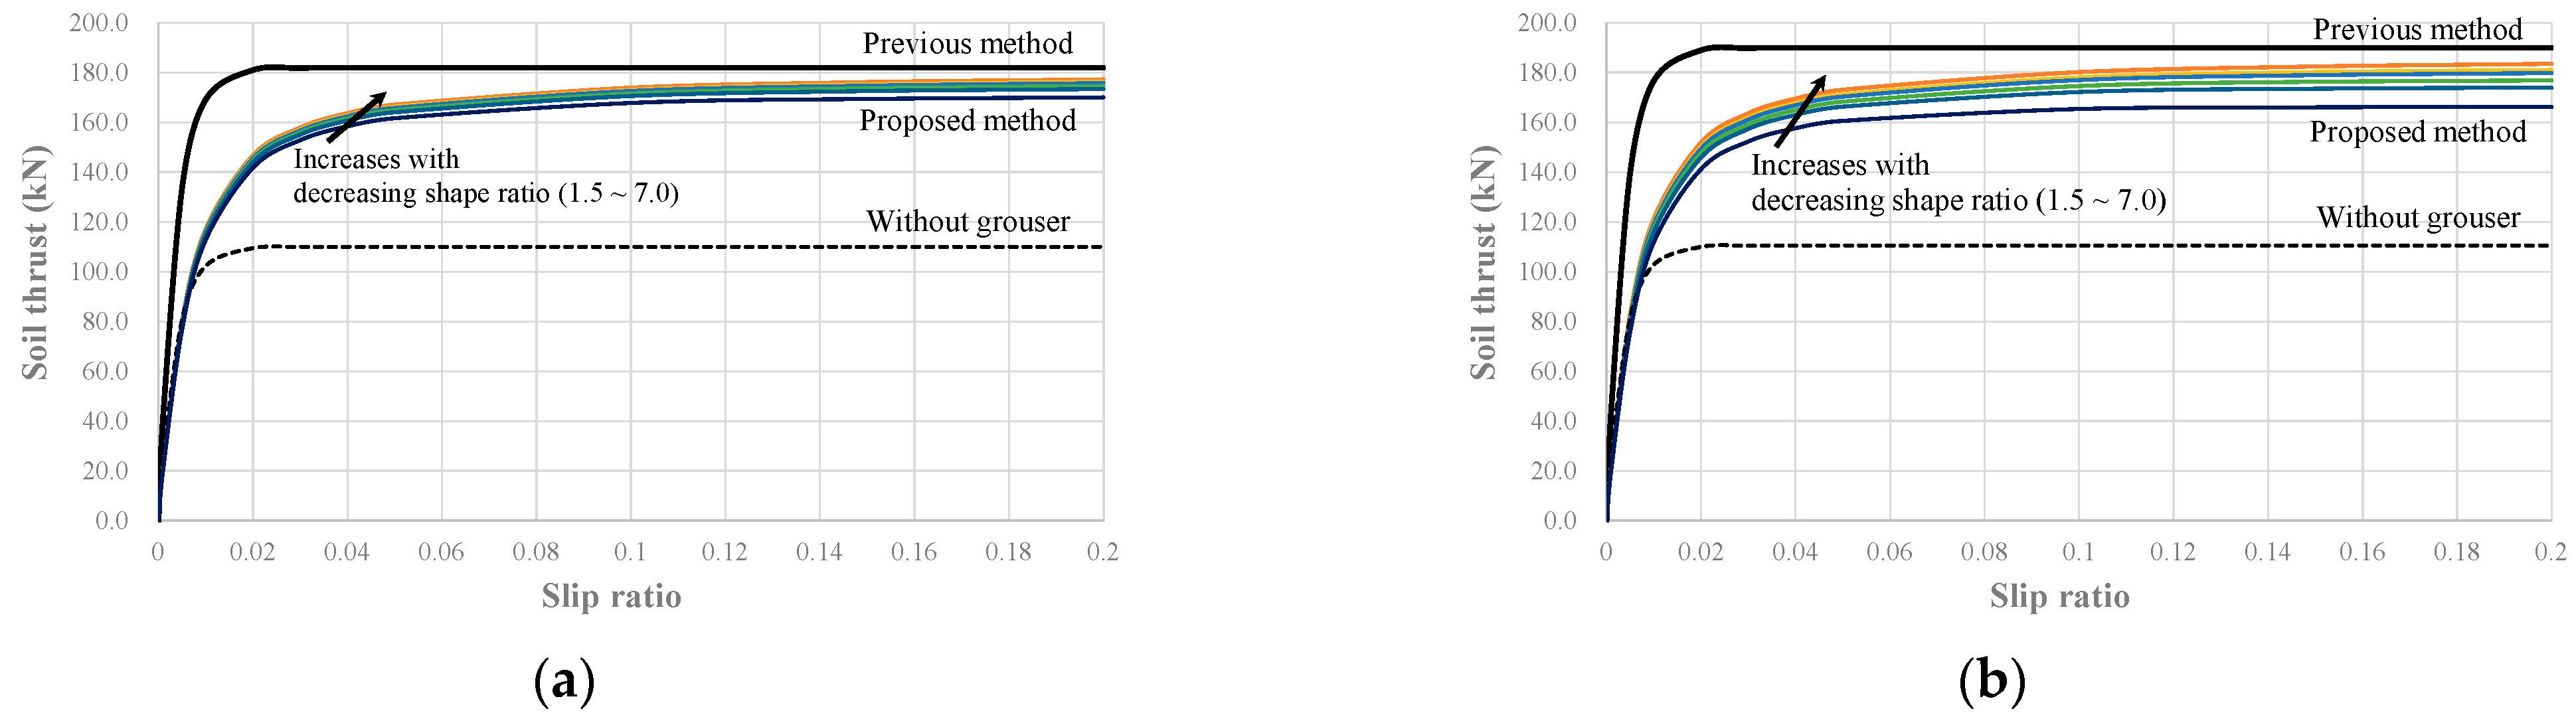
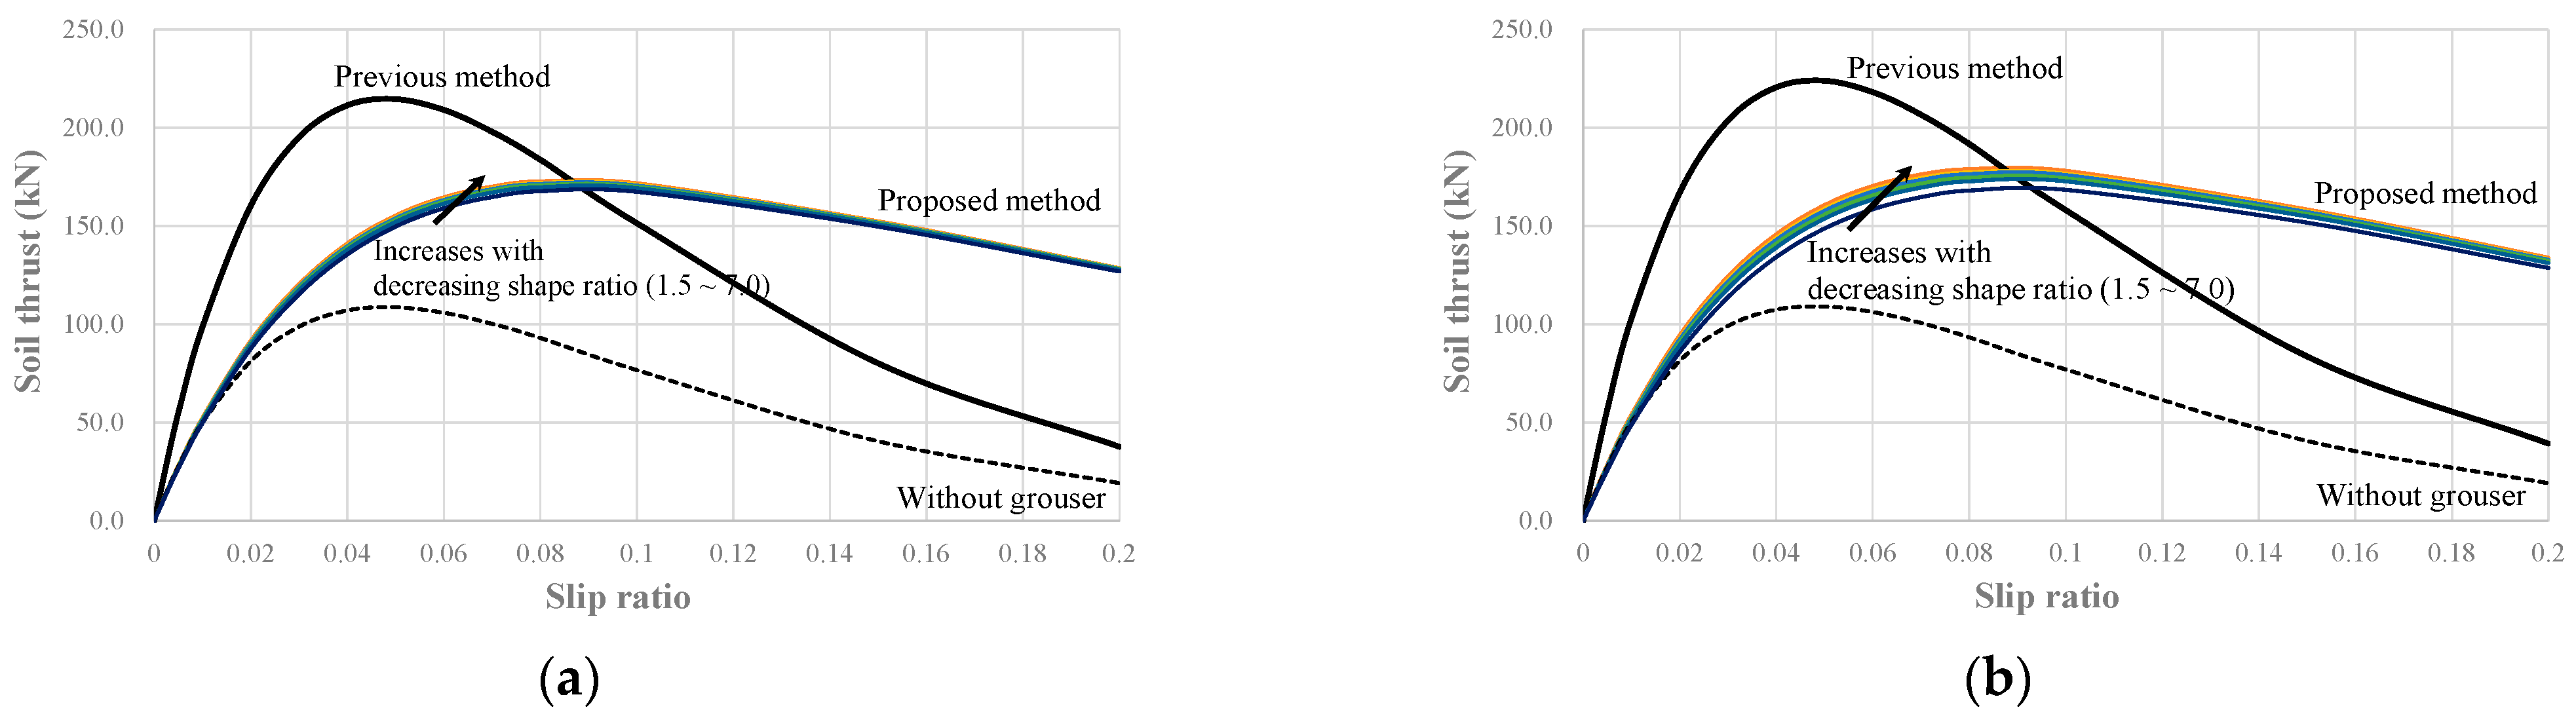
Figure 8.
Soil thrust and slip displacement curves in soils exhibiting softening behavior (c = 3.3 kPa, , KW = 9.3, Kr = 0.835): EC145E with a grouser height of (a) 25 mm (b) 50 mm (c) 70 mm: (d) EC380E with 70 mm grouser height.
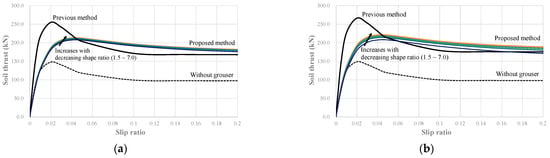
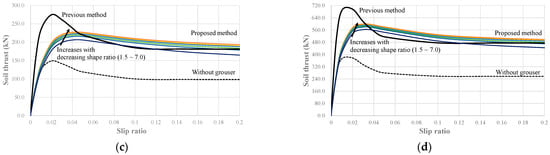
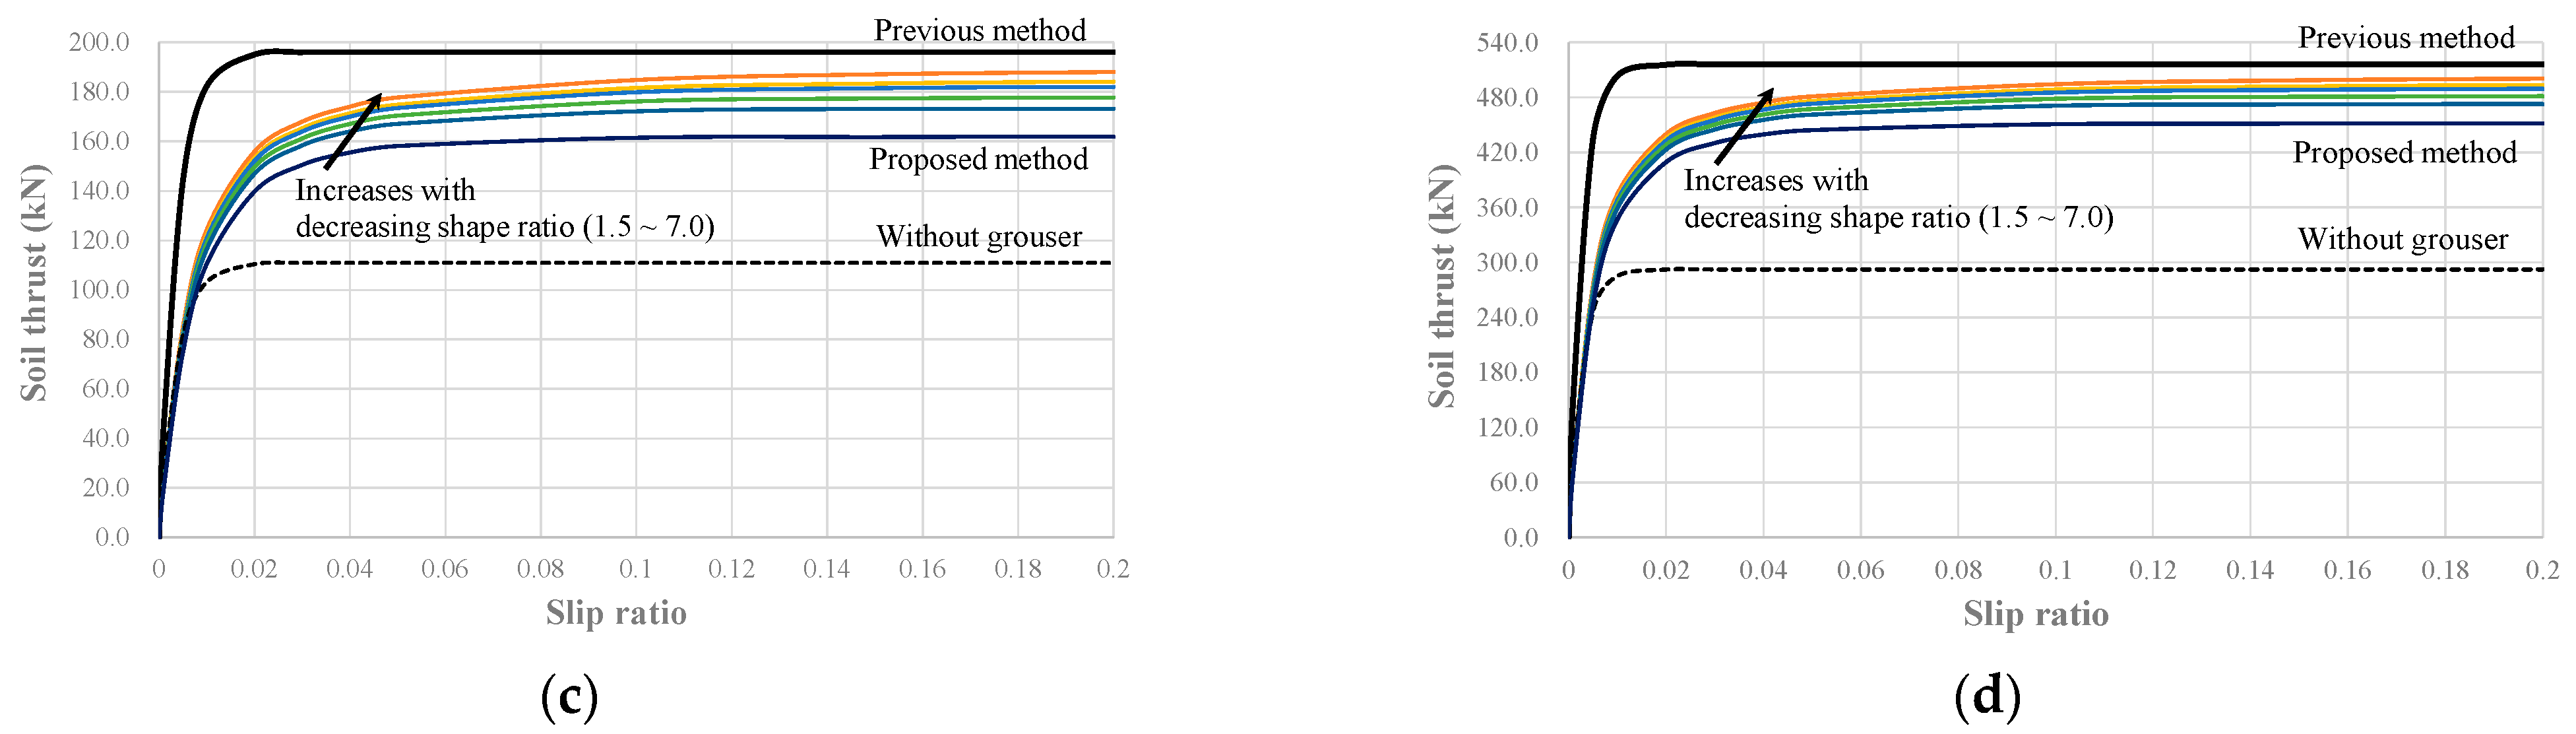
Figure 9.
Soil thrust and slip displacement curves in soils exhibiting softening behavior (c = 2.2 kPa, , KW = 6.1, Kr = 0.659): EC145E with a grouser height of (a) 25 mm (b) 50 mm (c) 70 mm: (d) EC380E with 70 mm grouser height.
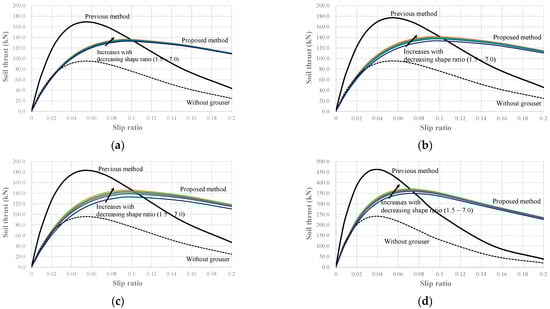
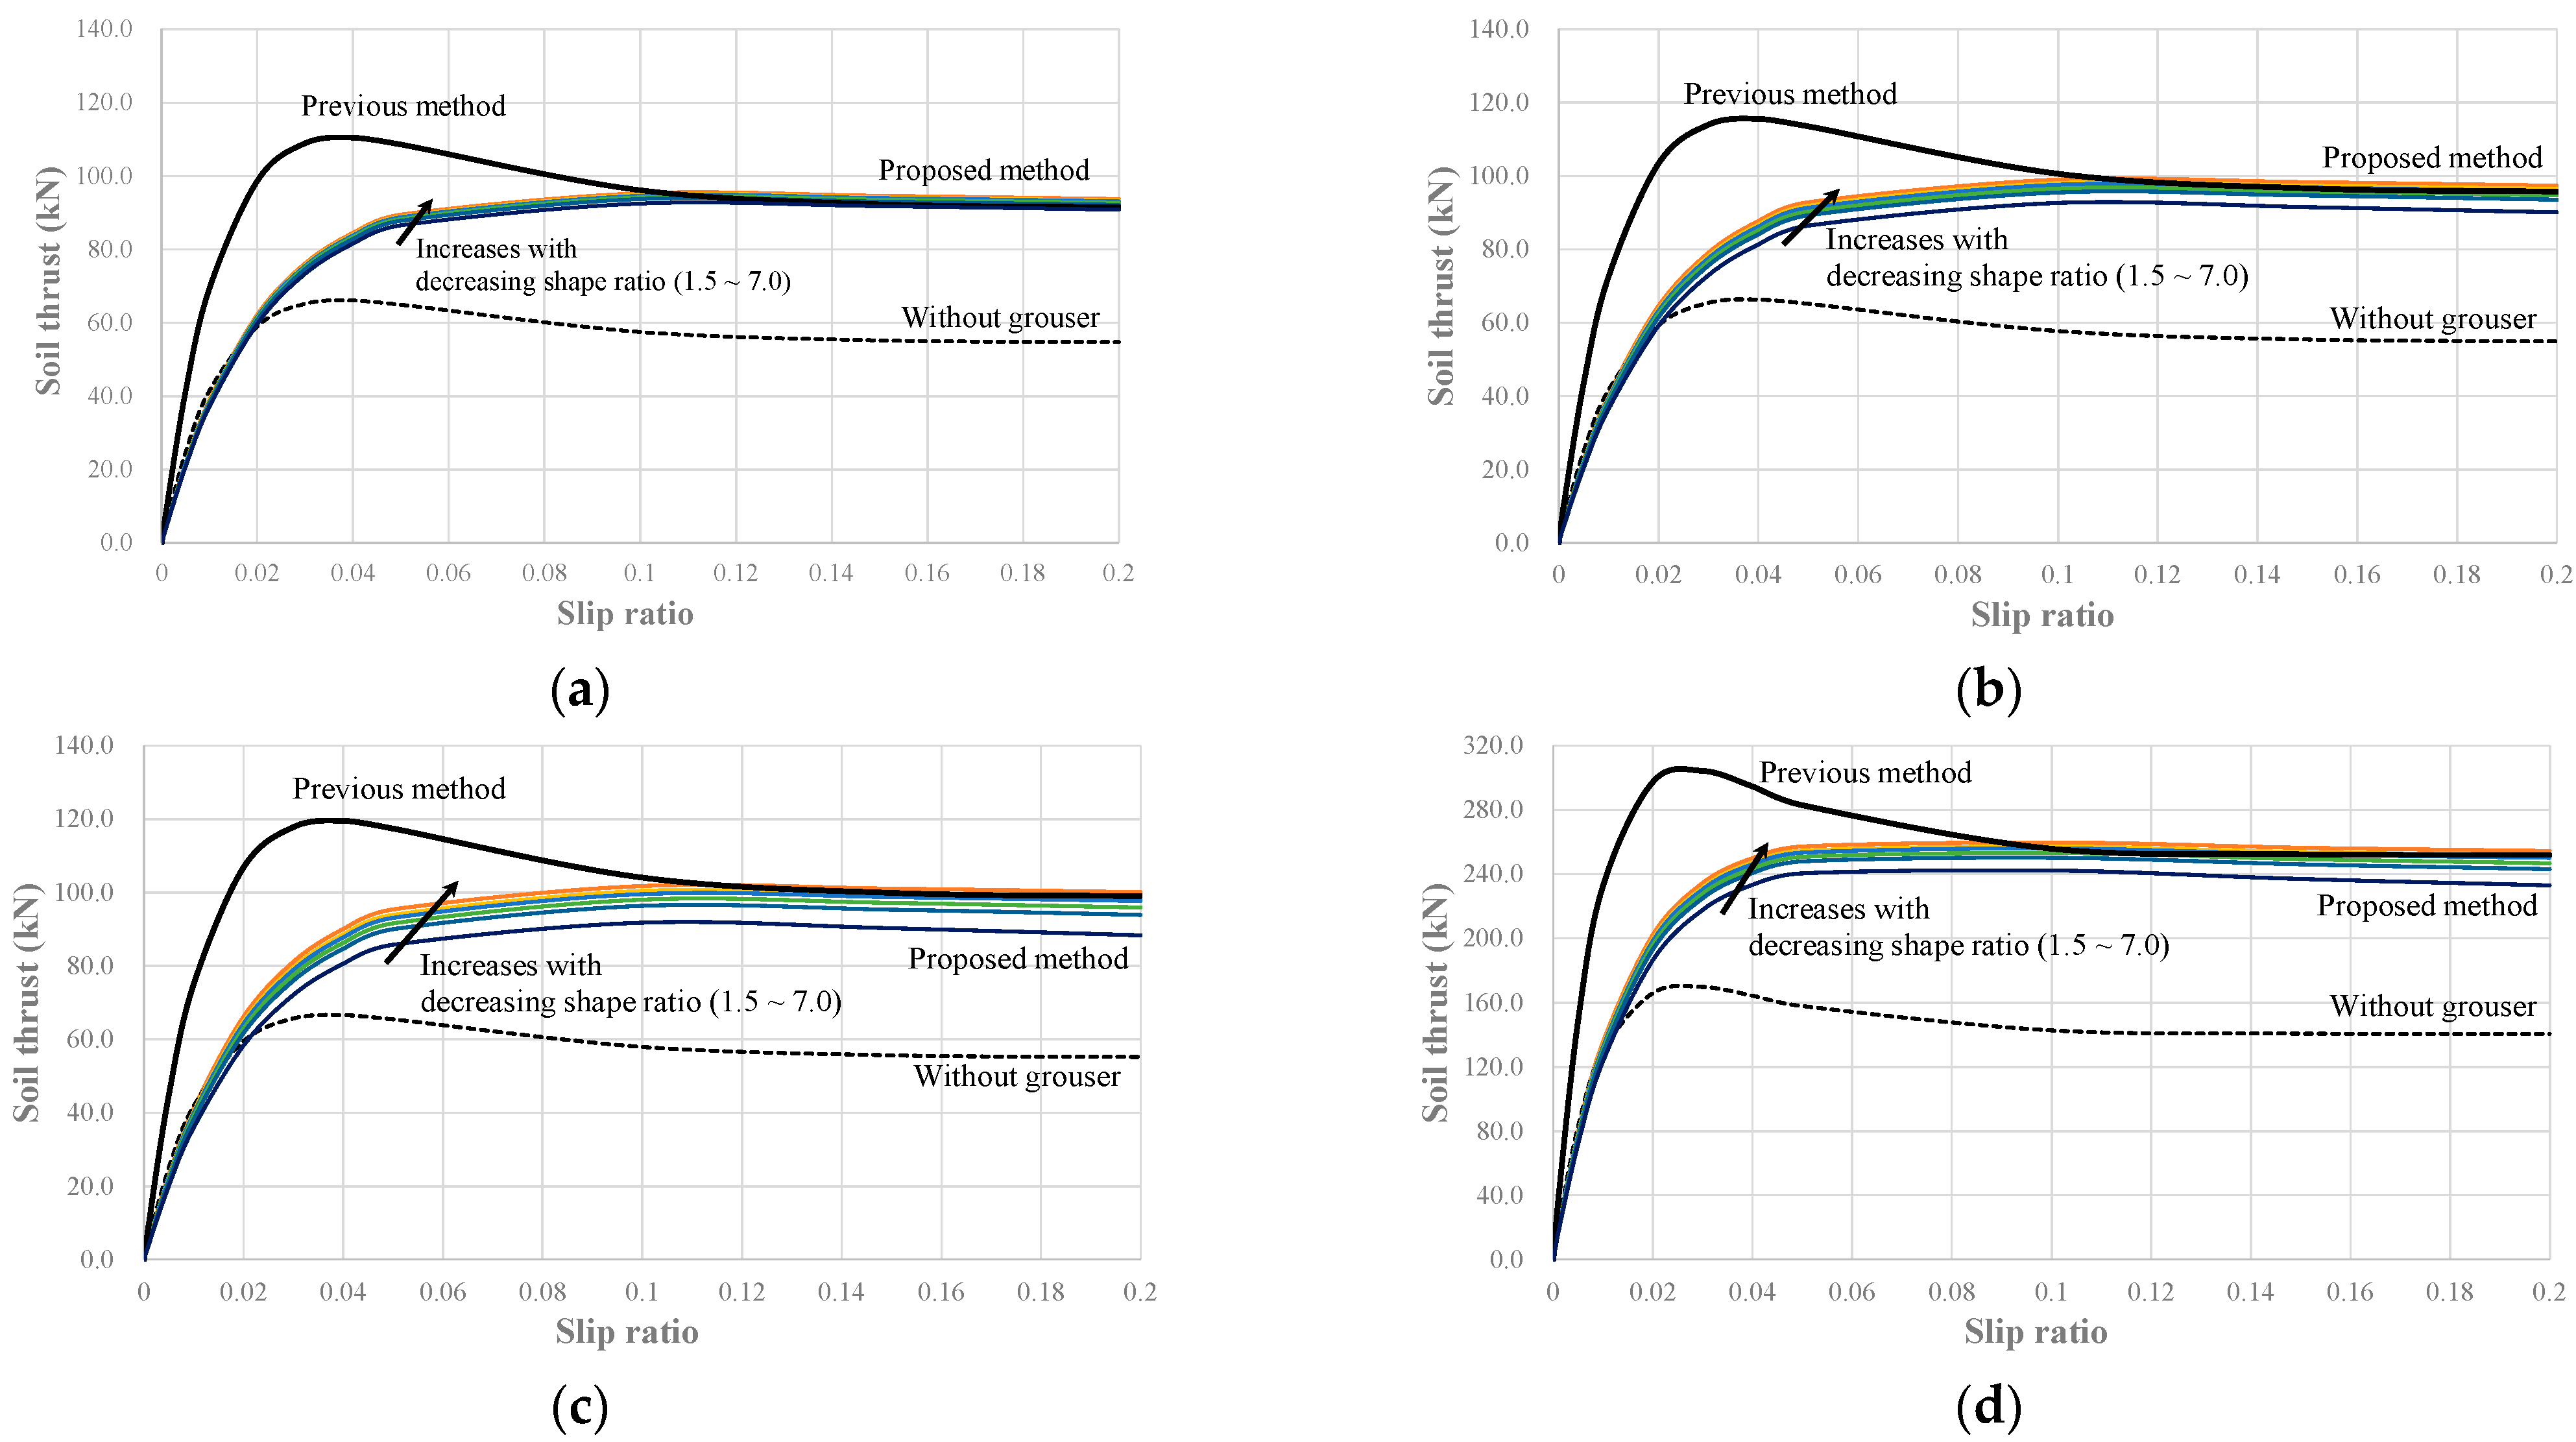
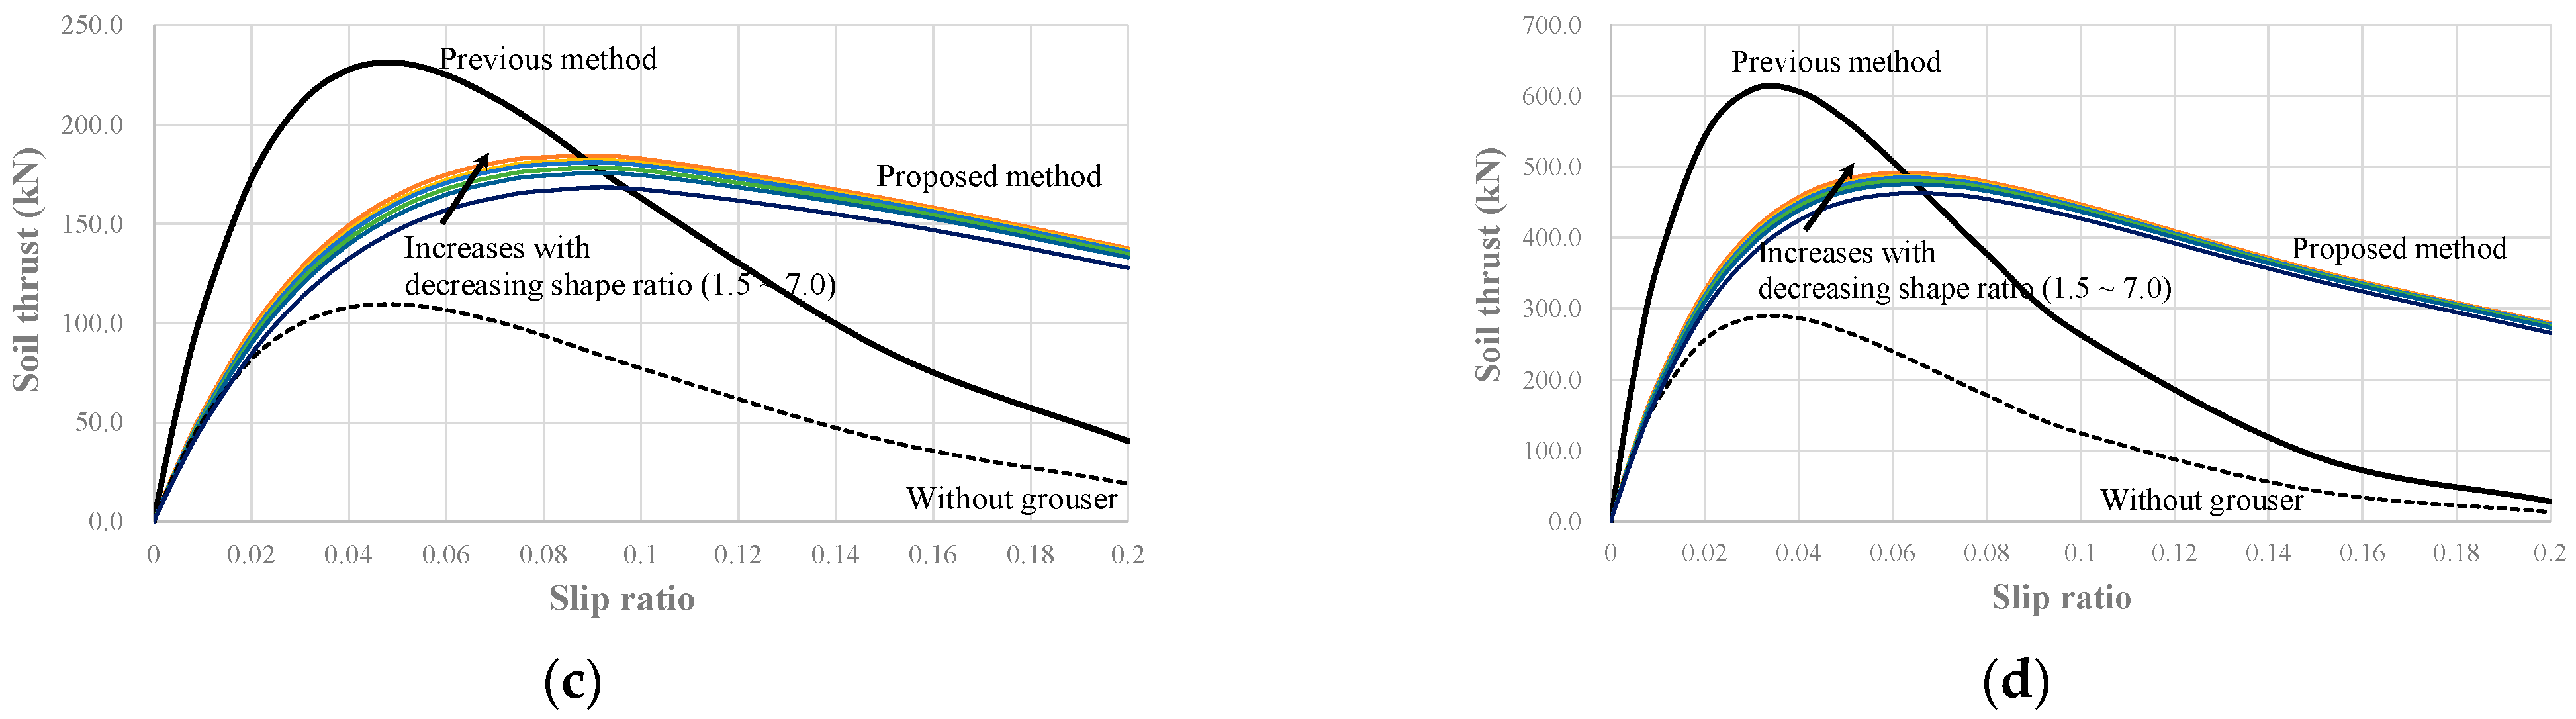
Figure 10.
Soil thrust and slip displacement curves in soils exhibiting a hump behavior (c = 5.9 kPa, , Kh = 16.4): EC145E with a grouser height of (a) 25 mm (b) 50 mm (c) 70 mm (d) EC380E with 70 mm grouser height.
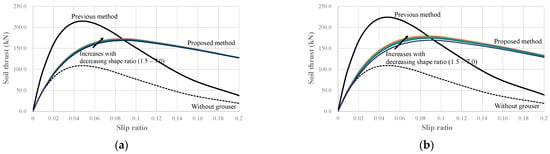
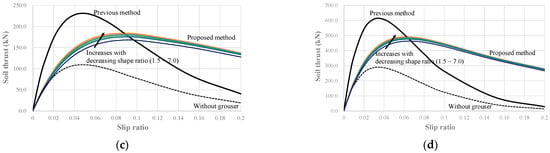
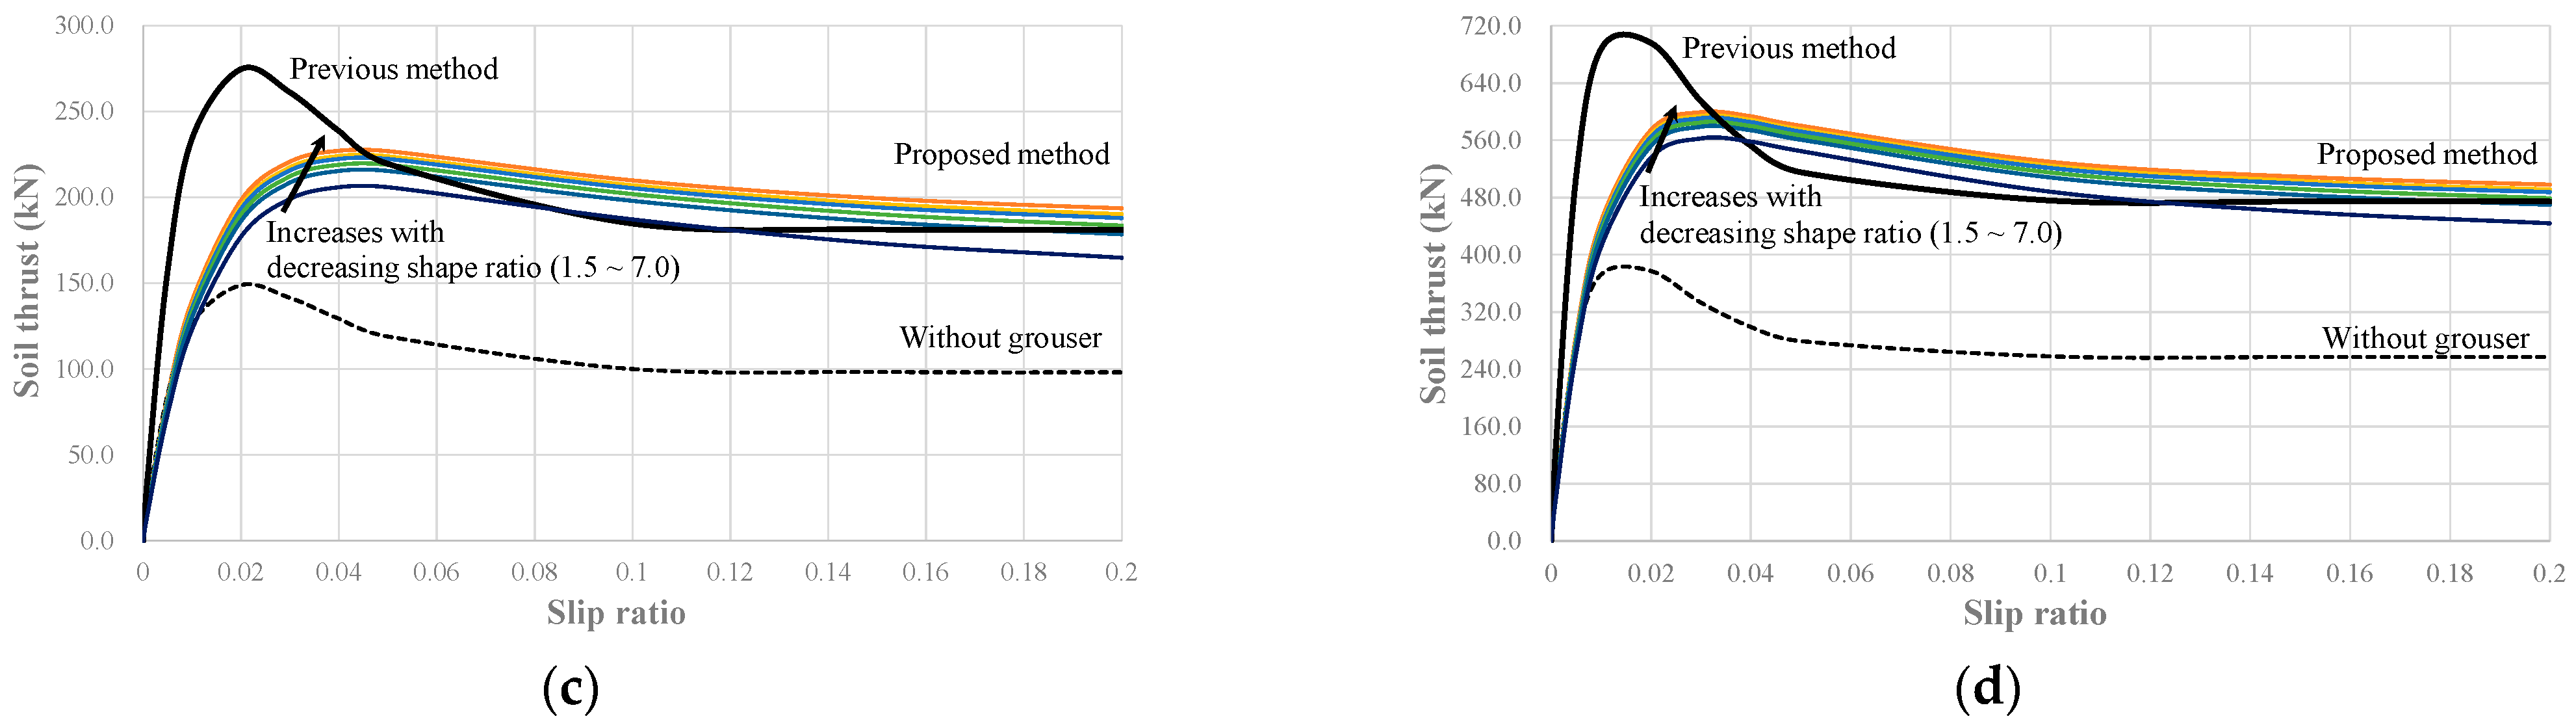
Figure 11.
Soil thrust and slip displacement curves in soils exhibiting a hump behavior (c = 2.3 kPa, , Kh = 14.4): EC145E with a grouser height of (a) 25 mm (b) 50 mm (c) 70 mm (d) EC380E with 70 mm grouser height.
As can be seen from Figure 6, Figure 7, Figure 8, Figure 9, Figure 10 and Figure 11, the total soil thrust developed at a specific slip ratio increases with attached grousers, meaning that the tractive performance of the off-road vehicle is improved. This is because the grouser converts the shear between the material of the track and the soil into shear between the soils, increasing the shear force. In addition, the grouser generates additional soil thrust on the side of the track (i.e., side thrust). In both methods, the total soil thrust increased as the shear strength parameters of soil (i.e., c and ) and the grouser height increased, showing good agreement with Kim et al. [28]. EC380E weighed more and had larger continuous tracks than EC145E, so EC380E produced a greater soil thrust under the same conditions (soil and grouser conditions). This is because the vertical stress (σv’) and the shear area (l and w) of the soil-track interface increase with the weight of the vehicle and the size of the continuous track, respectively.
The relationship between total soil thrust and slip ratio differed between the existing and proposed method. In all three types of soils, the existing method exhibited a greater maximum soil thrust at a lower slip ratio than the proposed method. After the peak value (i.e., the maximum soil thrust of the soil exhibiting softening behavior and hump behavior), the soil thrust decreased dramatically in the existing method, whereas the soil thrust slightly decreased in the proposed method.
When the soil shows a hardening behavior, the total soil thrust in the existing method is always greater than that in the proposed method (Figure 6 and Figure 7). This is because, in the case of hardening behavior, the soil thrust increases gradually and converges to the maximum value. The existing method calculates the total soil thrust based on the rear end where the largest slip displacement (and the largest soil thrust) is generated; whereas the proposed method considers the difference in the slip displacement and soil thrust according to the location of the soil-track interface. For example, when calculating the total soil thrust, the existing method considers the first grouser (see Figure 2) from the direction the vehicle travels. However, since the slip displacement (and the soil thrust) at the first grouser is zero, the proposed method does not consider the first grouser.
On the other hand, when the soil shows softening behavior or hump behavior, the total soil thrust predicted by the existing method is greater than that calculated by the proposed method until a specific slip ratio, after which the latter becomes greater (Figure 8, Figure 9, Figure 10 and Figure 11). This is because, in the case of softening or hump behaviors, the soil thrust increases gradually and then decreases when the maximum soil thrust is exceeded. At a low slip ratio, the slip displacement along the entire soil-track interface is not likely to exceed the value required to develop the maximum soil thrust; the total soil thrust in the existing method is greater than that in the proposed method. However, at a high slip ratio, the slip displacement at the rear is likely to exceed the value required to develop the maximum soil thrust, but the slip displacement at the front is not sufficient to develop the maximum soil thrust (Figure 2). The existing method calculates the total soil thrust based on the rear end where the largest slip displacement occurs; at a high slip ratio, the total soil thrust decreases dramatically. In contrast, the proposed method considers the difference in slip displacement (and soil thrust) according to the location of the soil-track interface, so the reduction in total soil thrust is relatively small. This phenomenon was more obviously observed when the shear deformation constants (i.e., Kw and Kh) were large. As the shear deformation constants represent the slip displacement required to develop the maximum soil thrust, the large shear deformation constants delay the reduction of total soil thrust in the proposed method.
In addition, the existing method does not consider the difference in soil thrusts with shape ratio (that is, change in the grouser spacing) under the same grouser height. In contrast, the soil thrust calculated using the proposed method differed not only according to the height of the grouser but also according to the shape ratio. As shown in Figure 6, Figure 7, Figure 8, Figure 9, Figure 10 and Figure 11, when the heights of the grousers are the same, the total soil thrust increases as the shape ratio decreases (i.e., the grouser spacing between adjacent grousers becomes narrower). This is described in more detail in the next subsection, including quantitative analysis.
5.2. Maximum Soil Thrust According to the Shape of the Grouser
The shape ratio has a significant impact on the tractive performance of an off-road tracked vehicle [1,26]. In this study, the total soil thrust of continuous track on which the grousers with different shape ratio (1.5, 2.0, 2.5, 3.0, 4.0, 5.0, and 7.5) were attached was calculated to evaluate the effect of the grouser shape ratio on the total soil thrust. For quantitative analysis, the maximum soil thrust of the continuous track with grousers was normalized with the maximum soil thrust of the continuous track without grousers (i.e., the peak values of the soil thrust and slip displacement curves). Since the existing method did not consider the difference in soil thrust according to the grouser shape ratio, only the proposed method was used for the analysis. Also, the trend of the normalized maximum soil thrust and shape ratio was not affected by the shear strength parameters and shear deformation constants of soil. Therefore, the results of using the peak values of Figure 7, Figure 9, and Figure 11 are representatively presented.
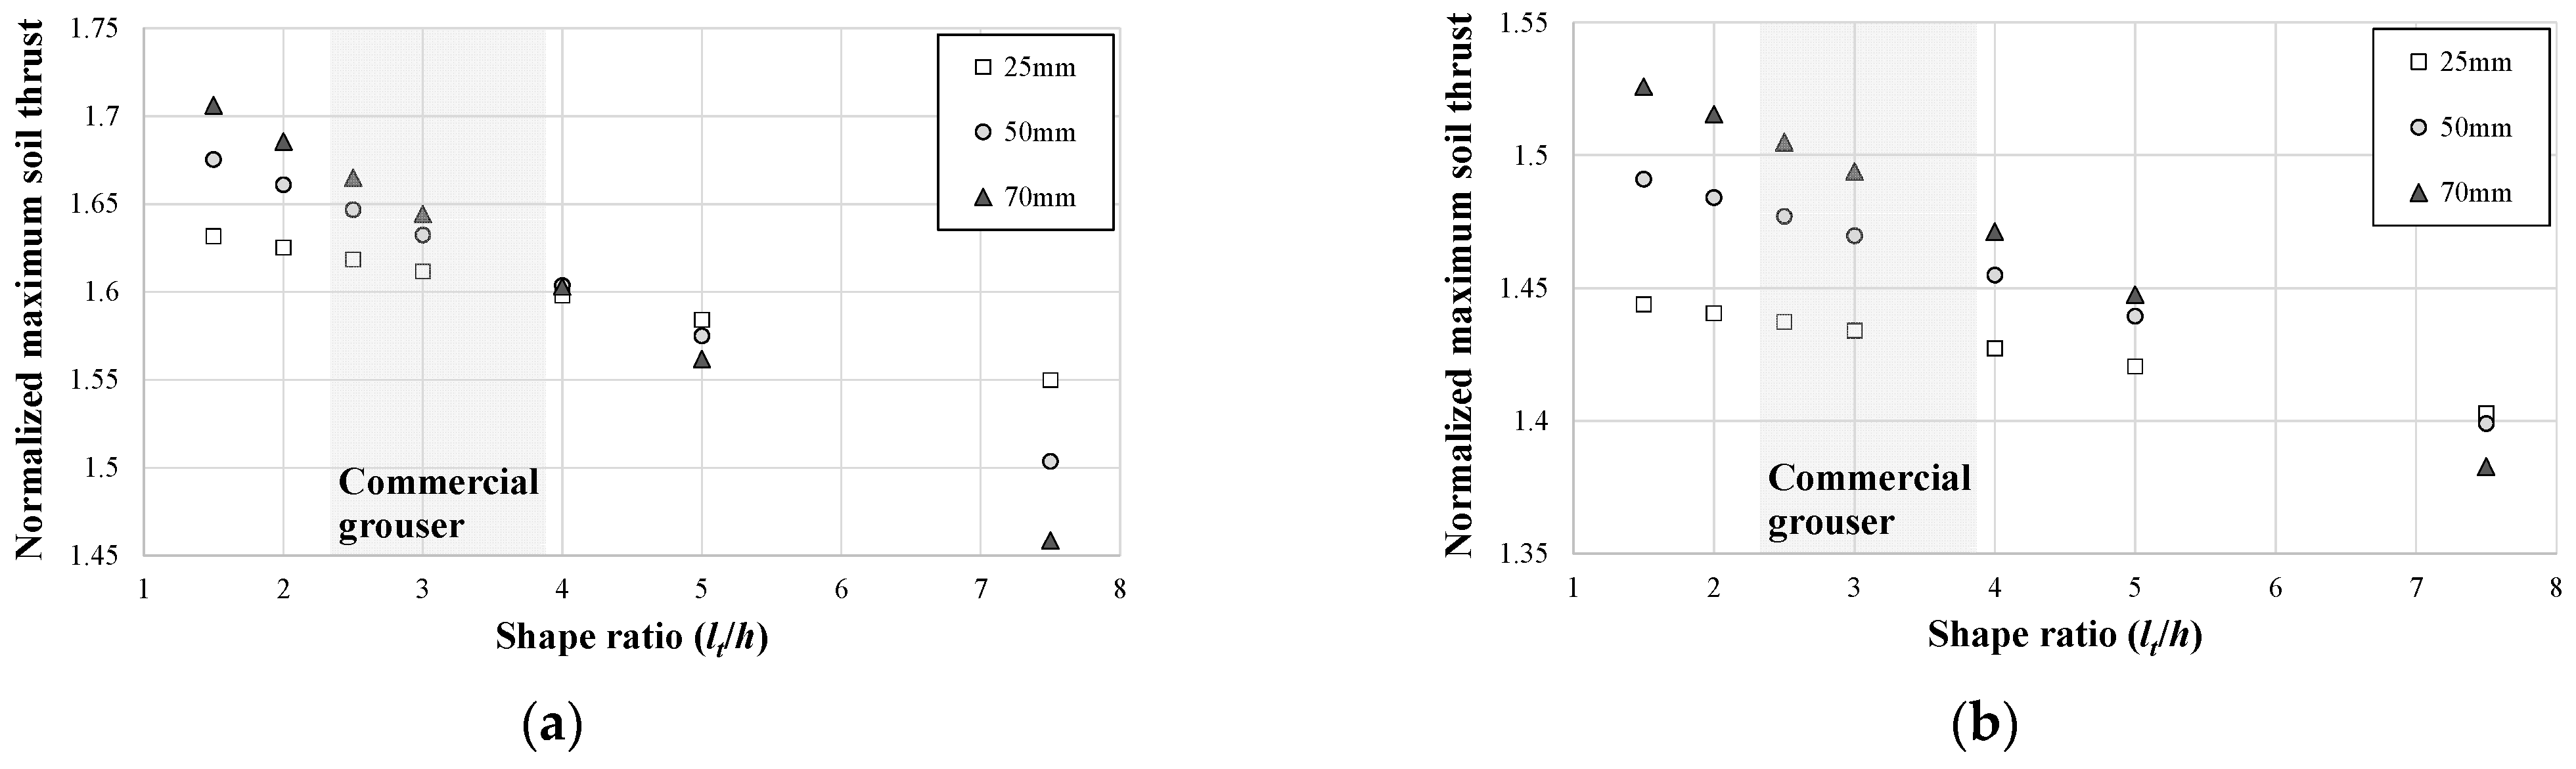
The normalized maximum soil thrusts according to the grouser shape ratio are shown in Figure 12 and Figure 13. The soil thrust of the continuous track with grousers was always greater than that without grousers (approximately 1.44–1.71 times). Under the same conditions, the highest normalized maximum soil thrust (i.e., the rate of increase of soil thrust owing to grouser) was observed in the soil with hardening behavior and the smallest was observed in the soil with softening behavior. In general, hardening and softening behaviors occur mainly in loose and dense soils, respectively [25]. Hence, it was predicted that the increase in soil thrust realized by grousers would be more pronounced in loose soil.
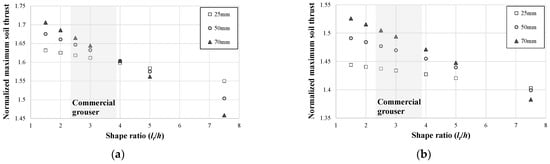
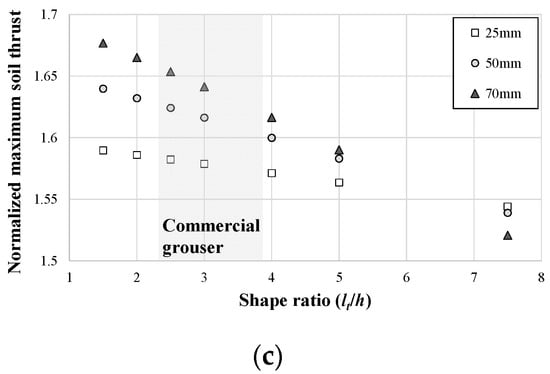
Figure 12.
Normalized maximum soil thrust and shape ratio relationships of EC145E: (a) hardening behavior, (b) softening behavior and (c) hump behavior.
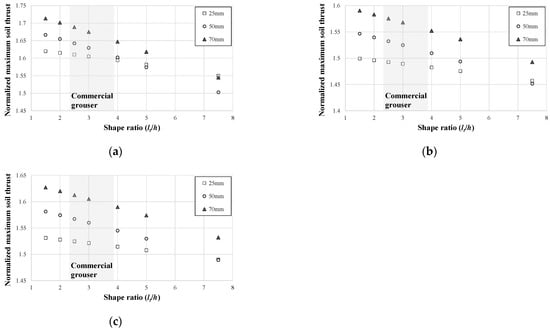
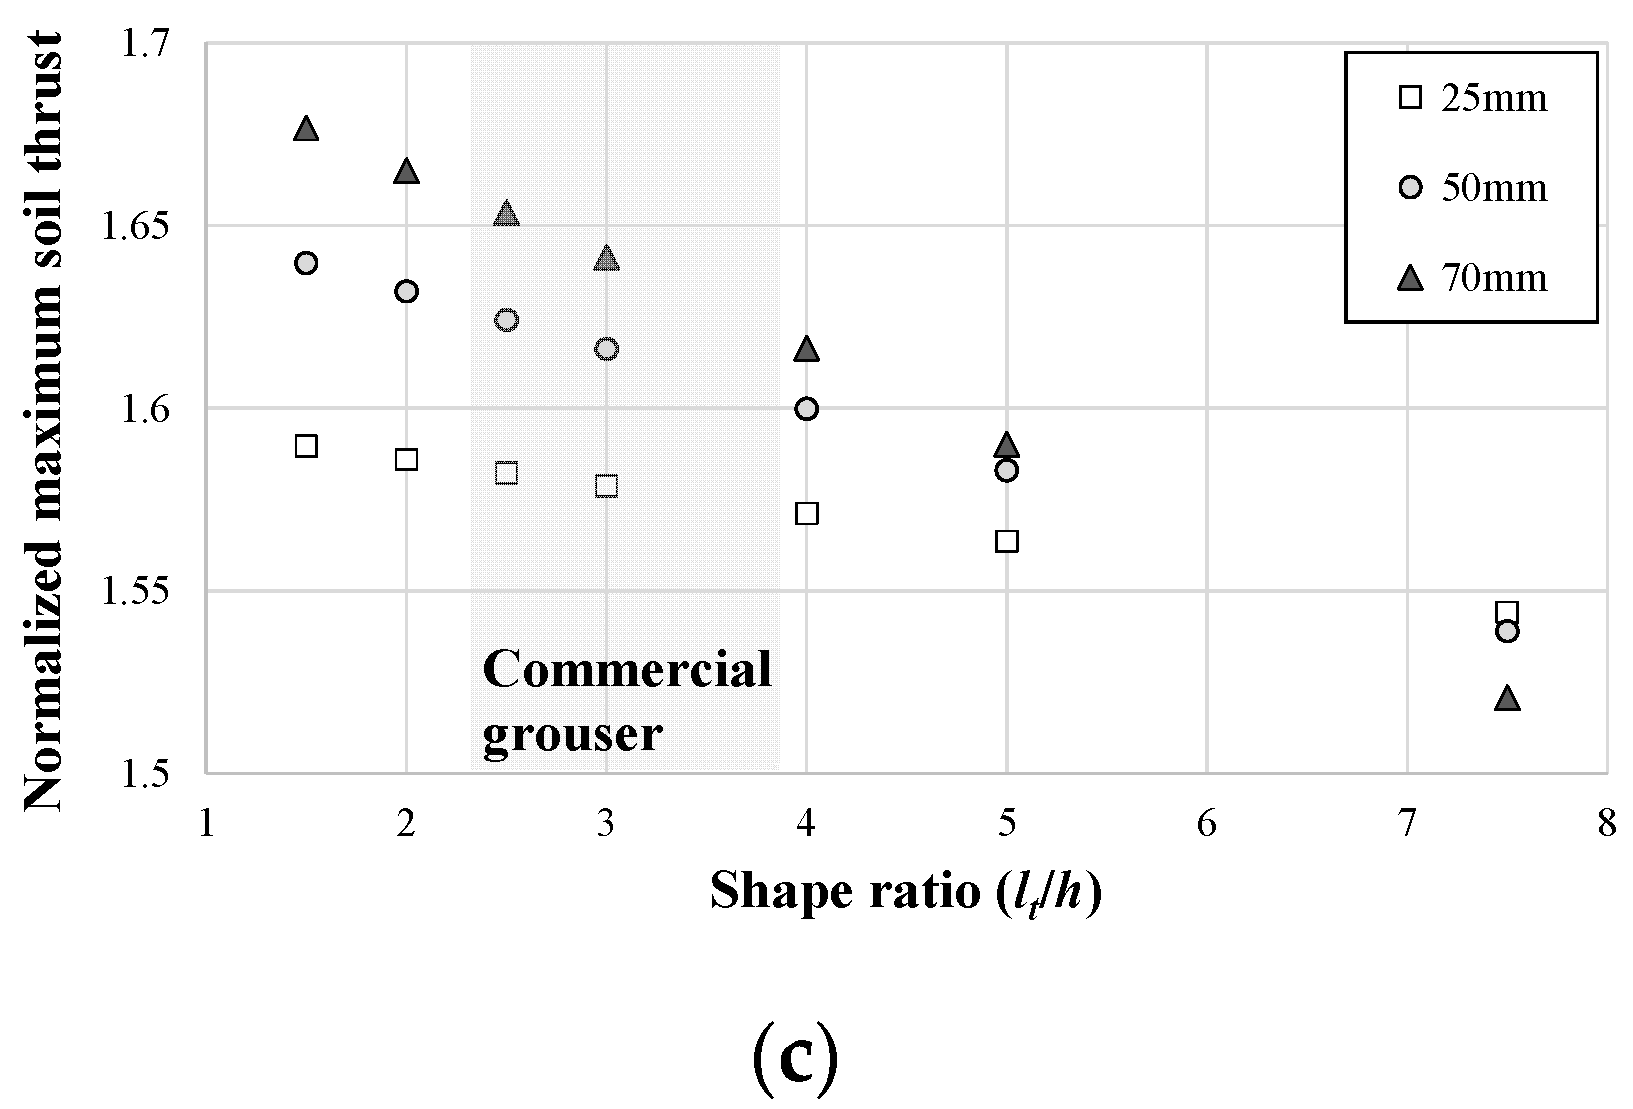
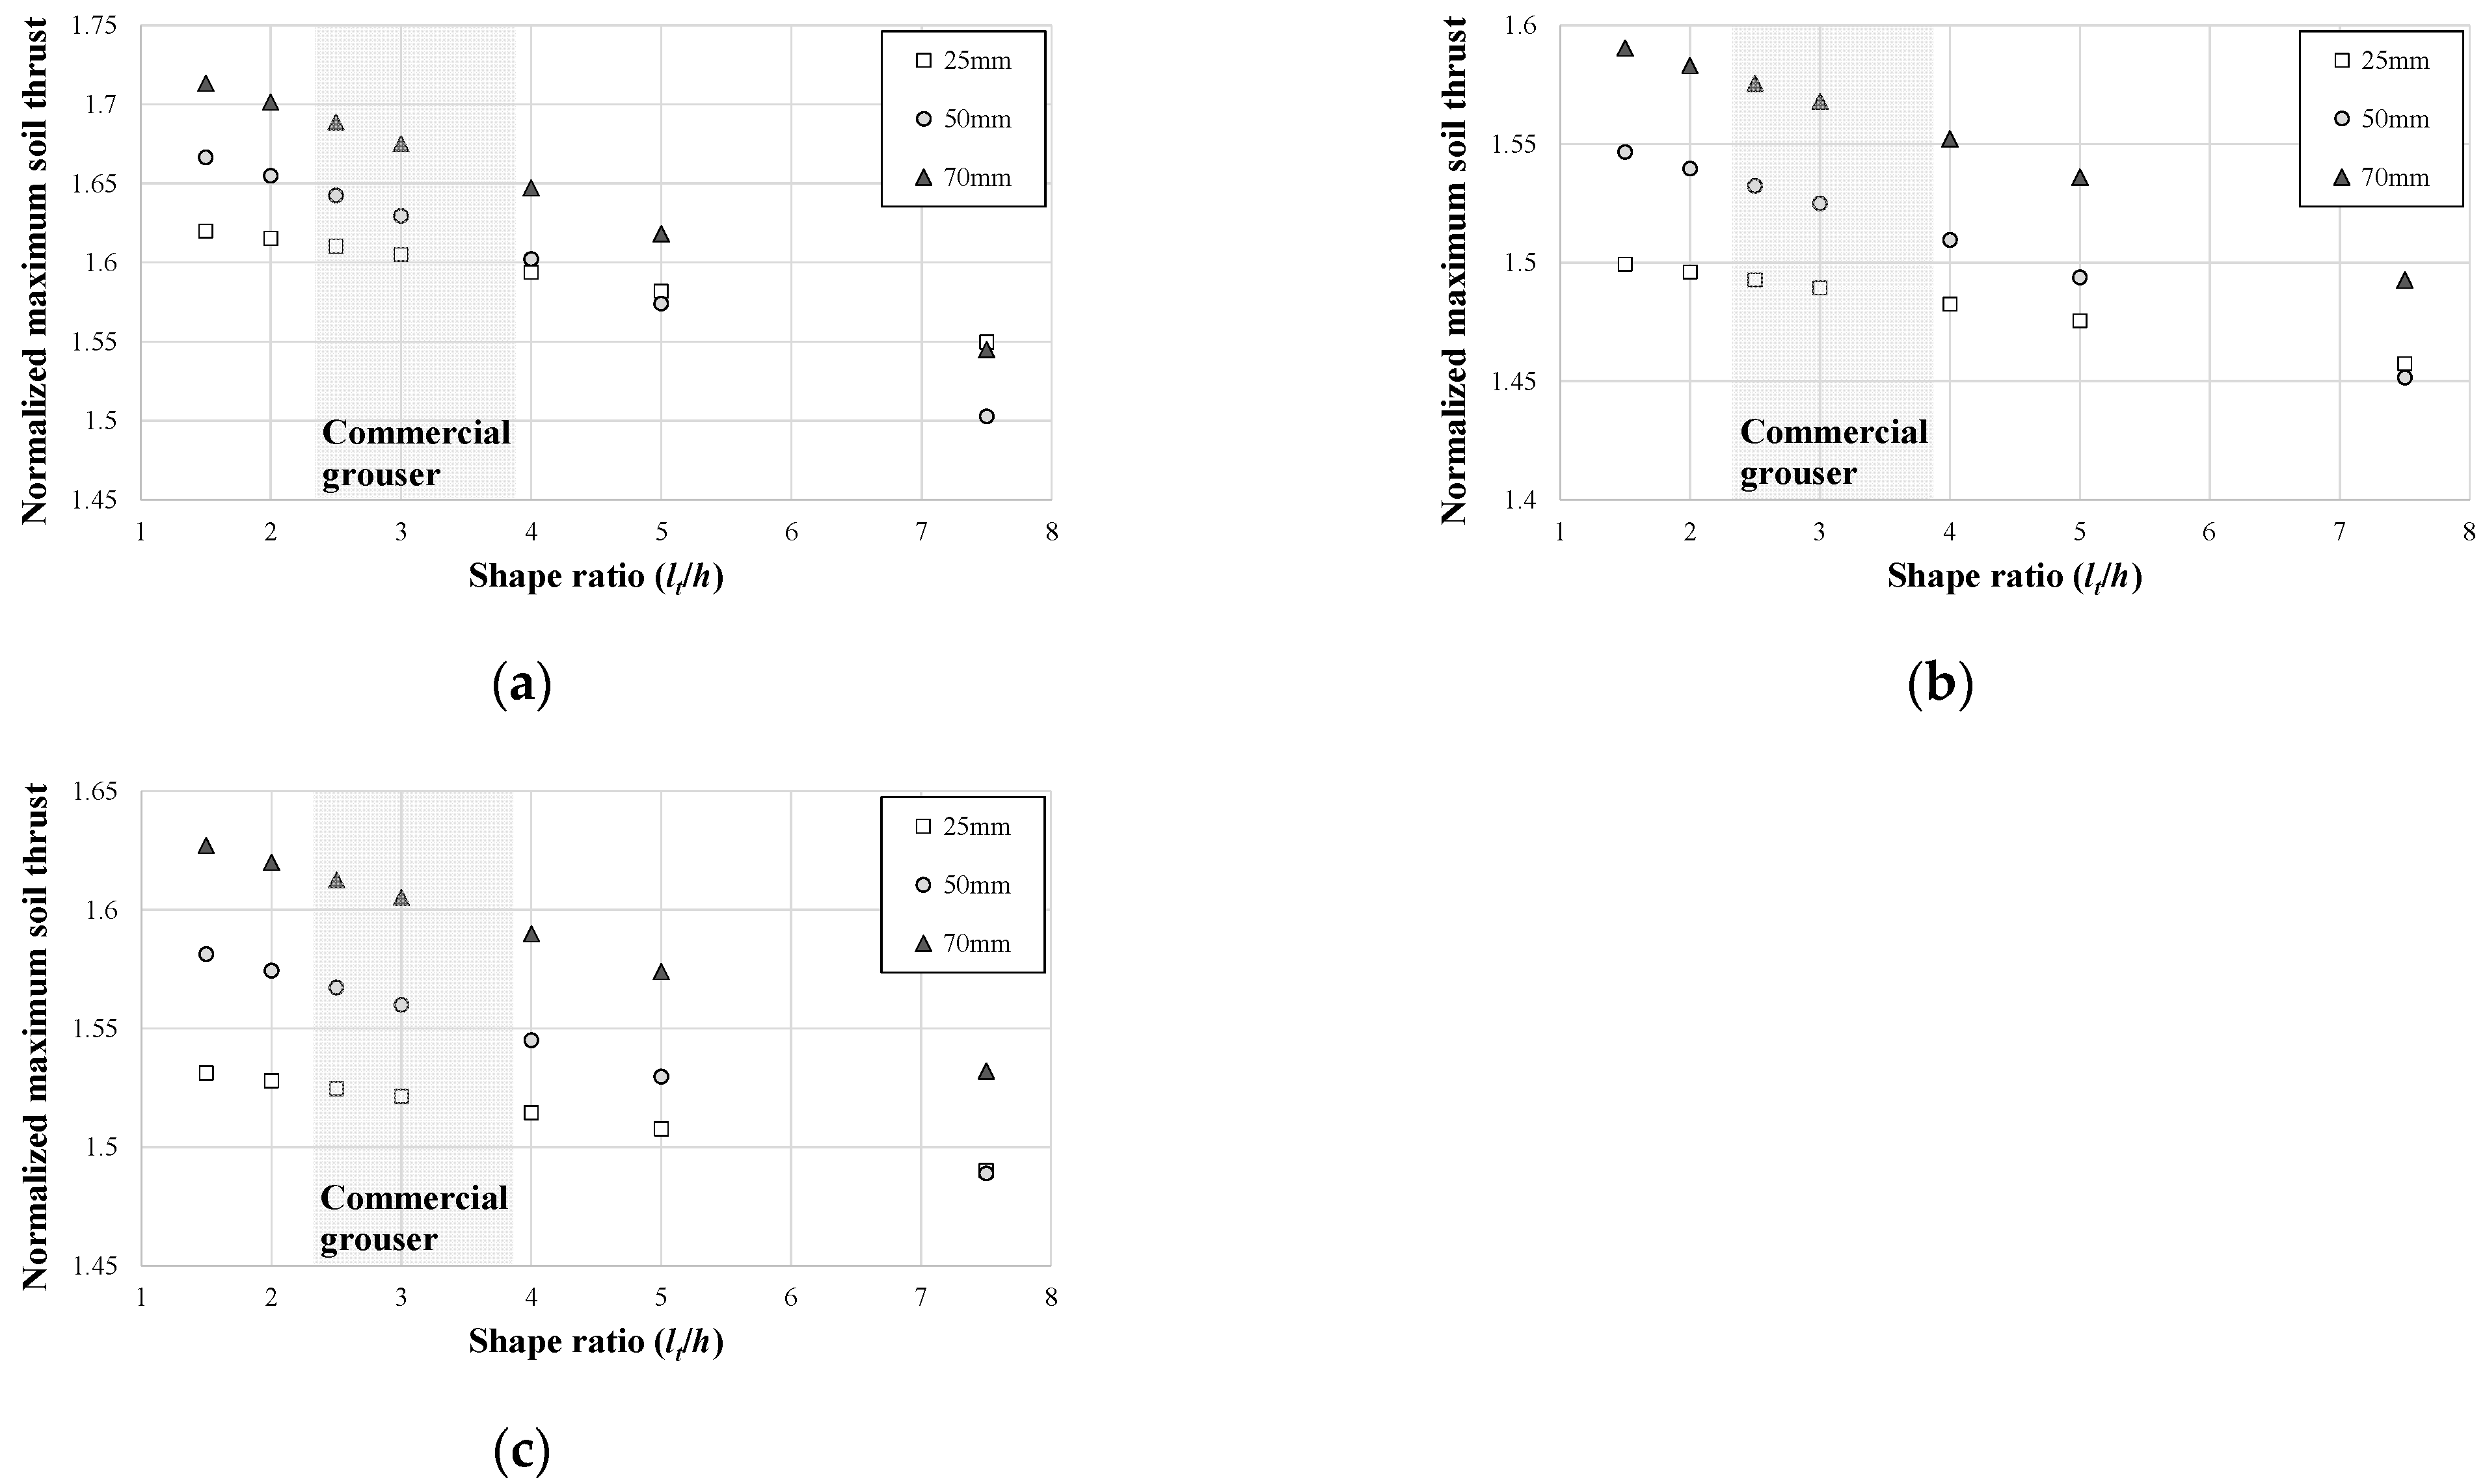
Figure 13.
Normalized maximum soil thrust and shape ratio relationships of EC380E: (a) hardening behavior, (b) softening behavior and (c) hump behavior.
As mentioned above, in all three soil types, the total soil thrust increased as the shape ratio decreased under the same height. This is because the sizes of the soil blocks formed between the grousers decreased as the grouser spacing decreased; hence, even at a low slip ratio (that is, even if only a small slip displacement occurs), a large soil thrust is developed in each soil block. Also, the longer the grouser height, the greater the side thrust, which increases the total soil thrust. However, when the grouser shape ratio was 7.5, the increase in the total soil thrust with a longer grouser was smaller. This is because the grouser spacing increases when both shape ratio and height of the grouser increase. Consequently, the two opposing effects (an increase in soil thrust due to an increase in grouser height and a decrease in soil thrust due to an increase in grouser spacing) are offset.
Additionally, the shape ratios of commonly used commercial grousers (approximately 2.3–3.9) are shown in Figure 12 and Figure 13. For commercial grousers, as the grouser height increases and the shape ratio decreases (that is, the grouser spacing decreases), the total soil thrust of the off-road tracked vehicle significantly increases.
6. Conclusions
In this study, a new total soil thrust assessment method for a grouser-attached off-road tracked vehicle was proposed based on the block-shaped failure mechanism [5,6,7,8,9,10]. The following conclusions were obtained.
- (1)
- Attaching the grouser increases the total soil thrust at a specific slip ratio and improves tractive performance of the off-road tracked vehicle. This is because the grouser converts the shear between the material of the track and the soil into shear between the soils and generates additional soil thrust on the side of the track (i.e., side thrust).
- (2)
- The total soil thrust-slip ratio relationship of the off-road tracked vehicle differed between the existing method and the proposed method significantly. The existing method showed a greater maximum soil thrust at a lower slip rate than the proposed method. When the soil shows a hardening behavior, the total soil thrust in the existing method is always greater than that in the proposed method. When the soil shows softening behavior or hump behavior, the total soil thrust predicted by the existing method is greater than that calculated by the proposed method until a specific slip ratio, after which the latter becomes greater.
- (3)
- The existing method does not consider the difference in soil thrusts with shape ratio (that is, change in the grouser spacing) under the same grouser height. In contrast, the soil thrust calculated using the proposed method differed not only according to the height of the grouser but also according to the shape ratio. As the grouser height increases and the shape ratio decreases (i.e., the grouser spacing decreased), the total soil thrust of the off-road tracked vehicle increases significantly. However, when the grouser aspect ratio was 7.5, the increase in the total soil thrust realized by longer grousers is smaller.
The results of this study are expected to be useful for evaluating the tractive performance of a grouser-attached off-road tracked vehicle. With the proposed method, the soil thrust of a continuous track can be properly predicted considering the independent shearing of soil blocks at the soil-track interface demonstrated in recent experimental works [5,6,7,8,9,10]. However, it should be noted that the total soil thrust assessment method proposed in this study follows the scope of previous studies [5,6,7,8,9,10]. Caution should be exercised when assessing the soil thrust on different types of soil (e.g., cohesive soil or highly compressible soils) whose shearing characteristics are completely different from those of granular soil or mixed soil. Also, the soil beneath tracks for high-speed operations is subject to a dynamic load; the soil thrust may be developed in different ways. Further experimental work performed under various operating conditions is necessary to validate the outcomes of this study, including full scale testing.
Author Contributions
Conceptualization, S.-H.B.; methodology, S.-H.B.; validation, T.B. and J.C.; formal analysis, G.-B.S.; investigation, S.-H.B. and G.-B.S.; writing—original draft preparation, S.-H.B.; writing—review and editing, G.-B.S. and T.B.; visualization, S.-H.B. and G.-B.S.; supervision, T.B.; funding acquisition, J.C. All authors have read and agreed to the published version of the manuscript.
Funding
This research was conducted with the support of the “National R&D Project for Smart Construction Technology (No. 22SMIP-A158708-03)” funded by the Korea Agency for Infrastructure Technology Advancement under the Ministry of Land, Infrastructure and Transport, and managed by the Korea Expressway Corporation.
Data Availability Statement
The data presented in this study are available on request from the corresponding author.
Acknowledgments
Construction Engineering Research Institute at Hankyong National University provided research facilities for this work.
Conflicts of Interest
The authors declare no conflict of interest.
References
- Yong, R.N.; Fattah, E.A.; Skiadas, N. Vehicle Traction Mechanics; Elsevier: Amsterdam, The Netherlands, 1984. [Google Scholar]
- Wong, J.Y.; Huang, W. “Wheels vs. tracks”—A fundamental evaluation from the traction perspective. J. Terramech. 2006, 43, 27–42. [Google Scholar] [CrossRef]
- Wong, J.Y. Terramechanics and Off-Road Vehicle Engineering; Elsevier: Amsterdam, The Netherlands, 1989. [Google Scholar]
- Bekker, M.G. Theory of Land Locomotion; University of Michigan Press: Ann Arbor, MI, USA, 1956. [Google Scholar]
- Grečenko, A. Compression-Sliding approach: Dependence of transitional displacement of a driving element on its size and load. J. Terramech. 2011, 48, 325–332. [Google Scholar] [CrossRef]
- Ge, J.; Wang, X.; Kito, K.; Nakashima, H. Effect of grouser height on tractive performance of single grouser shoe under different moisture contents soil. Int. J. Eng. Technol. 2015, 7, 1414–1423. [Google Scholar]
- Baek, S.H. Assessment of the Soil Thrust for Off-Road Tracked Vehicles Based on Soil-Track Interaction Theory. Ph.D. Thesis, Seoul National University, Seoul, Korea, 2018. [Google Scholar]
- Baek, S.H.; Shin, G.B.; Chung, C.K. Assessment of the side thrust for off-road tracked vehicles based on the punching shear theory. J. Terramech. 2018, 79, 59–68. [Google Scholar] [CrossRef]
- Baek, S.H.; Kim, J.Y. Applicability of the 1g similitude law to the physical modeling of soil-track interaction. J. Terramech. 2019, 85, 27–37. [Google Scholar] [CrossRef]
- Shin, G.B.; Baek, S.H.; Park, K.H.; Chung, C.K. Investigation of the soil thrust interference effect for tracked unmanned ground vehicles (UGVs) using model track tests. J. Terramech. 2020, 91, 117–127. [Google Scholar] [CrossRef]
- Janosi, Z.; Hanamoto, B. The analytical determination of drawbar pull as a function of slip for tracked vehicles in deformable soils. In Proceedings of the International Society for Terrain-Vehicle Systems, The 1st International Conference, Torino, Italy, 12–16 June 1961. [Google Scholar]
- Wong, J.Y. Evaluation of soil Strength Measurements; NRCC Report No. 22881; National Research Council of Canada: Ottawa, ON, Canada, 1983.
- Wong, J.Y.; Preston-Thomas, J. On the characterization of the pressure-sinkage relationship of terrain. J. Terramech. 1983, 19, 107–127. [Google Scholar] [CrossRef]
- Wong, J.Y. Review of “Soil mechanics for off-road vehicle engineering”. Can. Geotech. J. 1979, 16, 624–626. [Google Scholar] [CrossRef]
- Rohrbach, S.E.; Jackson, G.H. Tracked Vehicle Tractive Performance Prediction–A Case Study in Understanding the Soil/Tool Interface; No. 820655; SAE Technical Paper; SAE: Warrendale, PA, USA, 1982. [Google Scholar]
- Baek, S.H.; Shin, G.B.; Chung, C.K. Experimental study on the soil thrust of underwater tracked vehicles moving on the clay seafloor. Appl. Ocean. Res. 2019, 86, 117–127. [Google Scholar] [CrossRef]
- Woo, S.I.; Baek, S.H. Upper-Bound Analysis for Soil Thrust of Single-Track System over Clay Ground. Int. J. Geomech. 2020, 20, 06019023. [Google Scholar] [CrossRef]
- Reece, A.R. Problems of Soil-Vehicle Mechanics; Army Tank-Automotive Center: Warren, MI, USA, 1964. [Google Scholar]
- Lyasko, M. Slip sinkage effect in soil-vehicle mechanics. J. Terramech. 2010, 47, 21–31. [Google Scholar] [CrossRef]
- Baek, S.H.; Shin, G.B.; Lee, S.H.; Yoo, M.; Chung, C.K. Evaluation of the slip sinkage and its effect on the compaction resistance of an off-road tracked vehicle. Appl. Sci. 2020, 10, 3175. [Google Scholar] [CrossRef]
- Rehman, Z.U.; Luo, F.; Wang, T.; Zhang, G. Large-scale test study on the three-dimensional behavior of the gravel–concrete interface of a CFR dam. Int. J. Geomech. 2020, 26, 04020046. [Google Scholar] [CrossRef]
- Pang, R.; Xu, B.; Zhou, Y.; Song, L. Seismic time-history response and system reliability analysis of slopes considering uncertainty of multi-parameters and earthquake excitations. Comput. Geotech. 2021, 136, 104245. [Google Scholar] [CrossRef]
- Rehman, Z.U.; Zhang, G. Cyclic behavior of gravel–steel interface under varying rotational shear paths. Can. Geotech. J. 2021, 58, 305–316. [Google Scholar] [CrossRef]
- Pang, R.; Xu, B.; Kong, X.; Zou, D.; Zhou, Y. Seismic reliability assessment of earth-rockfill dam slopes considering strain-softening of rockfill based on generalized probability density. Soil Dyn. Earthq. Eng. 2019, 107, 96–107. [Google Scholar] [CrossRef]
- Lambe, T.W.; Whitman, R.V. Soil Mechanics; John Wiley & Sons: Hoboken, NJ, USA, 1979. [Google Scholar]
- Park, Y.H. Interaction of Soils-Tracked Vehicle. Ph.D. Thesis, Seoul National University, Seoul, Korea, 1996. [Google Scholar]
- Bekker, M.G. Introduction to Terrain-Vehicle Systems; University of Michigan Press: Ann Arbor, MI, USA, 1969. [Google Scholar]
- Kim, H.W.; Hong, S.; Choi, J.S.; Lee, T.H. An experimental study on tractive performance of tracked vehicle on cohesive soft soil. In Proceedings of the 5th ISOPE Ocean Mining Symposium, Tsukuba, Japan, 15–19 September 2003. [Google Scholar]


Publisher’s Note: MDPI stays neutral with regard to jurisdictional claims in published maps and institutional affiliations. |
© 2022 by the authors. Licensee MDPI, Basel, Switzerland. This article is an open access article distributed under the terms and conditions of the Creative Commons Attribution (CC BY) license (https://creativecommons.org/licenses/by/4.0/).