Abstract
The use of information and communication technologies (ICT) in agriculture is far from their potential. In this article, we consider how to facilitate and systematize the process of transforming traditional agriculture into digital agriculture; Agriculture 4.0. Among the different technologies, we focus on the IoT aspects. In the article, we propose a new approach for the design of intelligent agricultural management and supervision systems. The proposed approach is illustrated as an example of application in the beekeeping sector. Indeed, this sector is affected by a crisis due to the disappearance of bees and the different actors need support to make their decisions. As an example of decisions that can be made, we can cite: treatment planning or policy planning. An architecture based on sensors and open data is proposed to help them make decisions. An implementation of it is shown; it is based on a device with sensors, as well as an interface to collect the data on beehives and show notifications and alerts to beekeepers. The proposed architecture is flexible, and it can be used in the context of different levels of technology maturity. The final objective is to develop a reusable architecture for Agriculture 4.0.
1. Introduction
Recently, the beekeeping industry has been threatened by a decline in the number of bee populations and a drop in production. Beekeepers grapple with many issues related to the health of bee colonies. Scientific work is focused on a deep understanding of the causes of these phenomena in order to help beekeepers make the right decisions []. In France, a study on the mortality rate of bee colonies during the winter of 2020–2021 was carried out with more than 13,000 participating beekeepers (Platform ESA. National survey on winter mortality of bee colonies, 2021. Accessed on 28 September 2022. https://siteweb.esa.inrae.fr/en/node/536). In general, the death rate is estimated at 24.8%.
According to a FranceAgremer (FranceAgrimer: The National Establishment of Agricultural and Sea Products) study [], sales of honey and derivatives (pollen, pure royal jelly, honey and royal jelly, etc.) in supermarkets are estimated in 2020 at 16,200 tons, an increase of nearly 11% compared to 2019. The increasing consumer interest is explained by the positive image of the product (healthy, natural, etc.). For more than 10 years, honey production in France has been increasing, but despite this, it is not enough to cover an increasingly strong demand. Consequently, France imports honey to fill the gap between consumption and production. The volumes of imported honey thus increased by 36% between 2010 and 2020 (6% in 2020).
It is now evident that environmental pollution and climate change are a great danger to our planet. Experts have confirmed that they pose a very dangerous threat to many species of terrestrial and marine fauna. However, the death of the bee population necessary for pollination is considered the most important warning for humans. According to FranceAgrimer (FranceAgrimer. Observatory of the production of honey and royal jelly, July 2022. Accessed on 28 September 2022. https://www.franceagrimer.fr/fam/content/download/69152/document/SYN-API-Observatoire_Miel_et_Gel%C3%A9e_Royale_2021.pdf?version=3), the total number of beekeepers has increased over the past 6 years and for the first year, the Observatory has highlighted a decline in the number of beekeepers in France. Thus, in 2021, there were 70,847 declared beekeepers, compared to 71,273 in 2020. Nevertheless, the number of beekeepers with more than 50 hives continues to grow (+288 beekeepers, or more than a 5% improvement). France has 5708 beekeepers with more than 50 hives.
A solution to tackle these issues is to connect and digitalize the beehives. Our goal is to help the beekeepers and decision-makers (politician, responsible for cooperative, etc.) to make their decisions and to supervise one or several beehives. These decisions could be from a day to a year. More specifically, beekeepers keep a record or journal of their hives. In this record, the beekeepers note the information about all treatments, handling, feeding, visits, harvesting of the honey, etc.
In addition, many applications in manufacturing systems require a combination of new technologies, resulting in the emergence of Industry 4.0. The most well-known technologies used by Industry 4.0 are IoT, Cloud Computing, Big data, and cyber-physical systems (CPS). CPS are mechanisms that allow monitoring through communication, data storage, and computational capabilities directly incorporated into objects []. More precisely, CPS has embedded software that uses sensors and actuators. To allow humans and software to communicate between them, standard interfaces have been developed. The use of data coming from sensors or from the network is supported by this software. They have storage and processing abilities.
Agriculture systems have the same challenges as those encountered by manufacturing systems. Theses challenges are related to their sizing, to the understanding of their mechanisms, to the improvement of their productivity, and to their performance evaluation. Theses challenges produce difficulties to make decisions for all the actors in the agriculture systems.
Digitalization processes are currently being increasingly introduced into various sectors of the national economy, including the agricultural sector []. Digital Transformation (DT) refers to the combination of digital technology and areas of the business to finally realize the transformation of the management model and business model []. Indeed, DT is often referred to either as evolution, or the creation of entire new business models in companies or business sectors []. Digitalization can be considered as part of DT []. It describes socio-technical processes and their impacts on human activities that result from the use of interconnected digital technologies []. DT is a convergence of hard (technology) and soft (people and businesses) forces and movements from which additional value emerges []. According to the authors, one of the disruptive technologies adopted in DT implementations is “IoT connected devices”. In the same way, the following categories were used for coding the DT []: Technologies, Management/Processes, and People. The authors also list the elements within each category. Among these elements, in this paper, we meanly use IoT (Technology) in order to create new services and products (Management/Processes) for workforce, stakeholders, and partners (People). Thus, our process respects the properties of the DT, with an implementation in beekeeping. As new services, we focus on the development of decision support systems. This new service allows us to improve the business models of the different actors and to help save the bees.
In our context, we depict a new approach to apply the DT in the beekeeping sectors and help the actors of this area to make their decisions. To this end, different proposals are made:
- A proposal of Maturity Model (MM) Levels for smart beehives;
- A proposal for analysing all the decisions that can be made in the beekeeping sectors using spatio-temporal matrix;
- A proposal of generic architecture that corresponds to the decisions analysed in the matrix.
The paper is structured as follows: Section 2 presents a synthetic review of work about smart agriculture and more specifically on beekeeping with a focus on IoT. Section 3 proposes a Maturity Model to categorize the digital maturity of smart beehive systems and presents classification of the literature on smart beehives following this Maturity Model. Section 4 depicts a spatio-temporal matrix to analyse the possible decision-making on smart beehives. Section 5 explains the global view and the generic architecture for the proposed smart beehives. An implementation is shown in the Section 6. Finally, Section 7 presents the conclusions and perspectives.
2. Context and Related Work
2.1. From Industry 4.0 to Agriculture 4.0
One of the main objectives of our approach is to facilitate the use of IT communication and information tools in agriculture. As an analogy to Industry 4.0, digital agriculture, smart agriculture, intelligent agriculture, or Agriculture 4.0 can be defined as a set of modern technologies that today meet the needs of communication, storage, automatism, computing, and security.
Industries, as well as researchers and decision-makers around the world, have increasingly called for a fourth industrial revolution to enter a new era of digital and connectivity [].
According to Danjou et al. [], 10 technology groups can be considered to implement Industry 4.0, such as cloud computing, IoT, CPS, and big data. The use of these technologies allows the transmission of information throughout the entire system and enables better control and monitoring. Practically, they are adapted to the operations in real time according to varying requirements and demand [].
From these concepts, we proposed to reuse them in the domain of Agriculture 4.0 (Figure 1) similar to Ref. [], who proposed a framework to manage traceability in Agriculture 4.0. Agriculture becomes a very important sector to apply the concept of CPS to []. In fact, the agriculture sector follows the industrial revolution and moves from traditional systems to the implementation of a full range of modern systems. These systems enable data management of the geographic information, production experiments, climate information, and other data. The beekeeping sector is obviously concerned by this revolution. Figure 1 shows the reuse of 10 technologies from Industry 4.0. The orange circles represent the technologies used in our project.
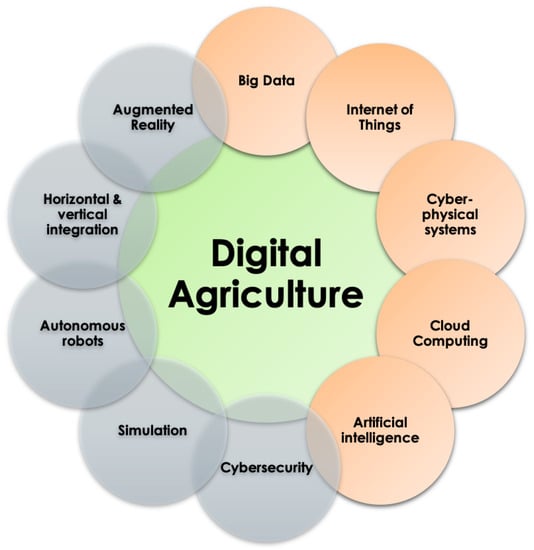
Figure 1.
Reuse of the 10 technologies of Industry 4.0.
In the context of our project and paper, we are only interested in five technologies:
- Internet of Things, because decisions need data collection done through connected objects like smart hives;
- Cyber-Physical System, a set of primordial principles that allow defining the hierarchy of decision makers and decision cycle;
- Big Data, because data is the most important thing on which decisions are based;
- Cloud computing, which refers to the delivery of resources and services on demand over the Internet, i.e., the access to data from different resources and high computing power via the internet. It is an important computing step that facilitates the deployment of intelligent systems;
- Artificial Intelligence: in fact, nowadays, artificial intelligence is a powerful tool that can be used to help users in the process of making decisions.
Among the concepts of the agriculture 4.0 presented in this section, the main concept used in this paper and our system is IoT. The next section presents this concept.
2.2. IoT for Digital & Green Agriculture
In an era of the Information Technology (IT) revolution, IoT is being utilized in various forms such as smart pills, personal devices, smart cities, robotics, smart monitoring devices, and real time monitoring systems. IoT can be explained by the ever growing interconnecting that connects hardware, computing devices, sensors, interfacing software, people of different networks, to exchange data and communication []. It facilitates and eases the process of communication and interaction between the elements connected through the network. The technology of IoT was derived from Radio Frequency Identification (RFID) and Wireless Sensor Networks (WSN) []. The data collected from RFID and WSN can be communicated easily to the different nodes of the interconnected sensors. The technology of IoT is being widely used in various devices such as home appliances, phones, gadgets, vehicles and other networking objects. Simply put, it means that all networking devices can be interconnected with each other globally for a real-time data exchange without the interference of human beings. IoT usage is growing rapidly in the IT industry, driven by the use of connected device applications. However, the COVID-19 pandemic will have a major impact on global IoT spending in 2022. IDC forecasts that global IoT spending will grow at a compound annual growth rate (CAGR) of 11.3% over the 2020–2024 forecast period (Worldwide Spending on the Internet of Things Will Slow in 2020 Then Return to Double-Digit Growth, According to a New IDC Spending Guide. https://www.idc.com/getdoc.jsp?containerId=US49578922, August 2022. Accessed on 28 September 2022).
According to IDC, there will be 41.6 billion connected objects generating 79.4 zetta bytes of data in 2025 (Steve Ranger. What Is the IoT? Everything you need to know about the internet of things right now. https://www.zdnet.com/article/what-is-the-internet-of-things-everything-you-need-to-know-about-the-iot-right-now/, February 2020. Accessed on 28 September 2022). There are many different types of connected sensors that can be used in IoT applications to make the process simpler and efficient []. Appliances such air conditioning, security cameras, etc., can be controlled and audited from anywhere through connected devices. Smart cities are also being developed through the help of IoT by the transportation data analysis. The technology of IoT is used by supply chain systems also when they use trackers to track deliveries in real time. Similarly, applications such as ApplePay, PayPal, etc., are also forms of connected devices that are used by banking systems to enable transactions using smartphones. Smart devices are used to collect data with the help of sensors and collected data can be transferred to the network layer through cloud systems. It is used for collecting various types of data that is useful to monitor and track various activities. The data collected through the different networks is converted into useful data, which become very important elements in the decision process.
What is the landscape of the sensors and IoT in agriculture? Agriculture benefits from interconnected objects, as the use of smart devices in the agriculture sector enables the monitoring of different important values and activities of farmers. The applications of connected devices are being utilized to track and record different kinds of data such as temperature, humidity, pollution, etc. Smart and IoT applications entered agriculture with a delay in relation to other fields such as medicine or industry. However, these solutions have started to increase over the years for better monitoring. This paves way for better practices in the form of better quality services and cost reduction. IoT-based approaches in the agriculture and agro-industry have proved to be very useful and have become necessary to propose better adapted services. More precisely, most initiatives in the agriculture and agro-industry focus not only on increasing the production but also on improving services such as sustainability, biodiversity vigilance, etc.
IoT is another very important paradigm used in the agro-industrial and environmental field []. The authors in Ref. [] explain that one of the main requirements for devices used in IoT projects is that they must be energy efficient. The main point is to be able to evaluate the energy impact of the proposed architecture. The authors also explain the interest of Edge Computing in the future of agriculture. The IoT driven by AI-based recommendation model is one of the greatest promises of the development [].
Several research activities have been carried out to study the use of IoT concept and agriculture. The authors of Ref. [] presented an interesting survey of IoT solutions and demonstrated how IoT can be integrated into the smart agriculture sector. Ref. [] presented the design of a smart system based on low-cost IoT sensors and popular data storage services and data analytics services on the cloud for crop production. The authors of Ref. [] presented an overview on the recent trends on sensors and IoT systems for irrigation in Precision Agriculture. On the same scope, Ref. [] proposed a data acquisition platform that is easily reusable. Other authors [] have focused on the communication between the sensors and a NoSQL database through the use of an Interoperable Platform. The goal is to support the actors to help them manage their crops. In Ref. [], the authors present a comprehensive review of emerging technologies for IoT-based smart agriculture. They provide a classification of IoT applications for smart agriculture into several categories. They propose to list the connected smart agriculture sensors that enable the IoT.
3. Maturity Model Levels and Smart Beehives
Many authors have already dealt with smart beehives with different levels of technological maturity. We therefore propose to focus on technological maturity for smart beehives and then analyse the articles that cover this field.
3.1. Maturity Model Levels for Smart Beehives
Beekeepers, depending on their financial means, will have different levels of technological maturity. The more connected beekeepers are, the more precise and relevant the notifications they receive will be.
To design our maturity levels, we were inspired by the literature about Maturity Model (MM) in Industry 4.0. We have therefore redefined MM so that it is compatible with a system similar to ours. Indeed, the literature proposes different Maturity Model levels to evaluate the digitalization of manufacturing systems [,,].
Among the different existing maturity levels, we were interested in those corresponding to IoT and CPS. Westermann et al. [] offered a maturity model for all CPS systems. We then adapted this model to our system. Table 1 proposes to summarize this adaptation.

Table 1.
Maturity model levels adapted for smart beehives.
The system is partially interlinked with other systems in horizontal and vertical dimensions []. Horizontal means communication with systems along the value chain, e.g., up- or down-stream systems such as other machines or other smart beehives in the studied domain. Vertical means interlinking with superordinate systems such as central decision centres or ERP in industry.
The system at the hive level will be between levels 1 and 5. Depending on the CPS set up by the beekeeper, the level of alerts and notifications will be different (Table 1).
Regarding the agriculture, Büyük et al. [] dealt with the Digital Maturity Assessment Model for Smart Agriculture. It consists of a model for companies that evaluates their competencies in Smart Agriculture. It is possible to calculate the digital maturity levels by using the proposed evaluation model. Actors in the agricultural sector can also analyse their degree of success in relation to the requirements of Industry 4.0. With the proposed criteria, the human and technological aspects are taken into account. The whole cycle (from the farm to the industry) could be analysed. Only the technological and farm aspects of this evaluation model correspond to our project.
3.2. Smart Beehives Literature Classified by Maturity Model Levels
Even though using technology in the beekeeping domain is still in its infancy, some works attempt to exploit certain technology aspects in order to improve the beekeeper practices and performance. Table 2 presents some of these works, each of them corresponding to a system that has input data and output data, and is based on special hardware, software, and algorithms. The last column of the table indicates the maturity of the system, as described in Section 3.
Table 2.
Literature about smart beehives analysed with the Maturity Model presented in the Table 1.
None of the articles presented in Table 1 provide a description of the digital maturity level. Most of those articles have proposed architectures to manage the data exchange between components. However, these architectures are very technical and have a lack of global view and genericity. Thus, they are hardly reusable. We propose in this paper, using the digital maturity level and the analysis made in the next section, to approach the subject in a more global and generic way.
4. Analysis with a Spatio-Temporal Matrix
To design an architecture for a decision-making system, a relevant methodology must be used. Among methodologies that can be used in the case of beekeeping, there is the spatio-temporal “3 × 3 matrix”. It consists of filling a matrix composed of two axes: the temporal horizon and the modelling level. There are several works that try to use a two-dimensional grid to design a decision-making system, for instance, Chabrol et al. [] proposed to couple the modelling approaches to the time horizons to design decision aid-tools for the hospital domain. Comelli et al. [] propose a methodology based on studying horizon levels and system flows to evaluate the supply chain. The suggested framework in Ref. [] has the advantages of handling decisions on two dimensions. It allows the designer to have a global view and to achieve a more complete architecture, taking into account different temporal and spatial levels. As explained in that paper, Figure 2 shows the matrix axis and its matching levels for the case of beekeeping.
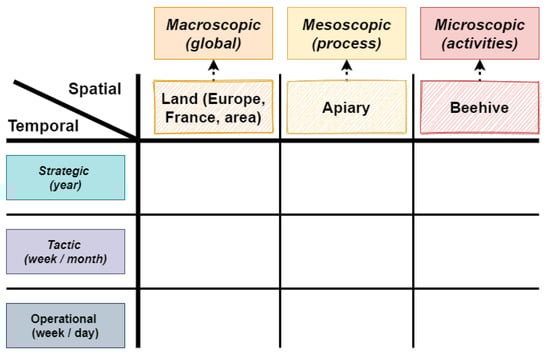
Figure 2.
Spatio-temporal matrix.
The authors of Ref. [] define the spatio-temporal matrix, show its matching levels for the case of beekeeping, and illustrate its application by an example of web application for managing apiary data. This tool allows its user to take decisions at the beehive or microscopic level. These decisions are either tactic, such as planning activities for the next week or month, or operational, such as evaluating results and adapting the activities. Figure 3 shows the application of the 3 × 3 matrix for that use case.
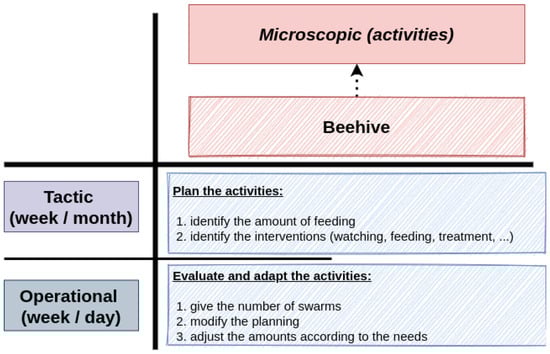
Figure 3.
Application of the spatio-temporal matrix to the beekeeping case.
Our suggested architecture implements some levels of the matrix.
5. Decision Support Systems for Smart Beehives
According to Ref. [], a Decision Support System (DSS) is a computer-based system intended for use by a particular manager or usually a group of managers at any organizational level in making a decision in the process of solving a semi structured decision. The DSS produces an output in the form of periodic or special report or the results of mathematical simulations. For the famous Cambridge Dictionary (Cambridge Dictionary. https://dictionary.cambridge.org/fr/dictionnaire/anglais/decision-support-system. Accessed on 13 October 2022), DSS is “a computer program that can arrange and sort large amounts of data, and that is used to help people in companies and organizations make important decisions based on the data: A successful decision support system is one that assists rather than replaces the human decision-maker”.
By following these definitions, Figure 4 shows our global view of how to implement DSS to help beekeepers manage their beehives. The three levels of decision-making, described in Figure 4, correspond to the spacial dimension of the matrix depicted in Section 4. The data used to make the decision come from two sources:
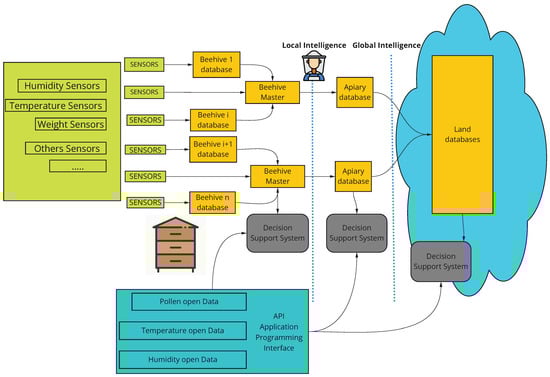
Figure 4.
Global view of the decision support systems for smart beehives.
- Sensors in the embedded system of the beehive;
- Open data about the weather (temperature, humidity, etc.) and pollen. The pollen is to know the state of the flora in a sectioned area.
5.1. Generic Architecture for Smart Beehives
Our solution is inspired by a standard API (Application Programming Interface) for managing contextual information (NGSI-LD API) []. This standard enables near real-time access to information from many different sources (not only IoT data source). NGSI-LD open specification released by ETSI defines the context information model and the API to produce, consume, and subscribe to context information. In our solution, different sensors are used to measure and quantify the indicators of the beehives. The most used are weight and temperature. The weight can be used to see the increase or decrease in the weight of the hives. It makes it possible to monitor the production of honey and to trigger alerts if the variation in weight is significant. Weight can also indicate the best feeding and processing strategy applied to a hive, particularly comparing weight over time and between different hives/apiary. Outdoor weather conditions change over time, and the temperature, humidity, and wind speed must be taken into consideration. All these different types of data are used to optimize beekeeping decisions. One of the major problems in beekeeping is the varroa destructor mite. It is the most destructive enemy of the Western honeybee (Apis mellifera). The varroa is a serious threat to bee health. A bee colony infested with mites will typically die off in these regions within three years. Until now, it has been difficult to deal with this problem. Indeed, counting varroa mites is interesting when quantifying how many bees are infected per hive. However this task remains very complicated because it is often carried out manually. Our platform offers an automatic counting service based on photos of frame bees. This service is based on deep learning methods to process images and detect objects. In fact, two neural networks for object detection and image segmentation are used. Faster RCNN is used for detecting bee locations; for each bee in the image it predicts a bounding box surrounding the object. Figure 5 illustrates the network outputs. To locate varroas, the U-NET takes as input an image containing one bee and segments it into two regions: varroa and background. Figure 6 illustrates the U-NET outputs. Estimating the infestation level is performed by combining these two detections; first the frame image is given to the system, then the bees are identified, and after that the presence of varroa is predicted for each bee. The infestation percentage is calculated by dividing the number of infected bees by the number of bees. This system needs data for learning; in fact, bee images were retrieved from project partners, from camera photos, and from the Internet. Thanks to annotation tools, the images were annotated by bounding boxes for bees and ellipses for varroas.
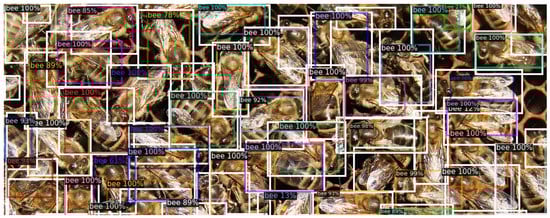
Figure 5.
Detected bees by Faster RCNN. Coloured bounding boxes are predicted objects and white bounding boxes are ground-truth objects.
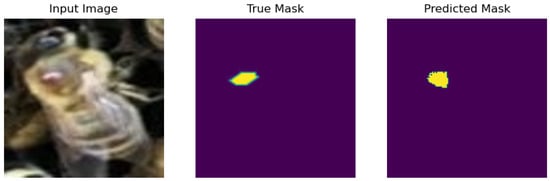
Figure 6.
Varroa segmentation by U-NET. The yellow region represents varroa. True Mask is ground-truth segmentation and Predicted Mask is the predicted segmentation.
5.2. Databases
Our system is able to send valuable information to subscribed beekeepers thanks to the collection and extraction of data from different data sources such as sensors. The collected data will help train machine learning models capable of generating advice or alerts to users.
A survey was carried out by our partner (ITSAP—Bee Institute). The survey is based on multiple questionnaires on the several activities and needs of beekeepers (Survey “Beekeepers and digital technology”. https://itsap.asso.fr/pages_thematiques/numerique/enquete-apiculteurs-numerique/, 31 January 2020. accessed on 28 September 2022).
The number of beekeepers participating in the survey is 415 (43% have more than 70 hives).The most important productions are honey and breeding. According to the survey, data collection appears to be a relatively common practice among beekeepers. While certain information must necessarily be collected to meet administrative requirements (especially for the breeding register), others show a desire to collect objective information on the colonies. However, a handwritten input remains the majority in most cases, despite the advantage of having a computer version concerning the ease of consultation of the data and their use. Only 60% of beekeepers who responded to the survey monitor varroa infestation.
The most expected features consist of fairly simple data processing, namely graphic productions and indicator tables. In addition to data visualization, beekeepers are looking for an intelligent alert service capable of reporting relevant information (Table 3).
Table 3.
Expectations of beekeepers regarding the functionalities to be integrated into a management platform.
The proposed data model is based on the results of this survey concerning the useful and necessary information that should be managed on an apiary.
The implementation of this architecture is done in collaboration with beekeepers. This will lead to the development of a comprehensive and flexible system that would allow the beekeeping community to share relevant information and knowledge, and make appropriate decisions. All information is modelled from data models that allow the unification of data structures using standards and also ensure further extensibility, if necessary.
Figure 7 presents an excerpt from our data model. We have developed a new model that would meet the needs of our beekeepers. Conceptually, the model presented is based on two levels:
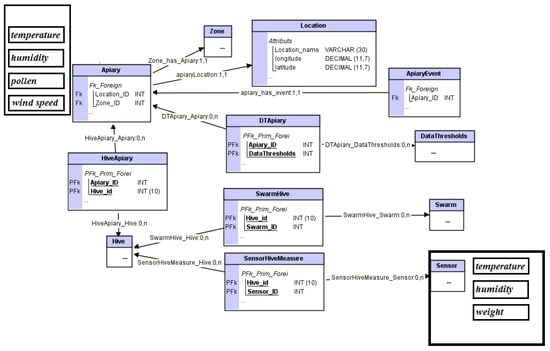
Figure 7.
Excerpt from the data model.
- Spatial dimensions: sensors/hive/apiary/zone;
- Temporal dimensions: real-time /operational(day /week)/tactic (week/month) /strategic (year).
Figure 8 presents an excerpt from our central data mode. The figure shows an example of a service offered, collecting data by integrating the time dimension.
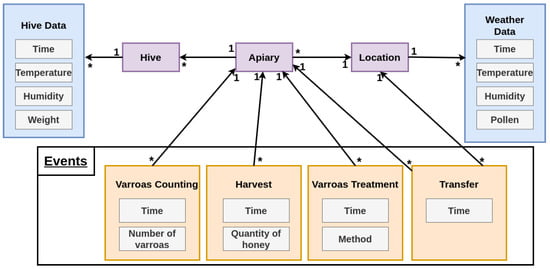
Figure 8.
Excerpt from the central data model.
As an example, for an apiary:
- Real-time: quantity of honey;
- Operational: varroa counting;
- Tactic: varroa treatment;
- Strategic: define the type and the amount of treatment and write a health risk management.
The selection of materials used to build the embedded system is a compromise between the cost and the accuracy of the sensors. Indeed, our goal is to encourage the beekeepers to make their digitalization and the cost of the system is a very important criterion.
6. Case Study
The case study developed in this project corresponds to level 3 of the MM presented in Section 3 and in Table 1. Table 4 presents our case study with the MM.
Table 4.
Maturity Model levels of the case study.
We have chosen the agile approach because it is flexible based on principles of collaboration, adaptability, and continuous improvement. This approach is ideal for our project, which is service-oriented and allows for the rapid adaptation based on stakeholder feedback.
The information is transferred by using smartphone or web applications to the data model for later decisions, as shown in Figure 9. Along with the best practices and modern design techniques, REST architectural style allows building an API that is both extendable and flexible. Indeed, the use of API HTTP REST provides various possible interactions with third-party platforms in both directions. REST APIs should accept the JSON format for the request payload and send responses to JSON. JSON is a standard for transferring data. Almost every networked technology can use it.
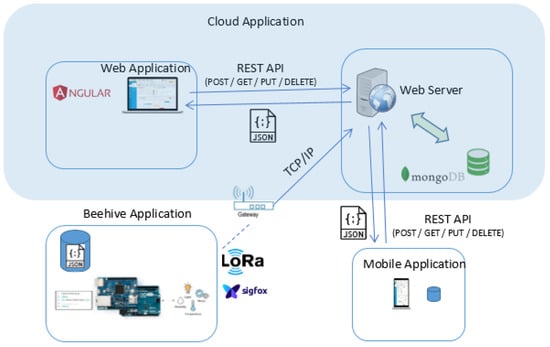
Figure 9.
An example of the proposed architecture.
The criteria for this project are:
- Low-power board computer, because the system has to be embedded on the apiary during several weeks;
- The materials have to be low-cost because we need to convince the beekeepers to use it. It means we have to make a compromise between accuracy and price.
From these constraints, we selected the materials below:
- Arduino: the best embedded low-power single board computer;
- Sensors for the humidity and temperature: AZDelivery DHT11;
- Sensors for the Weight: HX711 Module;
- Sensors for communication: Z-Delivery ESP8266 ESP-01 Serial Wireless WLAN WiFi Transceiver Module Transceiver.
We made our weight sensor by combining four single strain gauges (load sensor). We made boxes to encapsulate the sensors using a 3D printer. Figure 10 shows: single strain gauge (a) arranged in a Wheatstone bridge configuration (c). A load sensor combinator from sparkfun (b), which is a module that directly integrates a Wheatstone bridge configuration to which we only have to connect the four sensors according to the diagram (c). The combinatory board is hooked up to an amplifier (HX711 module). Load cell measurements can be off due to a range of things (temperature, vibration). In our tests, we obtained calculation variations between +2% and −3.5%.
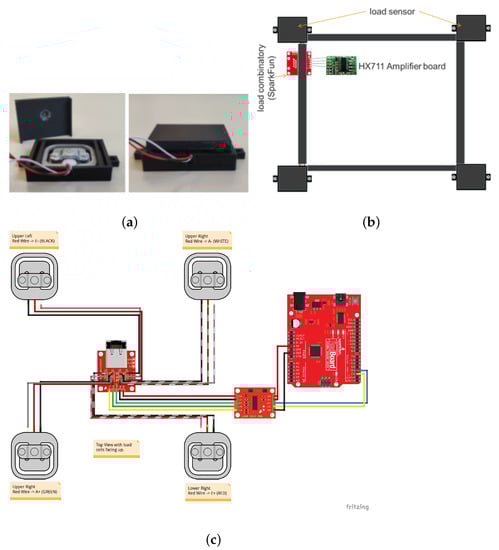
Figure 10.
Weight sensor: (a) single strain gauge, (b) a load sensor combinator from sparkfun, (c) Wheatstone bridge configuration  https://learn.sparkfun.com/tutorials/load-cell-amplifier-hx711-breakout-hookup-guide/all. Accessed on 28 September 2022.
At the top of Figure 11, we can see the day’s indicators (specified at the top left), such as the maximum and minimum temperatures of the hive, its maximum and minimum humidity levels, as well as its weight. These indicators turn red if they are too high, and blue if they are too low. Each indicator is represented as a curve below, showing the evolution of the data over a chosen period (which year, month, or number of days can be changed in the filters at the top right). We also see on each of the curves the forecast of the potential evolution of the data for the remainder of the month. Finally, the dotted lines represent the warning threshold that a curve must not exceed. In Figure 11, Figure 12 and Figure 13, the measurements were made until 19 February. After this date, it is a question of prediction.
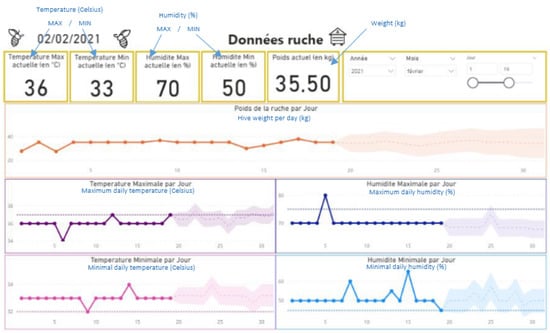
Figure 11.
Dashboard: data.
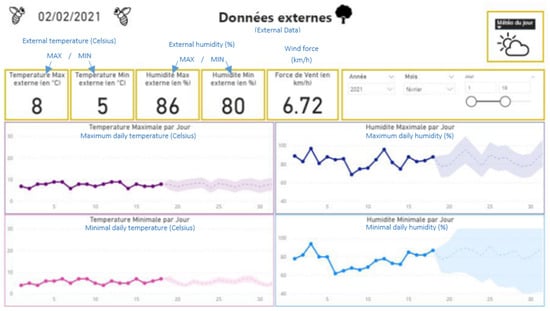
Figure 12.
Dashboard: environmental data.
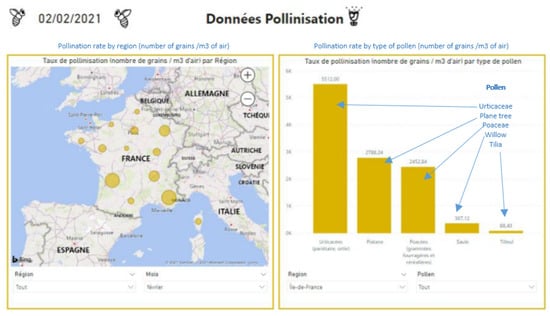
Figure 13.
Dashboard: pollination data.
The figures also show a prediction of the weight as well as the weather. We use the linear regression algorithm.
Very similar to Figure 11, Figure 12 shows the indicators for the external data. The ambient temperature as well as the outdoor humidity levels have been taken into account. Unlike the previous part, the indication of the wind force as well as the weather forecast for the day are shown.
In Figure 13, on the left, the total pollination rate by region (selectable in the filter below for a global view in France, or for a focus on a particular region) over a chosen period is shown. For more details, on the right, we can see the most common types of pollen (according to their pollination rate in number of grains/ of air) in France, in a particular region. It is possible via the filters below to choose a region, or a particular type of pollen.
The Alert Manager is a component of our system. Its mission is to address beekeepers with possible alerts or valuable information based on data provided by all other parts of the system (e.g., sensors and predictions).
Figure 14 shows the nature of the data to be managed and collected by the system, as well as the information output from the system. In the context of our case study, a system of alerts and notifications has been developed. A screenshot with an example of use is shown in Figure 15. The Today column presents the alerts or notifications from the current day data. The Forecast column shows the alerts and notifications for future days from forecast analysis. The severity rate is represented by different colours (orange for warnings and red for the alerts). The parameter settings for each hive are changed.
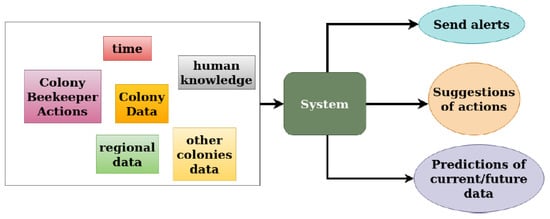
Figure 14.
System data and information.
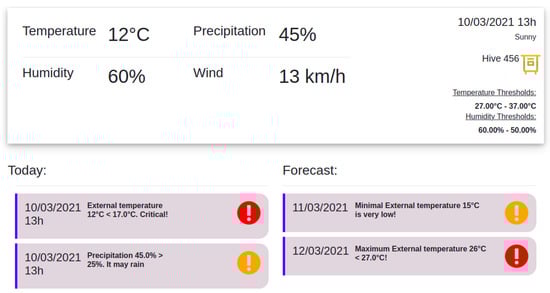
Figure 15.
Example of alerts and notifications from environmental data.
7. Conclusions
This paper presents a new approach for modelling, monitoring, and deploying Agriculture 4.0 systems. As for Industry 4.0, agriculture is going through its digital revolution. In fact, Agriculture 4.0 is based on solutions and technologies developed for Industry 4.0. In this context, smart beehives need some technological solutions to build smart hive motoring systems. The goal is to help different stakeholders to make the best decisions. We studied through a spatio-temporal matrix with the time and the geographical horizons all kinds of decisions that can be made. Indeed, beekeeping is affected by a crisis due to the disappearance of bees, and the different stakeholders need support to make their decisions. Our approach used a part of these technologies: Big Data, the Internet of Things, Cyber-Physical Systems, Cloud Computing, and Artificial Intelligence. We have implemented a Digital Transformation (DT) process to help the actors of the beekeeping sector. The idea was to develop new services for beekeepers and more generally for the actors of the apiary using these technologies. Among the elements of the DT, the “people” become essential, and even more important than anything else []. It is why beekeepers and their cooperatives were fully involved. We used their vocabulary and we worked together to understand their culture. Concretely, a reusable and flexible architecture based on sensors, data from beekeepers, and Open Data has been introduced. To illustrate our new approach, a specialized software application has been developed. This application notifies and alerts beekeepers to help them to take care of their hives. We also proposed a Maturity Model (MM) to diagnose the level of digitalization in the area of agriculture. We analysed the literature on smart beehives regarding this MM.
A long term perspective is to move toward the development of a methodology to address issues related to Agriculture 4.0 and support agriculture in their DT in general. Another important perspective is to use this approach to build a global architecture. It allows to register all the data at different hierarchical levels (land, apiary, and beehive databases). Such an architecture would be based on Industry 4.0 and Fog computing (Edge Computing). We will analyse architectures proposed by these concepts []. Moreover, our use case will evolve toward more local decisions, and will correspond to level 4 of our MM (Table 1). It means that the decisions will be faster, more relevant, efficient, and accurate. Concretely, this evolution will be achieved thanks to the development of a data analysis module inside the beehives. This will allow us to cross-check and analyse the history of the data acquired. Another future line of research is the development of cooperation between the embedded systems of smart beehives of the same apiary. It will generate better accuracy for the notification and alert system. To achieve all these evolutions, we need to implement machine and deep learning algorithms.
Author Contributions
Conceptualization, J.-C.H., L.B. and Y.K.; Methodology, L.B. and Y.K.; Project administration, J.-C.H.; Software, L.B. and Y.K.; Supervision, C.A.; Validation, K.W.-W. and C.A.; Writing—original draft, J.-C.H., L.B., Y.K. and K.W.-W.; Writing—review & editing, J.-C.H., L.B., Y.K., K.W.-W. and C.A. All authors have read and agreed to the published version of the manuscript.
Funding
This research was funded partially by French Chambers of Agriculture development programs (CASDAR) and the APC was funded by EFREI Paris (engineering school of digital technologies).
Institutional Review Board Statement
Not applicable.
Informed Consent Statement
Not applicable.
Data Availability Statement
Not applicable.
Acknowledgments
The authors gratefully acknowledge the Ministry of Agriculture and Food, who are financing PNAPI through CASDAR (the special appropriation account “Agriculture and Rural Development”) under the project number 18 ART 1831 as well as the support and help of Alexandre Dangléant, ITSAP (Technical and Scientific Institute of Beekeeping and Pollination).
Conflicts of Interest
The authors declare no conflict of interest.
Abbreviations
The following abbreviations are used in this manuscript:
| API | Application Programming Interface |
| CAGR | Compound Annual Growth Rate |
| CPS | Cyber-Physical System |
| DSS | Decision Support Systems |
| ERP | Enterprise Resource Planning |
| IoT | Internet of Thing |
| IT | Information Technology |
| JSON | JavaScript Object Notation |
| MM | Maturity Model |
| REST | REpresentational State Transfer |
| RFID | Radio Frequency Identification |
| WSN | Wireless Sensor Networks |
References
- Latioui, Z.E.; Bougueroua, L.; Moretto, A. Social media chatbot system-beekeeping case study. In Proceedings of the International Conference on Hybrid Intelligent Systems, Porto, Portugal, 13–15 December 2018; pp. 302–310. [Google Scholar]
- FranceAgreMer. Bilan de Campagne Miel 2020; Technical Report; FranceAgreMer. 2021. Available online: https://www.franceagrimer.fr/content/download/67599/document/BIL_API_2021_Bilan_campagne_2020.pdf (accessed on 28 September 2022).
- Cardin, O. Classification of cyber-physical production systems applications: Proposition of an analysis framework. Comput. Ind. 2019, 104, 11–21. [Google Scholar] [CrossRef]
- Nezamova, O.; Olentsova, J. The main trends of digitalization in agriculture. IOP Conf. Ser. Earth Environ. Sci. 2022, 981, 032018. [Google Scholar] [CrossRef]
- Schallmo, D.R.; Williams, C.A. Digital Transformation Now! Guiding the Successful Digitalization of Your Business Model; Springer: Berlin/Heidelberg, Germany, 2018. [Google Scholar]
- Berman, S.J. Digital transformation: Opportunities to create new business models. Strategy Leadersh. 2012, 40, 16–24. [Google Scholar] [CrossRef]
- Gabriel, A.; Gandorfer, M. Adoption of digital technologies in agriculture—An inventory in a european small-scale farming region. In Precision Agriculture; Springer: Berlin/Heidelberg, Germany, 2022; pp. 1–24. [Google Scholar] [CrossRef]
- Nambisan, S.; Lyytinen, K.; Majchrzak, A.; Song, M. Digital Innovation Management: Reinventing Innovation Management Research in a Digital World. MIS Q. 2017, 41, 223–238. [Google Scholar] [CrossRef]
- Ebert, C.; Duarte, C.C. Digital Transformation. IEEE Softw. 2018, 35, 16–21. [Google Scholar] [CrossRef]
- Verina, N.; Titko, J. Digital transformation: Conceptual framework. In Proceedings of the International Scientific Conference “Contemporary Issues in Business, Management and Economics Engineering”, Vilnius, Lithuania, 9–10 May 2019. [Google Scholar]
- Moeuf, A.; Pellerin, R.; Lamouri, S.; Tamayo-Giraldo, S.; Barbaray, R. The industrial management of SMEs in the era of Industry 4.0. Int. J. Prod. Res. 2018, 56, 1118–1136. [Google Scholar] [CrossRef]
- Danjou, C.; Rivest, L.; Pellerin, R. Douze positionnements stratégiques pour l’Industrie 4.0: Entre processus, produit et service, de la surveillance à l’autonomie (Twelve strategic positioning for Industry 4.0: Between process, product and service, from monitoring to autonomy). In Proceedings of the 12e Congrès International de Génie Industriel CIGI, Compiègne, France, 3–5 May 2017. [Google Scholar]
- Corallo, A.; Latino, M.E.; Menegoli, M. From industry 4.0 to agriculture 4.0: A framework to manage product data in agri-food supply chain for voluntary traceability. Int. J. Nutr. Food Eng. 2018, 12, 146–150. [Google Scholar]
- Ahmed, S.H.; Kim, G.; Kim, D. Cyber Physical System: Architecture, applications and research challenges. In Proceedings of the 2013 IFIP Wireless Days (WD), Valencia, Spain, 13–15 November 2013; pp. 1–5. [Google Scholar] [CrossRef]
- Gubbi, J.; Buyya, R.; Marusic, S.; Palaniswami, M. Internet of Things (IoT): A vision, architectural elements, and future directions. Including Special sections: Cyber-enabled Distributed Computing for Ubiquitous Cloud and Network Services & Cloud Computing and Scientific Applications—Big Data, Scalable Analytics, and Beyond. Future Gener. Comput. Syst. 2013, 29, 1645–1660. [Google Scholar] [CrossRef]
- Atzori, L.; Iera, A.; Morabito, G. The Internet of Things: A survey. Comput. Netw. 2010, 54, 2787–2805. [Google Scholar] [CrossRef]
- Firouzi, F.; Rahmani, A.; Mankodiya, K.; Badaroglu, M.; Merrett, G.; Wong, P.; Farahani, B. Internet-of-Things and big data for smarter healthcare: From device to architecture, applications and analytics. Future Gener. Comput. Syst. 2018, 78, 583–586. [Google Scholar] [CrossRef]
- Vincent, D.R.; Deepa, N.; Elavarasan, D.; Srinivasan, K.; Chauhdary, S.H.; Iwendi, C. Sensors driven AI-based agriculture recommendation model for assessing land suitability. Sensors 2019, 19, 3667. [Google Scholar] [CrossRef] [PubMed]
- Talavera, J.M.; Tobón, L.E.; Gómez, J.A.; Culman, M.A.; Aranda, J.M.; Parra, D.T.; Quiroz, L.A.; Hoyos, A.; Garreta, L.E. Review of IoT applications in agro-industrial and environmental fields. Comput. Electron. Agric. 2017, 142, 283–297. [Google Scholar] [CrossRef]
- Quy, V.K.; Hau, N.V.; Anh, D.V.; Quy, N.M.; Ban, N.T.; Lanza, S.; Randazzo, G.; Muzirafuti, A. IoT-Enabled Smart Agriculture: Architecture, Applications, and Challenges. Appl. Sci. 2022, 12, 3396. [Google Scholar] [CrossRef]
- Colombo-Mendoza, L.O.; Paredes-Valverde, M.A.; Salas-Zárate, M.d.P.; Valencia-García, R. Internet of Things-Driven Data Mining for Smart Crop Production Prediction in the Peasant Farming Domain. Appl. Sci. 2022, 12, 1940. [Google Scholar] [CrossRef]
- García, L.; Parra, L.; Jimenez, J.M.; Lloret, J.; Lorenz, P. IoT-Based Smart Irrigation Systems: An Overview on the Recent Trends on Sensors and IoT Systems for Irrigation in Precision Agriculture. Sensors 2020, 20, 1042. [Google Scholar] [CrossRef]
- Lee, S. A Novel Design and Implementation of Data Acquisition and Preprocessing System for Precision Agriculture. Agric. Environ. Perspect. Intell. Syst. 2019, 24, 52. [Google Scholar]
- López-Morales, J.A.; Martínez, J.A.; Skarmeta, A.F. Digital Transformation of Agriculture through the Use of an Interoperable Platform. Sensors 2020, 20, 1153. [Google Scholar] [CrossRef]
- Friha, O.; Ferrag, M.A.; Shu, L.; Maglaras, L.; Wang, X. Internet of Things for the Future of Smart Agriculture: A Comprehensive Survey of Emerging Technologies. IEEE/CAA J. Autom. Sin. 2021, 8, 718–752. [Google Scholar] [CrossRef]
- Felch, V.; Asdecker, B.; Sucky, E. Maturity Models in the Age of Industry 4.0–Do the Available Models Correspond to the Needs of Business Practice? In Proceedings of the 52nd Hawaii International Conference on System Sciences, Maui, HI, USA, 8–11 January 2019. [Google Scholar]
- Menon, K.; Kärkkäinen, H.; Lasrado, L.A. Towards a Maturity Modeling Approach for the Implementation of Industrial Internet. In Proceedings of the PACIS 2016; Association for Information Systems, AIS Electronic Library (AISeL), Chiayi, Taiwan, 27 June–1 July 2016; p. 38. [Google Scholar]
- Jæger, B.; Halse, L.L. The IoT Technological Maturity Assessment Scorecard: A Case Study of Norwegian Manufacturing Companies. In Proceedings of the Advances in Production Management Systems. The Path to Intelligent, Collaborative and Sustainable Manufacturing, Hambourg, Germany, 3–7 September 2017; Lödding, H., Riedel, R., Thoben, K.D., von Cieminski, G., Kiritsis, D., Eds.; Springer International Publishing: Cham, Switzerland, 2017; pp. 143–150. [Google Scholar]
- Westermann, T.; Anacker, H.; Dumitrescu, R.; Czaja, A. Reference architecture and maturity levels for cyber-physical systems in the mechanical engineering industry. In Proceedings of the 2016 IEEE International Symposium on Systems Engineering (ISSE), Edinburgh, UK, 3–5 October 2016; pp. 1–6. [Google Scholar]
- Büyük, A.M.; Ateş, G.; Burghli, S.; Yılmaz, D.; Temur, G.T.; Sivri, Ç. Digital Maturity Assessment Model for Smart Agriculture. In Proceedings of the The International Symposium for Production Research, Antalya, Turkey, 24–26 September 2020; Springer: Berlin/Heidelberg, Germany, 2020; pp. 289–301. [Google Scholar]
- Aksoy, A.; Ertürk, Y.E.; Erdoğan, S.; Eyduran, E.; Tariq, M.M. Estimation of Honey Production in Beekeeping Enterprises from Eastern Part of Turkey through Some Data Mining Algorithms. Pak. J. Zool. 2018, 50, 2207. [Google Scholar] [CrossRef]
- Dineva, K.; Atanasova, T. OSEMN process for working over data acquired by IoT devices mounted in beehives. Curr. Trends Nat. Sci. 2018, 7, 47–53. [Google Scholar]
- Rafael Braga, A.; Gomes, D.G.; Rogers, R.; Hassler, E.E.; Freitas, M.B.; Cazier, J.A. A method for mining combined data from in-hive sensors, weather and apiary inspections to forecast the health status of honey bee colonies. Comput. Electron. Agric. 2020, 169, 105161. [Google Scholar] [CrossRef]
- Bee Informed Partnership—Using Beekeepers’ Real World Experience to Solve Beekeepers’ Real World Problems. Available online: https://beeinformed.org/ (accessed on 28 September 2022).
- Edwards-Murphy, F.; Magno, M.; Whelan, P.M.; O’Halloran, J.; Popovici, E.M. b+WSN: Smart beehive with preliminary decision tree analysis for agriculture and honey bee health monitoring. Comput. Electron. Agric. 2016, 124, 211–219. [Google Scholar] [CrossRef]
- Markovic, D.; Pesovic, U.; Djurasevic, S.; Randjic, S. Decision support system for temperature monitoring in beehives. Acta Agric. Serbica 2016, 21, 135–144. [Google Scholar] [CrossRef]
- Balta, A.; Dogan, S.; Ozmen Koca, G.; Akbal, E. Software Modeling of Remote Controlled Beehive Design. In Proceedings of the International Conference on Advances and Innovations in Engineering ICAIE, Elazig, Turkey, 10–12 May 2017; pp. 1133–1138. [Google Scholar]
- Zogović, N.; Mladenović, M.; Rašić, S. From primitive to cyber-physical beekeeping. In Proceedings of the 7th International Conference on Information Society and Technology, Kopaonik, Serbia, 13–16 March 2017. [Google Scholar]
- Cazier, J. The Genius Hive Will Be Able to Tell You What It Needs to Do Better. Available online: https://www.beeculture.com/peering-into-the-future-a-path-to-the-genius-hive/ (accessed on 28 September 2022).
- Mrozek, D.; Gȯrny, R.; Wachowicz, A.; Małysiak-Mrozek, B. Edge-Based Detection of Varroosis in Beehives with IoT Devices with Embedded and TPU-Accelerated Machine Learning. Appl. Sci. 2021, 11, 11078. [Google Scholar] [CrossRef]
- Debauche, O.; Moulat, M.E.; Mahmoudi, S.; Boukraa, S.; Manneback, P.; Lebeau, F. Web Monitoring of Bee Health for Researchers and Beekeepers Based on the Internet of Things. Procedia Comput. Sci. 2018, 130, 991–998. [Google Scholar] [CrossRef]
- Zetterman, B.E.A. Beekeepers Usage of IoT: Data Collection, Sharing and Visualization in the Domain of Beekeeping. Master’s Thesis, Linnaeus University, Vaxjo, Sweden, 2018. [Google Scholar]
- Latioui, Z.E.; Bougueroua, L.; Moretto, A. Social Media Chatbot System—Beekeeping Case Study. In Hybrid Intelligent Systems; Advances in Intelligent Systems and Computing; Madureira, A.M., Abraham, A., Gandhi, N., Varela, M.L., Eds.; Springer International Publishing: Cham, Switzerland, 2020; Volume 923, pp. 302–310. [Google Scholar] [CrossRef]
- Chabrol, M.; Gourgand, M.; Rodier, S. A modeling methodology and its application to the design of decision-making aid tools dedicated to the hospital systems. In Proceedings of the RCIS’08: International Conference on Research Challenges in Information, Marrakech, Morocco, 3–6 June 2008. [Google Scholar]
- Comelli, M.; Féniès, P.; Tchernev, N. A combined financial and physical flows evaluation for logistic process and tactical production planning: Application in a company supply chain. Special Section on Recent Developments in the Design, Control, Planning and Scheduling of Productive Systems. Int. J. Prod. Econ. 2008, 112, 77–95. [Google Scholar] [CrossRef]
- Huet, J.C.; Bougueroua, L.; Kriouile, Y.; Moretto, A. Toward an intelligent system architecture for smart agriculture: Application to smart beehives. In Proceedings of the 20th International Conference on Intelligent Systems Design and Applications—ISDA 2020, Online, 12–15 December 2020. [Google Scholar]
- McLeod, R. Information Systems, 1st ed.; Prentice Hall PTR: Hoboken, NJ, USA, 1989. [Google Scholar]
- ETSI. Context Information Management (CIM); NGSI-LD API. Technical Report; ETSI. 2020. Available online: https://www.etsi.org/deliver/etsi_gs/CIM/001_099/009/01.03.01_60/gs_CIM009v010301p.pdf (accessed on 28 September 2022).
- Rafique, W.; Qi, L.; Yaqoob, I.; Imran, M.; Rasool, R.U.; Dou, W. Complementing IoT Services Through Software Defined Networking and Edge Computing: A Comprehensive Survey. IEEE Commun. Surv. Tutor. 2020, 22, 1761–1804. [Google Scholar] [CrossRef]
Publisher’s Note: MDPI stays neutral with regard to jurisdictional claims in published maps and institutional affiliations. |
© 2022 by the authors. Licensee MDPI, Basel, Switzerland. This article is an open access article distributed under the terms and conditions of the Creative Commons Attribution (CC BY) license (https://creativecommons.org/licenses/by/4.0/).