Abstract
The present work reports the identification of inorganic and organic materials applied in gildings of Kizil Grottoes mural paintings, located in the western part of China. A total of 10 gold gilding samples were collected from caves dated in the fourth–seventh century AD. In this research, optical microscopy, scanning electron microscopy (SEM) with energy-dispersive X-ray spectroscopy (EDX), UV fluorescence microscopy, and pyrolysis gas chromatography–mass spectrometry (Py-GC/MS) analyses were carried out to clarify the mordant materials and the coating materials on the foils. This research reports some new finds of the gilding technique in Kizil grottoes, such as oil and lac resin being used as mordant to provide a binding medium for gold gilding, gold powder probably being used as pigment, and some organic dyes being well preserved under gold foil. These interesting findings not only provide scientific evidence for us to understand the materials and techniques of gold gildings on Kizil Grottoes murals, but also illustrate material trade and technique exchanges along the Silk Road in the past.
1. Introduction
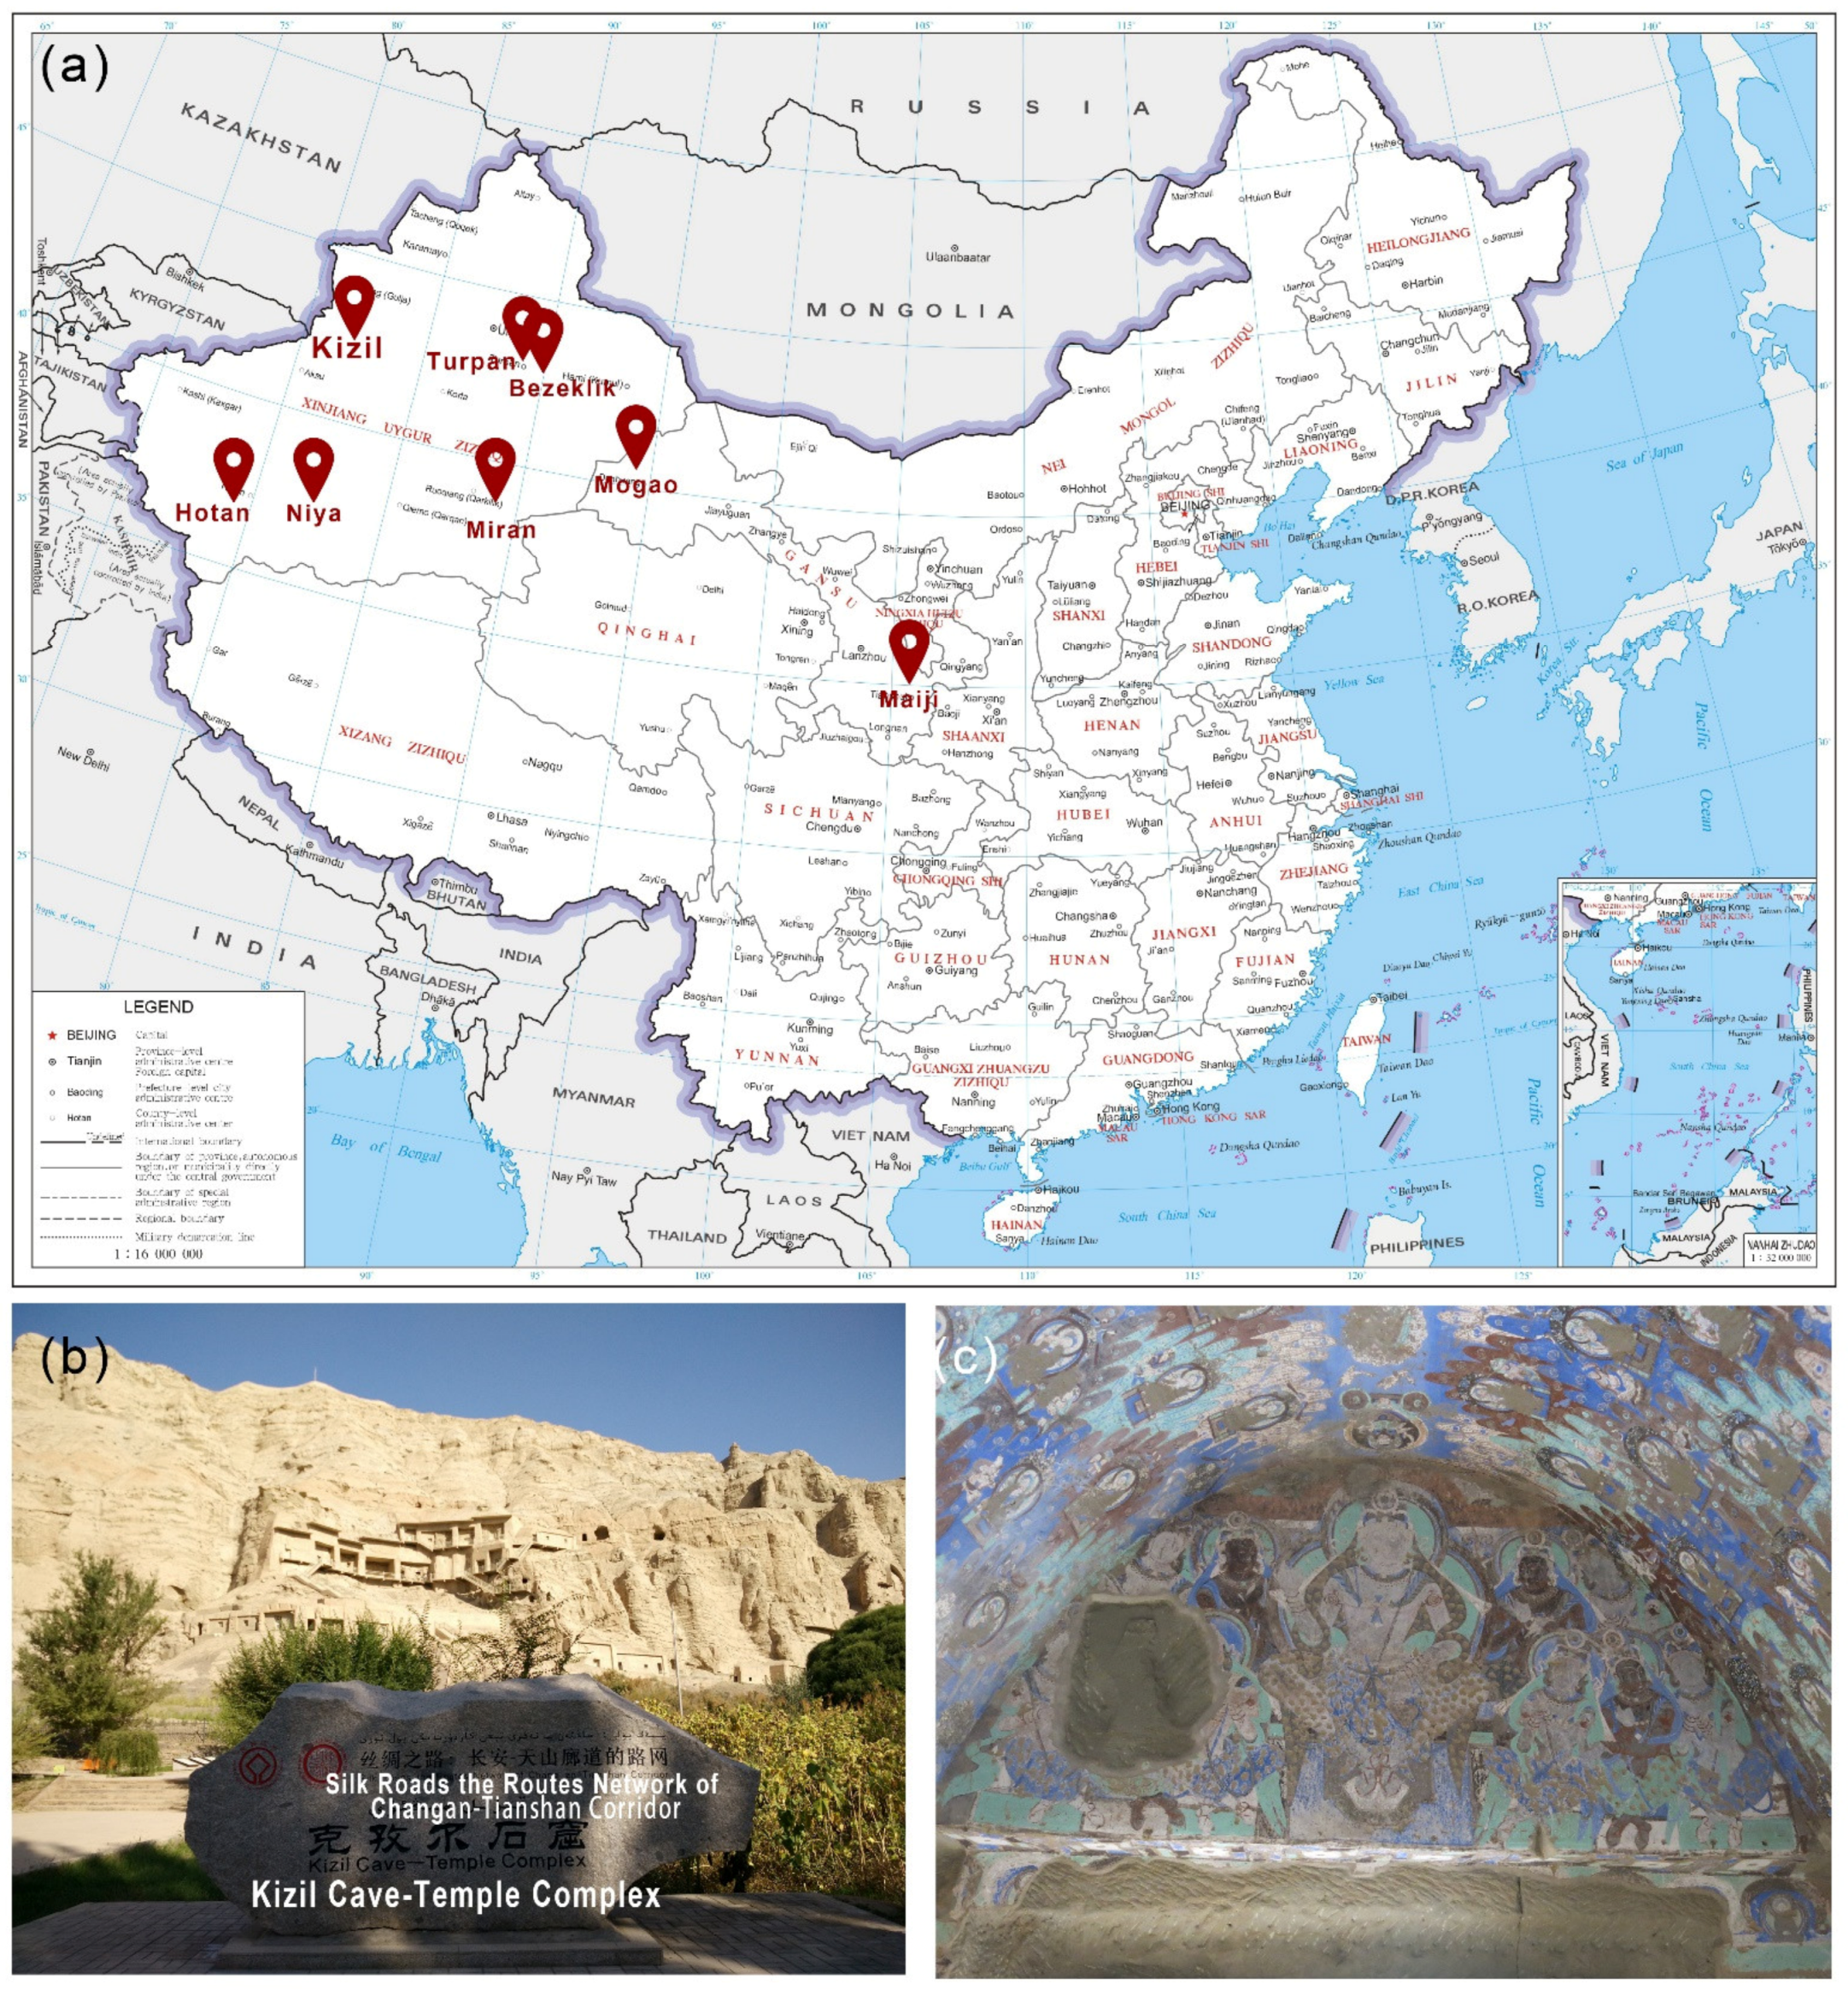
Xinjiang, known as the Western Region in ancient times, is located in the hinterland of the Asian and European continents. Historically, it was once a major thoroughfare for land transportation between China and the west, as well as an essential stage for cultural exchange and integration between the East and the West [1]. In recent times, a large number of ancient cultural sites have been discovered in Xinjiang, unearthing a large number of precious historical relics that have greatly enriched Chinese history and our understanding of the cultural exchanges, material trade, and technological diffusion between the East and West along the Silk Road. The Kizil Grottoes are among the representative remains (Figure 1).
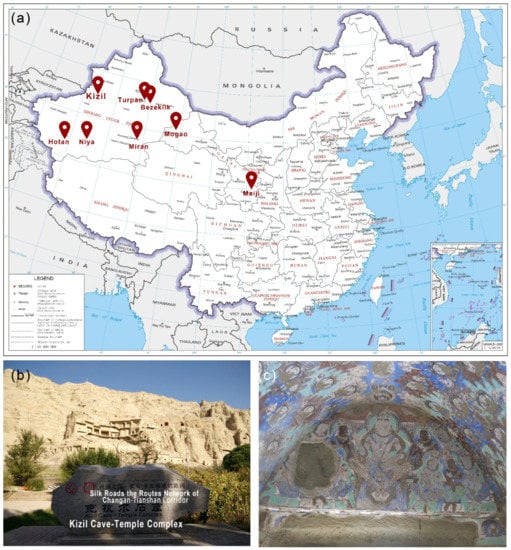
Figure 1.
(a) The location of Kizil grottoes and important ancient Buddhism grottoes along the silk road in China; (b) the front view of Kizil grottoes; (c) a mural painting in Kizil grottoes (Cave No. 171, fifth–seventh century AD).
Kizil grottoes are located at the northern edge of the Taklamakan Desert and the southern foot of the Tianshan Mountains, which belongs to the ancient Kucha area. Ancient Kucha once had a highly developed culture and made great contributions to mankind in music, art, and literature [2]. Kizil Grottoes, the earliest and most westerly grottoes group in China, began to be excavated in the third century AD and ended in the ninth. Located at one of the important crossroads on the Silk Road, the mural art of Kizil shows various artistic elements from the Central Plains, India, Central Asia, etc. The unique cave form and art style of Kizil clearly reveal Buddhism’s propagation from west to east through the Western region and the localization process of Buddhist art. The unique painting techniques and precious materials used in the murals, such as lapis lazuli and lac imported via the Silk Road [3], are critical physical relics for illustrating the material trade and cultural exchanges on the ancient Silk Road.
Previous investigations about the painting materials in Kizil wall paintings were performed, and the main results were focused on the identification of inorganic pigments [4,5] and organic binder [6], which was determined as animal glue. Zhou [7,8] paid attention to the gilding material and technique in Kizil and found that lac resin was used as the red mordant (an adhesive material used in gilding) for gold gilding, while drying oil was applied for adhering tin gilding to the wall painting.
Considering the previous studies, a systematic investigation is still needed to reveal the gold gilding materials and techniques of Kizil’s wall paintings. In addition, a noteworthy point from our previous investigation is that the gold foil was probably covered by another layer, which makes the golden luster not particularly obvious. We speculate that this may be related to the specific technique of gold gilding decoration. An upper layer applied on tin foil was reported in a wall painting of Bamiyan Afghanistan dated in the seventh century AD [9]. Most of this tin gilding showed a golden luster; this technique is called false gilding, which was also reported in medieval paintings in Western Europe [10,11]. As for the layer applied on the gold gilding of Kizil, further research is necessary.
In this context, this study focused on the gold gilding decorations in the murals of the Kizil Grottoes. Multiple analytical methods including optical microscopy (OM), UV fluorescence microscopy, scanning electron microscopy with an energy-dispersive X-ray analyzer (SEM-EDX), micro-Raman spectroscopy (μ-RS), and pyrolysis gas chromatography–mass spectrometry (Py-GC/MS) were carried out to systematically reveal the materials and techniques of gold gilding in Kizil.
2. Materials and Methods
2.1. Information of Gilding Samples
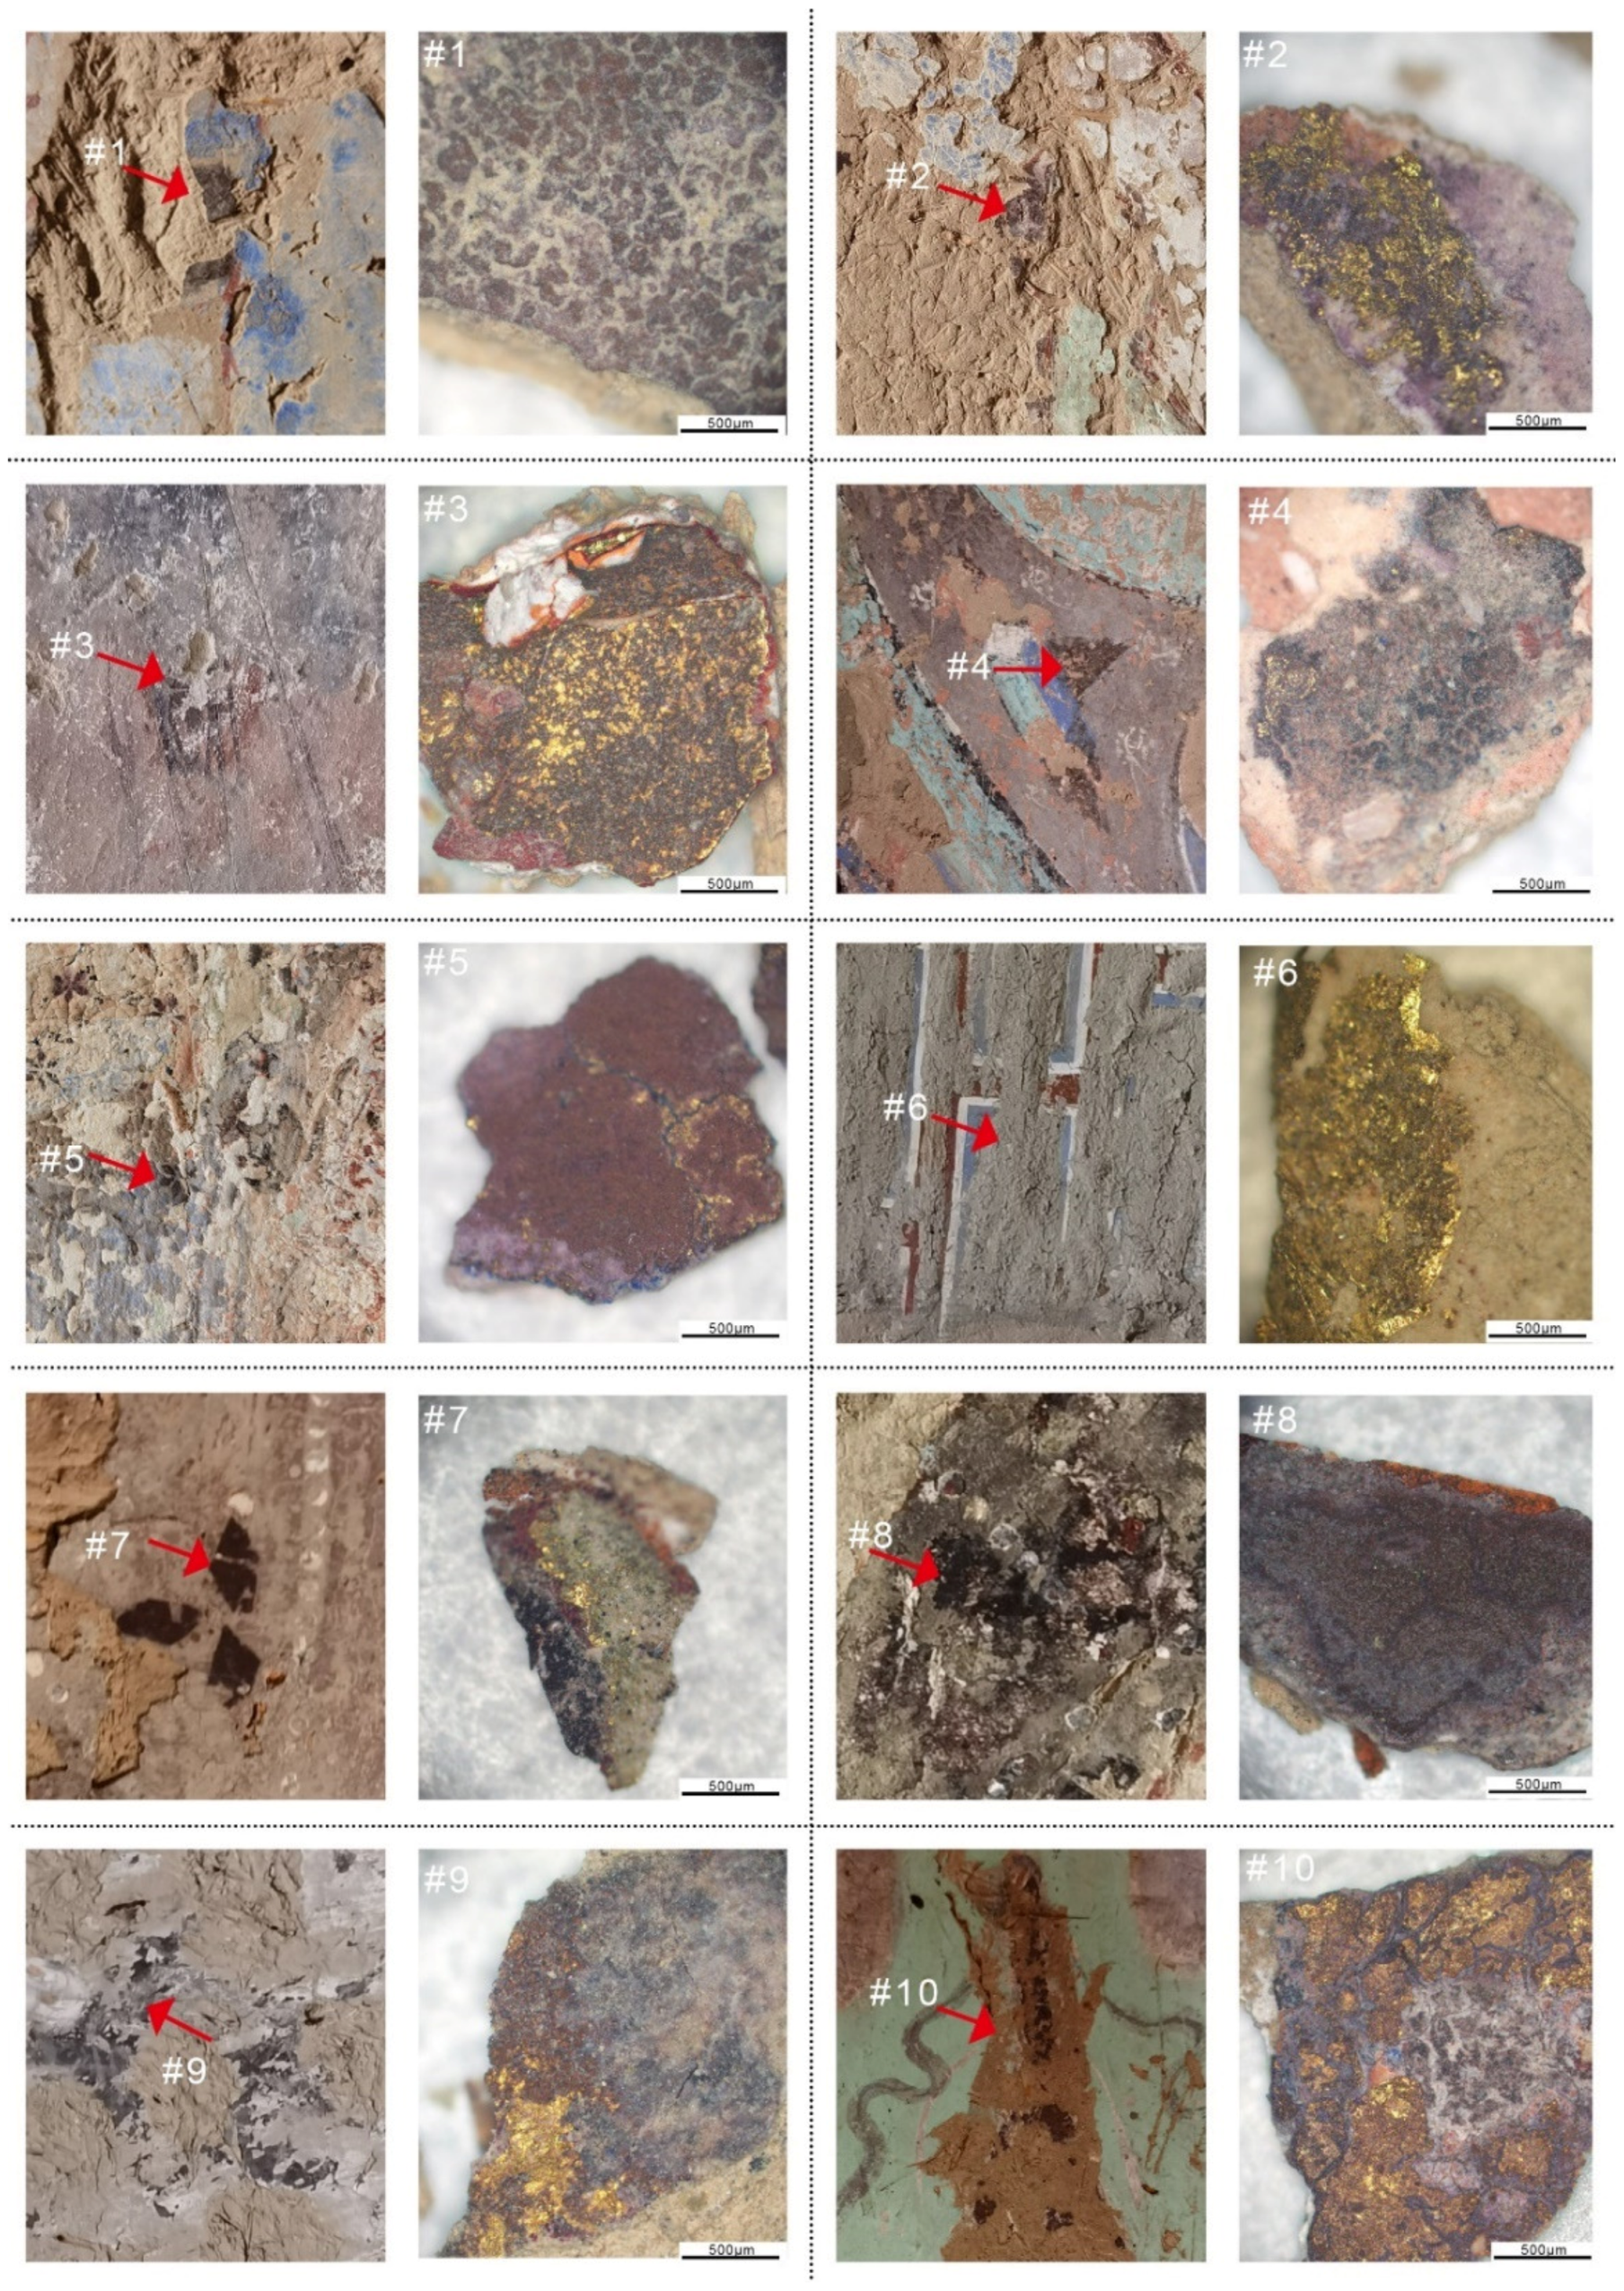
Table 1 lists the basic information of the samples in this study. Figure 2 shows the specific sampling locations and microscope images of the gilding samples, and the content of the sampling location screen is illustrated in Figure A1. The gold gilding decoration was commonly used as a diamond-shaped decoration motif in Kizil. Golden luster can be seen in all samples by OM except #1 and #8. An upper layer covered the surface of all the gilding samples. Samples #2, #3, #6, and #9 were covered with a brown layer, samples #3 and #8 were covered with a thick red-purple layer, and samples #4 and #7 were covered with some black material. Furthermore, the base layers of the gold gilding varied in color. It is hard to clearly observe the base layer color of samples #1 and #6 from Figure 2. Samples #2, #5, #9, and #10 had a purplish red base layer, whereas samples #3, #7, and #8 had a bright-red color underneath the gold foil. On the basis of the preliminary morphological characteristics obtained by optical microscopy (OM), the next step was to combine a variety of instrumental analyses to obtain the layer information and substance composition of each layer. The investigation started with the identification of inorganic pigments and then explored the organic materials used in the gold gilding of Kizil Grottoes.

Table 1.
Information of gilding damples.
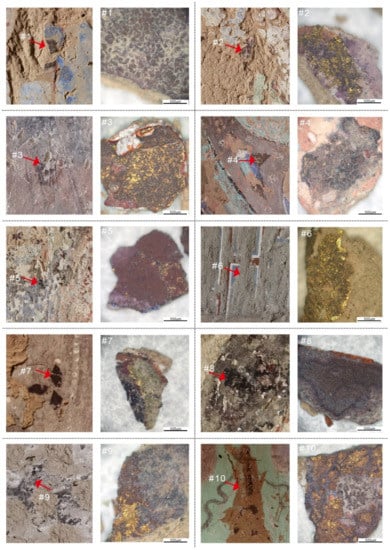
Figure 2.
Sampling locations and microscope images of the samples used in this study. The red arrow in the images means the sampling location.
2.2. Methods
2.2.1. Optical Microscopy (OM) and UV Fluorescence Microscopy Observation
Optical images before and after fluorescent staining tests were collected at different magnifications from 20× to 800×, using a fluorescence imaging Soptop RX 50 microscope, equipped with a tungsten lamp and a set excitation filter (365 nm) and emission filter (420 nm) appropriate for displaying the response of fluorescence emission excitation. The samples were all embedded in cold epoxy resin, and dry-polished with micro-mesh polishing cloths to the final step of 8000 # mesh.
2.2.2. SEM–EDX
Scanning electron microscope Phenom XL G2 coupled with an energy-dispersive X-ray spectroscope and backscatter detector was used to analyze the microstructural characteristics of paint layers and semi-quantitatively analyze the relative concentration of major elements in different layers. Analysis was carried out in a low-vacuum environment (60 Pa), with a scanning voltage of 15 kV at 7 mm working distance.
2.2.3. Micro-Raman Spectroscopy (μ-RS)
A Thermo Scientific DXR 2xi Raman spectrometer was used to qualitatively analyze the mineral composition of different layers of the embed cross-section. The blue pigments were analyzed using a 532 nm laser, and the other pigments were analyzed using the 785 nm laser.
2.2.4. Py-GC/MS
Py–GC/MS analysis was performed on an integrated system consisting of a Frontier EGA-PY3030D pyrolyzer and an Agilent 7890B/5977B gas chromatograph/mass spectrometer. The GC system was equipped with a capillary column HP-5MS UI (30 m × 0.25 mm × 0.2 μm) with a quadrupole mass analyzer. Online methylated Py-GC/MS analysis was operated as follows: less than 1 mg of sample together with 5 μL of 10 wt.% methanolic solutions of tetramethyl ammonium hydroxide (TMAH, Aladdin Biochemical Technology Co., Ltd, Shanghai, China) as the methylation reagent were placed in the sample cup, which was placed on top of the pyrolyzer at near ambient temperature; when the furnace temperature and GC/MS system were ready, the sample cup was introduced into the furnace before starting the temperature program of the GC oven. The pyrolysis was performed at 550 °C for 0.2 min. The carrier gas of helium was adjusted at a flow rate of 1.0 mL/min and split of 5:1. The injector and GC/MS transfer line were controlled at 300 °C. Chromatographic conditions for the separation of pyrolysis products were controlled at an initial temperature of 50 °C, maintained isothermal for 2 min, increased by 4 °C/min to 300 °C, and maintained isothermal for 15.5 min. The MS detector was operated with an ionizing voltage of 70 eV; the ion source temperature was 230 °C and quadrupole temperature was 150 °C, with a mass range m/z of 29–550. The NIST library of mass spectra was used for identifying the compounds.
3. Results
3.1. Inorganic Pigment Analysis
3.1.1. OM Observation and SEM–EDX
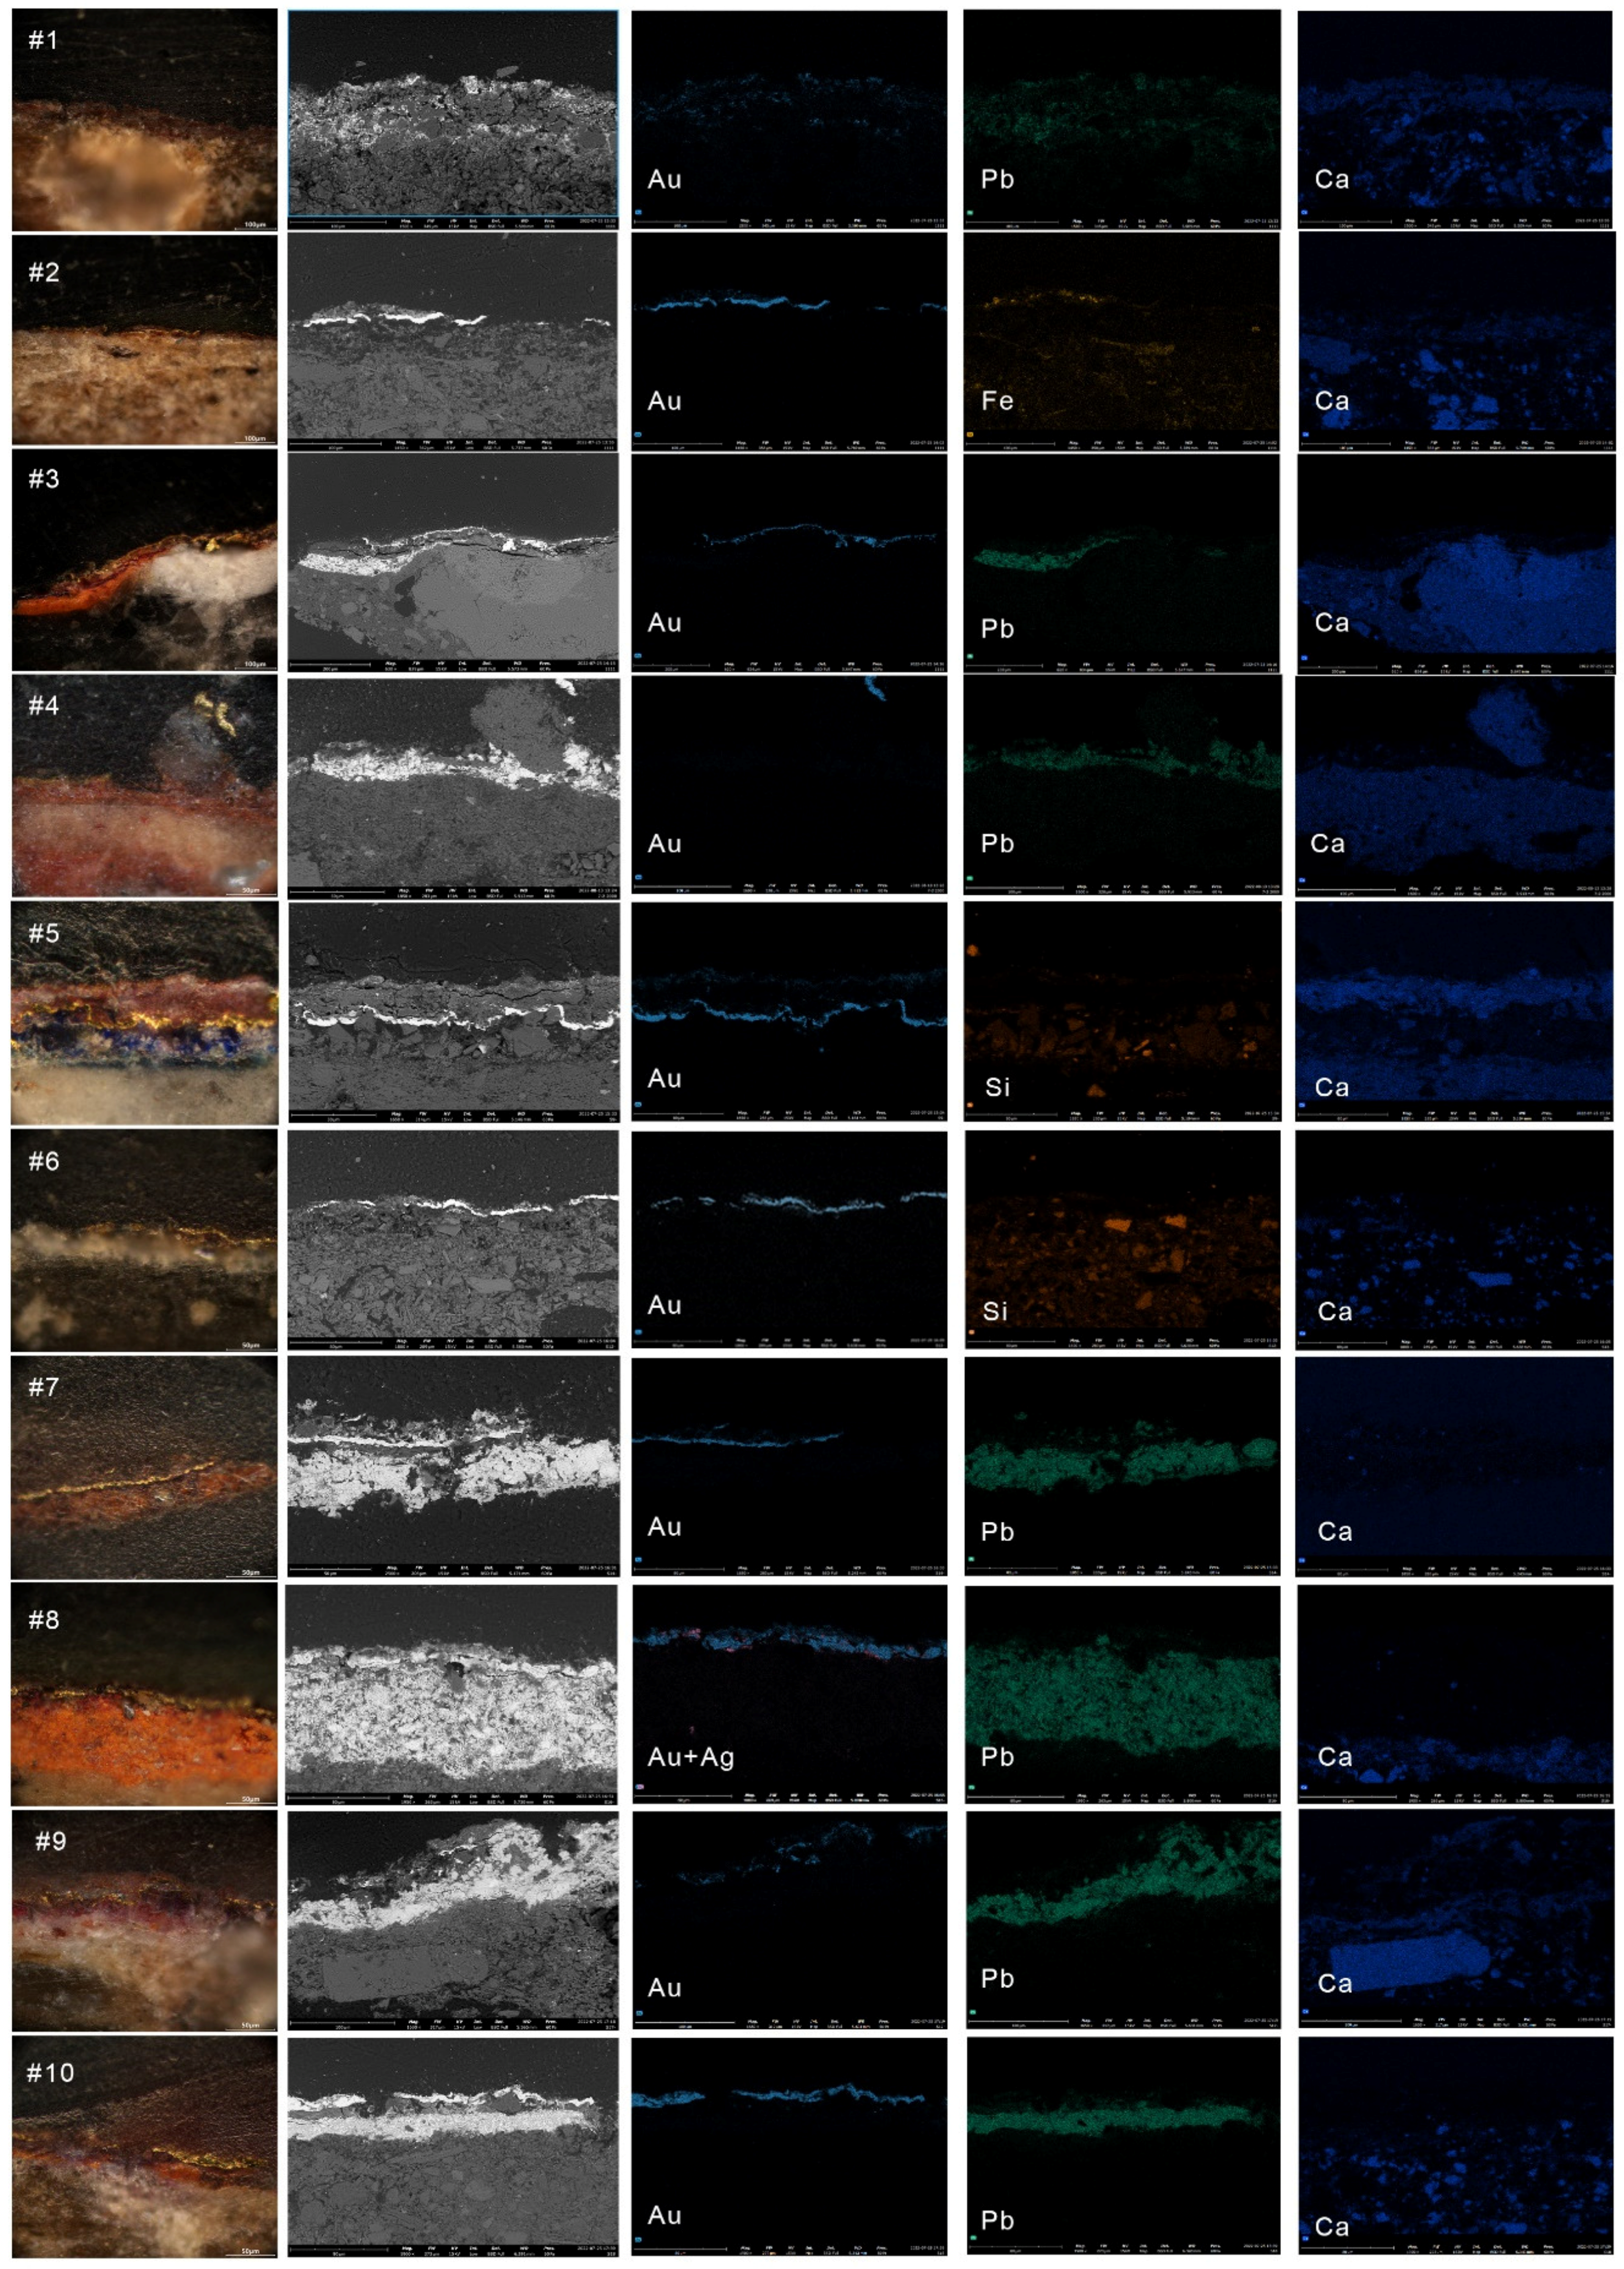
Figure 3 illustrates the optical and SEM cross-section images and elemental mappings. As the OM images show in Figure 3, all samples except #1 had relatively clear layers. Except for #1 and #4, clear gold could be observed in all samples. As mentioned above, most surfaces were coated with gold, and the colors of the layer beneath gold varied, include purplish red, orange, brown, blue, and white. The results of elemental analysis showed that Au (gold) was detected in all samples. In addition to Au, Ag (silver) was detected in sample #8. Ag was mixed with Au, whereby Au dominated in the elemental mapping; thus, Ag can be considered as an impurity in the gold. Although the golden color was not visually apparent in sample #1, it can be seen in the elemental distribution map that Au was scattered in Pb and Ca. This suggests that Au distributed in #1 was not in the form of foil but in the form of powder, mixed with a substance containing Pb and Ca. In #2, gold leaf with some Fe-containing red particles was identified in the upper layer, while characteristic elements such as Hg, Pb, and Ca were absent in the mordant layer. Sample #3 exhibited a thick red organic resinous layer beneath the gold foil, and, under the red organic layer, there was an orange layer with Pb. In #4, there were three red layers above the white ground, containing Pb + As, Ca + As, and Ca + Fe. Sample #5 had a distinct thick red layer on the upper gold layer, while a blue layer was beneath the gold foil. Sample #6 had no obvious element detected under the gold foil. Sample #7 presented a Pb-containing orange layer as mordant and a small number of red particles in the upper layer that also contained Pb. In #8, a red-black material was found in the upper layer, along with a dark-red layer and Pb concentrated orange layer under the foil. In #9, a thicker orange-red layer was visible in the upper layer where Pb and Ca were present. Sample #10 showed a thick red organic resinous layer beneath the gold foil, followed by an orange layer with Pb.
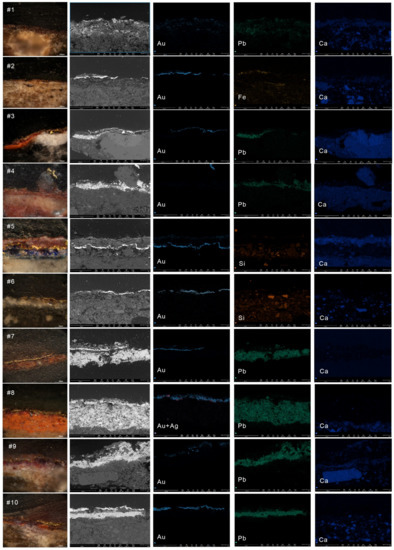
Figure 3.
Images of the cross-sections and their element mapping. Each row represents a sample; The first column showing an optical micrograph of the observation area, the second column showing a BSE image, followed by three columns showing the distribution of elements for each representative element of the layer.
Overall, no distinct foil overlay was observed on #6 and #10. Furthermore, #3, #7, #8, #9, and #10 were similar in structure, all having an orange-red layer coated with a dark-red resin layer, followed by gold leaf and a white layer containing Ca and S beneath.
The BSE images of the cross-section shown in the second row of Figure 3 reveal the differences in atomic numbers; brighter areas indicate lower elements in the periodic table with a higher atomic number. As shown in Figure 3, the brightest area was represented by gold, while the dark areas are likely represented by organic compounds.
In #6, only the lower layer of gold leaf was found to contain Ca and S. The red layer in the middle was not measured for the characteristic elements and may be an organic dye. The upper surface layer of gold foil in #2 was dominated by Fe and Si, while the lower purplish layer of gold foil contained Ca and S; no characteristic elements of any mineral pigments show this color. Therefore, the purplish layer was presumably made of some organic colorant mixed with gypsum. The upper red layer of gold foil in #5 contained only Ca and S, suggesting that the red color may have come from organic colorant. It is likely that dye mixed with gypsum was used in these samples. The bright blue beneath the gold layer in sample #5 may be lapis lazuli due to a lack of characteristic elements such as Cu (azurite) and Co (smalt, cobalt).
3.1.2. Raman Spectroscopy Analysis
Microscopic Raman spectroscopy can be used with SEM–EDX results to determine the predominant pigments in each layer. Due to the easy oxidation of the pigment particles, Raman spectroscopy was used in the lower energy range. The Raman spectra of each sample are shown in Figure A2. The characteristic Raman peaks and characteristic elements of each layer are summarized in Table 2. On the basis of the characteristic peak at 130 cm−1, the red layer containing lead could primarily be identified as minium (Pb3O4), while it was judged to be PbO according to the occurrence of peaks at 70 cm−1, 126 cm−1, and 267 cm−1. PbO present can be explained as a consequence of the well-known laser damage effect that transforms Pb3O4 to PbO [12]. The characteristic peak of the red layer including Pb in #1 showed slight differences, with the peak at 150 cm−1 attributed to the presence of litharge (α-PbO) [13] and that at 515 cm−1 probably attributed to plattnerite (β-PbO). The white parts were all gypsum.

Table 2.
Summary of elemental and Raman analysis results.
In summary, most of the red layers contained Pb, and the Raman spectra results show that they were all minium or lead oxides. In addition, #3 and #4 contained Fe, which may be an iron red. The red layers of samples #2, #4, and #5 had no characteristic elements such as Hg and Pb other than Ca and S, suggesting that the red color probably came from red organic colorant. furthermore, Indigo was detected in sample #5 in the benzo blue layer underneath the bright-blue layer according to the strong peak at 1573 cm−1 [14].
There was a distinct red layer beneath the gold leaf in all samples except #3. In addition, peaks of amorphous carbon (at 1570 cm−1 and 1380 cm−1) could be detected in the dark and surface layers above the gold, suggesting that organic substances may have been used and that aging occurred during the deterioration process. In combination with the BSE images, a layer of material with a low atomic number could be seen beneath the gold foil, most likely as adhesive for the gold gilding.
3.2. Organic Pigment Analysis
3.2.1. Py-GC/MS
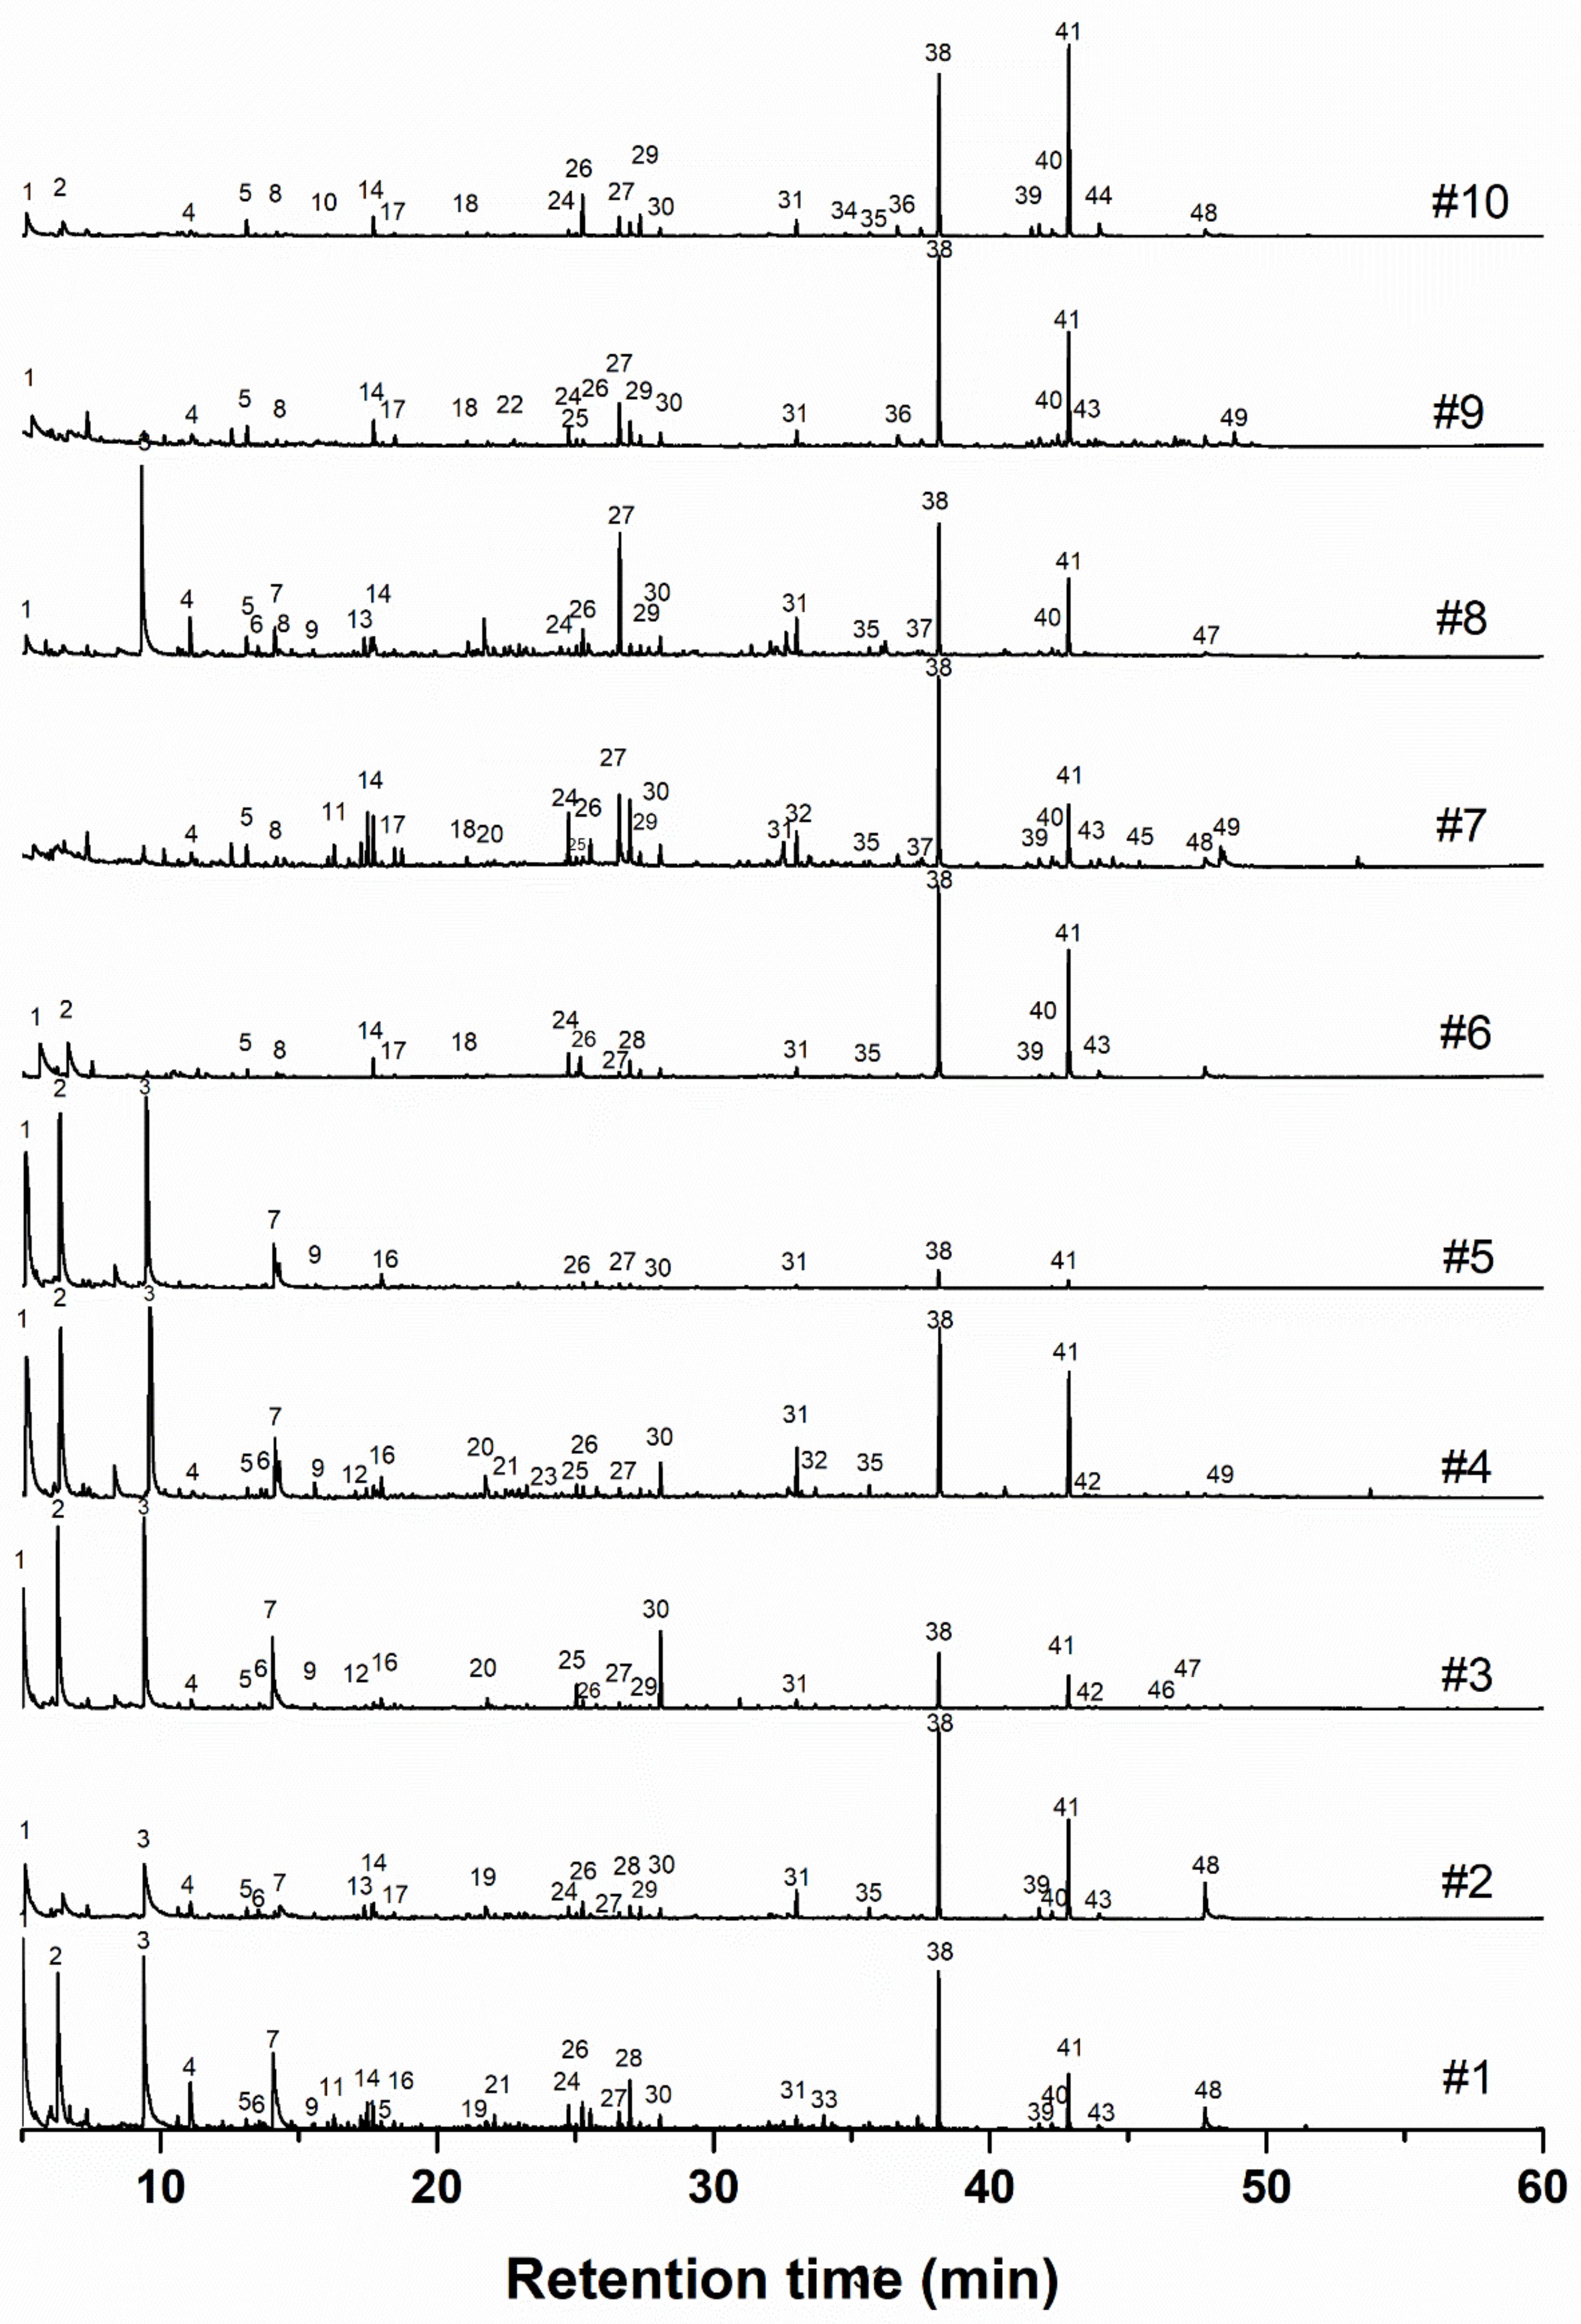
Identified pyrosis compounds are summarized in Table 3, and the TIC is illustrated in Figure 4. Samples #1, #2, #3, #4, #5, and #8 showed 1-methylpyrrole-2-carboxylate at 14.09 min (No. 7), followed by amino acids L-aspartic acid (No. 16), glycine (No. 1), and sarcosine (No. 9), suggesting the use of proteinaceous substances such as animal glue. In addition, phenol (No. 24) is one of the main pyrolysis products of casein and egg white [15], detected in samples #1, #2, #6, #7, #8, #9, and #10. Heptadecanenitrile (No. 36) and octadecanenitrile (No. 39), which have been identified as markers of egg yolk [15,16], were detected. However, the concentration of the detected compounds was low, and cholesterol, the characteristic marker for egg was absent; therefore, it was difficult to determine the type of protein.

Table 3.
Pyrolysis products detected in gilding samples.
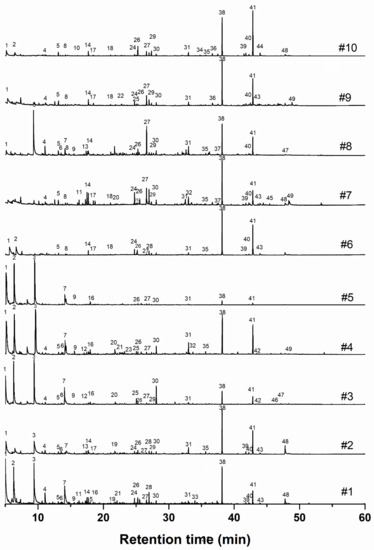
Figure 4.
Py-GC/MS total ion chromatogram (TIC) of the gilding samples.
With the exception of sample #5, strong dry oil aging products such as C18, C16, and 2C9 were detected, indicating that dry oils were used in these samples. Among the identified pyrolysis products, palmitic acid (C16:0, No. 38) and stearic acid (C18:0, No. 41) are the original components of drying oils, while octanoic acid (C8:0, No. 6), octanedioic acid (2C8, No. 8), nonanedioic acid (2C9, No. 30), and decandioic acid (2C12, No. 29) are the typical aging products of drying oils [17]. P/S (palmitic acid/ stearic acid, C16/C18) is always considered to judge the type of drying oil [18]. The P/S value is a classical reference to determine the oil type, with values from 1.0–1.5 indicating the type as linseed oil, tung oil, and egg yolk [17]. In addition, azelaic over palmitic acid ratio (A/P) is less than 0.2; this is consistent with the lipid fraction of the egg yolk [19]. Considering that heptadecanenitrile (No. 36) and octadecanenitrile (No. 39) were detected in samples #1, #2, #6, #7, #8, and #10, the possibility of egg yolk application could not be denied. However, C18 and C16 also exist in proteinaceous substances and lac resins; therefore, it was hard to determine the oil type using only P/S in multi-structure polychrome heritage.
Aleuritic acid (48.343 min, No. 49), the main component of lac resin [20], was detected in samples #3, #4, #7, and #9. The mass spectra of Figure A3 show characteristic fragments at 71, 95, 109, 159, 201, and 281 m/z, indicating the use of lac in these samples [21].
3.2.2. Fluorescence Microscopy Observation
Fluorescence microscopy is a specific analytical tool for the recognition and mapping of different mordant and organic binders in a complex layer structure [22]. When observing samples using an UV excitation light, different binders may exhibit characteristic colors and fluorescence intensities, which can provide information about their spatial distribution within the painting layer.
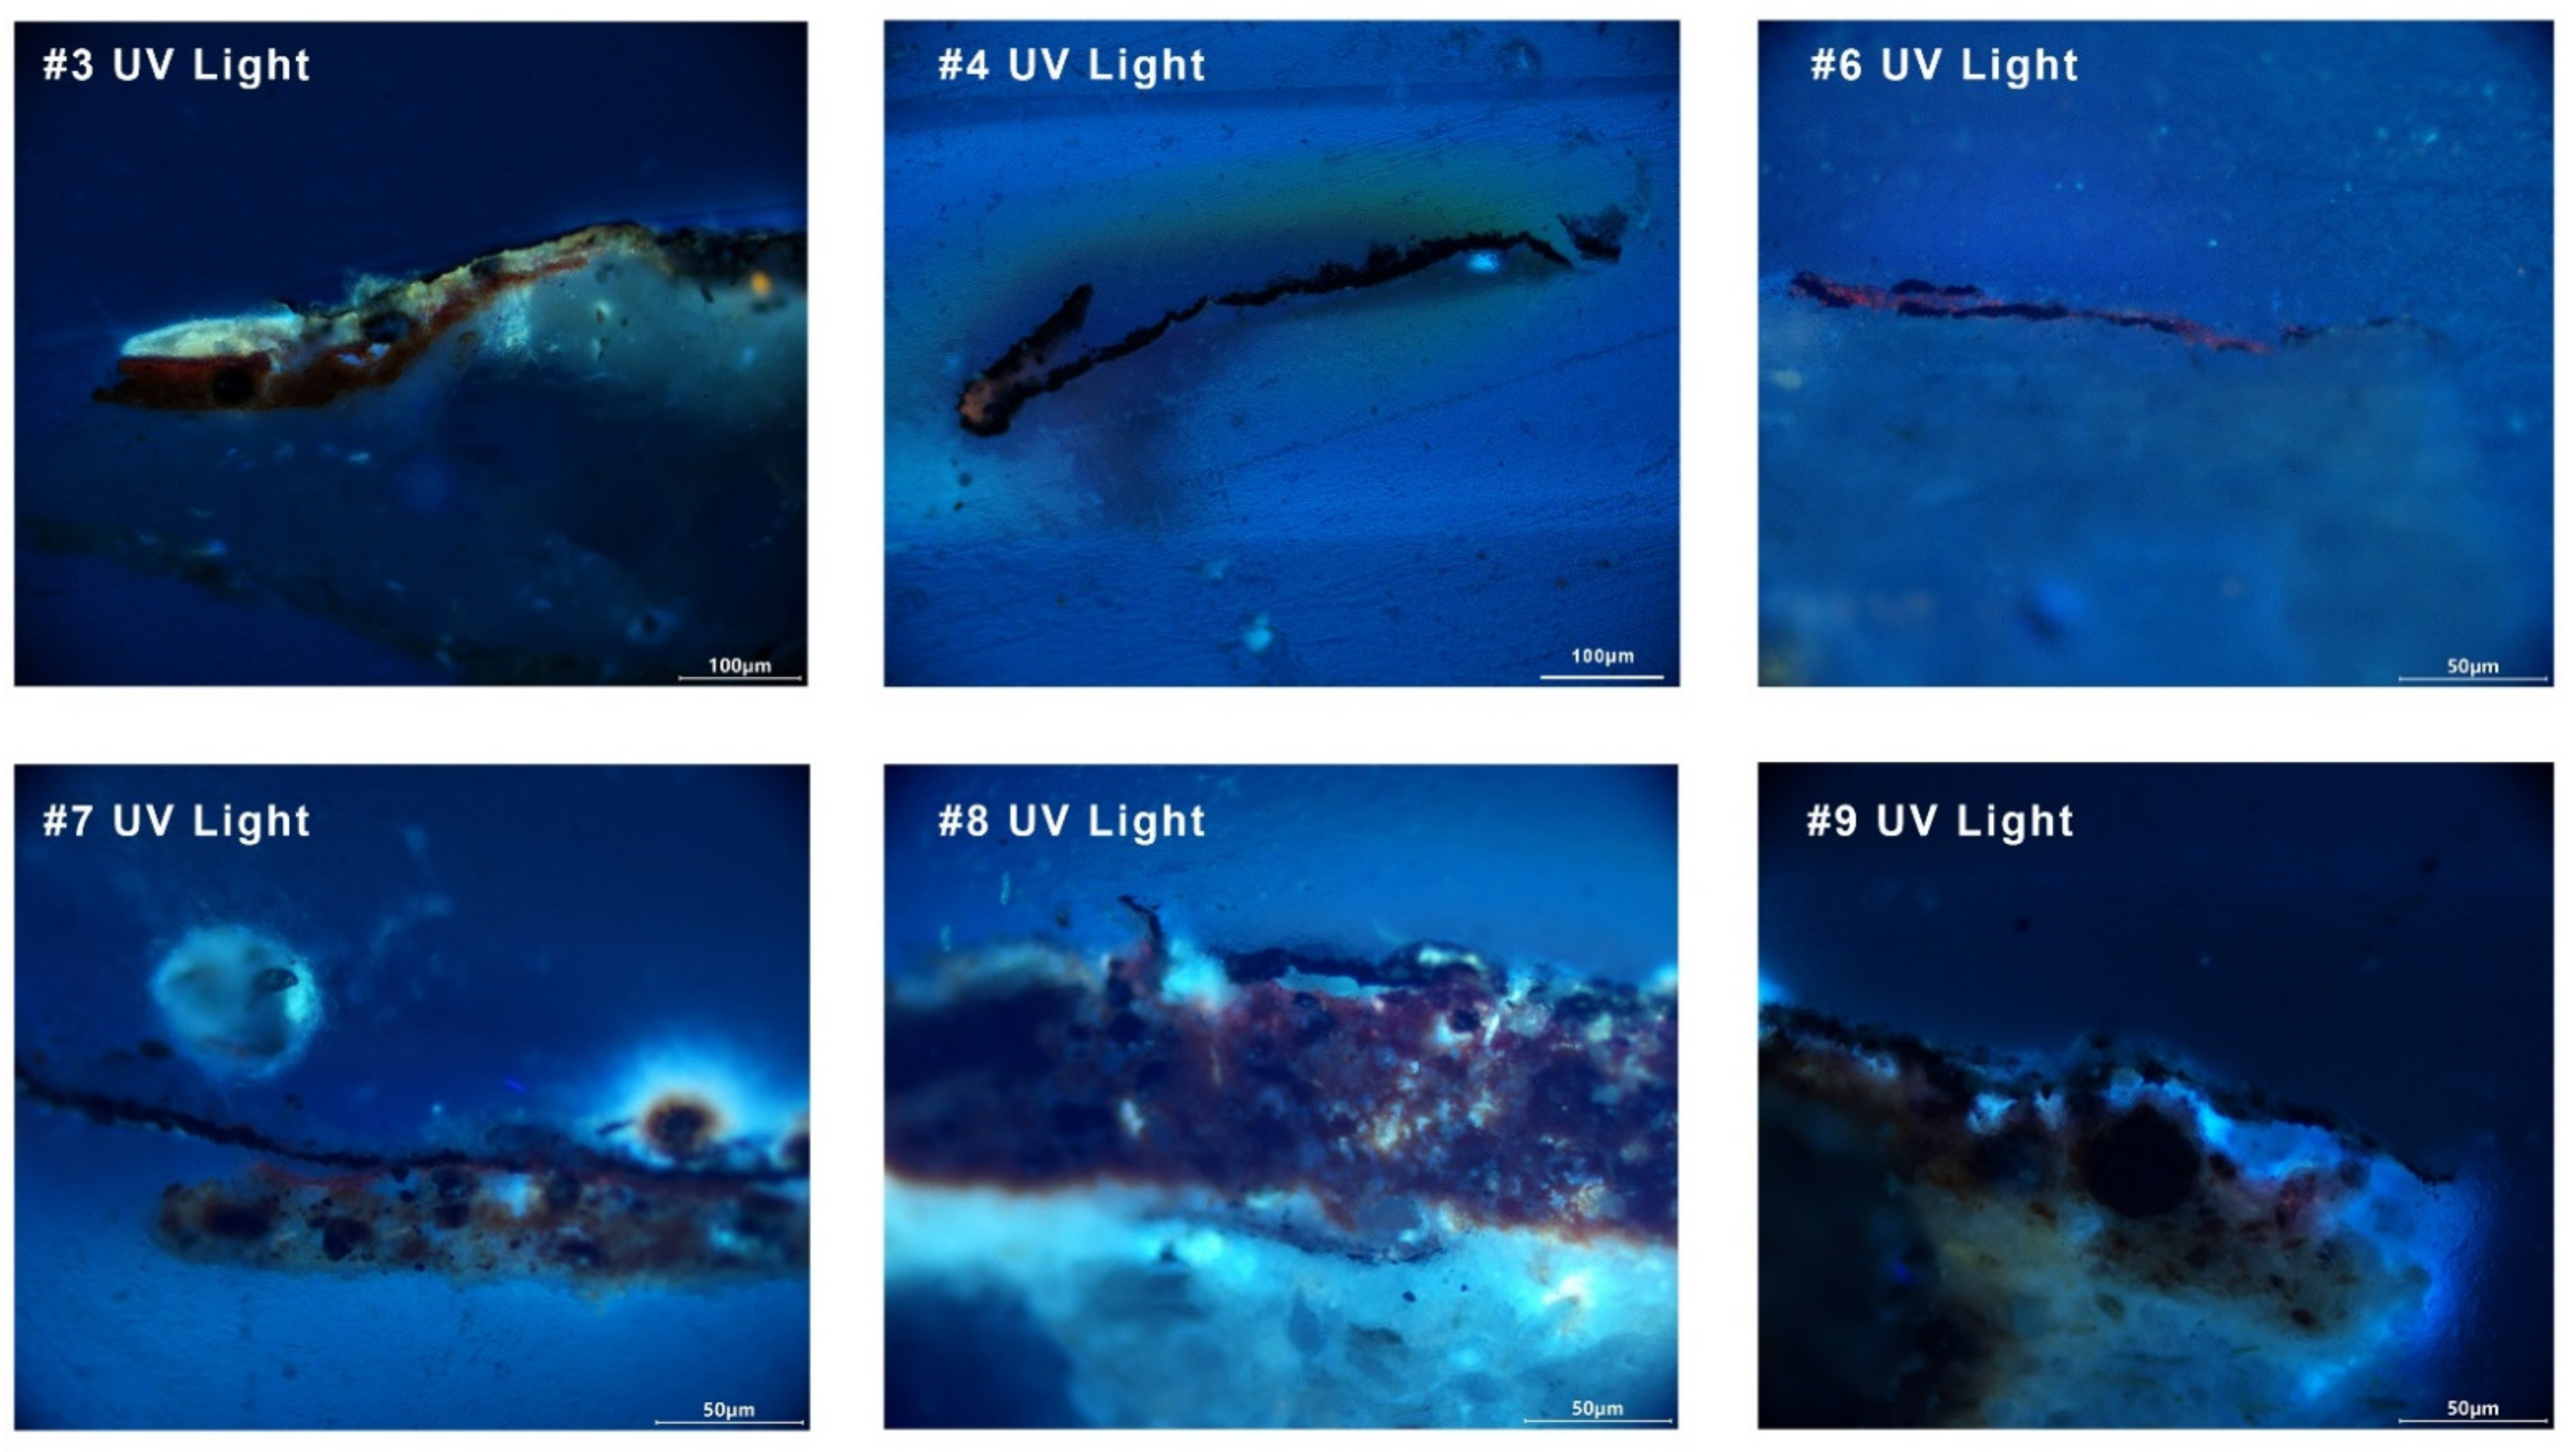
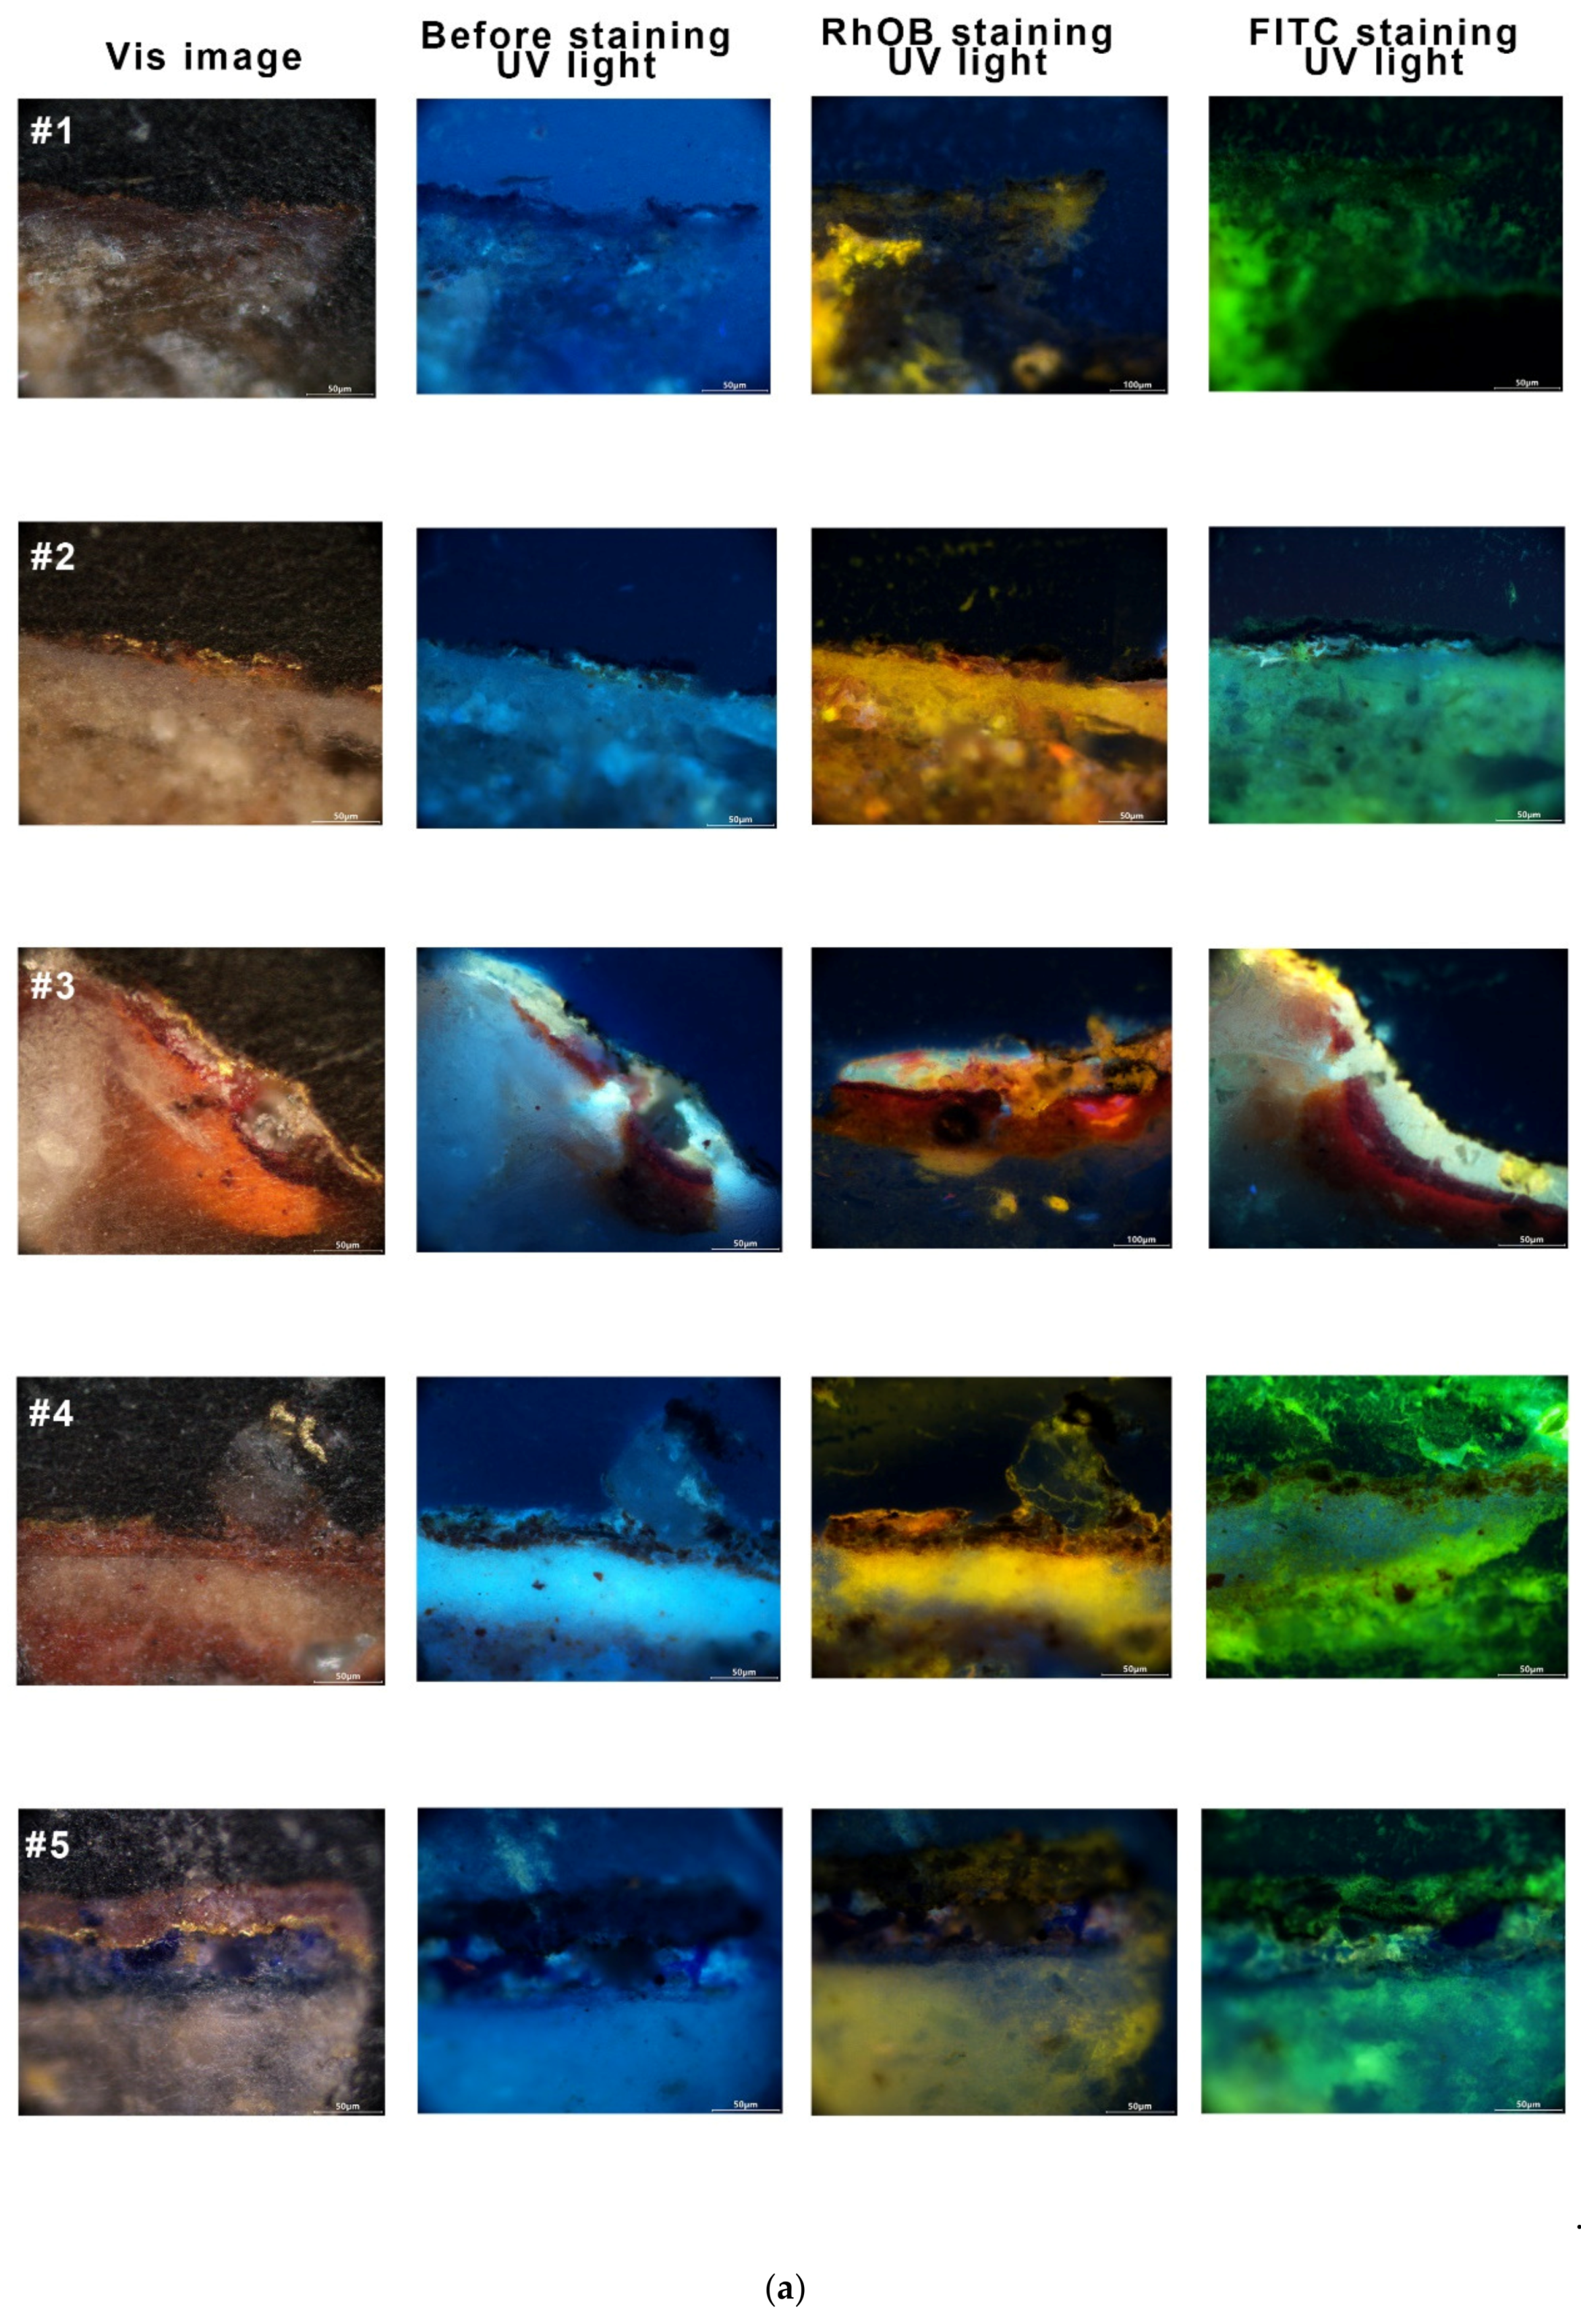
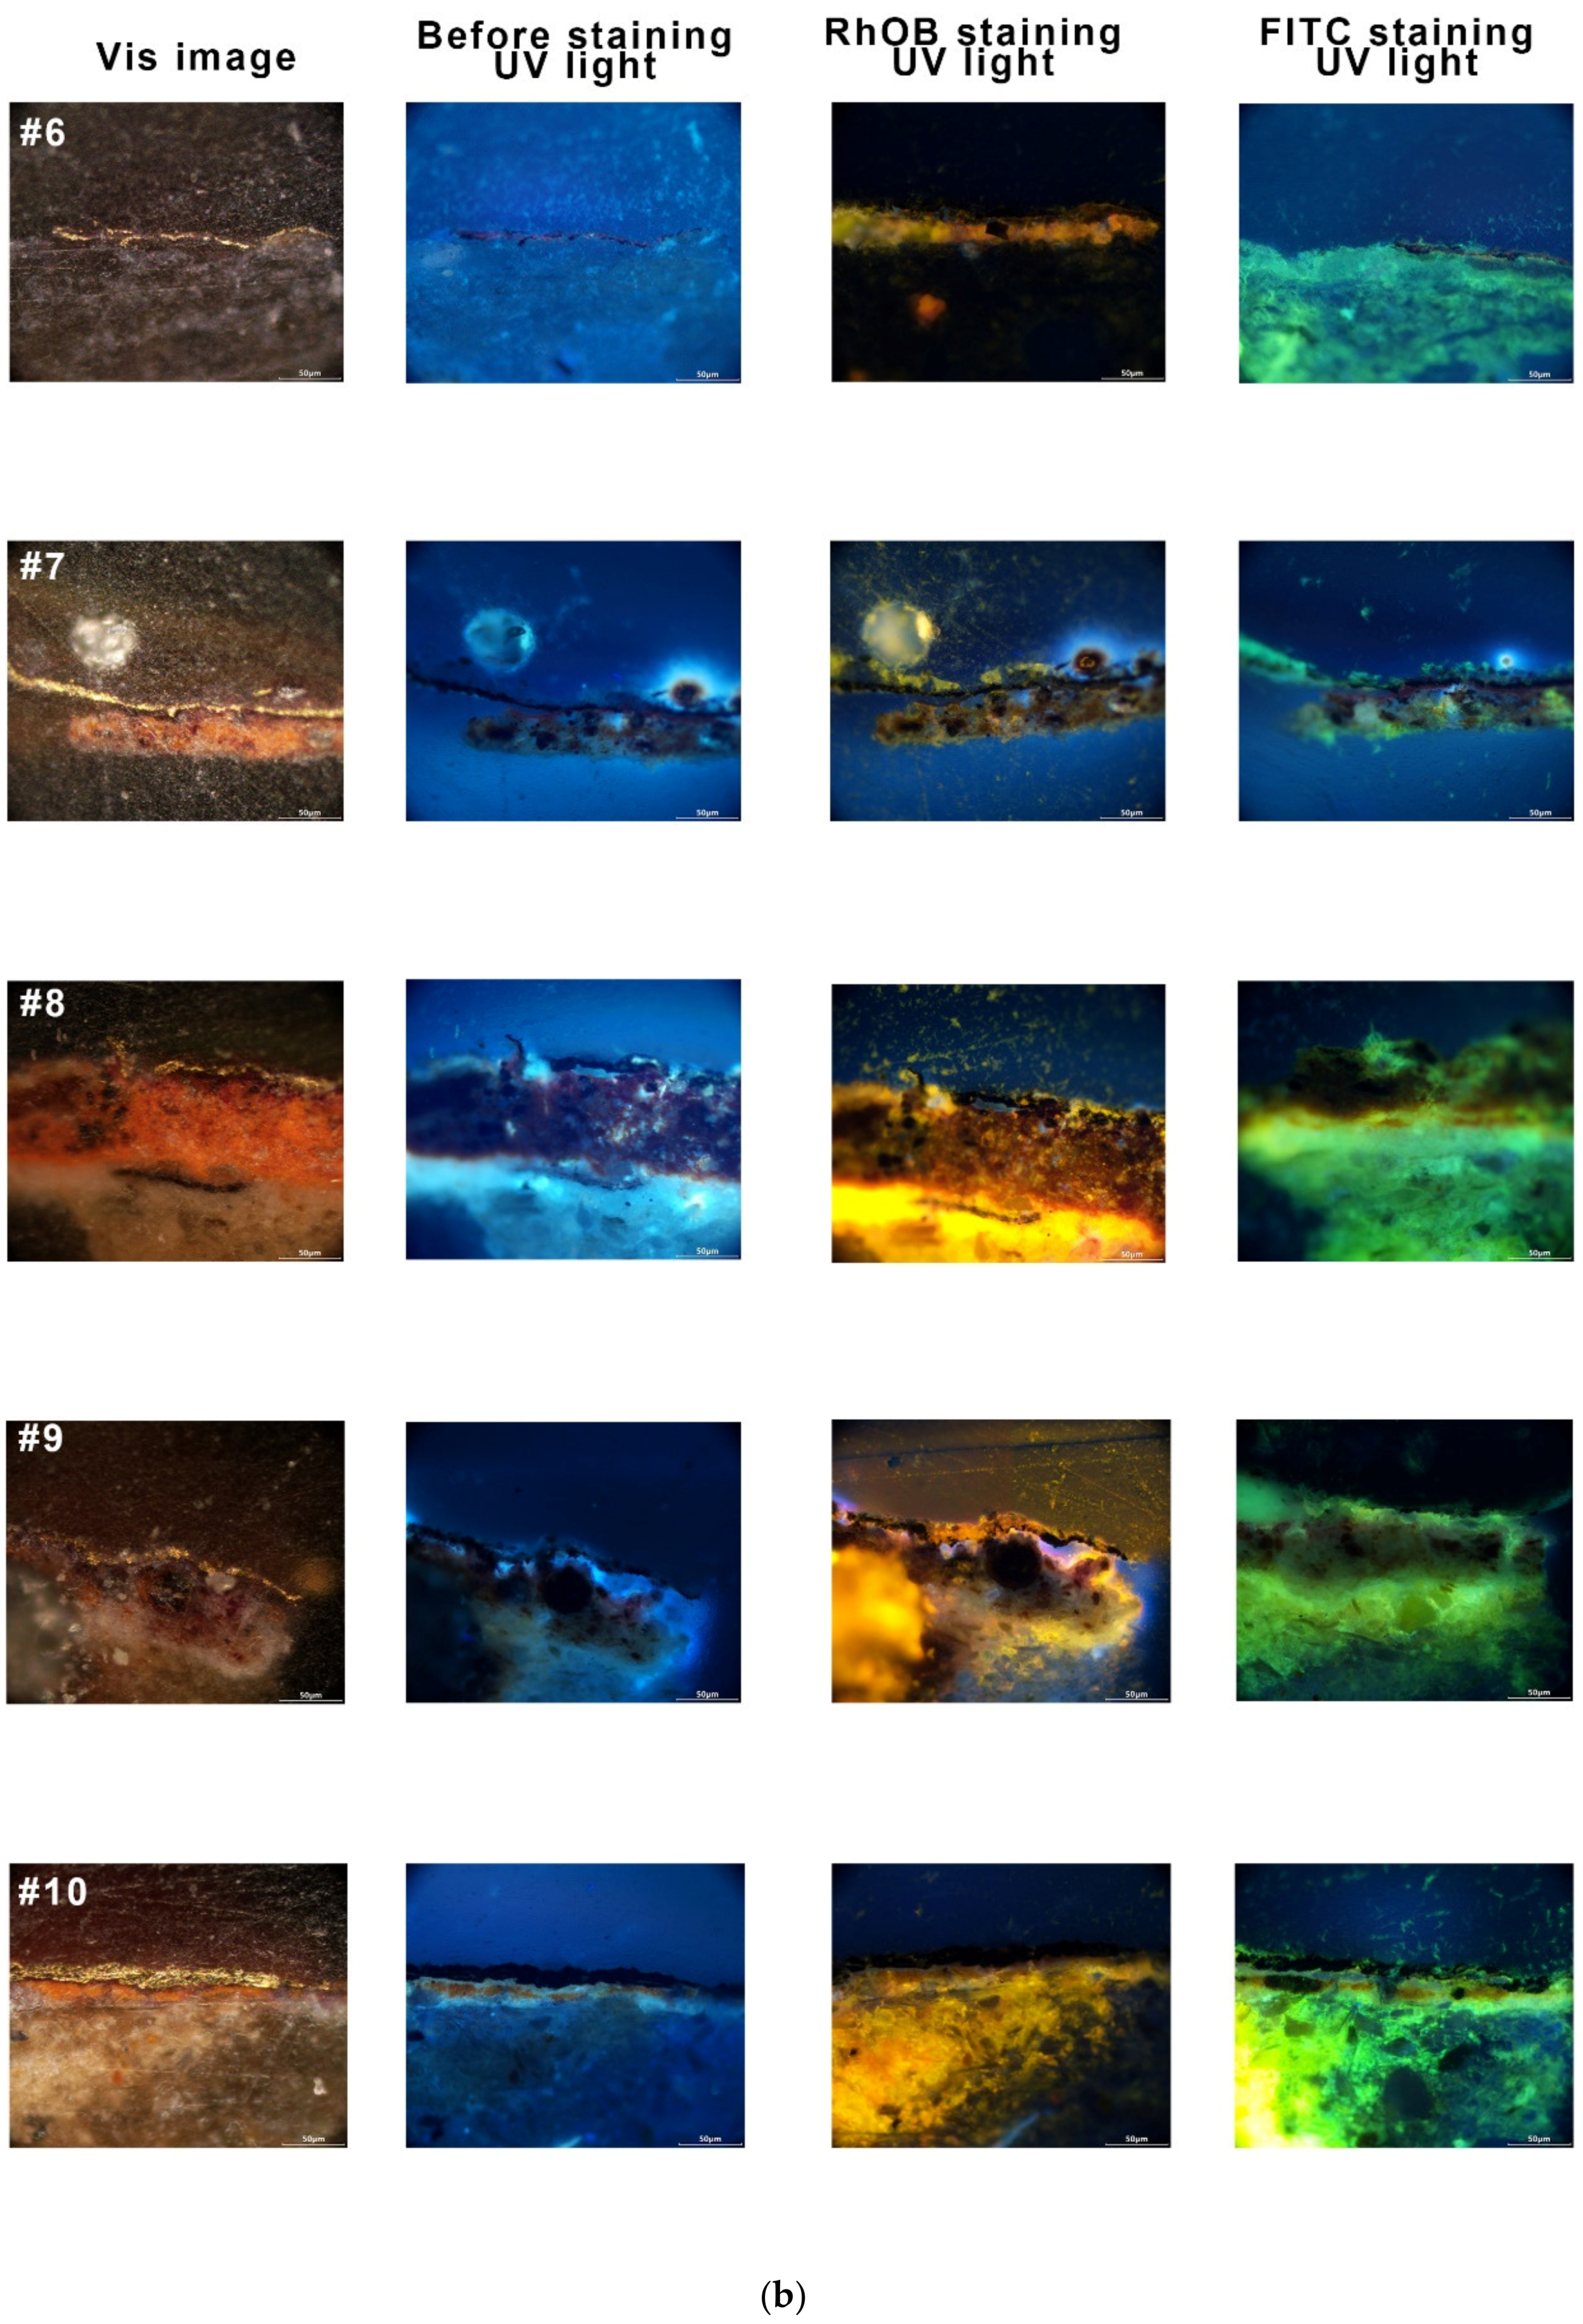
On the basis of previous studies and the Py-GC/MS results, it is possible that dry oil and red lac resin were mainly used as the adhesive medium in the gold gilding of Kizil. Furthermore, pyrrole substances were also detected in samples #5, #8, #9, and #10, indicating the presence of proteins. In order to distinguish different kinds of organic materials in the cross-section, fluorescence microscopy observation under UV light was carried out. In this study, mock-up samples were prepared using minium mixed with oil and animal glue, and observed under a UV lamp at the central wavelength of 365 nm after the staining with 0.05 wt.% rhodamine B (RhOB) ethanol solution and 0.06 wt.% fluorescein isothiocyanate (FITC) acetone solution, which were used in the identification of fat and protein substance [23]. Figure A4 shows that rhodamine staining led to orange-red fluorescence for oil, while pigments with animal glue (protein) showed green/white fluorescence after FITC staining.
The UV fluorescence images, as well as the stained UV micrographs, are collated in Figure A5a,b. The fluorescence color of sample #1 was not obvious; the fluorescence in the image after FITC staining indicates where protein may have been used. Orange fluorescence could be observed in the UV images after RhOB staining except for #1 and #9. The yellow fluorescent layer in #2, #3, #4, #6, and #9 was located below the gold foil and mixed with lead red. Samples #3, #7, #8, and #9 had lac resin below the foil. The bright-white fluorescent layer in samples #3 and #10 was particularly evident, indicating the presence of the dry oil used as mordant to bind the foil. In sample #1, gold existed as powder, which may have been mixed using animal glue due to the lack of obvious orange fluorescence material shown in RhOB staining. In addition, the layers above the foil could be seen clearly under fluorescence microscopy in #2, #6, #7, and #9. The upper layers over gold foil of #2 and #7 showed green fluorescence under UV light after FITC staining, indicating possible proteins; the upper layer of #6 was red under UV, indicating lac resin. The upper layer of #9 was orange after RhOB staining, probably suggesting a layer composed of lead red with oil. The results of fluorescence microscopy observation are summarized in Table 4.

Table 4.
Positive fluorescence reaction results with the possible use of organic material in each layer.
In contrast, as shown in Figure 5, red fluorescence could be observed in samples #3, #7, and #9 (a small amount of fluorescence could be seen in sample #8), most likely originating from the lac resin which presented orange fluorescence under UV light [24,25]. In addition, partial orange fluorescence was identified from the upper film layer of foils #4 and #6. Samples #6 and #8 were not found to be characteristic of lac resin in the Py-GC/MS results, probably because too few residues were present to be detected.
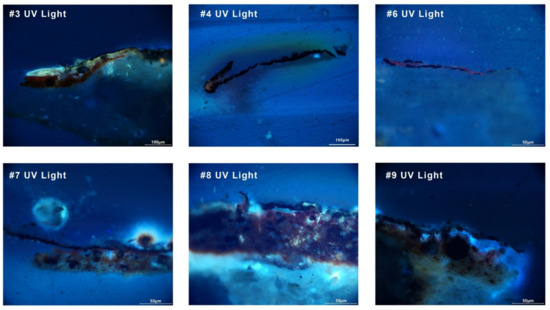
Figure 5.
Sample with orange-red fluorescence emission observed under UV.
4. Discussion
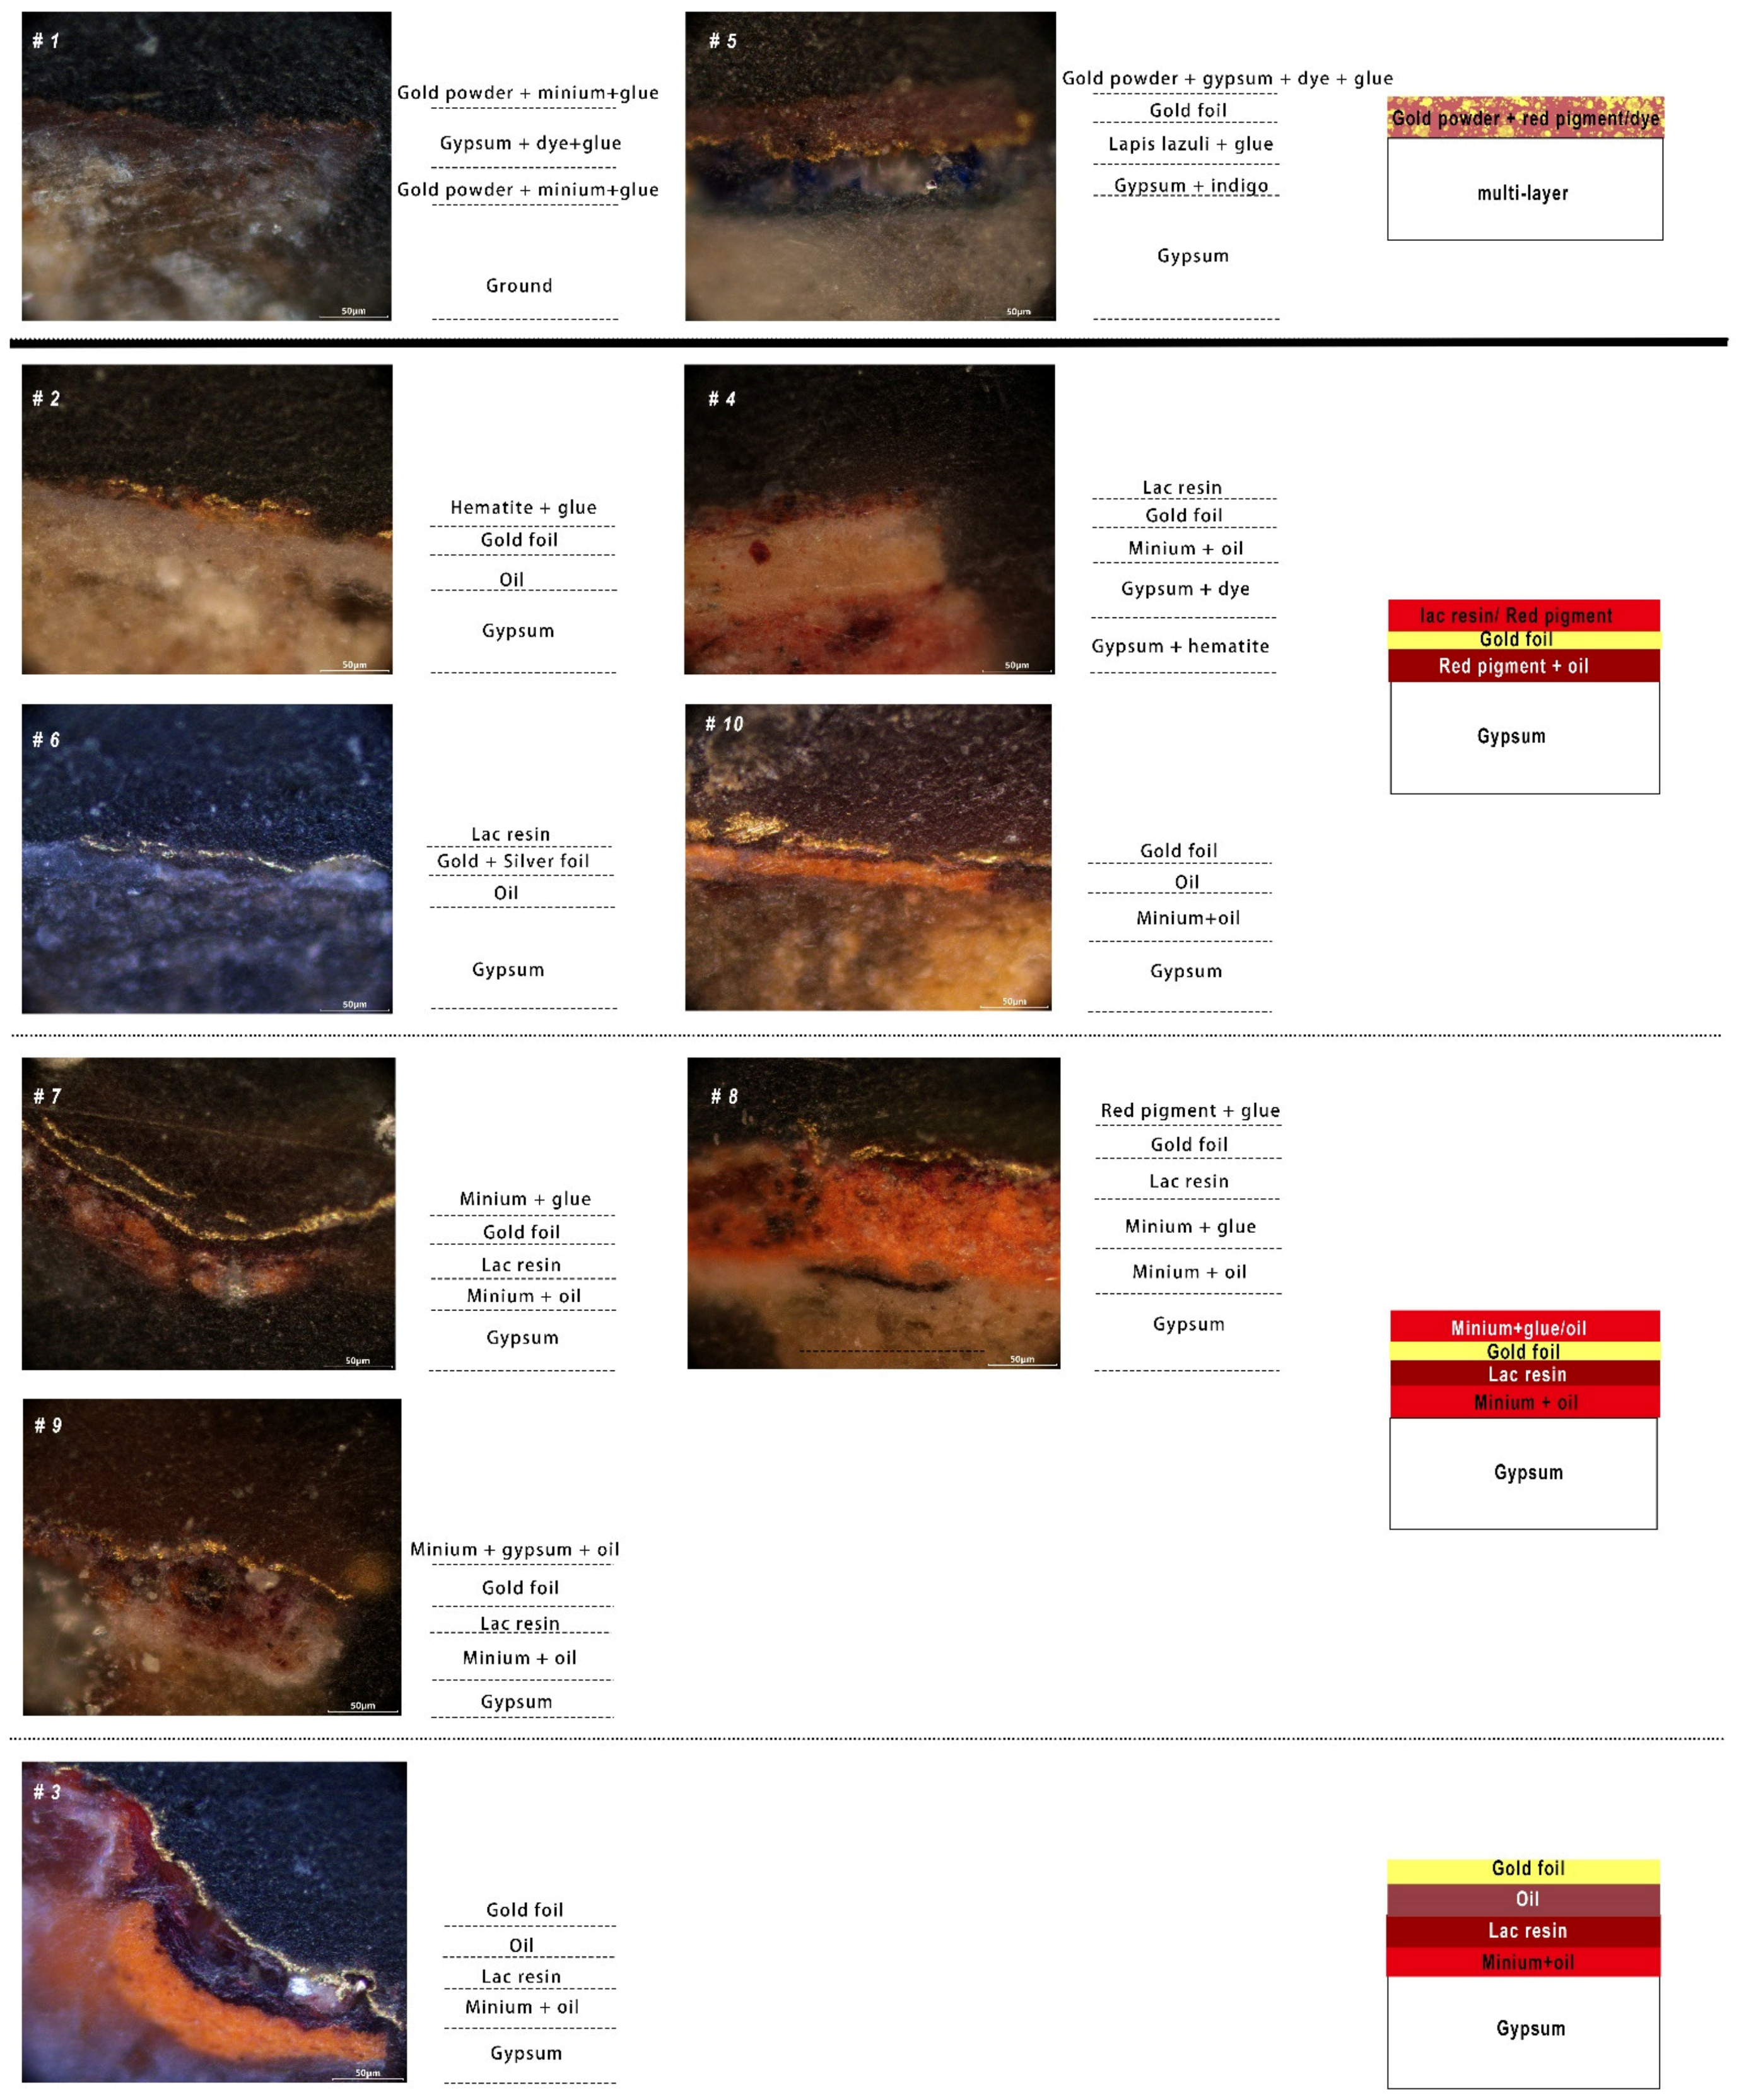
On the basis of the above analysis, the gilding decoration of the Kizil Caves murals could be divided into two categories: gold powder and gold foil (Figure 6). Sample #1 and the uppermost layer of #5 belonged to the category of powder. Gold powder was applied to the plaster base with minium, gypsum, and dye, using animal glue as a binding medium, similar to a pigment, which is different to the reported composition of draining and piling gold, i.e., a mixture of gold powder and calcite [26,27]. In addition, as also seen in Byzantine art (relatively close time), there were only a few occasions of gold powder usage noted. The gold powder was probably transformed from gold–quicksilver amalgams or was a result of gold leaf residue [28].
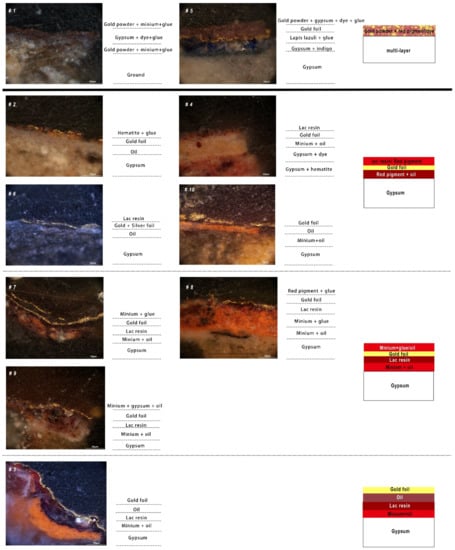
Figure 6.
The identified result of each layer and a schematic diagram of the layer structure.
The samples analyzed in this study predominantly belonged to the foil category. According to the foil mordant, this category could be divided into two main groups: an oil base, e.g., the mordant of samples #2, #4, #6, and #10, which was composed of drying oil or red pigment mixed with drying oil; lac resin on top of an oil base as foil mordant, e.g., #7, #8, and #9. In addition, there was a more unusual sample, i.e., #3. This sample had a gold foil base layer with a layer of dry oil on top of the oil base + lac resin. Given that this sample was taken from a fine gilding decoration on a red background, it is assumed that the lac resin here was applied over minium to alter its color to dark red, and that dry oil was the binding material for the gold.
The use of oil for gilding was common in both China and Europe, with tung oil being detected in several polychrome artifacts [17,29,30] and siccative oil and lead-based compounds usually employed for oil-based (mainly linseed oil) mordant gilding [31]. Even through the analysis in this paper could not reveal the exact type of drying oil, it was hypothesized to be safflower seed oil or pecan oil, with reference to the oils used in this region in ancient times. The use of lac resin for gilding is a special technique which has not been reported so far. Red lac resin was used as colorant in Asian mural paintings [26,32,33], but there have been no records for gilding. This is a reflection of the prosperity of the ancient trade in Kucha (lac was originally produced in South Asia [34,35]), which contributed to an innovation of techniques.
One of the more striking features of the gilding of the Kizil Grottoes is the presence of a surface coating on the gold foil. Most of the samples analyzed had surface coatings (only samples #8, #3, and #10 did not). This indicates that the ancient painters of the murals in Kizil not only used the golden luster of gold leaf to decorate the murals, but also used it as a ground layer to apply colorant for a special visual effect. This shows the diversity of the decorative effects of gold leaf. The materials used to coat the foil were also quite diverse, with samples #4 and #6 being coated with organic lac resin, samples #2 and #7 being coated with animal glue mixed with red hematite or orange-red lead, and sample #9 being coated with a mixture of dry oil, lead pellets, and gypsum. This diversity not only reflects the various decorative skills of the ancient painters, but is also an important physical manifestation of the ancient Kucha region as an important crossroad on the Silk Road.
Dyes were also clearly observed with gypsum in the layers under the foil of #4 and #5. Gypsum and indigo were both found in #5 using Raman spectroscopy, and gypsum mixed with some kind of red dye was observed in #4. Caves No. 47 and No. 48 were dated in the fourth century AD; hence, it is possible that the ancient painters had mastered the use of organic dyes and inorganic pigments to show rich colors around this time.
5. Conclusions
The present study focused on the materials and techniques of gold gilding in Kizil Grottoes using multiple analytical methods. The results not only provide a systematic overview of gold gilding decoration techniques of Kizil, but also illustrate the material trade and technique exchanges along the Silk Road in the past. The conclusions of the study are as follows:
- (1)
- The gilding of the Kizil Grottoes could be divided into two categories: powdered gold and foil gold, with the latter predominating.
- (2)
- There were two types of gold foil mordant: oil-based and oil-based + lac resin, with the latter representing a novel and unique application.
- (3)
- The Kizil Cave mural was decorated with gold not only as a decoration, but also as a ground layer for various red colorants.
Unfortunately, some organic red dyes and the types of drying oil used in gilding remain unknown. Furthermore, the present study has led to questions about why different types of mordant were used and why coating layers were used on the gold surface. More examples need to be collected systematically, and a mock-up is also necessary to understand the gilding technique and the visual effectiveness of different materials.
Author Contributions
J.Y., methodology and resources; Z.Z., review and editing; T.L., investigation; L.S. investigation and writing—original draft preparation. All authors have read and agreed to the published version of the manuscript.
Funding
This study was financially supported by the Xinjiang Philosophy and Social Science Foundation (No. 22BKG057).
Data Availability Statement
The data presented in this study are available from the corresponding author upon request.
Acknowledgments
The authors thank Ma from Ningbo Museum for help with Raman spectrometry analysis. This study was financially supported by the Xinjiang Social Science Foundation (No. 22BKG057).
Conflicts of Interest
The authors declare no conflict of interest.
Appendix A
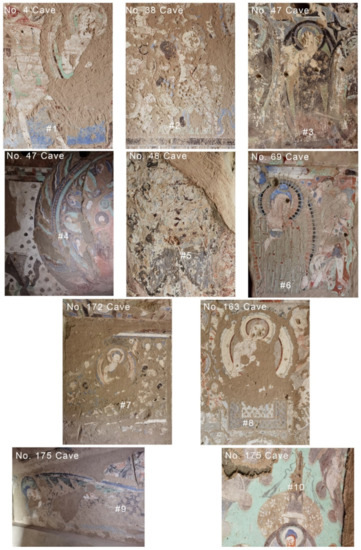
Figure A1.
The sampling locations and the mural image contents.
Figure A1.
The sampling locations and the mural image contents.
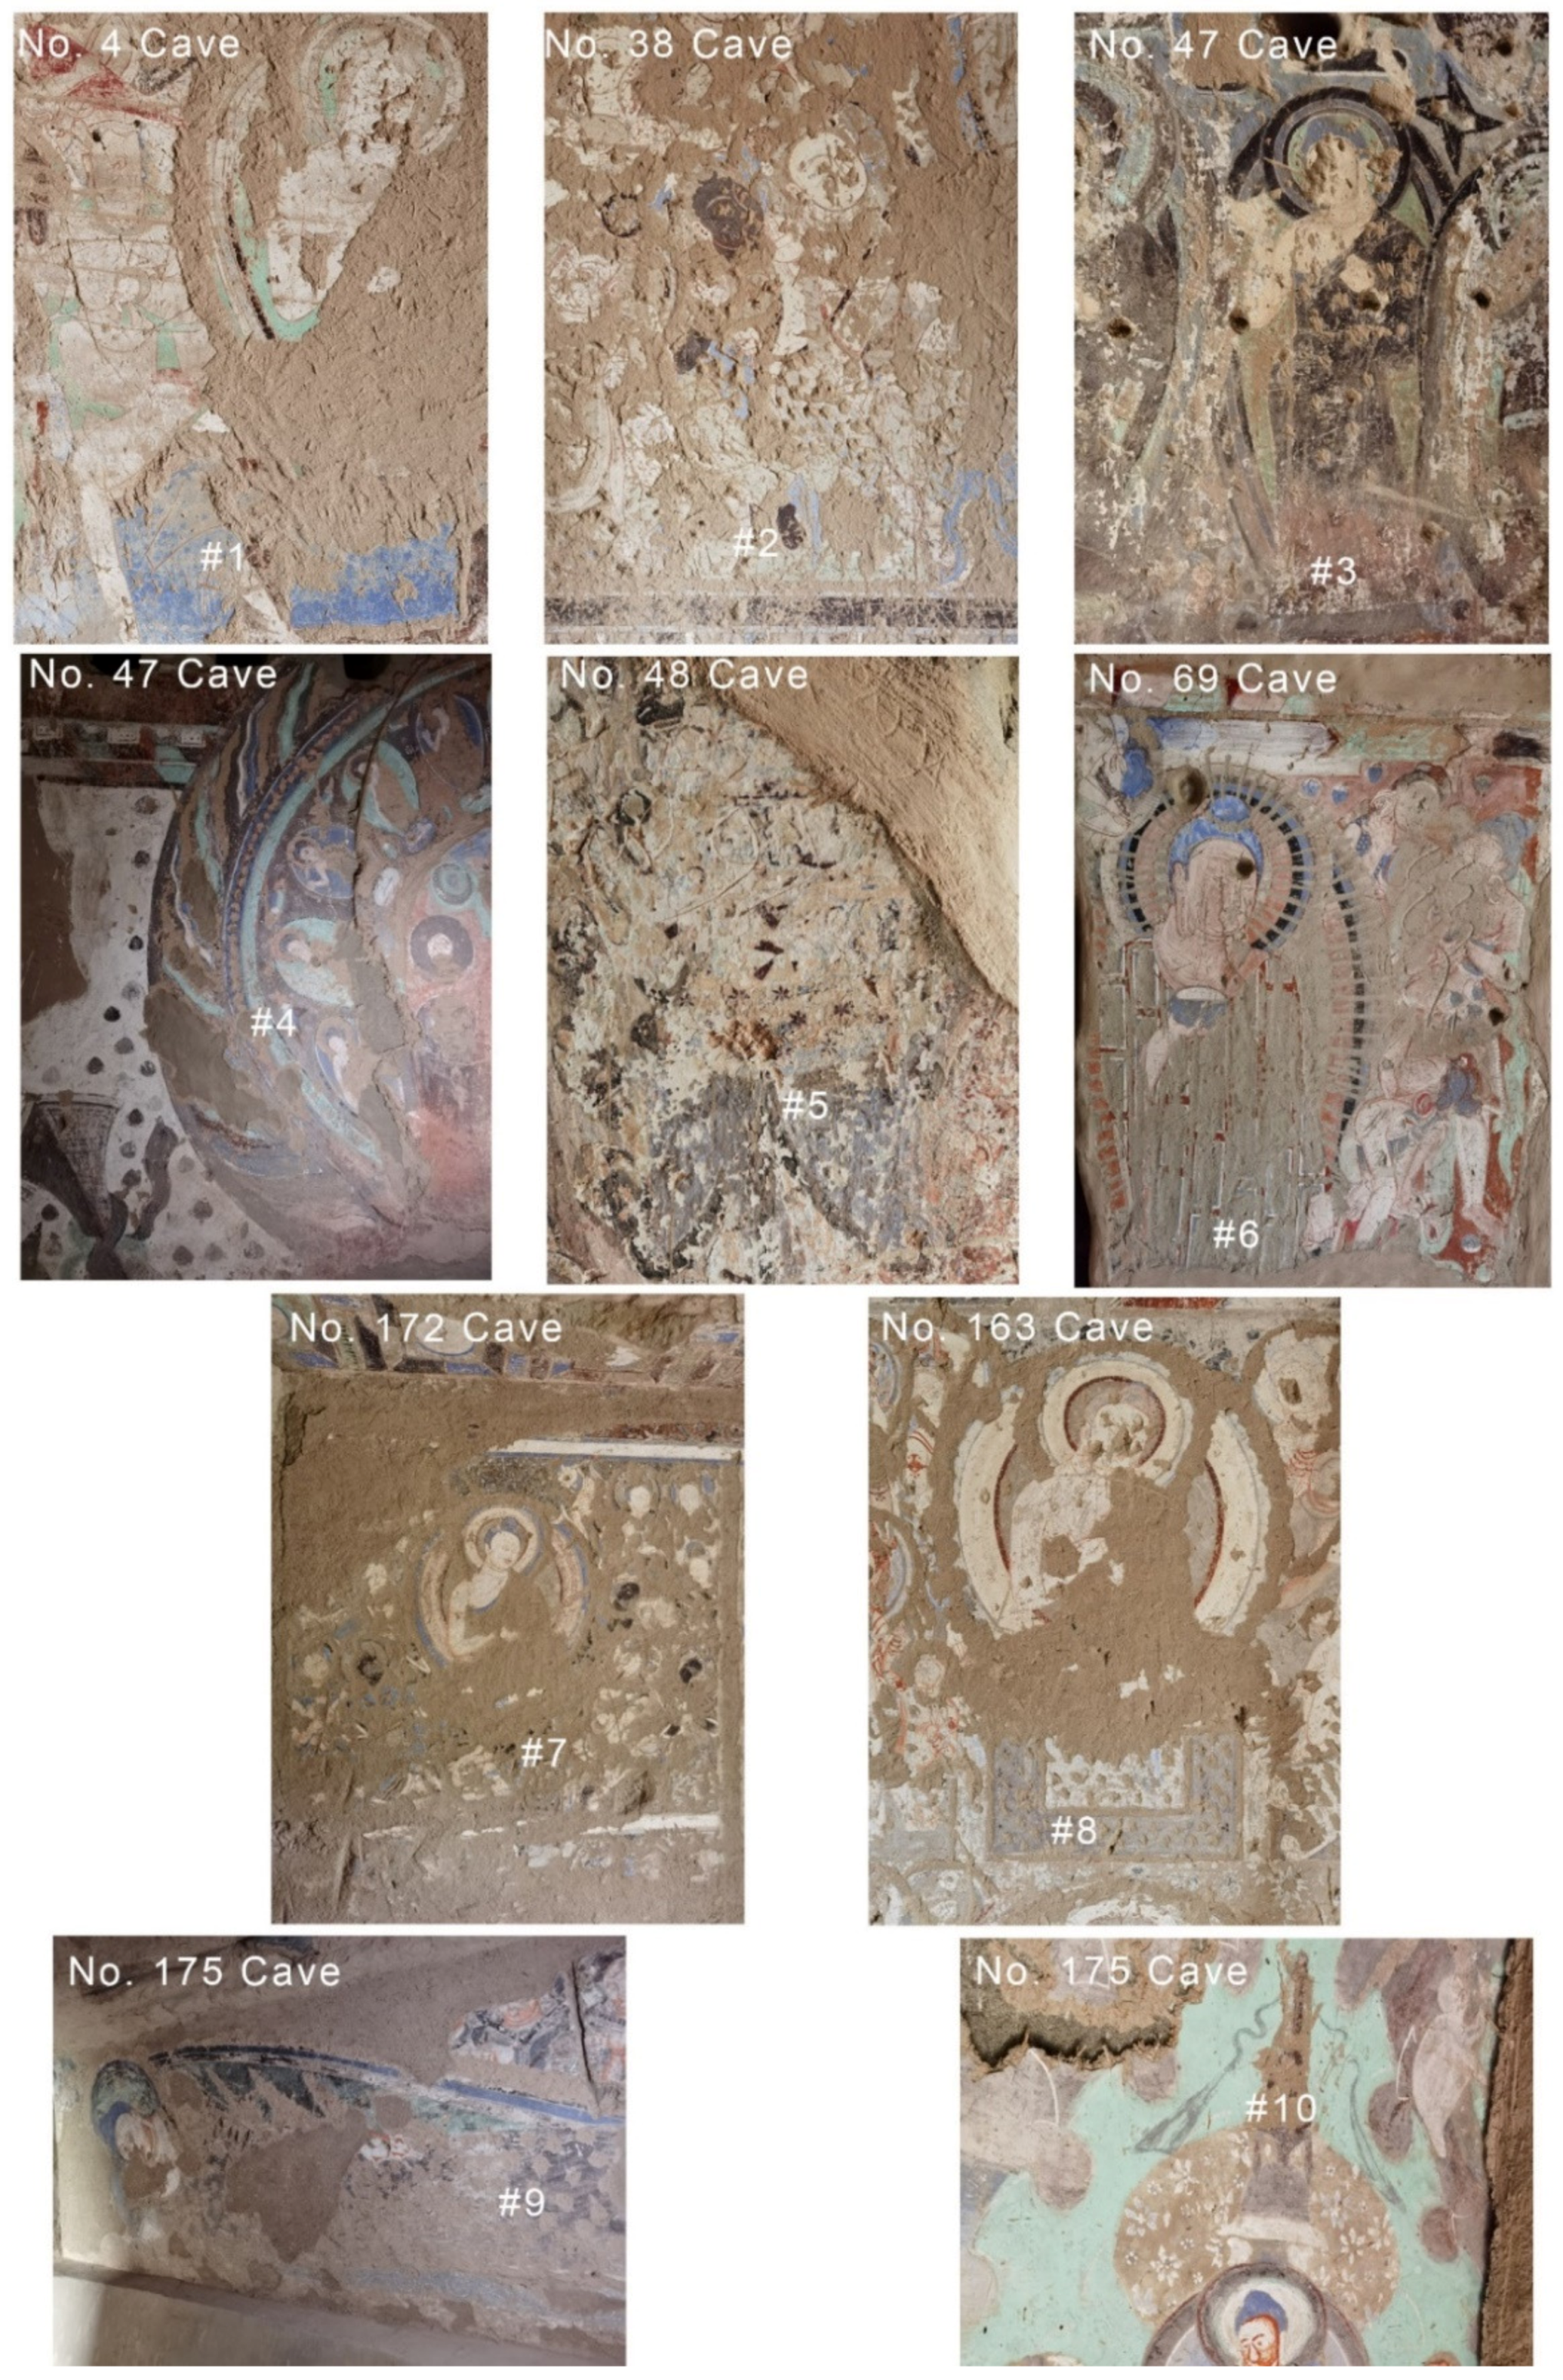
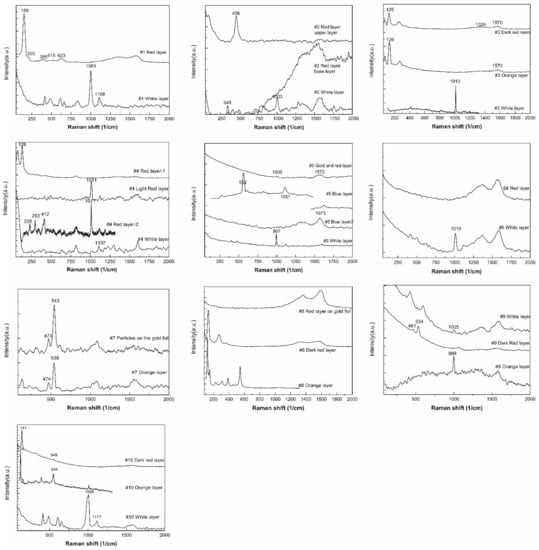
Figure A2.
The Raman spectra of each sample layer.
Figure A2.
The Raman spectra of each sample layer.
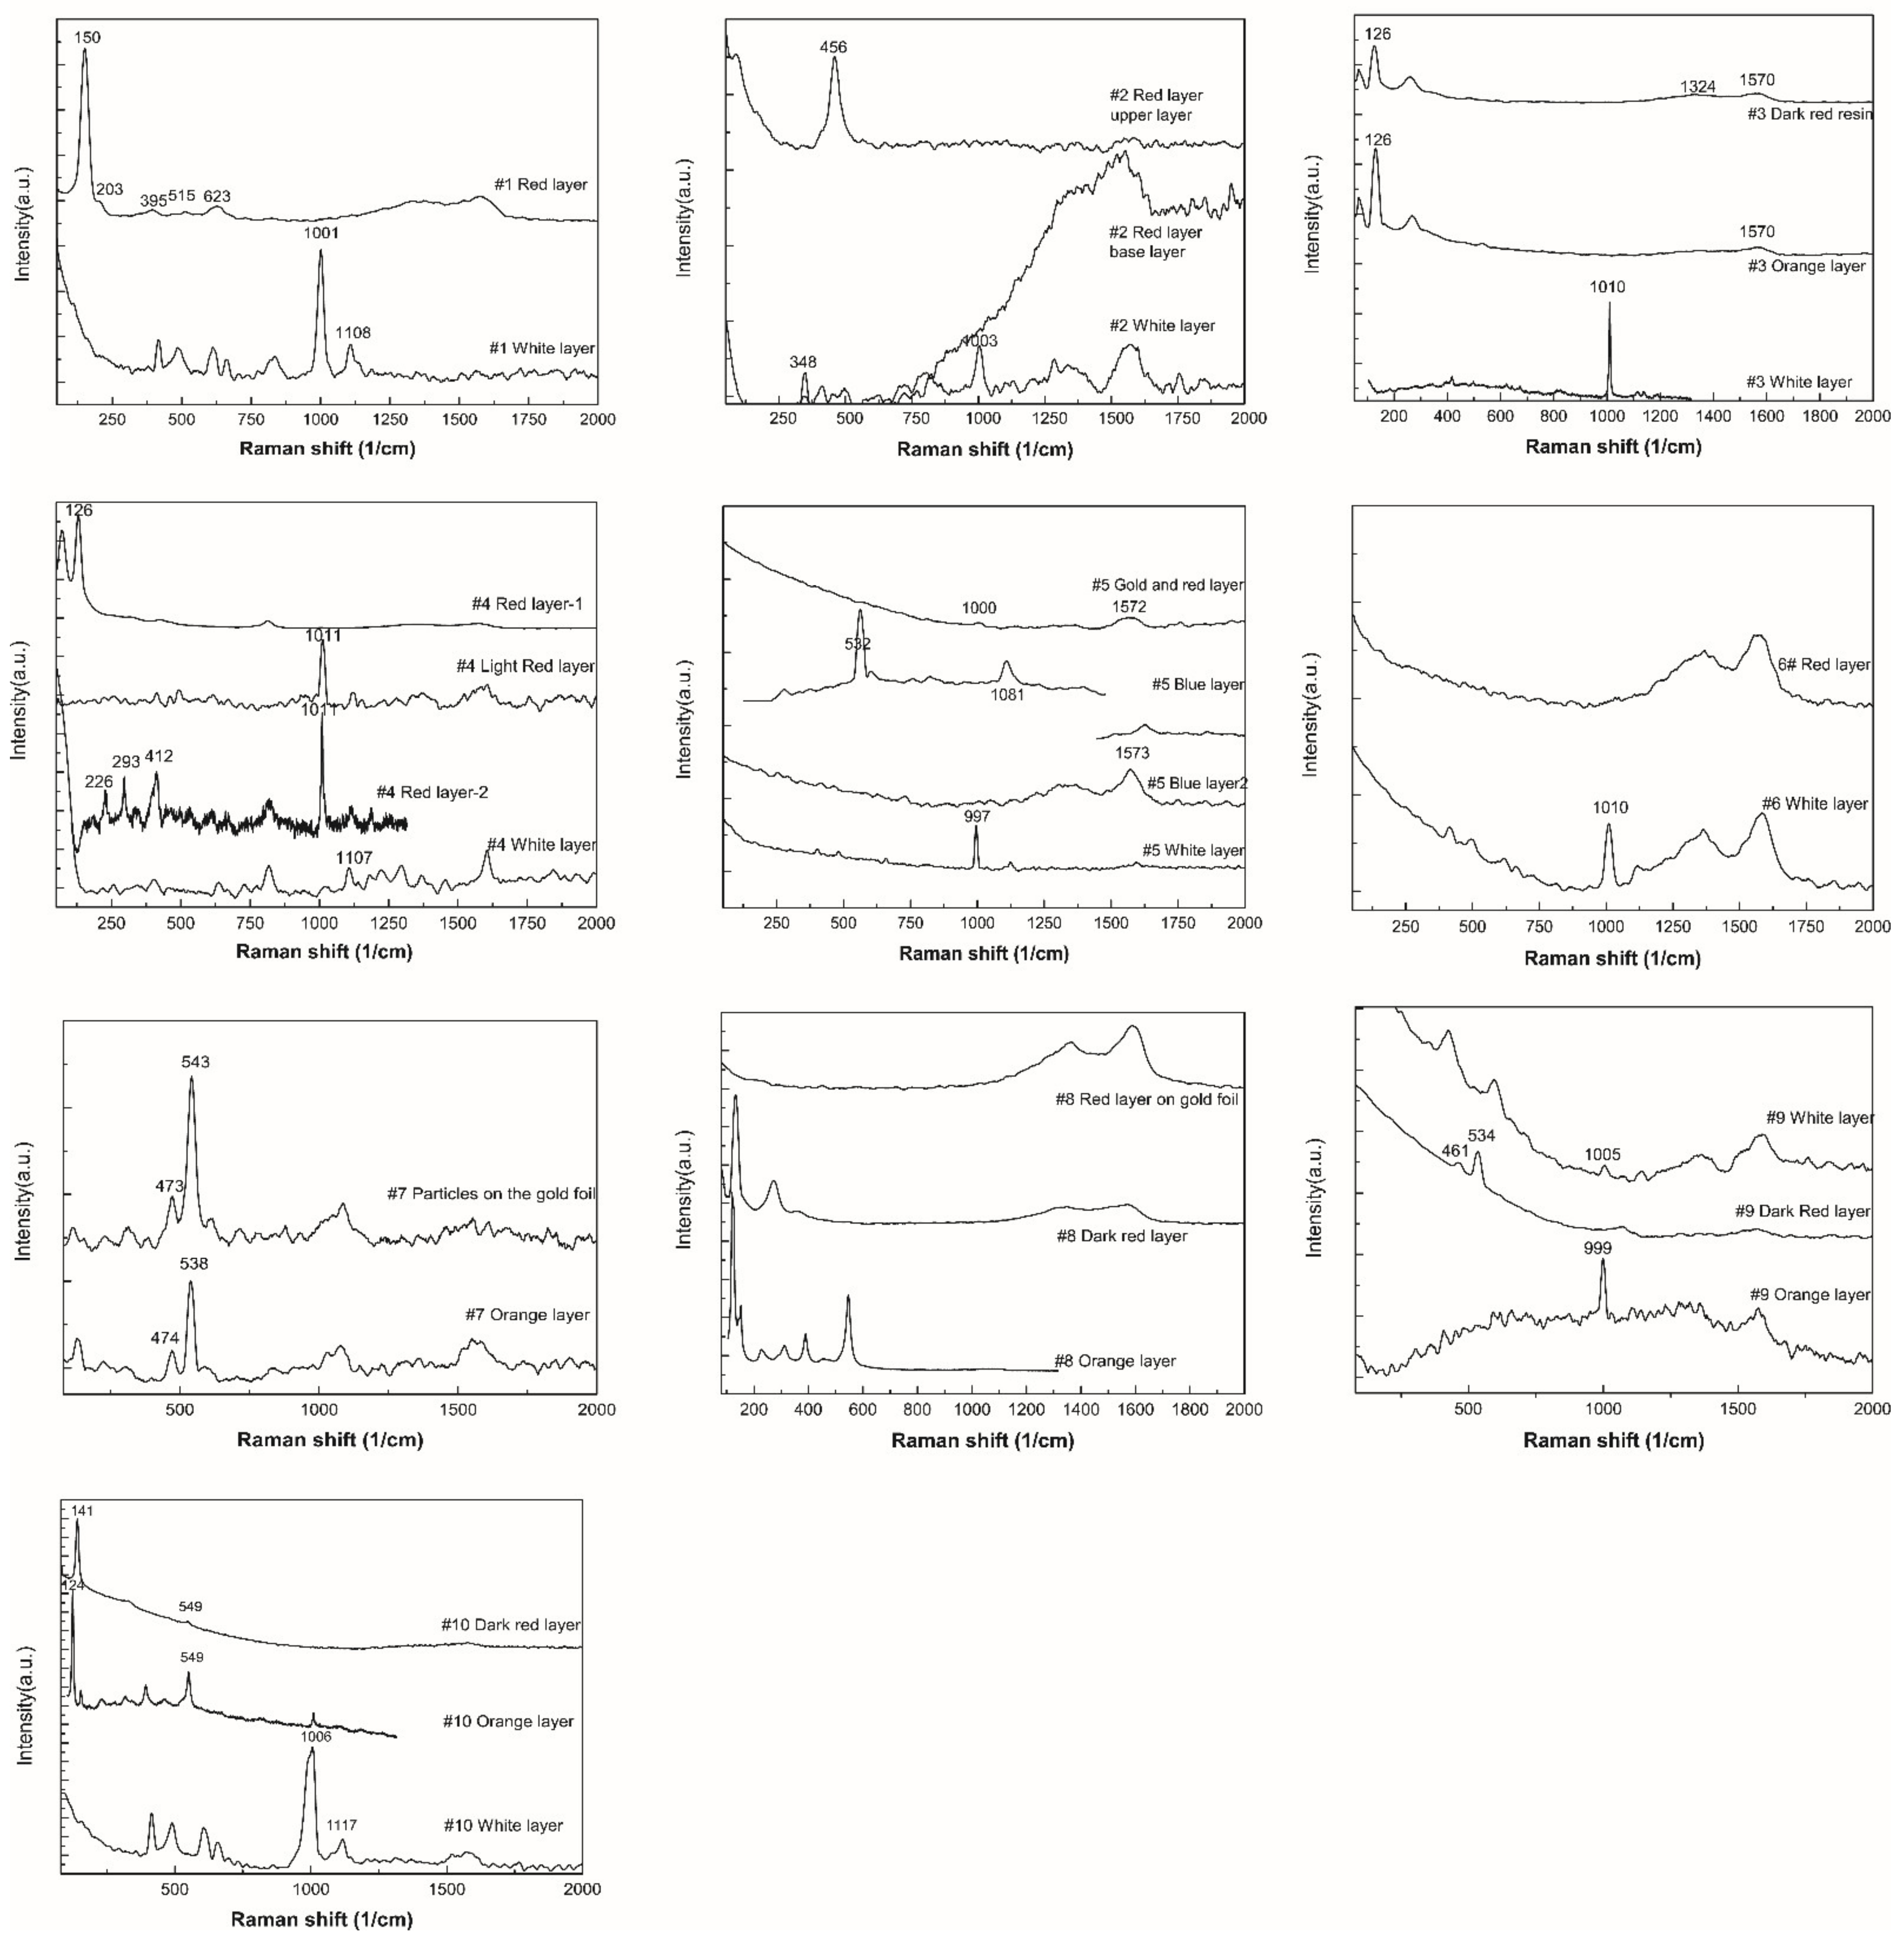
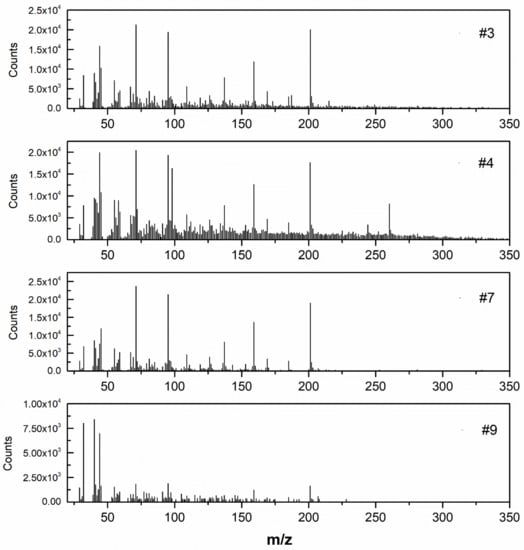
Figure A3.
The fragment spectra of lac resin marker aleuritic acid (RT 48.38 min) obtained from samples #3, #4, #7, and #9.
Figure A3.
The fragment spectra of lac resin marker aleuritic acid (RT 48.38 min) obtained from samples #3, #4, #7, and #9.
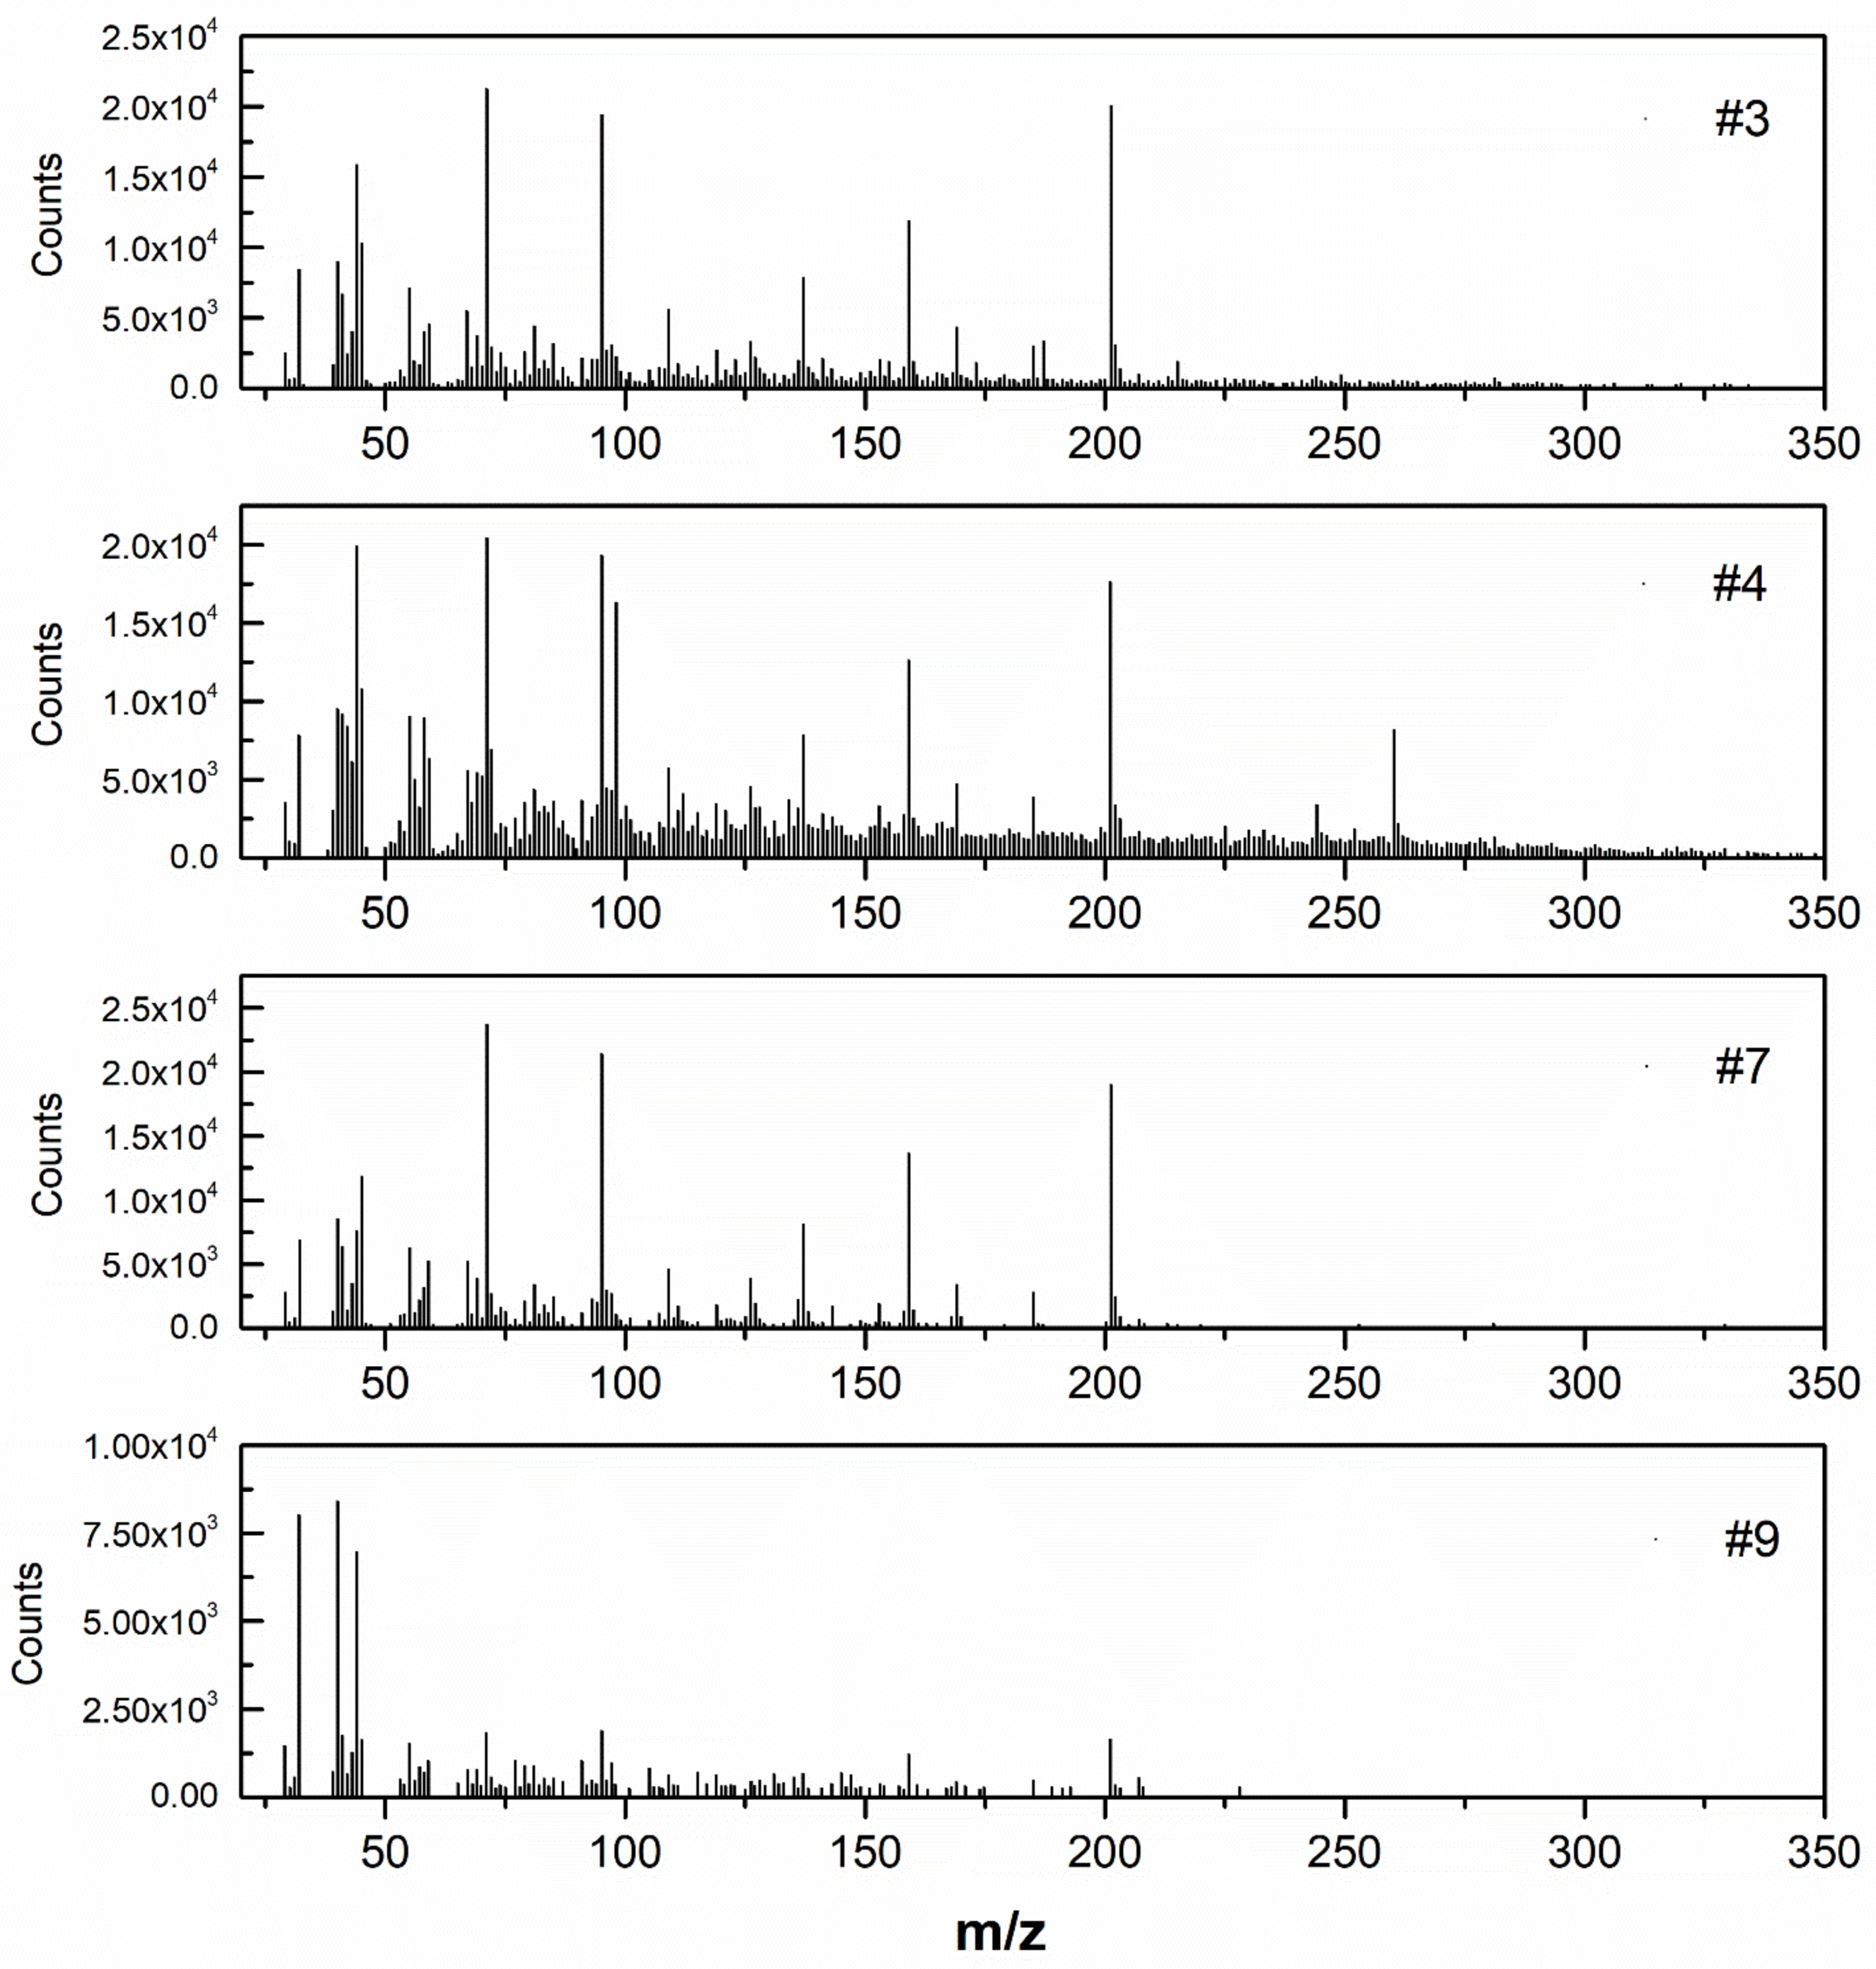
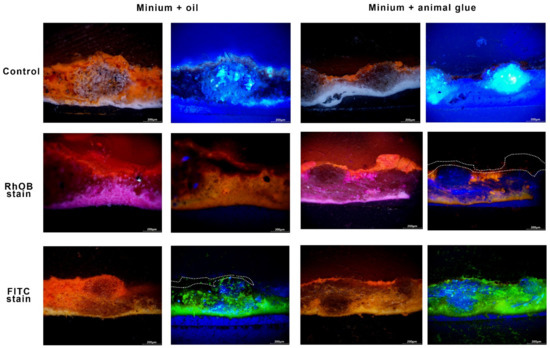
Figure A4.
Reference sample showing pictorial layers made using minium mixed with oil and glue on a ground layer made of canvas. The images were obtained under UV light with no RhOB or FITC staining. The dotted line indicates the area of fluorescent emission.
Figure A4.
Reference sample showing pictorial layers made using minium mixed with oil and glue on a ground layer made of canvas. The images were obtained under UV light with no RhOB or FITC staining. The dotted line indicates the area of fluorescent emission.
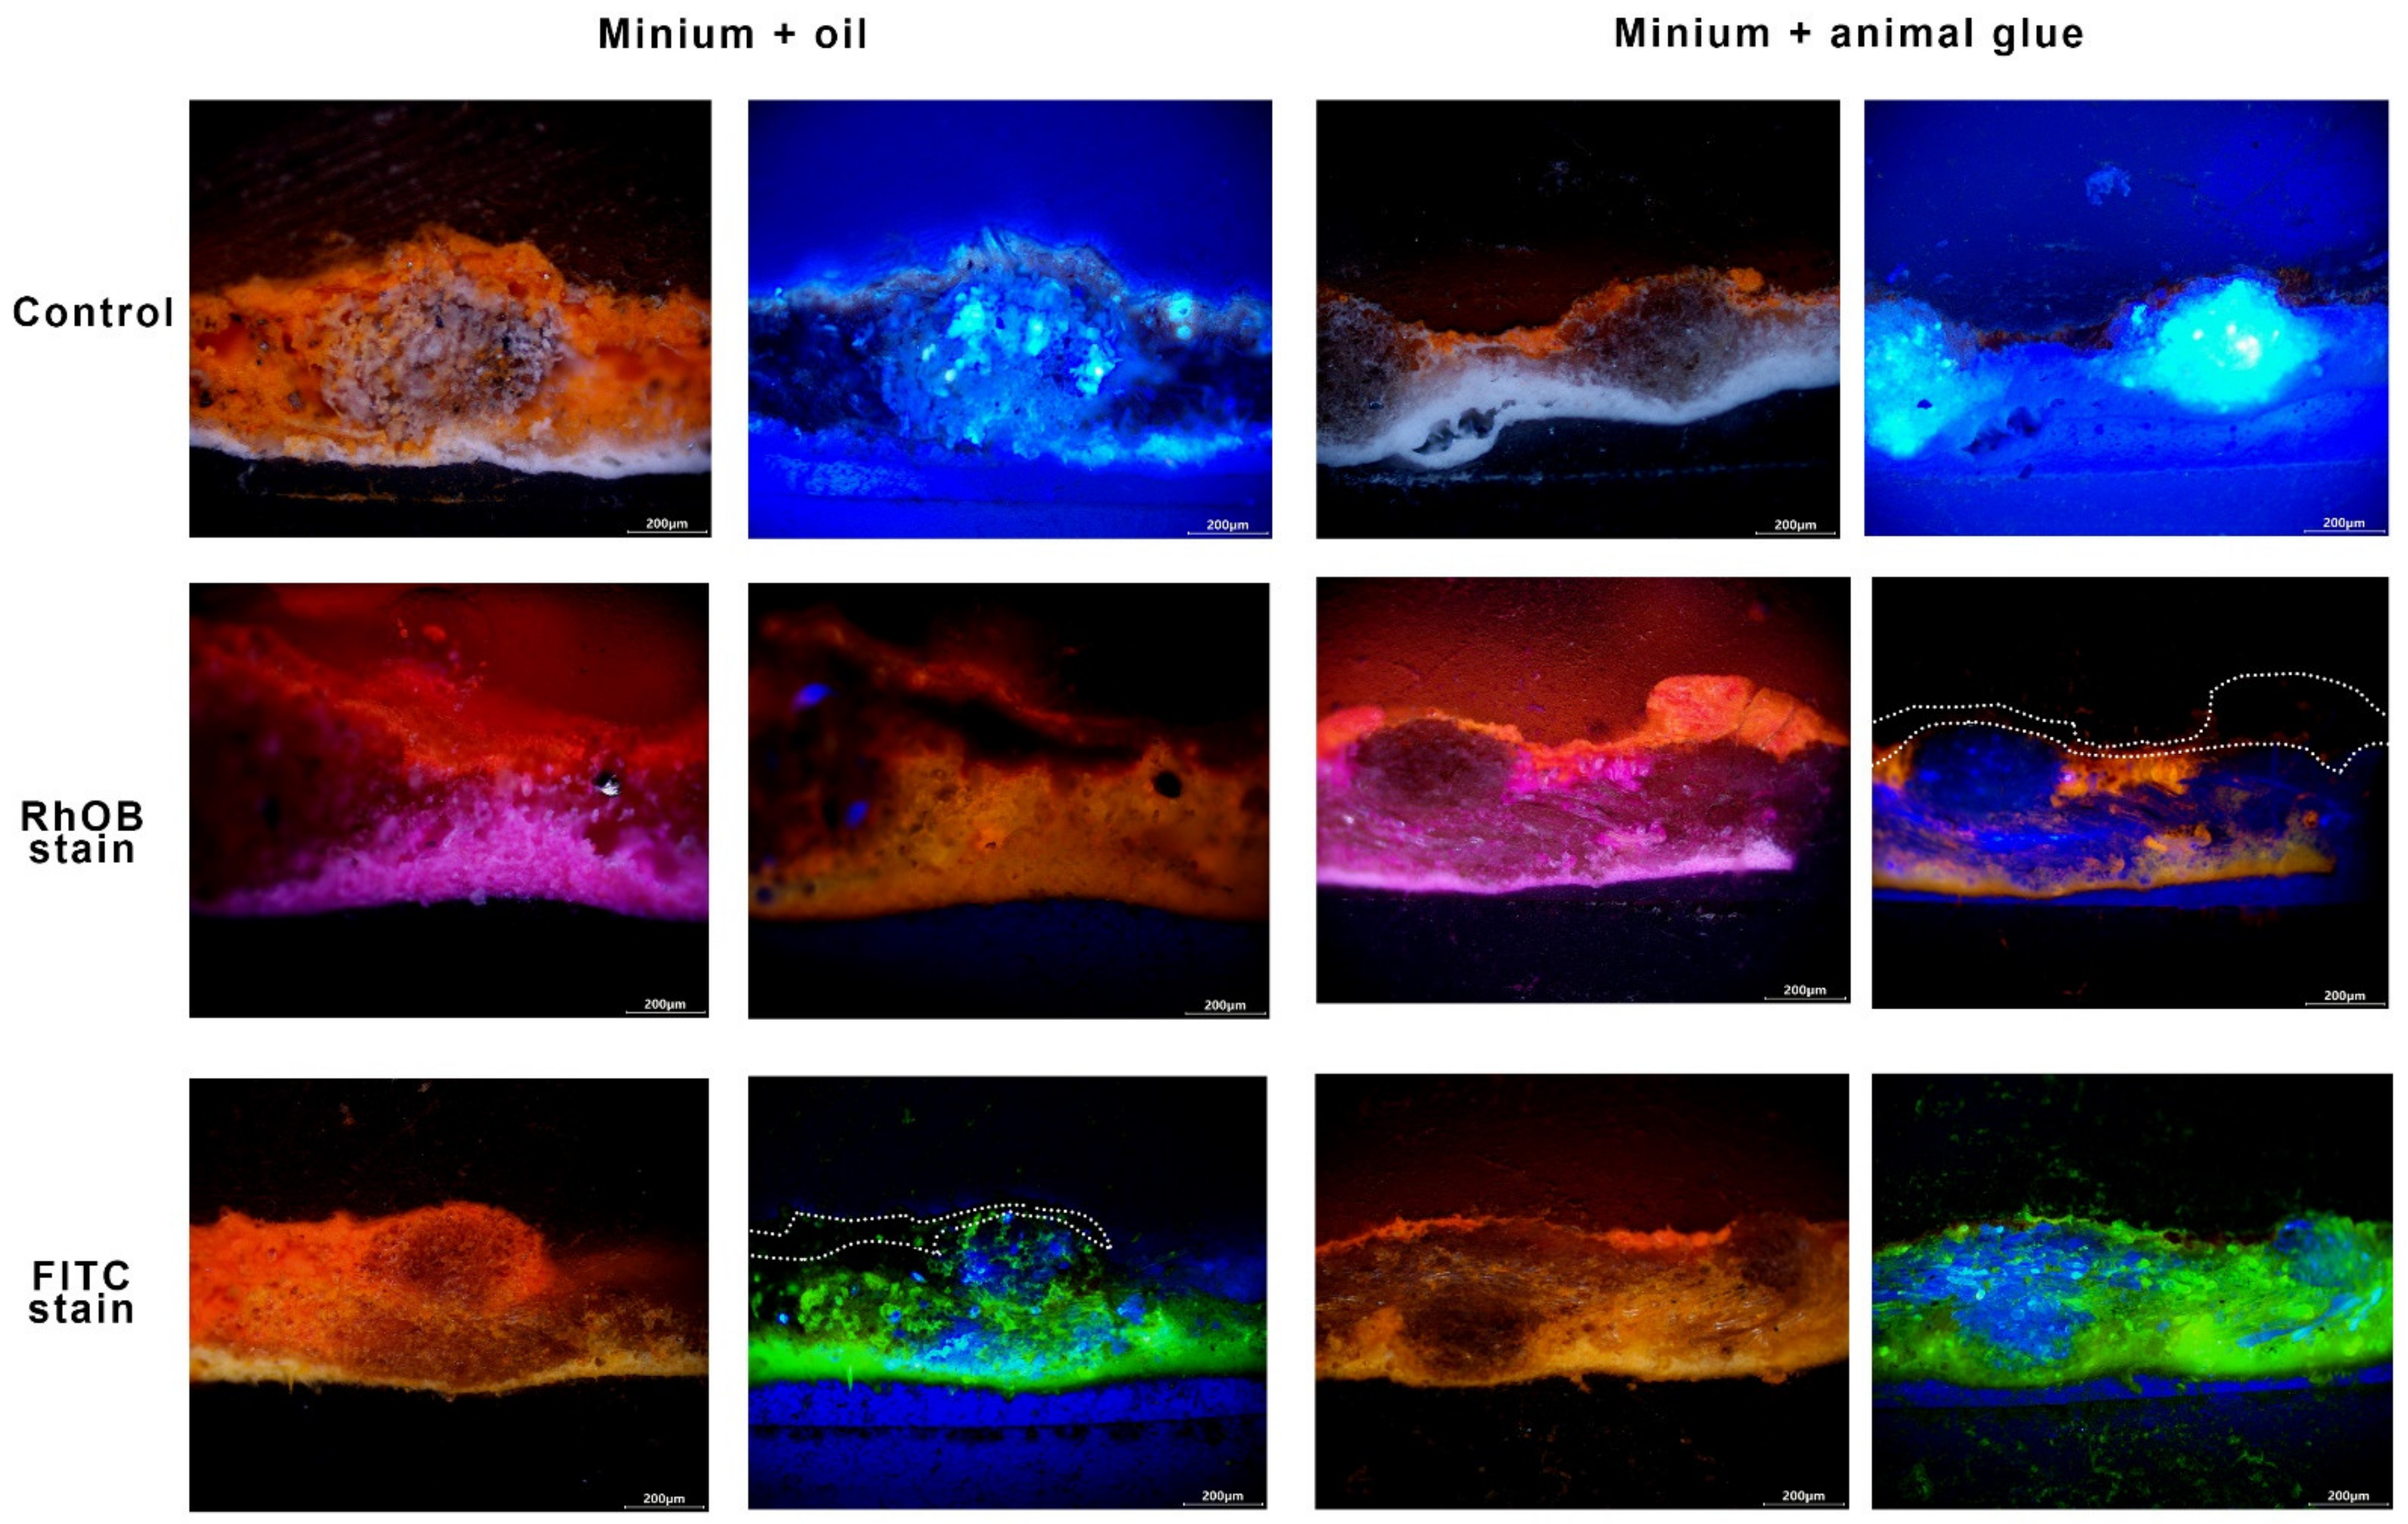
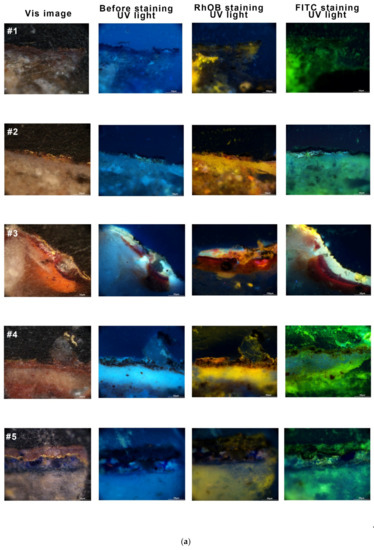
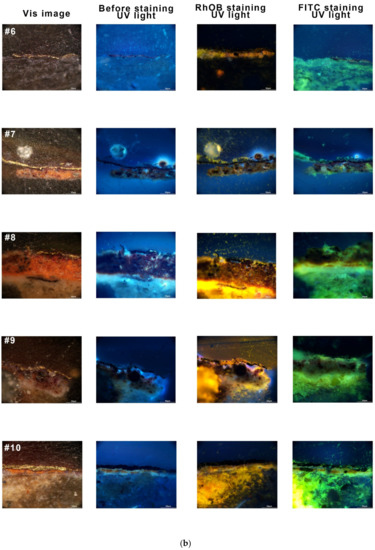
Figure A5.
(a) Visible-light image before staining, UV light image before staining, orange light emission image after RhOB staining, and green light emission image after FITC staining of samples #1–#5. (b) Visible-light image before staining, UV light image before staining, orange light emission image after RhOB staining, and green light emission image after FITC staining of samples #6–#10.
References
- Huo, X.; Zhao, L.; Peng, J. The Grottoes of Kizil and the History of Buddhism; Xinjiang People Publishing House: Urumqi, China, 2016. [Google Scholar]
- Jin, W. The style and achievements of Kucha art. West Reg. Stud. 1997, 3, 1–9. [Google Scholar]
- The Kucha Academy Of Xinjiang. Kizil Grottoes; Shanghai People’s Fine Arts Publishing House: Shanghai, China, 1993. [Google Scholar]
- Schmidt, B.A.; Ziemann, M.A.; Pentzien, S.; Gabsch, T.; Koch, W.; Krüger, J. Technical analysis of a Central Asian wall painting detached from a Buddhist cave temple on the northern Silk Road. Stud. Conserv. 2016, 61, 113–122. [Google Scholar] [CrossRef][Green Version]
- Liu, L.; He, J.; Ye, M.; Zhu, Z.; Zhong, Q.; Yang, J. Spectral Characterization of Pigment from the No. 1 Cave, Kizil Cave-Temple Complex. J. Spectrosc. 2019, 2019, 8502524. [Google Scholar] [CrossRef]
- Su, B.; Tetuo, S.; Hu, Z.; Li, Z. HPLC Analysis of Binding Medium of Pigment of Wall-Painting at Kizil Grottoes. Dunhuang Res. 2005, 92, 75–82. [Google Scholar]
- Zhou, Z.; Shen, L.; Wang, N.; Ren, X.; Yang, J.; Shi, Y.; Zhang, H. Identification of Organic Materials Used in Gilding Technique in Wall Paintings of Kizil Grottoes. Chem. Sel. 2020, 5, 818–822. [Google Scholar] [CrossRef]
- Zhou, Z.; Shen, L.; Li, C.; Wang, N.; Chen, X.; Yang, J.; Zhang, H. Investigation of gilding materials and techniques in wall paintings of Kizil Grottoes. Microchem. J. 2020, 154, 104548. [Google Scholar] [CrossRef]
- Cotte, M.; Susini, J.; Solé, V.A.; Taniguchi, Y.; Chillida, J.; Checroun, E.; Walter, P. Applications of synchrotron-based micro-imaging techniques to the chemical analysis of ancient paintings. J. Anal. Atom. Spectrom. 2008, 23, 820–828. [Google Scholar] [CrossRef]
- van der Werf, I.D.; Gnisci, R.; Marano, D.; De Benedetto, G.E.; Laviano, R.; Pellerano, D.; Vona, F.; Pellegrino, F.; Andriani, E.; Catalano, I.M.; et al. San Francesco d’Assisi (Apulia, South Italy): Study of a manipulated 13th century panel painting by complementary diagnostic techniques. J. Cult. Herit. 2008, 9, 162–171. [Google Scholar] [CrossRef]
- Salvadó, N.; Butí, S.; Clemente, C.; Beltran, V.; Cinque, G.; Juanhuix, J.; Pradell, T. Microanalytical study of luster glazed gilding and silvering from Baroque altarpieces. Pure Appl. Chem. 2018, 90, 477–492. [Google Scholar] [CrossRef]
- Costantini, I.; Lottici, P.P.; Castro, K.; Madariaga, J.M. Use of Temperature Controlled Stage Confocal Raman Microscopy to Study Phase Transition of Lead Dioxide (Plattnerite). Minerals 2020, 10, 468. [Google Scholar] [CrossRef]
- Litharge R060959. Available online: https://rruff.info/chem=Pb,%20O/display=default/R060959 (accessed on 21 August 2022).
- Tomasini, E.P.; Cárcamo, J.; Castellanos Rodríguez, D.M.; Careaga, V.; Gutiérrez, S.; Rúa Landa, C.; Sepúlveda, M.; Guzman, F.; Pereira, M.; Siracusano, G.; et al. Characterization of pigments and binders in a mural painting from the Andean church of San Andrés de Pachama (northernmost of Chile). Herit. Sci. 2018, 6, 1–12. [Google Scholar] [CrossRef]
- Orsini, S.; Parlanti, F.; Bonaduce, I. Analytical pyrolysis of proteins in samples from artistic and archaeological objects. J. Anal. Appl. Pyrol. 2017, 124, 643–657. [Google Scholar] [CrossRef]
- Bonaduce, I.; Andreotti, A. Organic Mass Spectrometry in Art and Archaeology; Colombini, M.P., Modugno, F., Eds.; John Wiley & Sons: Hoboke, NJ, USA, 2009; Chapter 11; pp. 303–326. [Google Scholar]
- Wang, N.; He, L.; Zhao, X.; Simon, S. Comparative analysis of eastern and western drying-oil binding media used in polychromic artworks by pyrolysis–gas chromatography/mass spectrometry under the influence of pigments. Microchem. J. 2015, 123, 201–210. [Google Scholar] [CrossRef]
- Andreotti, A.; Bonaduce, I.; Colombini, M.P.; Gautier, G.; Modugno, F.; Ribechini, E. Combined GC/MS Analytical Procedure for the Characterization of Glycerolipid, Waxy, Resinous, and Proteinaceous Materials in a Unique Paint Microsample. Anal. Chem. 2006, 78, 4490–4500. [Google Scholar] [CrossRef]
- Manzano, E.; Rodriguez-Simón, L.R.; Navas, N.; Checa-Moreno, R.; Romero-Gámez, M.; Capitan-Vallvey, L.F. Study of the GC–MS determination of the palmitic–stearic acid ratio for the characterisation of drying oil in painting: La Encarnación by Alonso Cano as a case study. Talanta 2011, 84, 1148–1154. [Google Scholar] [CrossRef]
- Sutherland, K.; Del Río, J.C. Characterisation and discrimination of various types of lac resin using gas chromatography mass spectrometry techniques with quaternary ammonium reagents. J. Chromatogr. A 2014, 1338, 149–163. [Google Scholar] [CrossRef]
- Wang, L.; Ishida, Y.; Ohtani, H.; Tsuge, S.; Nakayama, T. Characterization of Natural Resin Shellac by Reactive Pyrolysis−Gas Chromatography in the Presence of Organic Alkali. Anal. Chem. 1999, 71, 1316–1322. [Google Scholar] [CrossRef]
- Kuckova, S.; Sandu, I.C.A.; Crhova, M.; Hynek, R.; Fogas, I.; Schafer, S. Protein identification and localization using mass spectrometry and staining tests in cross-sections of polychrome samples. J. Cult. Herit. 2013, 14, 31–37. [Google Scholar] [CrossRef]
- Bulk, S. Cross-Section Paint Microscopy Report Green-Painted Table Enfield Shaker Village Enfield, New Hampshire, USA. 27 February 2014; 1–20. [Google Scholar]
- Bulk, S. How Architectural Paint Analysis Techniques Have Contrubited to The Qianlong Garden Conservation Project in The Palace Museum. Palace Mus. J. 2018, 197, 143–149. [Google Scholar]
- Taniguchi, Y.; Kitagawa, M.; Murofushi, M.; Yang, J.; Shimadzu, Y.; Sato, I. Lac Resin Organic Red Colourant in Ancient Period. In Proceedings of the 31st Annual Congress of Japan Society for Scientific Studies on Cultural Properties, Nara, Japan, 4–5 July 2014; pp. 60–61. [Google Scholar]
- Bayerová, T. Buddhist Wall Paintings at Nako Monastery, North India: Changing of the Technology Throughout Centuries. Stud. Conserv. 2018, 63, 171–188. [Google Scholar] [CrossRef]
- Yajie, Z.; Kangning, Z. On the Booming of Embossed Painting and Gilding Craft in Temple Murals of Song and Jin Dynasties in Shanxi. Shanxi Arch. 2012, 19–21. [Google Scholar] [CrossRef]
- Mastrotheodoros, G.P.; Beltsios, K.G.; Bassiakos, Y.; Papadopoulou, V. On the Metal-Leaf Decorations of Post-Byzantine Greek Icons. Archaeometry 2018, 60, 269–289. [Google Scholar] [CrossRef]
- Lluveras-Tenorio, A.; Bonaduce, I.; Sabatini, F.; Degano, I.; Blaensdorf, C.; Pouyet, E.; Cotte, M.; Ma, L.; Colombini, M.P. The organic materials in the Five Northern Provinces’ Assembly Hall: Disclosing the painting technique of the Qing dynasty painters in civil buildings. Appl. Phys. A 2015, 121, 879–889. [Google Scholar] [CrossRef]
- Dongpo, H.; Tiening, X.; Jinhua, W.; Hongyan, Z. An analytical study of gilding and adhensive materials on One-thousand-hand Buddha at Dazu Grotto, Baoding Mountain, Chongqing. Sci. Conserv. Archaeol. 2008, 20, 44–51. [Google Scholar]
- Duran, A.; Perez-Rodriguez, J.L.; Jimenez De Haro, M.C. Study of the gilding technique used in polychromed stones and ceramics by dedicated laboratory-made micro X-ray diffraction and complementary techniques. Anal. Bioanal. Chem. 2009, 394, 1671–1677. [Google Scholar] [CrossRef]
- Mazzeo, R.; Baraldi, P.; Lujàn, R.; Fagnano, C. Characterization of mural painting pigments from the Thubchen Lakhang temple in Lo Manthang, Nepal. J. Raman Spectrosc. 2004, 35, 678–685. [Google Scholar] [CrossRef]
- Okada, K.; Watanbnabe, M.; Tababayashi, H.; Su, B.; Cui, Q. Investigation of the Coloring Materials and the Techniques for Painting Buddha Images on the East Wall of Cave 285, Mogao Grottoes, Dunhuang. Conserv. Sci. 2016, 55, 139–149. [Google Scholar]
- Imms, A.D. The lac and shellac industry in India. Nature 1921, 107, 797. [Google Scholar] [CrossRef]
- Cooksey, C.J. The red insect dyes: Carminic, kermesic and laccaic acids and their derivatives. Biotech. Histochem. 2019, 94, 100–107. [Google Scholar] [CrossRef]
Publisher’s Note: MDPI stays neutral with regard to jurisdictional claims in published maps and institutional affiliations. |
© 2022 by the authors. Licensee MDPI, Basel, Switzerland. This article is an open access article distributed under the terms and conditions of the Creative Commons Attribution (CC BY) license (https://creativecommons.org/licenses/by/4.0/).

