Abstract
Kurut is an ancient flavor of central Asia, produced by sun-drying of yogurt. Kurut is used in preparation of pasta, soup and also in the form of yogurt by mixing with water. Alternative to sun drying, this study was aimed at conducting Kurut production by use of vacuum-oven drying (VOD) and oven drying (OD) techniques at two different temperatures (35 °C and 45 °C). Samples were coded as KV35, KV45 and K35, K45 for VOD and OD techniques, respectively. All samples were concentrated by drying in proximate composition (p > 0.05). Less progress of acidity, lower solubility ratio (p > 0.05) and lower hydroxymethyl furfural (HMF) values were maintained by VOD than OD (p < 0.05) in the 1st day. All Kurut samples were very distinctly different (ΔE ˃ 3), more yellowish (b*) and less bright (L*) than strained yogurt. Redness (a*) was observed only in OD-applied samples (p < 0.05). Yagcioglu, Wang and Singh, Midilli and two-term models were best fitting models for predicting drying behavior of KV35, KV45, K35 and K45, respectively. Drying time for VOD and OD were determined as 2 days and 8 days, respectively. Difference in means of drying temperature was found statistically significant in terms of HMF, L*, a* and b* in the OD technique (p < 0.05). In the industrial aspect use of VOD, especially with the establishment of continuous systems, Kurut production in a shorter time with better preservation of quality is possible.
1. Introduction
Yogurt is a fermented dairy product with a wide consumption area in the Mediterranean, Asia and Europe. Its high protein content and therapeutic nature related to the presence of yogurt bacteria (Streptococcus thermophilus and Lactobacillus delbruecki subsp bulgaricus) make yogurt a popular food. The storage temperature has a determinative role in the shelf-life of yogurt which is generally for 1 day at 25–30 °C and 5 days at 7 °C [1]. Cooking, straining, drying and/or salting are the methods used to extend the shelf-life of yogurt [2,3,4]. In ancient times, especially in central Asia, yogurt was sun dried traditionally and made available for storage at ambient conditions and it is called Kurut. Kurut is an ancient flavor still produced by local people and today some small boutique producers produce and sell it. In traditional practice, Kurut production is carried out especially in summer seasons when milk is abundant and in a sunny and partially sunny environment. Since Kurut is the dried form of yogurt, it can be stored at a relatively cool room temperature for more than 6 months without refrigeration [5,6]. Earthen pots and/or cloth bags are used for keeping Kurut during the storage period.
Kurut is traditionally known with different names in Turkey, varying according to regions, such as Kes cheese, Peskutan and Surk (in spiced form) [2,6,7]. In family scale production, especially in rural parts, some regional and habitual variations are observed in production steps and the raw material used; e.g., non-fat yogurt, whole-fat yogurt and/or buttermilk (Yayık ayranı) remaining after butter produced by yogurt (Yayık butter) can be used as raw material. In the case of using yogurt directly in production, yogurt is strained through a cloth bag and/or in the case of buttermilk, it is initially heat-treated for getting the curd. The strained yogurt and the buttermilk curd are shaped by hand as oval, round and sometimes in blocks before drying and grated prior to consumption [5,6]. Kurut is consumed by grating during preparation of dishes such as pasta, soup and/or directly mixing with water for constituting yogurt and Ayran, the latter is a yogurt drink practically prepared by adding 30–50% water to yogurt [6,8].
Drying is applied for preservation and extension of shelf-life of food products by reduction of moisture content to a safer level. Drying allows minimization of microbiological and chemical deterioration reactions and together with lowering of packaging, storage and transportation costs [9,10]. Conventionally, spray dryers, tray dryers, vacuum dryers, freeze dryers, rotary dryers, fluidized bed dryers and fixed bed dryers are used in the food industry [10]. Among these, hot air drying is in fact the heating mechanism involved in tunnel and tray dryer systems, and is the most widely used drying method industrially. However, case hardening problems, color deterioration and nutritional losses due to long drying times and less energy efficiency are observed in hot air drying [11,12]. Spray drying is an economical and more energy efficient technology with rapid and continuous operation and a large amount of drying capacity [13]. Freeze drying is an expensive technique with high capital and operating costs due to low vacuum and low temperature requirements with long drying times. It is mostly suitable for pharmaceutical products requiring special attention [10]. In terms of the cost of drying, when freeze drying is regarded as a reference, the highest cost is pronounced for freeze drying and followed by vacuum drying, spray drying, drum drying, fluidized bed drying and air drying [13]. Vacuum drying is expensive due to the requirement of high vacuum in the drying chamber and also long drying times [10] but supplies rapid evaporation of moisture with a 70% drying efficiency [13]. Vacuum drying allows evaporation of water at lower boiling point temperatures. Oxygen and heat-sensitive food components like enzymes, proteins, fruits, etc., can be vacuum dried successfully by minimization of their losses [9,14,15,16]. A puffed structure is obtained in the product related to vacuum-induced expansion of air and water vapor [15]. Vacuum drying creates an elastic and compact structure in the dried material and can cause difficulties in milling [16].
Among the other drying methods, spray drying is widely used in the dairy industry [17,18]. Dairy powders, such as milk powder, whey, cheese, cream and ice cream mixes, are commonly spray dried [18]. In literature, yogurt is dried by microwave-vacuum drying by Kim and Bhowmik [19] and Kim et al. [20]; microwave-assisted foam-mat drying by Yüksel, 2021 [21]; refractance window drying by Tontul et al. [22]; spray drying by Bielecka and Majkowska [23], Hayaloglu et al. [24], Koc et al. [4], Koc et al. [25], Seth et al. [26] and Stencl [27]; convective air drying by Kumar and Mishra [28] and Shiby and Mishra [29]; convective type tray drying by Hayaloglu et al. [24] methods. However, the drying process in Kurut production was investigated experimentally by the convective drying method by Yaman and Coskun [30], Emirmustafaoğlu and Coşkun [31] and Karabulut et al. [32]. An optimization study was carried out by Yaman and Coskun in that pH, salt (%) and centrifugation conditions for getting strained yogurt were varied. Kurut samples were convective air dried at 25 °C and 1.50 m/s up to approximately 45% moisture content. Centrifugation rather than spontaneous straining of the serum by a cloth bag and also the use of air circulating air drying instead of open-air drying reduced the production time from 2 months to 8 days. Emirmustafaoğlu and Coşkun [31] investigated the changes occurring during the 120-day storage period in Keş (Kurut) produced for frying under refrigerated conditions. Drying was carried out at 25 °C and 0.5 m/s air circulation for 10 h up to 51.42% moisture content. At least a 4-month storage period was defined for Kurut samples by Emirmustafaoğlu and Coşkun [31]. In another study, the thin-layer drying behavior of Kurut was investigated at temperatures of 50, 55, 60, 65 and 70 °C by the convective air-drying method in the tray dryer with a constant product thickness of 0.5 cm and an air velocity of 1.5 m/s. In those conditions, Kurut samples were dried up to 15.75% moisture content and the drying times reported for 50 °C and 70 °C were 615 min (10.25 h) and 515 min (8.58 h), respectively. The two-term model was found to be the most suitable model (among eleven drying models investigated) describing drying characteristics of Kurut samples [32]. Unlike the existing studies in the present study, the possible use of oven drying at atmospheric and/or vacuum conditions in Kurut production are investigated. Use of this conventional technology will provide a guide for industrial and batch type Kurut productions in a more controlled environment than the traditional sun drying technique.
Kurut serves many advantages over yogurt in handling, transportation and storage. Besides that, today, Kurut is considered to be a strategically important food product, especially for difficult conditions such as war, disasters and/or a valuable protein source for milk-deficient times. In traditional sun drying of Kurut, there is always seasonal and climatological dependency and also risk of physical, microbiological and nutritional deterioration. The investigation of alternative drying techniques in Kurut production is thought to be valuable in this respect. To the best of our knowledge, there have been no reported studies using the oven drying technique, regarded as conventional instruments, either under vacuum or atmospheric conditions in Kurut production. Longer drying times are required in traditional sun drying of Kurut and bring many environmental obstacles mentioned above. Use of technological systems can supply convenience and also high-quality food production, depending on the suitability of the technology selected for the target food product. For this purpose, in this study, the use of two different drying techniques, vacuum oven drying (VOD) and oven drying (OD), at two different drying temperatures (35 °C and 45 °C) in Kurut production were investigated. In vacuum drying of foods, the use of 7 kPa absolute pressure is a common application and at that pressure, the boiling point of water approximately reaches 39 °C [15]. For drying of Kurut samples both by VOD and OD techniques, drying temperatures were selected as 35 °C and 45 °C for preventing excessive heat exposure of the Kurut samples, especially in the OD technique. Besides that, for the VOD technique, drying temperatures (35 °C and 45 °C) were slightly above and below the boiling point of water at that pressure (7kPa). Therefore, in this study, the effect of VOD and OD techniques on Kurut characteristics were determined. Additionally, the drying behavior of the samples dried by VOD and OD techniques were examined and the most suitable mathematical model of drying was determined.
2. Materials and Methods
2.1. Materials
Full-fat yogurt obtained from Dairy Plant (Ankara University, Faculty of Agriculture Dairy Technology Department, Ankara, Turkey) was strained from a cloth bag and used as raw material in Kurut production. Some characteristics of strained yogurt are given in Table 1. Mineral salt used in Kurut production was purchased from a local market.

Table 1.
Characteristics of strained yogurt used in Kurut production.
2.2. Kurut Preparation and Drying
Strained yogurt preparation and Kurut processing are depicted in Figure 1. Strained yogurt was divided into approximately 70 g portions, round shaped by hand and made ready for drying. The study was carried out in two replications.
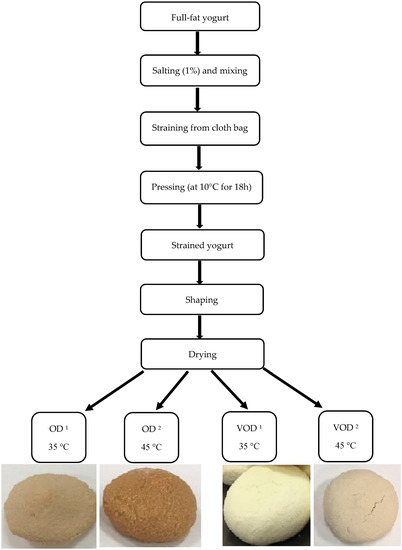
Figure 1.
Strained yogurt preparation, Kurut processing and Kurut samples. OD 1 denotes oven drying technique at 35 °C; OD 2 denotes oven drying technique at 45 °C, VOD 1 denotes vacuum-assisted oven drying technique at 35 °C; VOD 2 denotes vacuum-assisted oven drying technique at 45 °C.
Kurut samples were dried by two different techniques of VOD and OD. The experimental design of the study is given in Table 2. In the VOD technique, the pressure inside the drying chamber was adjusted to sub-atmospheric pressure (p = 7 kPa) and drying was performed at different temperatures (Td = 35 °C and 45 °C) in the vacuum oven dryer (BINDER VD 53, Tuttlingen, Germany). In the OD technique, drying was performed at atmospheric pressure and temperatures of 35 °C and 45 °C in the oven (Memmert, UN 110, Büchenbach, Germany). Drying was carried out until the constant weight was obtained in the samples. The initial moisture content of the strained yogurt and the moisture content of the samples during drying were determined by an Infrared Moisture Analyzer (OHAUS MB 45, Parsippany, NJ, USA). The drying process was traced by weighing selected two Kurut samples in definite intervals during the drying period and the data were used in mathematical modeling to detect the drying behavior of Kurut samples. During the drying period, weighing intervals were every 4 h for VOD and every 12 h for OD.
Table 2.
Experimental design of the study.
2.3. Chemical Properties of Kurut Samples
Kurut samples were initially ground by a kitchen-scale grinder before analysis and analyzed on day 1. All analyses were carried out in two sample replicates for each treatment. Proximate composition is presented in Table 3. Titratable acidity (Lactic acid %), salt (%) and ash (%) analyses were carried out according to Bradley et al. [33].
Table 3.
Proximate composition of VOD- and OD-applied Kurut samples a.
Dry matter (%), fat (%) and total protein (%) were analyzed by methods given in AOAC [34], Renner [35] and IDF [36], respectively. In IDF [36], total protein (%) was calculated by multiplying the total nitrogen (TN) determined via Kjeldahl method by the factor 6.38. pH was measured with a portable pH-meter (Seven2Go™ pH Meter S2, Mettler Toledo, Zurich, Switzerland) by dispersing 5 g of the sample in distilled water (1:1). The moisture (%) was measured by a moisture analyzer (OHAUS MB 45, Parsippany, NJ, USA).
2.4. Physico-Chemical Properties
2.4.1. Instrumental Color Parameters
Color characteristics of Kurut samples were measured by chroma meter (Konica Minolta CR 410, Sensing Inc., Osaka, Japan). The measured color parameters were L*, a* and b*, indicating the degree of lightness/darkness (L = 100/L = 0), redness (+a)/greenness (−a) and yellowness (+b)/blueness (−b) [37]. The instrument is initially calibrated by a standard white plate, and homogeneously mixed samples were put in quartz container of the device. The measurements were performed in replicate and mean values were calculated for all color parameters. By using CIE color parameters (L*, a* and b*), some color indices as total color difference (ΔE), Chroma (C*), Browning Index (BI), Hue Angle (h*), Whiteness Index (WI) and Yellowness Index (YI) were calculated by Equations (1)–(6), respectively [38]. In Equation (1), strained yogurt was considered as a reference in calculation of ΔE with L0*, a0* and b0* values (Table 1).
and where
2.4.2. Solubility Ratio
The solubility ratio (%) of the samples was determined according to the methods of ADMI [39] and NADRG [40]. The volume (mL) of precipitate (the upper layer of the precipitate) left in the tube obtained after secondary centrifugation at 4000 rpm for 5-min was found as (mL) and used in calculating the solubility ratio by Equation (7).
2.4.3. Hydroxymethyl Furfural Content
Hydroxymethyl furfural content (HMF) was spectrophotometrically measured by determining 5-hydroxymethyl furfural according to the method of Keeney and Bassette [41] and expressed as total HMF (μML−1 reconstituted material). Absorbance (A) values were measured at 443 nm by UV/VIS spectrophotometer (PerkinElmer, Lambda 25, Singapore). Total HMF content was calculated by Equation (8).
2.5. Modeling of Drying Behavior of Kurut Samples
For determining the most appropriate mathematical model, the moisture content data obtained for VOD and OD techniques were converted to the fractional moisture ratio (MR) by following Equation [42]:
where M is the moisture content of the Kurut sample at any time, t; M0 is the initial moisture content of the Kurut sample; Me is the equilibrium moisture content of the Kurut sample. Since M and M0 are relatively higher than the Me of the Kurut sample, Me is neglected [43]. The MR equation is simplified and given in Equation (10).
A number of semi-theoretical and empirical models were developed to simulate moisture movement and mass transfer during the drying of many food products. These have been found very useful in understanding drying kinetics and optimization of drying conditions. The moisture ratio (MR) of the Kurut samples was obtained for the VOD and OD techniques using Equation (10). The variation between drying time (t) and moisture ratio (MR) was investigated for VOD and OD techniques. VOD and OD data of the Kurut samples were fitted to nine drying kinetic models and the dataset were fitted by the multiple non-linear regression technique. Regression analyses were performed using SigmaPlot 14.5 (Systat Software Inc., Chicago, IL, USA). Coefficient of determination (R2), root mean square error (RMSE) and reduced chi-square (2) measures were chosen as goodness-of-fit criteria to determine the model of best-fit for the Kurut samples. For the most suitable model, reduced 2 and RMSE values should be close to zero and R2 should be close to one [24,44,45,46]. The values of R2, RMSE and 2 were obtained from Equations (11)–(13), respectively:
MRexp,i is the experimental moisture ratio obtained in any drying technique, MRpre,i is the predicted moisture ratio for the relevant technique, N is the sample size and n is the degree of freedom (number of parameters in the model) of any model.
2.6. Statistical Analysis
Statistical evaluation of the results was analyzed by two-way ANOVA. To determine the significant differences between groups (drying techniques of VOD and OD, drying temperatures of 35 °C and 45 °C), the Tukey method was used at p < 0.05 significant level IBM [47].
3. Results and Discussion
3.1. Proximate Composition of Kurut Samples
Proximate composition of the Kurut samples is given in Table 3. The concentration effect of drying was observed in dry matter (%), fat (%), salt (%) and ash (%) content of the samples when compared to the strained yogurt (Table 1). Interaction between the drying technique and drying temperature did not show statistically significant difference in proximate composition of the samples (based on p > 0.05) (Table 3).
Higher dry matter (%) values were obtained in KV35 and KV45 than K35 and K45. In VOD, technique samples (KV35 and KV45) reached a constant weight in a shorter time and with higher dry matter (%) than samples of the OD technique (K35 and K45) (Table 3). Additionally, the individual effect of means of drying techniques caused statistically significant difference in terms of dry matter (%) (Table 4). Vacuum use results in concentration of water vapor on the surface of the product [14] and this improves heat and mass transfer [48]. In that way, higher drying rates are achieved under vacuum conditions [15]. The drying time required for OD-applied Kurut samples was longer than VOD-applied samples and could be related to the absence of additional force carrying water from the capillaries to the surface of the product in the OD technique. At the same time, longer drying times in OD can be a consequence and/or a reason of the formation of a crust layer on the product surface that creates an isolation and slows down or prevents evaporation. The protein content of the samples varied as 44.73 ± 0.32, 44.85 ± 0.47, 44.67 ± 0.31 and 44.74 ± 0.32 for samples K35, K45, KV35 and KV45, respectively (p > 0.05).
Table 4.
Individual effect of drying technique and drying temperature on some physico-chemical properties of Kurut samples.
In Table 1, pH and L.A% values for strained yogurt were found as 4.39 ± 0.02 and 2.13 ± 0.02, respectively. When compared with these values, drying resulted in the progress of acidity of the Kurut samples but with no significant difference among the samples (p > 0.05) (Table 3). However, this progress was higher in K35 and K45, observed with lower pH values and higher L.A% values, than KV35 and KV45. Regardless of the temperature effect, the means of drying techniques (vacuum existence or not) caused a statistically significant difference on pH and L.A% of the samples. The drying temperature was non-significantly effective on pH and L.A% regardless of the drying technique (p > 0.05) (Table 4).
Gürbüz et al. [49] found the average pH and L.A% of the experimental Kurut samples as 4.29 ± 0.04 and 2.49 ± 0.26, respectively. Karabulut et al. [32] observed thin-layer drying characteristics of Kurut dried in the tray drier and reported 3.92 and 0.37% for pH and L.A%, respectively. The dry matter (%) of tray dried Kurut samples was reported as 84.25% by Karabulut et al. [32], similar to samples K35 and K45. In VOD, thermal exposure is minimized under vacuum when compared with OD, so less progress of acidity was observed (Table 4). The initial pH and L.A% of the raw material used are decisive on the same properties of the product [4]. For this reason, the situation in the Kurut samples may be related to the physico-chemical properties of the raw material, strained yogurt processing applications and also the difference in drying conditions.
3.2. Physico-Chemical Properties
3.2.1. Color Characteristics
CIELAB color characteristics (L*, a*, b*) and calculated color attributes Chroma (C*) and hue angle (h*) of strained yogurt and Kurut samples are given in Table 5. The drying temperature and drying technique interaction were found significantly effective on color parameters of the Kurut samples (p < 0.05) (Table 5).
Table 5.
Color characteristics of strained yogurt and Kurut samples.
KV35 and KV45 obtained higher L* values than K35 and K45 with higher dry matter contents (lower moisture contents). Higher L* values indicate brighter/whiter color. Strained yogurt was whiter than all Kurut samples. Drying resulted in a decrease in L* values in the Kurut samples, due to loss of moisture (Table 5). Moisture loss due to drying Anli [50] and/or ripening causes a decrease in the lightness of the cheese [51]. However, this time, the vacuum existence could be the determinative factor in L* values of KV35 and KV45. Under vacuum conditions, the temperature increase did not create a significant difference in L* values of samples KV35 and KV45. Köprüalan et al. [11] stated that the vacuum environment in the drying (freeze drying) of cheese snacks resulted in a whiter color (higher L* values). However, in K35 and K45, the temperature increase from 35 °C to 45 °C resulted in a decrease in whiteness (p < 0.05) (Table 5). L* is a temperature dependent parameter according to Chudy et al. [51] and brown pigment formation depending on heating intensity could cause a decrease in L* values according to Carvalho et al. [52,53].
Strained yogurt and KV35 and KV45 had negative a* values characterized by greenness. KV35 and KV45 were significantly different than K35 and K45 (p < 0.05) (Table 5). No statistical difference was observed between KV35 and KV45. The temperature increase caused an increase in greenness in KV35 and KV45, which was consistent with the results found by Anli [50] under vacuum conditions. In general, yogurt is characterized by negative a* and positive b* values [22,51,52]. Redness (positive a* values) was pronounced in K35 and K45 and increased with the rising drying temperature from 35 °C to 45 °C in the OD technique (Table 5) (p < 0.05). The transfer of a* from green to the red hue may be due to the samples’ exposure to more intense heat for longer periods in the OD technique to achieve the maximum possible dryness. Additionally, non-enzymatic browning reactions related to drying conditions of K35 and K45 could cause an increase in redness. The temperature of drying, and the duration that the product is exposed to, affects the degree of non-enzymatic browning reaction and also the color attributes [54].
All samples showed positive b* values, indicating yellowness in the color space (Table 5). There was a significant difference between KV45 and K45 in terms of b* related to the vacuum existence or not (p < 0.05). The temperature increase from 35 °C to 45 °C was found significant only for K35 and K45 (p < 0.05), (Table 5).
The color intensity of the strained yogurt increased with drying, represented by higher chroma (C*) values in the Kurut samples. In the samples, C* values were close to each other except for K45 having the highest chroma value (Table 5). Higher C* describes how intensely a sample is perceived by the human eye, meaning that the stronger the color, lower values mean the grey color is paler [38,51].
Strained yogurt, KV35 and KV45 had negative hue angles (h*) (Table 5). Hue angle (h*) defines the degree of difference of a definite color by taking the grey color as a base. From angles 0° to 360°, the definition of color changes as; angels of 90°, 180° and 270° represent yellow, green and blue hues, respectively. The angles of 0° and 360° exactly represent the red hue [38]. The VOD application did not affect the h* values of KV35 and KV45 much differently than the strained yogurt. High hue angles indicate lower yellow character in the product which is the strained yogurt, KV35 and KV45 were less yellow than K35 and K45. Values of h* < 90° calculated for K35 and K45 represent the color of the samples in the yellow/red region.
In the literature, there is a lack of study describing the color properties of Kurut product. In general, Kurut is characterized with its slightly whitish-cream or light-yellow color. The degree of whiteness of Kurut is directly related to the fat content of the raw milk, drying conditions, storage temperature and time. In Figure 2, derived color indices of Kurut samples are represented.
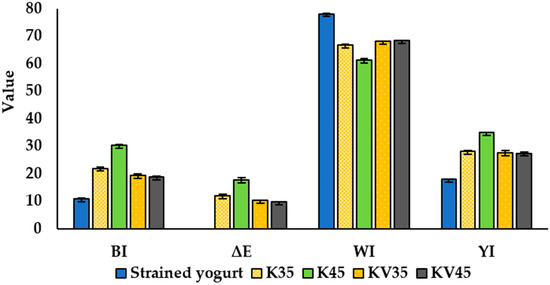
Figure 2.
Derived color indices of strained yogurt and Kurut samples dried by VOD and OD techniques at 35 °C and 45 °C (BI—Browning Index; ΔE—Total color difference; WI—Whiteness Index; YI—Yellowness Index; Strained yogurt—raw material of Kurut samples, K35—Kurut sample OD applied at 35 °C; K45—Kurut sample OD applied at 45 °C; KV35—Kurut sample VOD applied at 35 °C; KV45—Kurut sample VOD applied at 45 °C (Means ± SD, n = 2)).
Among the samples, K45 got the highest browning index (BI) and yellowness index (YI) oppositely the lowest whiteness index (WI). The whiteness index (WI) indicates the degree of color change observed during the drying process hue. Regardless of the conditions, WI decreases with drying. The highest WI was obtained for strained yogurt. WI is higher in the VOD-applied samples (KV35 and KV45). The yellowness index (YI) defines the degree of yellowness occurring due to degradation of the product by exposure to light or some means of strong processing [38]. Due to exposure to more intense heat, K35 and K45 got higher BI values than KV35 and KV45. As stated by Carvalho et al. [52], more intense browning occurs in the products as the temperature increases in drying. Both VOD and OD-applied Kurut samples were very distinctly different than the strained yogurt (with ΔE values larger than 3) but K45 was the most distinctly different sample according to scale given by [38].
3.2.2. Hydroxymethyl Furfural (HMF) Value
The drying technique and temperature interaction were found statistically significant for HMF (p < 0.05), (Table 5). K35 and K45 obtained higher HMF values than KV35 and KV45. Consistent with the statement, K35 and K45 obtained higher BI values than KV35 and KV45 (Figure 2) since the BI value is also an indicator of browning reaction [4]. In K35 and K45, HMF differed significantly with changing temperature and insignificantly in KV35 and KV45 (Table 5). In powdered dairy products, the non-enzymatic browning reaction (Maillard reaction) can occur during either the processing or storage period stimulated by temperature, resulting in 5-Hydroxymethyl furfural (HMF) production [55]. There is a correlation between a* and b* and HMF [56]. The change in a* was very significant in K35 and K45 when compared with strained yogurt and KV35 and KV45 and this change in a* could be attributed to the non-enzymatic browning reaction. Vacuum dried kiwifruits showed lower a* values when compared with hot-air dried samples [57]. KV35 and KV45 were less heat damaged due to the presence of the vacuum during drying.
3.2.3. Solubility Ratio
The drying technique (either VOD or OD) itself influenced the solubility ratio (%) of the Kurut samples significantly (p < 0.05). Among the samples, KV35 and KV45 were less soluble than K35 and K45 (Figure 3). Vacuum drying causes more an elastic and compact structure in dried products. These changes cause difficulties in rehydrating and also in milling [16]. The solubility of dairy products varies depending on the degree of heat exposure before or after drying [23]. However, the drying temperature was found to be insignificant for the samples (p ˃ 0.05). In whole fat milk powders, a solubility rate below 50% indicates poor quality [58]. For the samples treated by both VOD and OD techniques, solubility ratios were higher than that ratio (Figure 3).
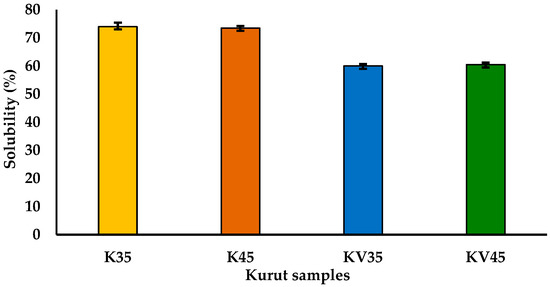
Figure 3.
Change of solubility ratio (%) of Kurut samples dried by VOD and OD techniques at 35 °C and 45 °C (p ˃ 0.05), (K35—Kurut sample OD applied at 35 °C; K45—Kurut sample OD applied at 45 °C; KV35—Kurut sample VOD applied at 35 °C; KV45—Kurut sample VOD applied at 45 °C).
In dairy powders, there is a strong relationship between solubility and HMF, of which an increase in HMF causes a decrease in solubility [59,60]. The solubility of KV35 and KV45 was lower (despite their low HMF content) than that of the K35 and K45. Protein denaturation, drying temperature and also the presence of hydrophilic components (sugar or salt presence) in the system are also affective on solubility [26]. At higher temperatures, either in processing or storage, protein denaturation occurs [61]. High protein denaturation has been observed in vacuum dried (at 60 °C, at 85 kPa for 48 h) lentil protein isolates with lower solubility [62]. Kurut samples were not investigated in terms of protein denaturation. However, KV35 and KV45 dried under vacuum pressure of 7 kPa (abs) at 35 °C and 45 °C, respectively. These temperatures are well below that required for protein denaturation.
3.3. Drying Characteristics for Kurut Samples
Drying curves according to moisture content versus drying time for Kurut samples are given in Figure 4a,b. Kurut samples applied with VOD were regularly weighed every 4 h, and samples applied with OD were regularly weighed every 12 h. A significant reduction in drying time was observed between the VOD-applied and OD-applied Kurut samples. Kurut samples applied with VOD reached a constant weight in approximately 48 h (~2-day), while samples treated with OD reached a constant weight in approximately 192 h (~8-day). When the drying curve in Figure 4a was examined, it was observed that the falling rate of KV35 samples was in 16 h, and KV45 samples in 20 h, with water loss of 0.38 g and 0.42 g per g dry matter, respectively. On the other hand, it was determined that the falling rate of K45 samples was in 48 h, and that of K35 samples in 96 h, and 0.38 g and 0.46 g water loss per g dry matter, respectively (Figure 4b). As a result, it can be said that use of the VOD technique in Kurut drying has a significant effect on moisture content and drying time.
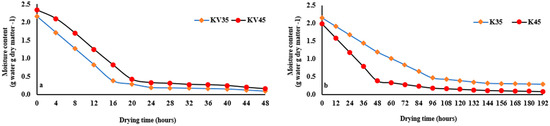
Figure 4.
Drying curves according to moisture content versus drying time for KV35-KV45 (a) and K35-K45 (b) samples.
3.4. Drying Behavior Analysis of Kurut Samples
To detect the drying behavior of Kurut samples, the moisture ratio data obtained for VOD and OD-applied samples after drying experiments was adapted to nine kinetic models. The drying curve model parameters and R2, RMSE and reduced χ2 measures (evaluation criteria) were calculated using the experimental data obtained from the drying experiments and the predicted data obtained from the mathematical models (Table 6). When Table 6 is examined, it is seen that all models adapt to the drying behavior of the Kurut samples. When the change in the coefficient of determination (R2), reduced χ2 (chi square) and root mean square error (RMSE) is examined, R2 values of all models vary between 0.7615 and 0.9999, reduced χ2 values vary between 2.60 × 10⁻¹⁰ and 1.14 × 10⁻² and RMSE values vary between 7.20 × 10⁻⁶ and 1.71 × 10⁻¹. In order to select the most suitable model for the drying behavior of the Kurut samples for all drying conditions and techniques, the highest R2 value, the lowest reduced χ2 and RMSE measures were determined according to the results given in Table 6. Considering the above-mentioned situations, it was determined that the drying behavior of the Kurut samples was found Yagcioglu for the KV35 sample, Wang and Singh for the KV45 sample, Midilli for the K35 sample and the two-term model for the K45 sample (The most suitable model and evaluation criteria are shown in bold in Table 6). The corresponding equations obtained according to the model parameters were given as for KV35, for KV45, for K35 and for K45. The two-term model was reported as the most suitable model describing the thin layer drying characteristics of convective dried Kurut samples [32].
Table 6.
Model parameters, accuracy and goodness-of-fit measures of the kinetic models used for Kurut samples by different drying techniques.
When the parameters of the suitable models are examined, both the temperature increase and the vacuum effect decrease the model parameter values. That is, the variation of the model parameters with the effect of temperature and vacuum is inversely proportional. The parameters calculated for the VOD technique were lower than those for the OD technique. This indicates that VOD samples have lower MR, since the drying rate under vacuum was higher than the drying rate under atmospheric conditions (Table 6).
In Figure 5, experimental and predicted drying curves of KV35 and KV45 (a–c) and the comparison of the experimental MR and predicted MR of KV35 and KV45 (b–d) using best-fit models are given. The Yagcioglu model provided the best-fit for the KV35 sample, and the relationship between the drying time of the samples and the moisture ratio is given in Figure 5a, and the fit-agreement between the experimental moisture ratio and the predicted moisture ratio is given in Figure 5b. The Wang and Singh model provided the best-fit for the KV45 sample, and the relationship between the drying time of the samples and the moisture ratio is given in Figure 5c, and the fit-agreement between the experimental moisture ratio and the predicted moisture ratio is given in Figure 5d. In Figure 6, experimental and predicted drying curves of K35 and K45 (a–c) and the comparison of the experimental MR and predicted MR of K35 and K45 (b–d) using best-fit models are given. The Midilli model provided the best-fit for the K35 sample, and the relationship between the drying time of the samples and the moisture ratio is given in Figure 6a, and the fit-agreement between the experimental moisture ratio and the predicted moisture ratio is given in Figure 6b. The two-term model provided the best-fit for the K45 sample, and the relationship between the drying time of the samples and the moisture ratio is given in Figure 6c, and the fit-agreement between the experimental moisture ratio and the predicted moisture ratio is given in Figure 6d.
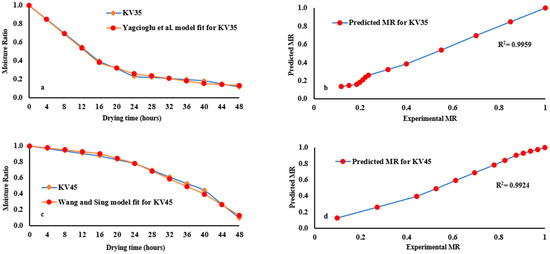
Figure 5.
Experimental and predicted drying curves of KV35 and KV45 (a–c) and comparison of the experimental MR and predicted MR of KV35 and KV45 (b–d) using best-fit models.
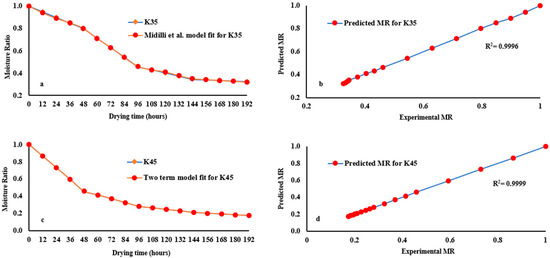
Figure 6.
Experimental and predicted drying curves of K35 and K45 (a–c) and comparison of the experimental MR and predicted MR of K35 and K45 (b–d) using best-fit models.
4. Conclusions
In this study, in the production of Kurut, a traditionally sun-dried form of yogurt, vacuum oven drying (VOD for samples KV35 and KV45) and oven drying (OD for samples K35 and K45) techniques were applied at two different temperatures (35 °C and 45 °C). In general, VOD and OD techniques provided a reduction in drying time compared to traditional sun drying and the VOD technique was four times faster than the OD technique in Kurut production. All Kurut samples were concentrated by drying in terms of fat, protein, salt and ash content (p > 0.05, in dry basis). Titratable acidity, color attributes and also HMF values of Kurut samples were better protected by the VOD technique than the OD technique. The OD technique (K35 and K45) was superior in the solubility ratio independently from the drying temperature than VOD. Drying either at 35 °C or 45 °C did not create a significant difference in L*, a*, b* and HMF values of KV35 and KV45 but for K35 and K45, these parameters were affected by the drying temperature significantly (p < 0.05). In an overall assessment, it can be concluded that the VOD technique can be successfully applied in Kurut production. The use of lower drying temperatures (T < 35 °C) in the OD technique could give better product characteristics but this means more prolonged drying times required for K35 and K45. The drying behavior of Kurut samples indicated that the drying rate under vacuum was higher than the drying rate under atmospheric conditions and for the results, models were found as Yagcioglu for the KV35 sample, Wang and Singh for the KV45 sample, Midilli for the K35 sample and the two term model for the K45 sample. From the consumer point of view, further studies can be valuable to determine the effect of VOD on viability of yogurt starter cultures and also the sensorial characteristic of Kurut samples. VOD conditions can vary for improving solubility properties of Kurut samples.
Funding
This research received no external funding.
Institutional Review Board Statement
Not applicable.
Informed Consent Statement
Not applicable.
Data Availability Statement
All data are contained within the article.
Conflicts of Interest
The author declares no conflict of interest.
Nomenclature
| a, b, c, g, n, k, k0, k1 | parameters in models |
| a* | redness/greenness |
| b* | yellowness/blueness |
| BI | browning index |
| °C | degrees Celsius |
| C* | chroma |
| ΔE | total color difference |
| h | hour |
| h* | hue angle |
| HMF | hydroxymethyl furfural |
| kPa | kilopascal |
| K35 | Kurut sample OD applied at 35 °C |
| K45 | Kurut sample OD applied at 45 °C |
| KV35 | Kurut sample VOD applied at 35 °C |
| KV45 | Kurut sample VOD applied at 45 °C |
| L* | lightness/darkness |
| M | moisture content (g water/g dry matter) at time t |
| M0 | initial moisture content (g water/g dry matter) |
| Me | equilibrium moisture content (g water/g dry matter) |
| MR | moisture ratio |
| MRexp | experimental moisture ratio |
| MRpre | predicted moisture ratio |
| n | number of parameters in the model |
| N | sample size |
| OD | oven drying |
| R2 | coefficient of determination |
| RMSE | root mean square error |
| t | drying time (hour) |
| T | temperature in degrees Celsius |
| VOD | vacuum oven drying |
| WI | whiteness index |
| χ2 | reduced chi-square |
| YI | yellowness index |
References
- Kumar, P.; Mishra, H.N. Yoghurt powder—A revıew of process technology, storage and utilization. Food Bioprod. Process. 2004, 82, 133–142. [Google Scholar] [CrossRef]
- Güven, M.; Karaca, O.B. Van ve Şırnak illerinden temin edilen kurutulmuş yoğurtların (Kurut) bileşim özellikleri. J. Food 2009, 34, 367–372. [Google Scholar]
- Koc, B.; Sakin, M.; Balkir, P.; Kaymak-Ertekin, F. Yoğurt Tozu: İşleme Teknolojisi, Depolama ve Kullanım Alanları. J. Food 2009, 34, 245–250. [Google Scholar]
- Koc, B.; Yilmazer, M.S.; Balkır, P.; Ertekin, F.K. Spray drying of yogurt: Optimization of process conditions for improving viability and other quality attributes. Dry. Technol. 2010, 28, 495–507. [Google Scholar] [CrossRef]
- Patir, B.; Ateş, G. Kurut’un Mikrobiyolojik ve Kimyasal Baz› Nitelikleri Üzerine Araştırmalar. Turk. J. Vet. Anim. Sci. 2002, 26, 785–792. [Google Scholar]
- Tarakçı, Z.; Dervişoğlu, M.; Temiz, H.; Aydemir, O.; Yazıcı, F. Review on kes cheese. J. Food 2010, 35, 283–288. [Google Scholar]
- Cakir, I.; Coskun, H.; Akoglu, I.T.; Isleyen, M.F.; Kiralan, M.; Bayrak, A. Introducing a traditional dairy product Kes: Chemical, microbiological, and sensorial properties and fatty acid composition. J Food Agric Env. 2009, 7, 116–119. [Google Scholar]
- Ertugay, M.F.; Baslar, M.; Sengul, M.; Sallan, S. The effect of acoustic energy on viscosity and serum separation of traditional Ayran, a Turkish Yoghurt Drink. J. Food 2012, 37, 253–257. [Google Scholar]
- Chauhan, A.K.S.; Srivastava, A.K. Optimizing drying conditions for vacuum-assisted microwave drying of green peas (Pisum sativum L.). Dry. Technol. 2009, 27, 761–769. [Google Scholar] [CrossRef]
- Mujumdar, A.S.; Law, C.L. Drying technology: Trends and applications in postharvest processing. Food Bioprocess Technol. 2010, 3, 843–852. [Google Scholar] [CrossRef]
- Köprüalan, Ö.; Elmas, F.; Bodruk, A.; Arıkaya, Ş.; Koç, M.; Koca, N.; Kaymak-Ertekin, F. Impact of pre-drying on the textural, chemical, color, and sensory properties of explosive puffing dried white cheese snacks. LWT Food Sci. Technol. 2022, 154, 112665. [Google Scholar] [CrossRef]
- Hii, C.L.; Ong, S.P.; Yap, J.Y.; Putranto, A.; Mangindaan, D. Hybrid drying of food and bioproducts: A review. Dry. Technol. 2021, 39, 1554–1576. [Google Scholar] [CrossRef]
- Peighambardoust, S.H.; Tafti, A.G.; Hesari, J. Application of spray drying for preservation of lactic acid starter cultures: A review. Trends Food Sci. Technol. 2011, 22, 215–224. [Google Scholar] [CrossRef]
- Chandrasekaran, S.; Ramanathan, S.; Basak, T. Microwave food processing—A review. Food Res. Int. 2013, 52, 243–261. [Google Scholar] [CrossRef]
- Kayisoglu, S.; Ertekin, C. Vacuum drying kinetics of barbunya bean (Phaseolus vulgaris L. elipticus Mart.). Philipp. Agric Sci. 2011, 94, 285–291. [Google Scholar]
- Kubbutat, P.; Leitão, L.; Kulozik, U. Stability of foams in vacuum drying processes. Effects of interactions between sugars, proteins, and surfactants on foam stability and dried foam properties. Foods 2021, 10, 1876. [Google Scholar] [CrossRef]
- Tafti, A.G.; Peighambardoust, S.H.; Hesari, J.; Bahrami, A.; Bonab, E.S. Physico-chemical and functional properties of spray-dried sourdough in breadmaking. Food Sci. Technol. Int. 2013, 19, 271–278. [Google Scholar] [CrossRef]
- Vega, C.R.Y.H.; Roos, Y.H. Invited review: Spray-dried dairy and dairy-like emulsions—Compositional considerations. J. Dairy Sci. 2006, 89, 383–401. [Google Scholar] [CrossRef]
- Kim, S.S.; Bhowmik, S.R. Effective moisture diffusivity of plain yogurt undergoing microwave vacuum drying. J. Food Eng. 1995, 24, 137–148. [Google Scholar] [CrossRef]
- Kim, S.S.; Shin, S.G.; Chang, K.S.; Kim, S.Y.; Noh, B.S.; Bhowmik, S.R. Survival of lactic acid bacteria during microwave vacuum-drying of plain yoghurt. LWT Food Sci. Technol. 1997, 30, 573–577. [Google Scholar] [CrossRef]
- Yüksel, A.N. Development of yoghurt powder using microwave-assisted foam-mat drying. J. Food Sci. Technol. 2021, 58, 2834–2841. [Google Scholar] [CrossRef] [PubMed]
- Tontul, I.; Ergin, F.; Eroğlu, E.; Küçükçetin, A.; Topuz, A. Physical and microbiological properties of yoghurt powder produced by refractance window drying. Int. Dairy J. 2018, 85, 169–176. [Google Scholar] [CrossRef]
- Bielecka, M.; Majkowska, A. Effect of spray drying temperature of yoghurt on the survival of starter cultures, moisture content and sensoric properties of yoghurt powder. Food/Nahrung 2000, 44, 257–260. [Google Scholar] [CrossRef]
- Hayaloglu, A.A.; Karabulut, I.; Alpaslan, M.; Kelbaliyev, G. Mathematical modeling of drying characteristics of strained yoghurt in a convective type tray-dryer. J. Food Eng. 2007, 78, 109–117. [Google Scholar] [CrossRef]
- Koç, B.; Sakin-Yılmazer, M.; Kaymak-Ertekin, F.; Balkır, P. Physical properties of yoghurt powder produced by spray drying. J. Food Sci. Technol. 2014, 51, 1377–1383. [Google Scholar] [CrossRef] [PubMed]
- Seth, D.; Mishra, H.N.; Deka, S.C. Functional and reconstitution properties of spray-dried sweetened yogurt powder as influenced by processing conditions. Int. J. Food Prop. 2017, 20, 1603–1611. [Google Scholar] [CrossRef]
- Stencl, J. Modelling the water sorption isotherms of yoghurt powder spray. Math. Comput. Simul. 2004, 65, 157–164. [Google Scholar] [CrossRef]
- Kumar, P.; Mishra, H.N. Moisture sorption characteristics of mango–soy-fortified yogurt powder. Int. J. Dairy Technol. 2006, 59, 22–28. [Google Scholar] [CrossRef]
- Shiby, V.K.; Mishra, H.N. Thin layer modelling of recirculatory convective air drying of curd (Indian yoghurt). Food Bioprod. Process. 2007, 85, 193–201. [Google Scholar] [CrossRef]
- Yaman, H.; Coşkun, H. Optimization of production technology of Kes for pasta. Indian J. Dairy Sci. 2017, 70, 167–177. [Google Scholar]
- Emirmustafaoğlu, A.; Çoșkun, H. Optimization of production technology of keș for frying. Yüzüncü Yil Üniversitesi J. Agric. Sci. 2017, 27, 357–369. [Google Scholar]
- Karabulut, I.; Adnan Hayaloglu, A.; Yildirim, H. Thin-layer drying characteristics of kurut, a Turkish dried dairy by-product. Intç J. Food Sci. Technol. 2007, 42, 1080–1086. [Google Scholar] [CrossRef]
- Bradley, L., Jr.; Arnold, E., Jr.; Barbano, D.M.; Semerad, R.G.; Smith, D.E.; Vines, B.K. Chemical and Physical Methods. In Standard Methods for the Examination of Dairy Products; Marshall, R.T., Ed.; American Public Health Association: Washington, DC, USA, 1993; pp. 433–531. [Google Scholar]
- AOAC. Official Methods of Analysis, 15th ed.; Association of Official Analytical Chemists: Washington, DC, USA, 1990; pp. 807–809, 841–842. [Google Scholar]
- Renner, E. Milchprakticum; Justus-Liebig-Universität: Giessen, Germany, 1993. [Google Scholar]
- International Dairy Federation (IDF). Determination of Nitrogen Content; Standard No. 20B; International Dairy Federation: Brussels, Belgium, 1993. [Google Scholar]
- Granato, D.; Masson, M.L. Instrumental color and sensory acceptance of soy-based emulsions: A response surface approach. Food Sci. Technol. 2010, 30, 1090–1096. [Google Scholar] [CrossRef]
- Pathare, P.B.; Opara, U.L.; Al-Said, F.A.J. Color measurement and analysis in fresh and processed foods: A review. Food Bioprocess Technol. 2013, 6, 36–60. [Google Scholar] [CrossRef]
- ADMI (American Dry Milk Institute). Standards for Grades of Dry Milks Including Methods of Analysis; Bulletin 916; ADMI: Chicago, IL, USA, 1971; p. 53. [Google Scholar]
- NADRG (NIRO Atomizer Dairy Research Group). Analytical Methods for Dry Milk Products, 4th ed.; A/S Niro Atomizer: Copenhagen, Denmark, 1978; p. 109. [Google Scholar]
- Keeney, M.; Bassette, R. Detection of intermediate compounds in the early stage of browning reaction in milk products. J. Dairy Sci. 1959, 42, 945–960. [Google Scholar] [CrossRef]
- Yaldiz, O.; Ertekin, C. Thin layer solar drying of some vegetables. Dry. Technol. 2001, 19, 583–597. [Google Scholar] [CrossRef]
- Giri, S.K.; Prasad, S. Drying kinetics and rehydration characteristics of microwave-vacuum and convective hot-air dried mushrooms. J. Food Eng. 2007, 78, 512–521. [Google Scholar] [CrossRef]
- Akpinar, E.; Bicer, Y.; Yildiz, C. Thin layer drying of red pepper. J. Food Eng. 2003, 59, 99–104. [Google Scholar] [CrossRef]
- Jun Ho, L.; Li, Z. Mathematical modeling on vacuum drying of Zizyphus jujuba miller slices. J. Food Sci. Technol. 2013, 50, 115–121. [Google Scholar]
- Loague, K.; Green, R.E. Statistical and graphical methods for evaluating solute transport models: Overview and application. J. Contam. Hydrol. 1991, 7, 51–73. [Google Scholar] [CrossRef]
- IBM SPSS 23, IBM Corp. Released, IBM SPSS Statistics for Windows, Version 23.0; IBM Corp: Armonk, NY, USA, 2015.
- González-Cavieres, L.; Pérez-Won, M.; Tabilo-Munizaga, G.; Jara-Quijada, E.; Díaz-Álvarez, R.; Lemus-Mondaca, R. Advances in vacuum microwave drying (VMD) systems for food products. Trends Food Sci. Technol. 2021, 116, 626–638. [Google Scholar] [CrossRef]
- Gürbüz, Ü.; İstanbullugil, F.R.; Biçer, Y. Kurut üretim teknolojisi ve kalite niteliklerinin belirlenmesi. Manas J. Agric. Vet. Life Sci. 2018, 8, 59–67. [Google Scholar]
- Anli, E.A. Possibilities for using microwave-vacuum drying in Lor cheese production. Int. Dairy J. 2020, 102, 104618. [Google Scholar] [CrossRef]
- Chudy, S.; Bilska, A.; Kowalski, R.; Teichert, J. Color of milk and milk products in CIE L* a* b* space. Med. Weter. 2020, 76, 77–81. [Google Scholar]
- Carvalho, M.J.; Perez-Palacios, T.; Ruiz-Carrascal, J. Physico-chemical and sensory characteristics of freeze-dried and air-dehydrated yogurt foam. LWT Food Sci. Technol. 2017, 80, 328–334. [Google Scholar] [CrossRef]
- Feyzi, S.; Varidi, M.; Zare, F.; Varidi, M.J. Effect of drying methods on the structure, thermo and functional properties of fenugreek (Trigonella foenum graecum) protein isolate. J. Sci. Food Agric. 2018, 98, 1880–1888. [Google Scholar] [CrossRef]
- Sarabandi, K.; Peighambardoust, S.H.; Sadeghi Mahoonak, A.R.; Samaei, S.P. Effect of different carriers on microstructure and physical characteristics of spray dried apple juice concentrate. J Food Sci. Technol. 2018, 55, 3098–3109. [Google Scholar] [CrossRef]
- Erbay, Z.; Koca, N. Effects of using whey and maltodextrin in white cheese powder production on free fatty acid content, nonenzymatic browning and oxidation degree during storage. Int. Dairy J. 2019, 96, 1–9. [Google Scholar] [CrossRef]
- Gunel, Z.; Tontul, I.; Dincer, C.; Topuz, A.; Sahin-Nadeem, H. Influence of microwave, the combined microwave/hot air and only hot air roasting on the formation of heat-induced contaminants of carob powders. Food Addit. Contam. Part A 2018, 35, 2332–2339. [Google Scholar] [CrossRef]
- Orikasa, T.; Koide, S.; Okamoto, S.; Imaizumi, T.; Muramatsu, Y.; Takeda, J.I.; Tagawa, A. Impacts of hot air and vacuum drying on the quality attributes of kiwifruit slices. J. Food Eng. 2014, 125, 51–58. [Google Scholar] [CrossRef]
- Chudy, S.; Pikul, J.; Rudzinska, M.; Makowska, A. The effect of storage on physicochemical properties of spray-dried milk, egg and milk-egg mixture. Acta Agrophys. 2015, 22, 17–26. [Google Scholar]
- Koca, N.; Erbay, Z.; Kaymak-Ertekin, F. Effects of spray-drying conditions on the chemical, physical, and sensory properties of cheese powder. J. Dairy Sci. 2015, 98, 2934–2943. [Google Scholar] [CrossRef] [PubMed]
- Sahin, C.C.; Erbay, Z.; Koca, N. The physical, microstructural, chemical and sensorial properties of spray dried full-fat white cheese powders stored in different multilayer packages. J. Food Eng. 2018, 229, 57–64. [Google Scholar] [CrossRef]
- Phosanam, A.; Chandrapala, J.; Zisu, B.; Adhikari, B. Storage stability of powdered dairy ingredients: A review. Dry. Technol. 2021, 39, 1529–1553. [Google Scholar] [CrossRef]
- Joshi, M.; Adhikari, B.; Aldred, P.; Panozzo, J.F.; Kasapis, S. Physicochemical and functional properties of lentil protein isolates prepared by different drying methods. Food Chem. 2011, 129, 1513–1522. [Google Scholar] [CrossRef]
- Ayensu, A. Dehydration of food crops using solar dryer with convective 438 heat flow. Sol. Energy 1997, 59, 121–126. [Google Scholar] [CrossRef]
- Page, G.E. Factors Influencing the Maximum Rates of Air Drying Shelled Corn in Thin Layers. Master’s Thesis, Prude University Department of Mechanical Engineering, Prude, Indiana, 1949. [Google Scholar]
- Overhults, D.G.; White, H.E.; Hamilton, H.E.; Ross, I.J. Drying soybeans with heated air. Trans ASAE (Am. Soc. Agric. Eng.) 1973, 16, 112–113. [Google Scholar] [CrossRef]
- Henderson, S.M.; Pabis, S. Grain drying theory. II. Temperature effects on drying coefficients. J. Agric. Eng. Res. 1961, 6, 169–174. [Google Scholar]
- Wang, C.Y.; Singh, R.P. A single drying equation for rough rice. Trans ASAE (Am. Soc. Agric. Eng.) 1978, 11, 668–672. [Google Scholar]
- Yagcioglu, A. Drying Technique of Agricultural Products; Ege University Faculty of Agriculture Publications: Izmir, Turkey, 1999; Number 536. [Google Scholar]
- Verma, L.R.; Bucklin, R.A.; Endan, J.B.; Wraten, F.T. Effects of drying air parameters on rice drying models. Trans ASAE (Am. Soc. Agric. Eng.) 1985, 28, 296–301. [Google Scholar] [CrossRef]
- Henderson, S.M. Progress in developing the thin layer drying equation. Trans ASAE (Am. Soc. Agric. Eng.) 1974, 17, 1167–1168. [Google Scholar] [CrossRef]
- Midilli, A.; Kucuk, H.; Yapar, Z. A new model for single-layer drying. Dry. Technol. 2002, 20, 1503–1513. [Google Scholar] [CrossRef]


Publisher’s Note: MDPI stays neutral with regard to jurisdictional claims in published maps and institutional affiliations. |
© 2022 by the author. Licensee MDPI, Basel, Switzerland. This article is an open access article distributed under the terms and conditions of the Creative Commons Attribution (CC BY) license (https://creativecommons.org/licenses/by/4.0/).