Article

Quantifying Moss Response to Metal Contaminant Exposure Using Laser-Induced Fluorescence

1
Department of Earth Sciences, University of Hawai‘i at Mānoa, Honolulu, HI 96822, USA
2
Savannah River National Laboratory, Aiken, SC 29831, USA
3
UHERO and the Department of Economics, University of Hawai‘i at Mānoa, Honolulu, HI 96822, USA
*
Author to whom correspondence should be addressed.
Appl. Sci. 2022, 12(22), 11580; https://doi.org/10.3390/app122211580
Submission received: 7 September 2022 / Revised: 4 November 2022 / Accepted: 8 November 2022 / Published: 15 November 2022

Abstract

:

Featured Application

This work demonstrates the application of real-time, non-destructive, in situ imaging of metal contamination in moss using LIF.

Abstract

Tracing sources of contamination, including potentially toxic elements (PTEs), has historically been achieved through sampling and analysis of soil or biota, which are labor-intensive, costly, and destructive methods. Thus, availability of a non-destructive in situ remote sensing method for monitoring metals deposited in biota is of great interest. Laser-induced fluorescence (LIF) is an emerging spectroscopic and imaging technique that documents changes in molecular energy level in plants as a biological response to metal contamination. For a proof-of-concept study and preliminary experiment, moss was selected for experimentation due to its long history of use in tracing atmospheric deposition of PTEs. Consecutive treatments of copper chloride (CuCl2) were administered to three moss samples, simulating wet deposition every 48 h over 10 days until reaching cumulative Cu concentrations of 2.690 to 8.075 μmol/cm2. While these Cu amounts are above environmentally relevant concentrations, they allowed the best conditions for testing and fine tuning of the imaging and data processing protocols presented in this paper. Moss fluorescence was induced using both 532 nm green and 355 nm UV lasers. A CMOS camera captured images of the LIF response, and red–green–blue (RGB) decimal code values were extracted for each pixel in the images, and pixel densities of color channels from treated and untreated moss samples were compared. Results show a shift towards lower color decimal codes corresponding to increased Cu concentration. We developed and contrasted multiple quantitative analyses of color distributions and demonstrated that LIF shows great promise for remote sensing of Cu accumulation in moss at μmol/cm2 levels. Though currently, the method would be limited to highly toxic sites, it illustrates the possibility and provides a framework for development of higher-sensitivity methods to detect nmol/cm2 that are viable for urban contamination level monitoring.

1. Introduction

While many metals naturally occur and are important for the growth of organisms, metals and radionuclides in excess, also termed potentially toxic elements (PTEs), can negatively impact the metabolic functions of biota, resulting in physiologic changes due to metal-induced stress [1,2,3]. Because of their simple morphology, bryophytes are viewed as model organisms for observing physiological changes as a result of exposure to metal toxicity [4,5]. Despite their extent, which is limited to wet environments, mosses, a type of bryophyte (clade: Embryophyta, division: Bryphyta), are commonly used as biomonitors for atmospheric deposition of PTEs due to their lack of a true root system that limits metal absorption only to their surface [6,7]. The tissue structure in mosses allows for more rapid uptake of metals when compared to vascular plants, which also results in a noticeable physiological response [8]. Because their cell walls lack a cuticle layer [5,9], metals can easily interact and accumulate, leading to moss’s large surface-to-weight ratio [10]. Mosses also have the benefit of being able to capture metals from single deposition events and retain a history of exposure due to their slower growth rate [11] and less specialized connective tissue [12]. There has been success for decades in using moss for environmental monitoring, which is largely due to their robust and resilient nature as a plant species that survives in even the harshest of environments [13].
Metals can be distributed via the atmosphere and then delivered to terrestrial mosses by wet and dry deposition [6,14,15,16]. Retention of dissolved copper (Cu) in wet deposition or Cu-carrying dry particles onto the surfaces of plants depends on plant size and its cell wall lipid structure [11]. After metal uptake, total chlorophyll content and chloroplast alteration [5] have been observed in moss [1,8]. Cu is one of the most commonly tested metals in the literature on moss and found to create a measurable decrease in overall chlorophyll content and increases in the chlorophyll-b-to-chlorophyll-a ratio [17]. Due to these results, and the known history of its natural uptake in plants, this study used Cu in evaluating the potential application of a new laser-induced fluorescence (LIF) technique to aid in identification of metal contamination in the environment via moss.
LIF is a promising new tool which offers a less invasive, in situ method for a more efficient alternative, or complement, to more laborious and costly traditional moss collection and analyses. In this research, we propose the use of laser-induced fluorescence (LIF), an emerging imaging and spectroscopic technique that can be used to document a change in the atomic/molecular energy level in plants. Atoms or molecules are excited to a higher energy state via a laser, and after absorption, the energy is released as a spontaneous emission of light or fluorescence [18,19]. When compared to other methods currently being used, for example, absorption spectroscopy, LIF has been found to have a high signal-to-noise ratio while also maintaining better sensitivity for detection [20]. Near-IR (infrared) spectroscopy, widely used in agriculture, has similar benefits to LIF, being a non-destructive and inexpensive way of monitoring plant stress or nutrient levels. However, at higher wavelengths, near-IR can have reduced sensitivity, which limits the distance at which the technique can be used or in what light conditions measurements can be performed [21,22]. Though solar reflectance is traditionally used for remote assessment of plant health and observing photosynthesis efficiency in biomass, the technique is useful at larger resolution using satellites but has reduced plant specificity [23].
When compared to these technologies, LIF could fill existing gaps or offer more efficient alternatives. LIF shows promise in successful testing to monitor stress changes as a result of biochemical and physiological factors with a measurable impact on the photosynthesis rate [24]. The application of LIF has also shown that it can distinguish between stress caused by environmental factors versus those caused by metal contamination. Chappelle et al. showed an increase in fluorescence when the rate of photosynthesis was reduced due to metal stress [24]. The study showed a link between photosynthetic efficiency and energy transfer to chlorophyll directly affecting the level of pigment in chloroplasts [24]. Though metal stress can also affect plastoquinone (vitamin K1), adenosine diphosphate (ADP), and nicotinamide adenine diphosphate (NADP), only a reduction in vitamin K1 levels could affect fluorescence detection [24]. Riboflavin, protein acceptors [24], and, more recently, β-carotene, chlorophyll-b, and xanthophyll pigments [25], were explored for their potential fluorescence signatures and suitability for detecting changes in plant physiology. However, Ayudhya et al. reported that even in pure pigment form, only chlorophyll-a and -b have consistently significant responses to LIF [25].
The work presented here utilizes the “Standoff Biofinder” (Biofinder; Dr. Anupam Misra, [email protected], University of Hawai‘i at Mānoa, HIGP, SOEST, Honolulu, HI, USA) developed by Misra et al. [26]. The Biofinder uses two laser wavelengths, simultaneously fired at nanosecond pulses (112 ns). Optimization of the firing rate is aimed towards short-lifetime fluorescence (<20 nanoseconds) specific to biogenic and organic materials. The 532 nm laser can induce a strong response in biologics such as chlorophyll, which fluoresces in the red region. The 355 nm laser causes a response from microbial activity in organic matter or hydrocarbons in the blue region but can also induce a chlorophyll response. Lasers with a 532 nm wavelength are traditionally used in the aforementioned studies, but their eye-safety risks have made UV lasers at 355 nm more popular for remote applications. The Biofinder uses a compact color complementary metal oxide semiconductor image sensor (CMOS) camera that is timed with the nanosecond pulsed lasers and collects an image of the observed fluorescence from a sample [26]. Though LIF has been applied to study plant chlorophyll changes in the past [24], moss has not been studied and so this study is unique in that it explores the biologic response of moss to metal exposure through imaging of chlorophyll fluorescence while taking advantage of the specific, unique features of the Biofinder.
The work, in the form of a preliminary experiment, builds on the extensive evidence in the literature of PTE accumulation in moss from atmospheric fallout [1,6] and associated physiological changes in plants due to alterations in chlorophyll composition from metal uptake [5,17,27]. Combining that with the ability of LIF to observe organics with great sensitivity for chlorophyll pigments via non-invasive techniques [24] shows great promise. Therefore, the hypothesis of this study was that LIF will be able to detect physiological changes in moss due to PTE stress, and that the moss response will be related to the level of PTE applied. This new LIF application was developed as a potentially cost-effective methodology of identifying moss stress from metal contaminants without the need to collect samples and analyze them in the laboratory, or to help find target locations in contaminated moss sampling for further analysis.

2. Materials and Methods

We divided the methodology into three parts, with the first detailing the transition and cultivation of moss samples in the laboratory and Cu treatments. Part two utilized the Biofinder’s LIF and CMOS camera to record images of treated moss samples and focused on optimization of LIF settings to maximize the signal that captures moss response to different levels of metal exposure. Finally, in part three, we processed the collected images to quantify moss fluorescence color change as a result of different Cu treatment levels.

2.1. Laboratory Treatment of Moss with Copper

For the experiment, we selected Thuidium plicatile, which is an endemic frond-like moss species found in Hawai’i [28]. We collected moss samples from the same mat found along the Wa’ahila Ridge Trail and State Recreational Area (21.307°, −157.797°) on 1 June 2020. The area is a relatively uncontaminated environment that can be found downstream of the Honolulu Watershed Forest Reserve, transitioning into a forest on the southeastern part of the Ko’olau mountain range. Samples were separated into four patches of moss, referred to as moss masses, and placed on trays covering an area of 316 cm2 (7 in × 7 in). The moss was then placed in a grow tent for a week before any experimental treatment to allow the samples to acclimate to their new environment. Growth conditions were kept at 50–60% relative humidity, an average temperature of 18–20 °C, and given 14–17 W/m2 of ambient light (1400–1800 lux) with a day length of 10 h. Samples were only removed from the grow tent for about 0.5–1 h in total per day during the experiment for Cu treatment and image collection.
In the literature, metal absorption and resulting physiological change in moss were studied using aqueous solutions of copper sulfate (CuSO4) or copper chloride (CuCl2) with concentrations between 0.05 and 2 mmol/m2 [1,29,30,31]. However, these experiments often did not collect physiological observations of changes in moss over time, making it difficult to predict the behaviors of moss after exposure. We explored a full range of concentrations close to, but not reaching, those inducing death in the moss. Upper limits of Cu dosing were taken from commercial landscaping applications using CuSO4 in a solution of ~1 to 5 mmol/m2 [32], which has been shown to significantly inhibit growth. At the higher end of dosing levels, various moss species change color (browning), which can be used as a clear visual confirmation of physiological change. To test moss response, we used three treatment regimes, which from here on are referred to as trials, ranging from levels tested previously in laboratory experiments [29,30,31] up to the commercially used level.
Cu concentrations were chosen to document the effects of a single dose versus reaching the same concentration level in multiple doses. The three trials used doses at levels of 0.5 mmol/m2, 1 mmol/m2, and 1.5 mmol/m2, respectively. Within each trial, the respective doses were applied five times (every 48 h) to reach cumulative Cu concentrations of 2.5 mmol/m2, 5 mmol/m2, and 7.5 mmol/m2. These concentrations are equivalent to 2.690 μmol/cm2, 5.385 μmol/cm2, and 8.075 μmol/cm2 for the moss area of 316 cm2. We administered Cu as CuCl2 every odd day at 1/5th of the cumulative Cu dose (0.538 μmol/cm2, 1.077 μmol/cm2, and 1.615 μmol/cm2) dissolved in 30 mL of de-ionized water, reaching the desired cumulative Cu concentration by the 10th day of the experiment (Table 1). Trial 1 was a tray with a control moss mass. Every morning before imaging, 30 mL of de-ionized (DI) water was applied to the control tray, while the treatment trays received 30 mL of DI or DI + Cu. Application of solutions (DI or DI + Cu) was carried out using a spray bottle to simulate wet deposition via the atmosphere.
The effectiveness of the Cu treatment was assessed by the direct measurement of Cu accumulation in moss. After imaging each day, 3 pairs of fronds (6 total per trial per day) were removed from three sections (left, center, and right) across the moss masses. The fronds were weighed and then leached using a sequential elution technique (SET) to extract metal from the surface of moss as well as its extra- and intracellularly bound Cu content [33,34].
Frond pairs were shaken in 10 mL of DI for 30 s to remove any unbound metals. The fronds were then removed from the DI water, dried, and immersed in 10 mL of 10 mM ethylenediaminetetraacetic acid (EDTA) solution [35]. Fronds were submerged and shaken in EDTA solution for 45 min. The process was then repeated in a fresh fraction of 10 mL of EDTA for 30 min. The two EDTA fractions were combined for extracellular Cu analysis. Samples were then blotted dry, weighed, and then dried in a furnace at 50 °C for 24 h before cooling for 24 h in a desiccator. The dry weight of cooled fronds was recorded and, finally, samples were submerged in 10 mL of 1 M HNO3 for 30 min of shaking to induce partial digestion.
Only selected samples were analyzed for copper content, specifically 3 pairs (left, center, and right of moss mass) from each sample from days 1, 3, and 10 and 1 pair (center of moss mass) for all the other days. The individual DI water, EDTA, and nitric acid fractions were analyzed for Cu concentration using a sector-field inductively coupled plasma–mass spectrometer (ICP–MS, Thermo-Fisher Element 2; Thermo Fisher Scientific, Waltham, MA, USA) at the University of Southern Mississippi Center for Trace Analysis (CETA). A self-aspirating nebulizer (Elemental Scientific, Omaha, NE, USA) with low flow (100 μL/min) and a Teflon spray chamber was utilized. Cu-63 was determined in medium resolution, and calibration was conducted using external standards made in 0.16 M ultrapure nitric acid. These were then checked against standard reference waters from the U.S. Geological Survey. There was also an in-house consistency standard measured to ensure a sensitivity check, long-term stability, and instrumental drift correction. Cu analysis was also conducted for solution blanks of DI, EDTA, and HNO3 and non-treated fronds from trial 1 to determine baseline Cu concentrations.

2.2. Laser-Induced Fluorescence Imaging

We took images of each moss mass before the first treatment (day 0) to create a baseline control for each trial. On treatment days, imaging of the moss masses occurred before and after wet deposition. Imaging continued for the first 48 h after Cu treatment (0, 6, 12, 24, 36, and 48 h). On non-treatment days, DI was applied to each tray before imaging. We staggered imaging sessions in 30 min intervals by trial number and maintained this order throughout the experiment. For example, the morning imaging began at 7 am and ended at 9 am every day during the 10-day experiment. The Biofinder was set at a constant distance of 0.5 m from the sample and the CMOS camera was integrated with the Baumer Camera Explorer software to capture images of the moss fluorescence. Controlling the camera with this software allowed for timing adjustment to synchronize image capture with the 112 ns pulses of the Nd:YAg lasers (355 nm UV laser and 532 nm green laser). The Baumer Camera Explorer also allowed us to adjust the camera’s gain, exposure, and time delay [26]. We took images at 5 gain levels (10, 20, 30, 40, and 50) to optimize the captured fluorescence response. Figure 1 shows example images of control and treated samples under natural light and LIF from the green and UV lasers individually and in tandem.

2.3. Image Analysis

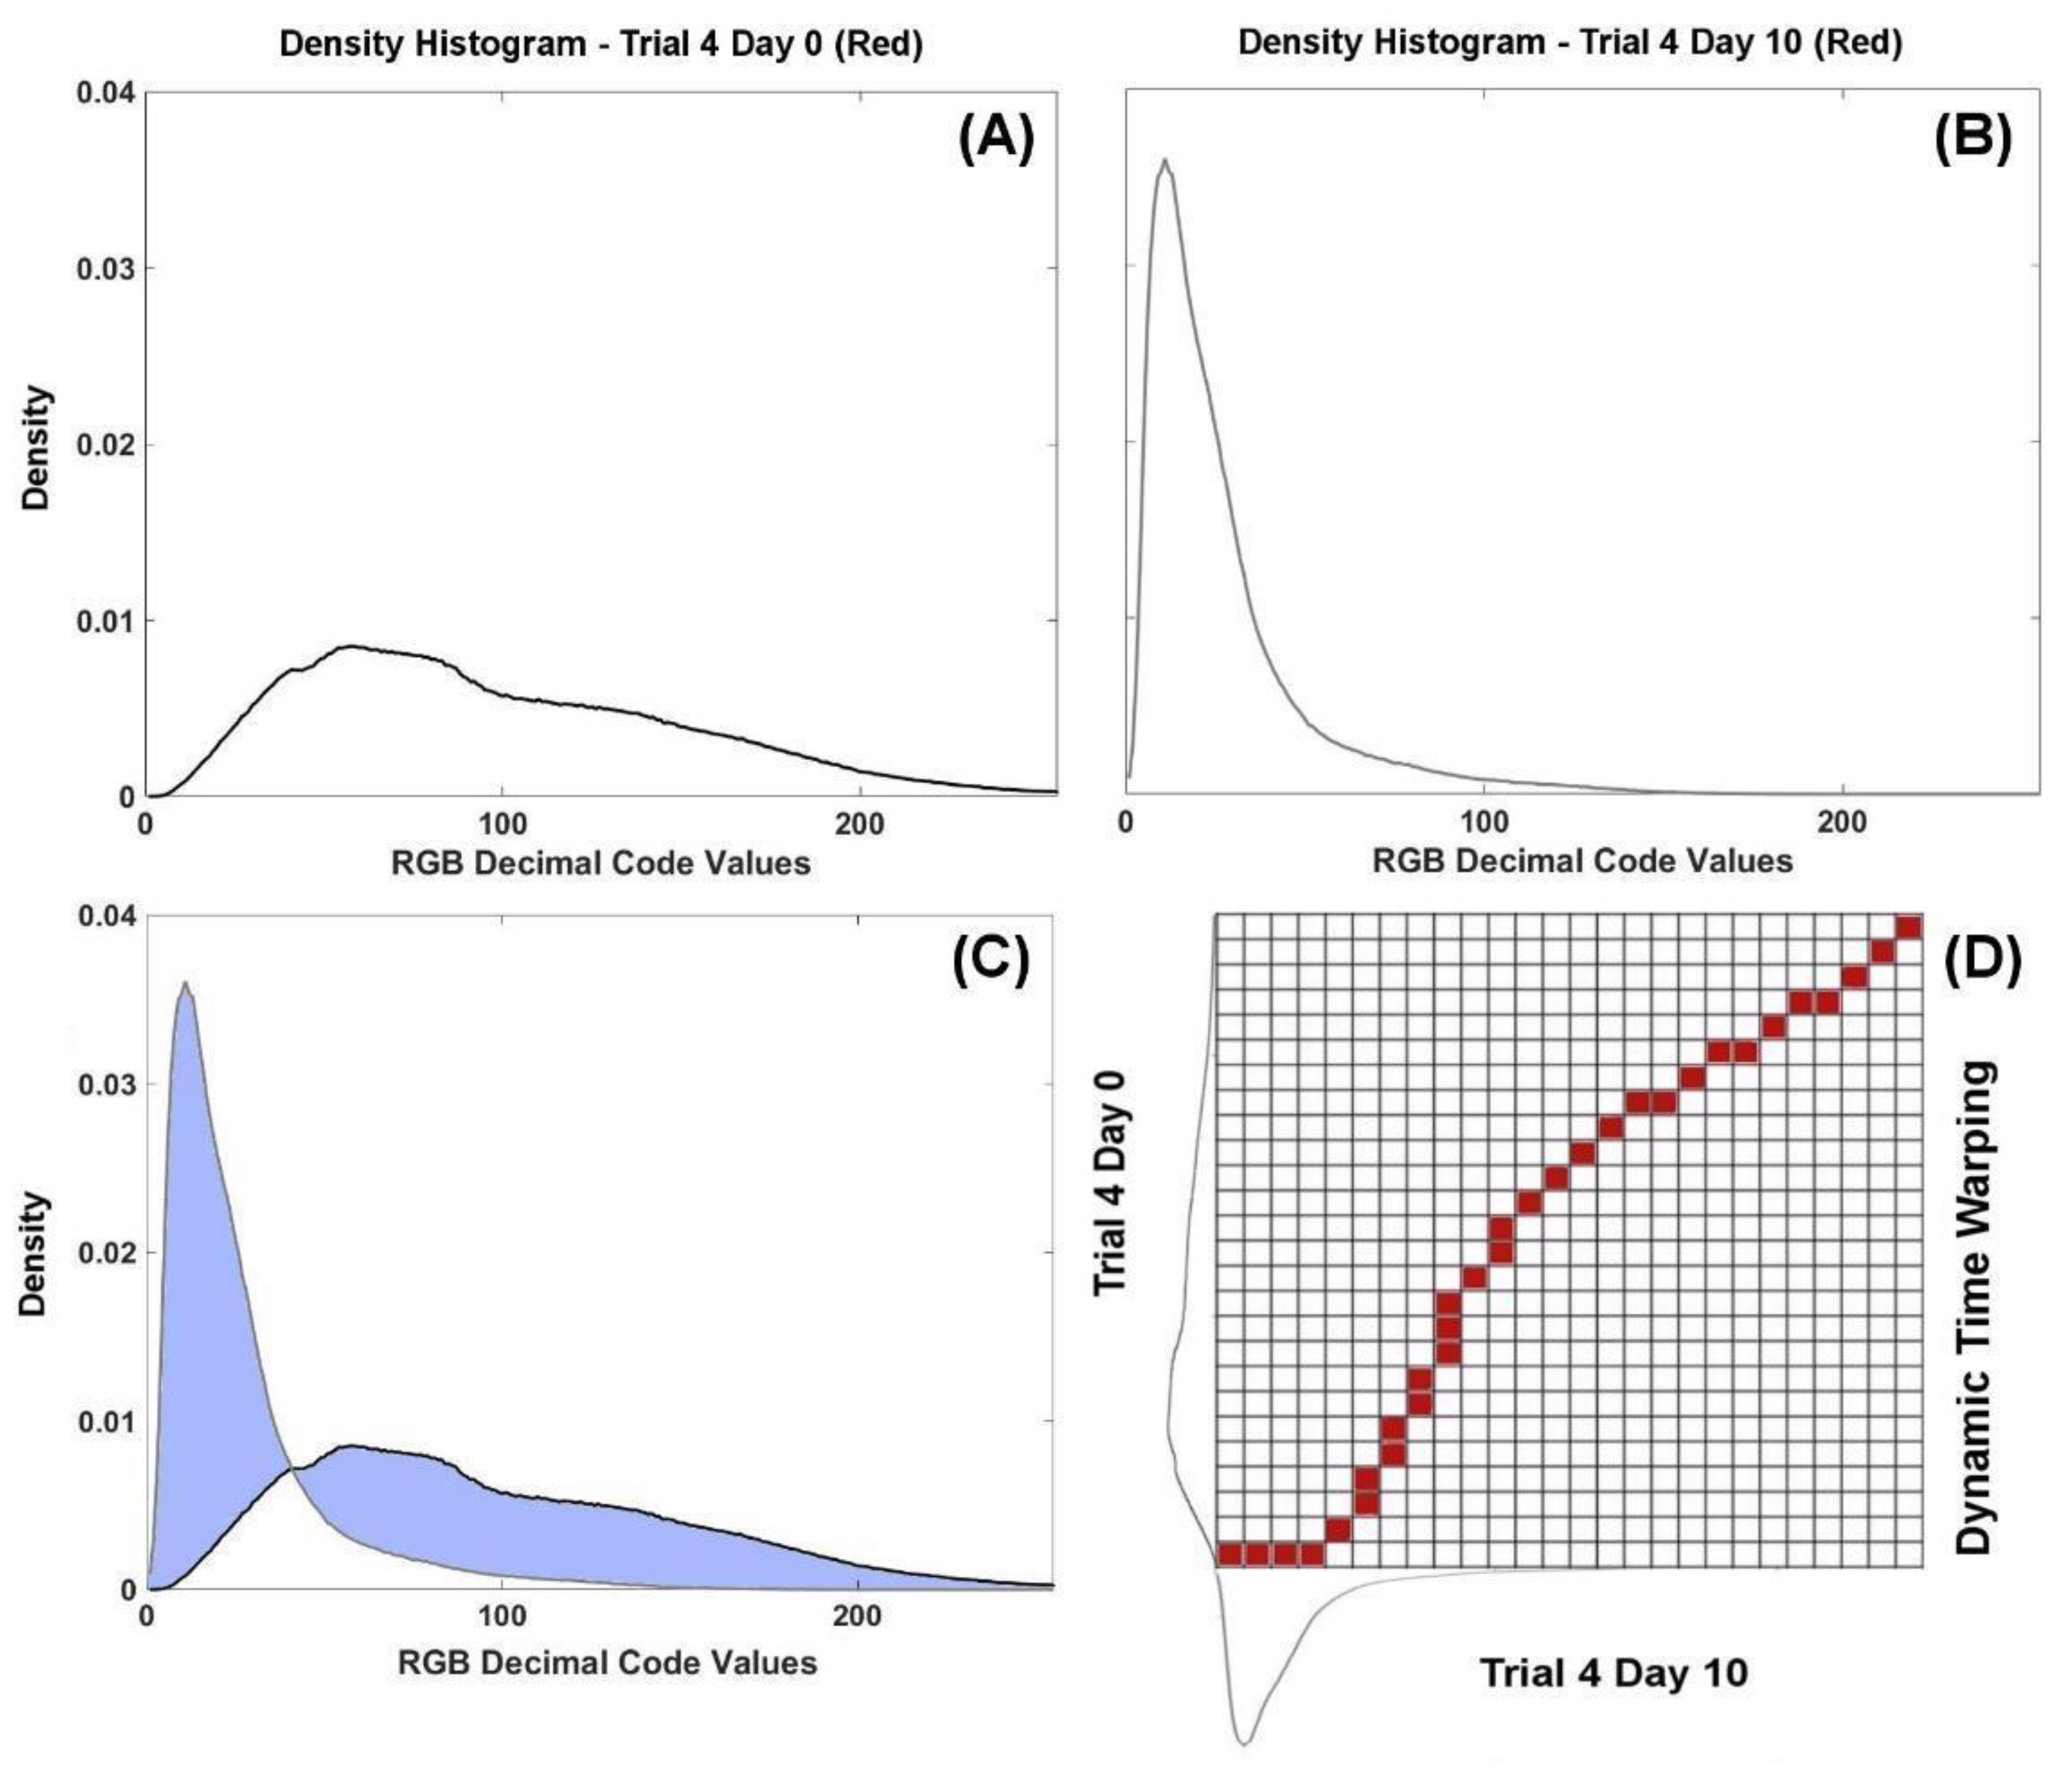
The color compositions of images collected using the Biofinder were analyzed in MATLAB with the Image Processing Toolbox functions imread and imhist. We separated the RGB values of each pixel in each image by color (red, green, blue: RGB). The abundance of pixels at each color intensity, where color intensity is denoted by RGB decimal code (0–255), is represented by densities, or scaled histograms (Figure 2). Unless otherwise noted, scaled histograms represent the fraction of pixels corresponding to each intensity level; in other words, we scaled the number of pixels at a particular intensity level by the total pixel count in the image. Images for each trial were processed using this method, allowing treated samples to be directly compared to their day-0 control as well as to the trial 1 control images.
The single-color histograms of images of treated samples were compared to the histograms of their corresponding control day-0 images by analyzing the intersection overlap (Figure 2). For a specific color channel, the overlap is determined by adding up the minimums of the two scaled histogram values, x:
O v e r l a p   b e t w e e n   H i s t o g r a m s =   ( m i n   | [ x _ t r e a t e d   t r i a l , x _ c o n t r o l   ] | )
For comparison between day-0 images and changes over time in a treated sample:
O v e r l a p   b e t w e e n   H i s t o g r a m s =   ( m i n   | [ t r i a l   a t   t i m e   t   ( x ) , t r i a l   a t   t i m e   0 ( x )   ] | )
Here, x_t represents color abundance at each decimal code from 0 to 225 [36] for an image collected on day t. The difference between scaled histograms was also found, as it can be easier to interpret using the equation:
D i f f e r e n c e   b e t w e e n   H i s t o g r a m s = 1 O v e r l a p
The difference between histograms can be interpreted as a shift in their mode relative to the baseline, where the baseline is the histogram associated either with the control (trial 1) or with day-0 images in treated trials.
Dynamic Time Warping (DTW) can also be used as another way to quantitatively measure the difference in R, G and B histogram shapes between control and treated moss images [37]. The method is a curve-fitting technique that searches for the differences between two datasets without needing to define or model the data to fit a parametric function. DTW compares the minimum difference between all points for the two image histograms and sums them to a single value. Since the DTW algorithm requires integer-valued arguments, this analysis is carried out with raw pixel counts (or raw histograms) rather than scaled histograms (File S5 in Supplementary file).

3. Results

3.1. Moss Cu Content

The total Cu deposited per dry weight of moss is reported in Table 2. The Cu content of moss frond samples ranged from 21 to 360 μmol/g dry wt. depending on the dosage. Treatments of Cu were applied uniformly across the area of the moss, but variation was expected based on individual frond distribution and sampling. To have a better sense of this variability, two fronds per tray from the center or for days 1, 3, and 10 across three random sites were analyzed from each moss mass on each day. The effectiveness of the Cu treatment could be assessed by comparing the measured and applied Cu concentrations with the caveat that the measured Cu was in individual fronds while the applied Cu was per moss mass. Figure 3 shows an approximately linear relationship with reasonably good agreement between measured and applied cumulative doses (e.g., days 1 and 2, 3 and 4, etc.). If we assume that the two fronds represent about 1 cm2 surface area, then recoveries between what was applied and measured in the fronds were 95 ± 43%, indicating that our methods were successful in quantitatively depositing Cu on moss surfaces.

3.2. Gain Selection

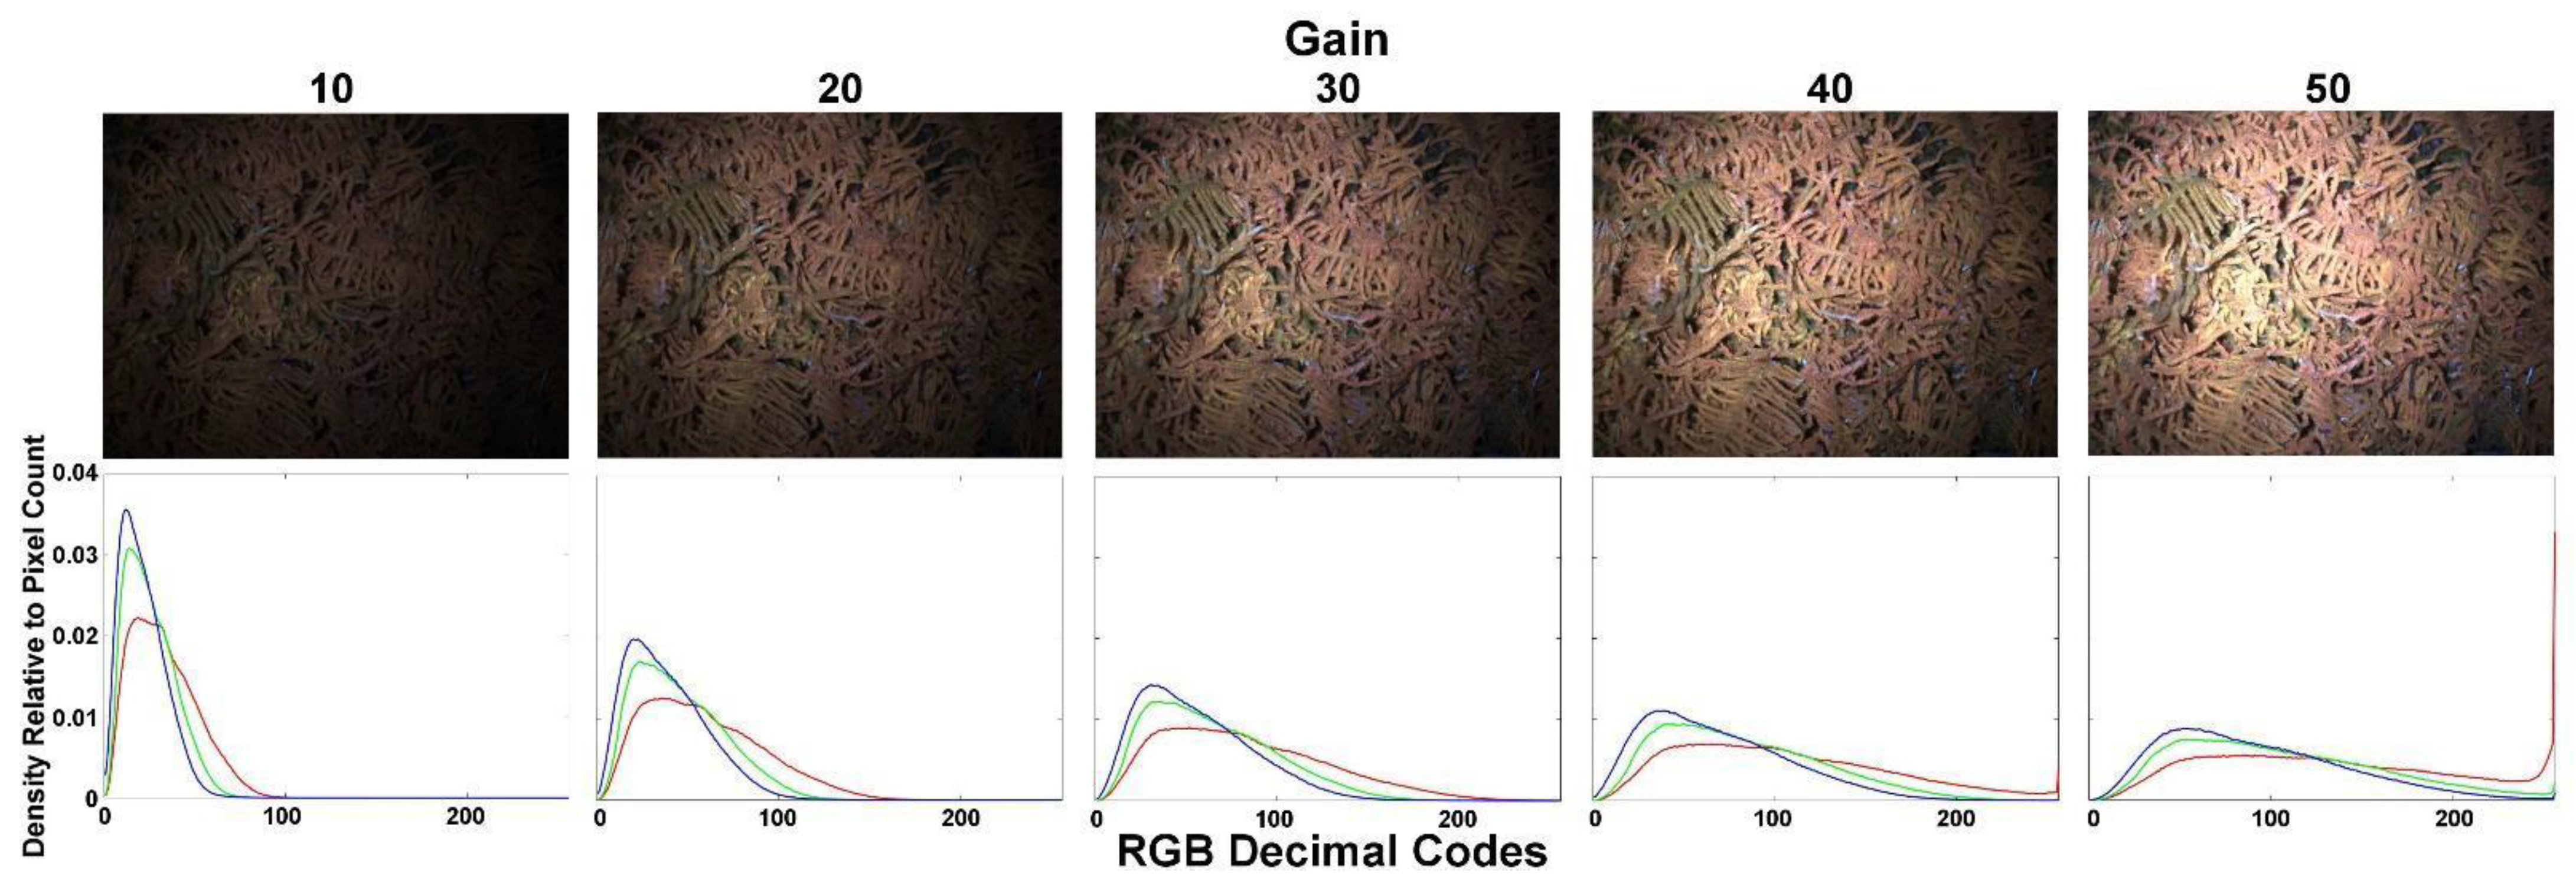
The impact of changing the gain settings on the CMOS camera is illustrated via the color histograms generated from relative pixel counts of each red, green, and blue color channels in an image (Figure 4). If the gain is too low or too high, the images produced either appear under- or over-saturated and have an insufficient dynamic range. Images taken with a lower gain of 10 or 20, shown in Figure 4, have densities with no representation in the decimal code value range above the 100. Lower abundance at specific decimal codes represents an absence of color and results in limited data being available to analyze to conduct a comparison between samples. Oversaturated images at the higher gain levels of 40 and 50 produce histograms with “flat” shapes due to a greater abundance of pixels at the maximum decimal code (255). As a result, for the data analysis discussed in this paper, we selected images collected at a camera gain setting of 30, which proved to be an optimal balance. Histograms showing distributions of color intensities for each sample exposed to green and UV lasers simultaneously were obtained from images taken at a camera gain of 30.

3.3. Qualitative Description of LIF Image Color Components

3.3.1. 48 h Imaging Analysis

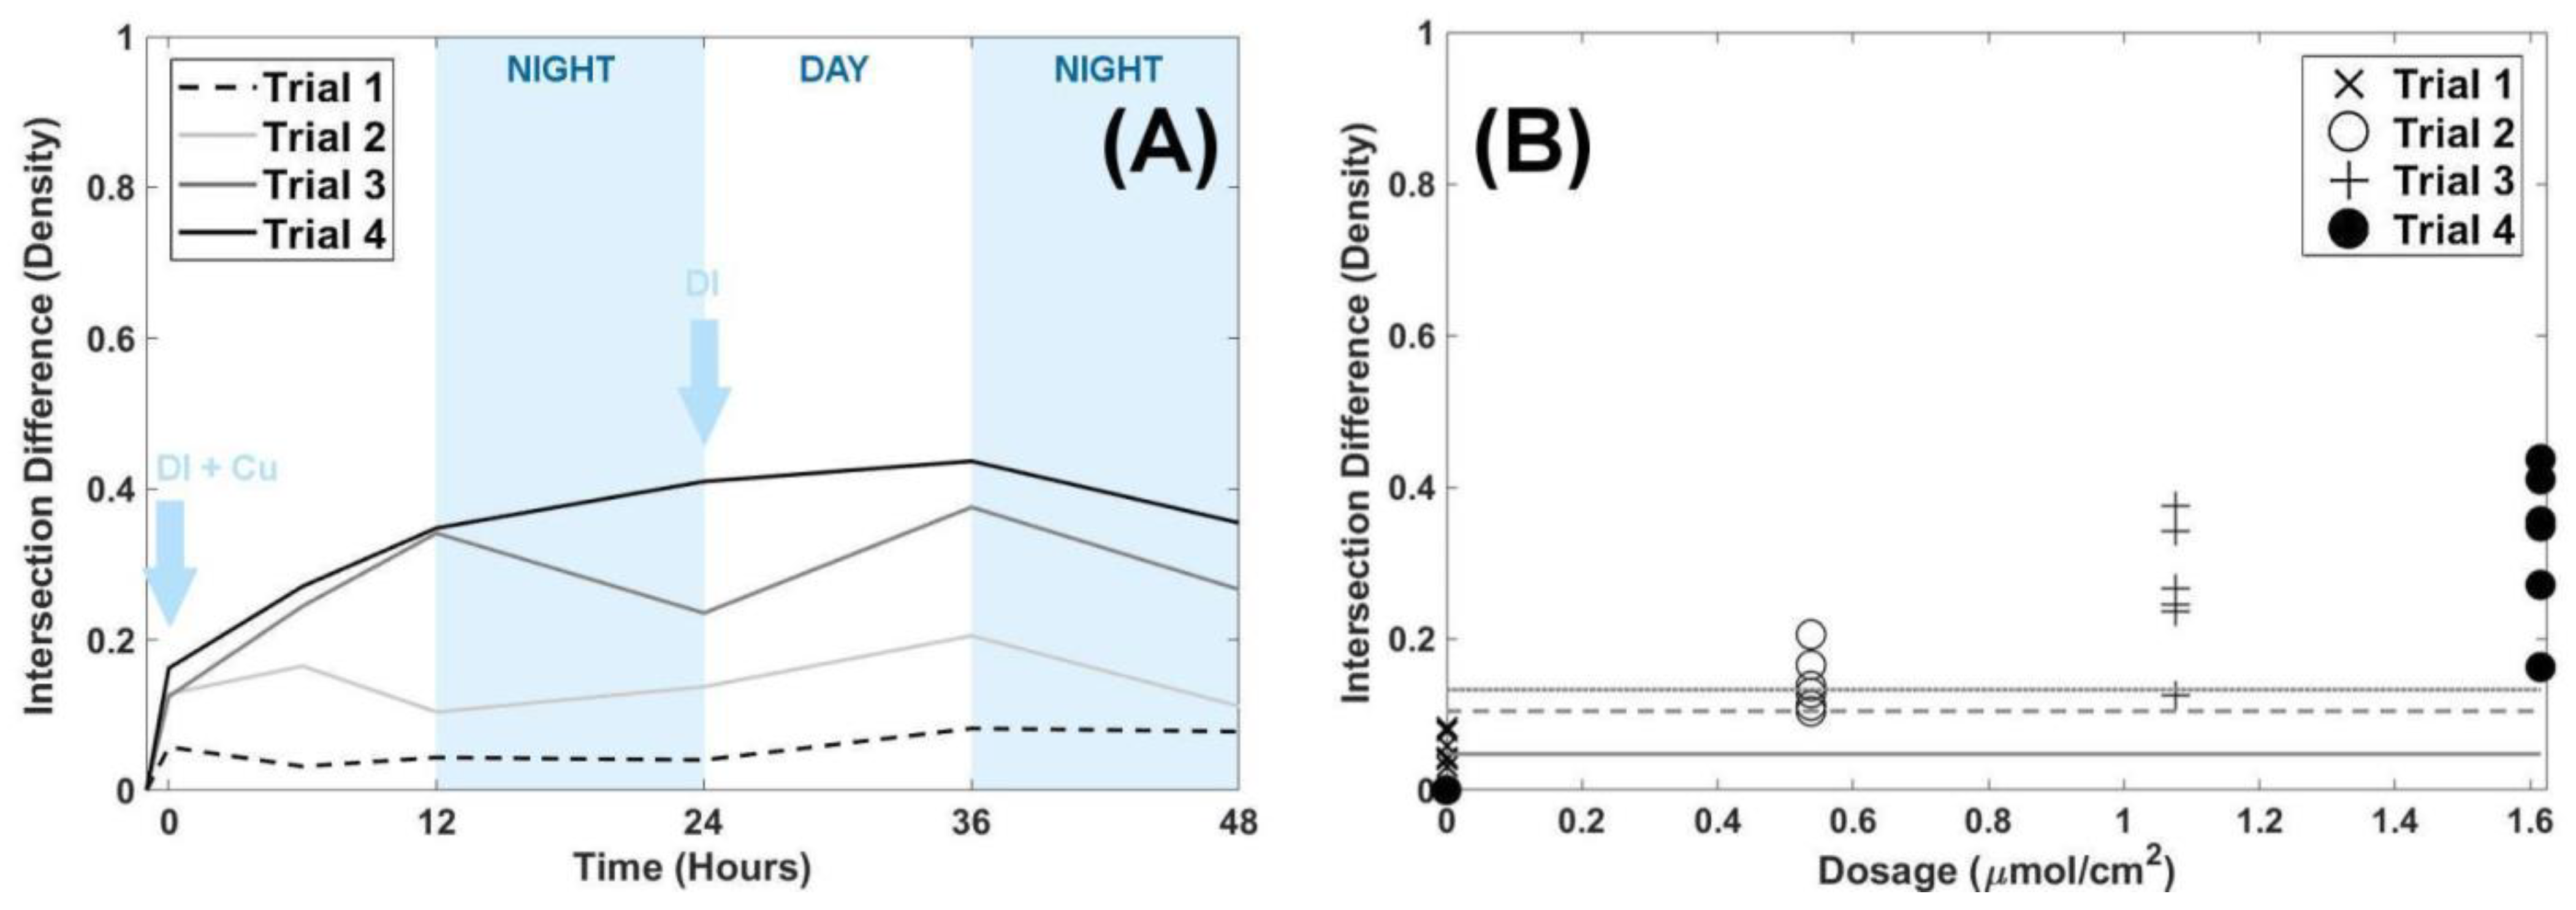
To evaluate the moss response to the applied Cu treatment, we took images of all four trials of the moss samples at 0, 6, 12, 24, 36, and 48 h after Cu treatment. We applied the scaled histogram overlap (2) and difference (3) calculations to compare the R, G, and B color histograms from images from all trials from 0 to 48 h to their corresponding pre-treatment (day-0) color histograms. Figure 5A shows the red channel results (though all colors show the same trend) for the control (trial 1; no Cu treatment) versus the other trials, which were dosed with Cu. The control images taken during day (light) versus night (dark) and pre- versus post-wetting after 24 h do not show any significant difference. Cu-dosed trials, however, showed a non-linear trend in moss response over time corresponding to initial Cu treatments. The three moss samples that received three different levels of Cu doses had very distinct responses as measured by their LIF images. Each of the treated samples showed an increasing deviation of the red histogram from the pre-treatment day-0 control following a Cu dose, but responses began to flatten after 12–24 h. Red histogram differences were also used to represent each trial based on the Cu dose received (Figure 5B) and showed increased differences with increasing dose. Figure 5B also shows the variability of results over the 48 h time period after a given Cu dose was applied. While this work did not study the underlying physiological changes in moss after adding Cu, our results suggest that a change in LIF response can be observed for at least 24–48 h after treatment. Accordingly, the experiment was set to apply Cu doses every 48 h and produce LIF images every 24 h throughout the 10-day duration of the experiment.

3.3.2. 10-Day Experiment Analysis

Figure 6 shows scaled histograms produced for images taken every 24 h over the course of the experiment. The plots show that the control, trial 1, exhibited similar color profiles with minimal changes in R, G, and B histograms throughout the experiment. For trials 2, 3, and 4, there was an overall decrease in color intensity (red, green, and blue) over the course of the 10-day experiment (shift towards 0). By the end of the experimental period, all trials treated with Cu had histograms with modes shifted toward decimal values of 0–50. We isolated the red color on the images (Figure 7) from the final tenth day to visually display the observed decimal code color shift, or “darkening”.
In addition, Figure 6 shows that on all images, the green and blue color histograms overlapped, while the red color histogram was separated. This difference between red and green color histograms and their different patterns of change across the trials can be used to express a change in a sample with increasing Cu dose. To illustrate that, for each image, we plotted the red and green values at corresponding intensities against each other. Each trial was plotted using this relationship comparison with the resulting profiles stacked as illustrated in Figure 8.
By using information from both colors (red and green), we could better note their relationship and co-evolution. The looped shape created from this relationship differed by how much change occurred in both the red and green channels. The furthest point in the loop from the origin represents the highest abundance of pixels in decimal code values of the red and green raw histograms directly corresponding to how right skewed the histograms became with increasing Cu treatments. Because the modes for red and green histograms shifted to the left, the loops in Figure 8 representing the red and green relationship became more overlapping for Cu-treated samples by the end of the 10-day experiment. This manifested as longer and narrower shapes that corresponded with higher Cu dosing in the treated trials. Red and green comparisons were further quantified by evaluating differences in the loop shape profiles at each treatment level.

3.4. Quantitative Analysis of LIF Image Color Components

3.4.1. Interpreting Trends

The above presented methods of expressing changes in color distributions in scaled histograms, and the red versus green color comparisons, indicate that LIF could be used effectively to indicate moss exposure to Cu. The focus then turned to determining which, if any, approach is preferred to quantify changes between trials, as well as having the lowest threshold for Cu exposure identification using this LIF technique.

3.4.2. Single-Color Histogram Comparison

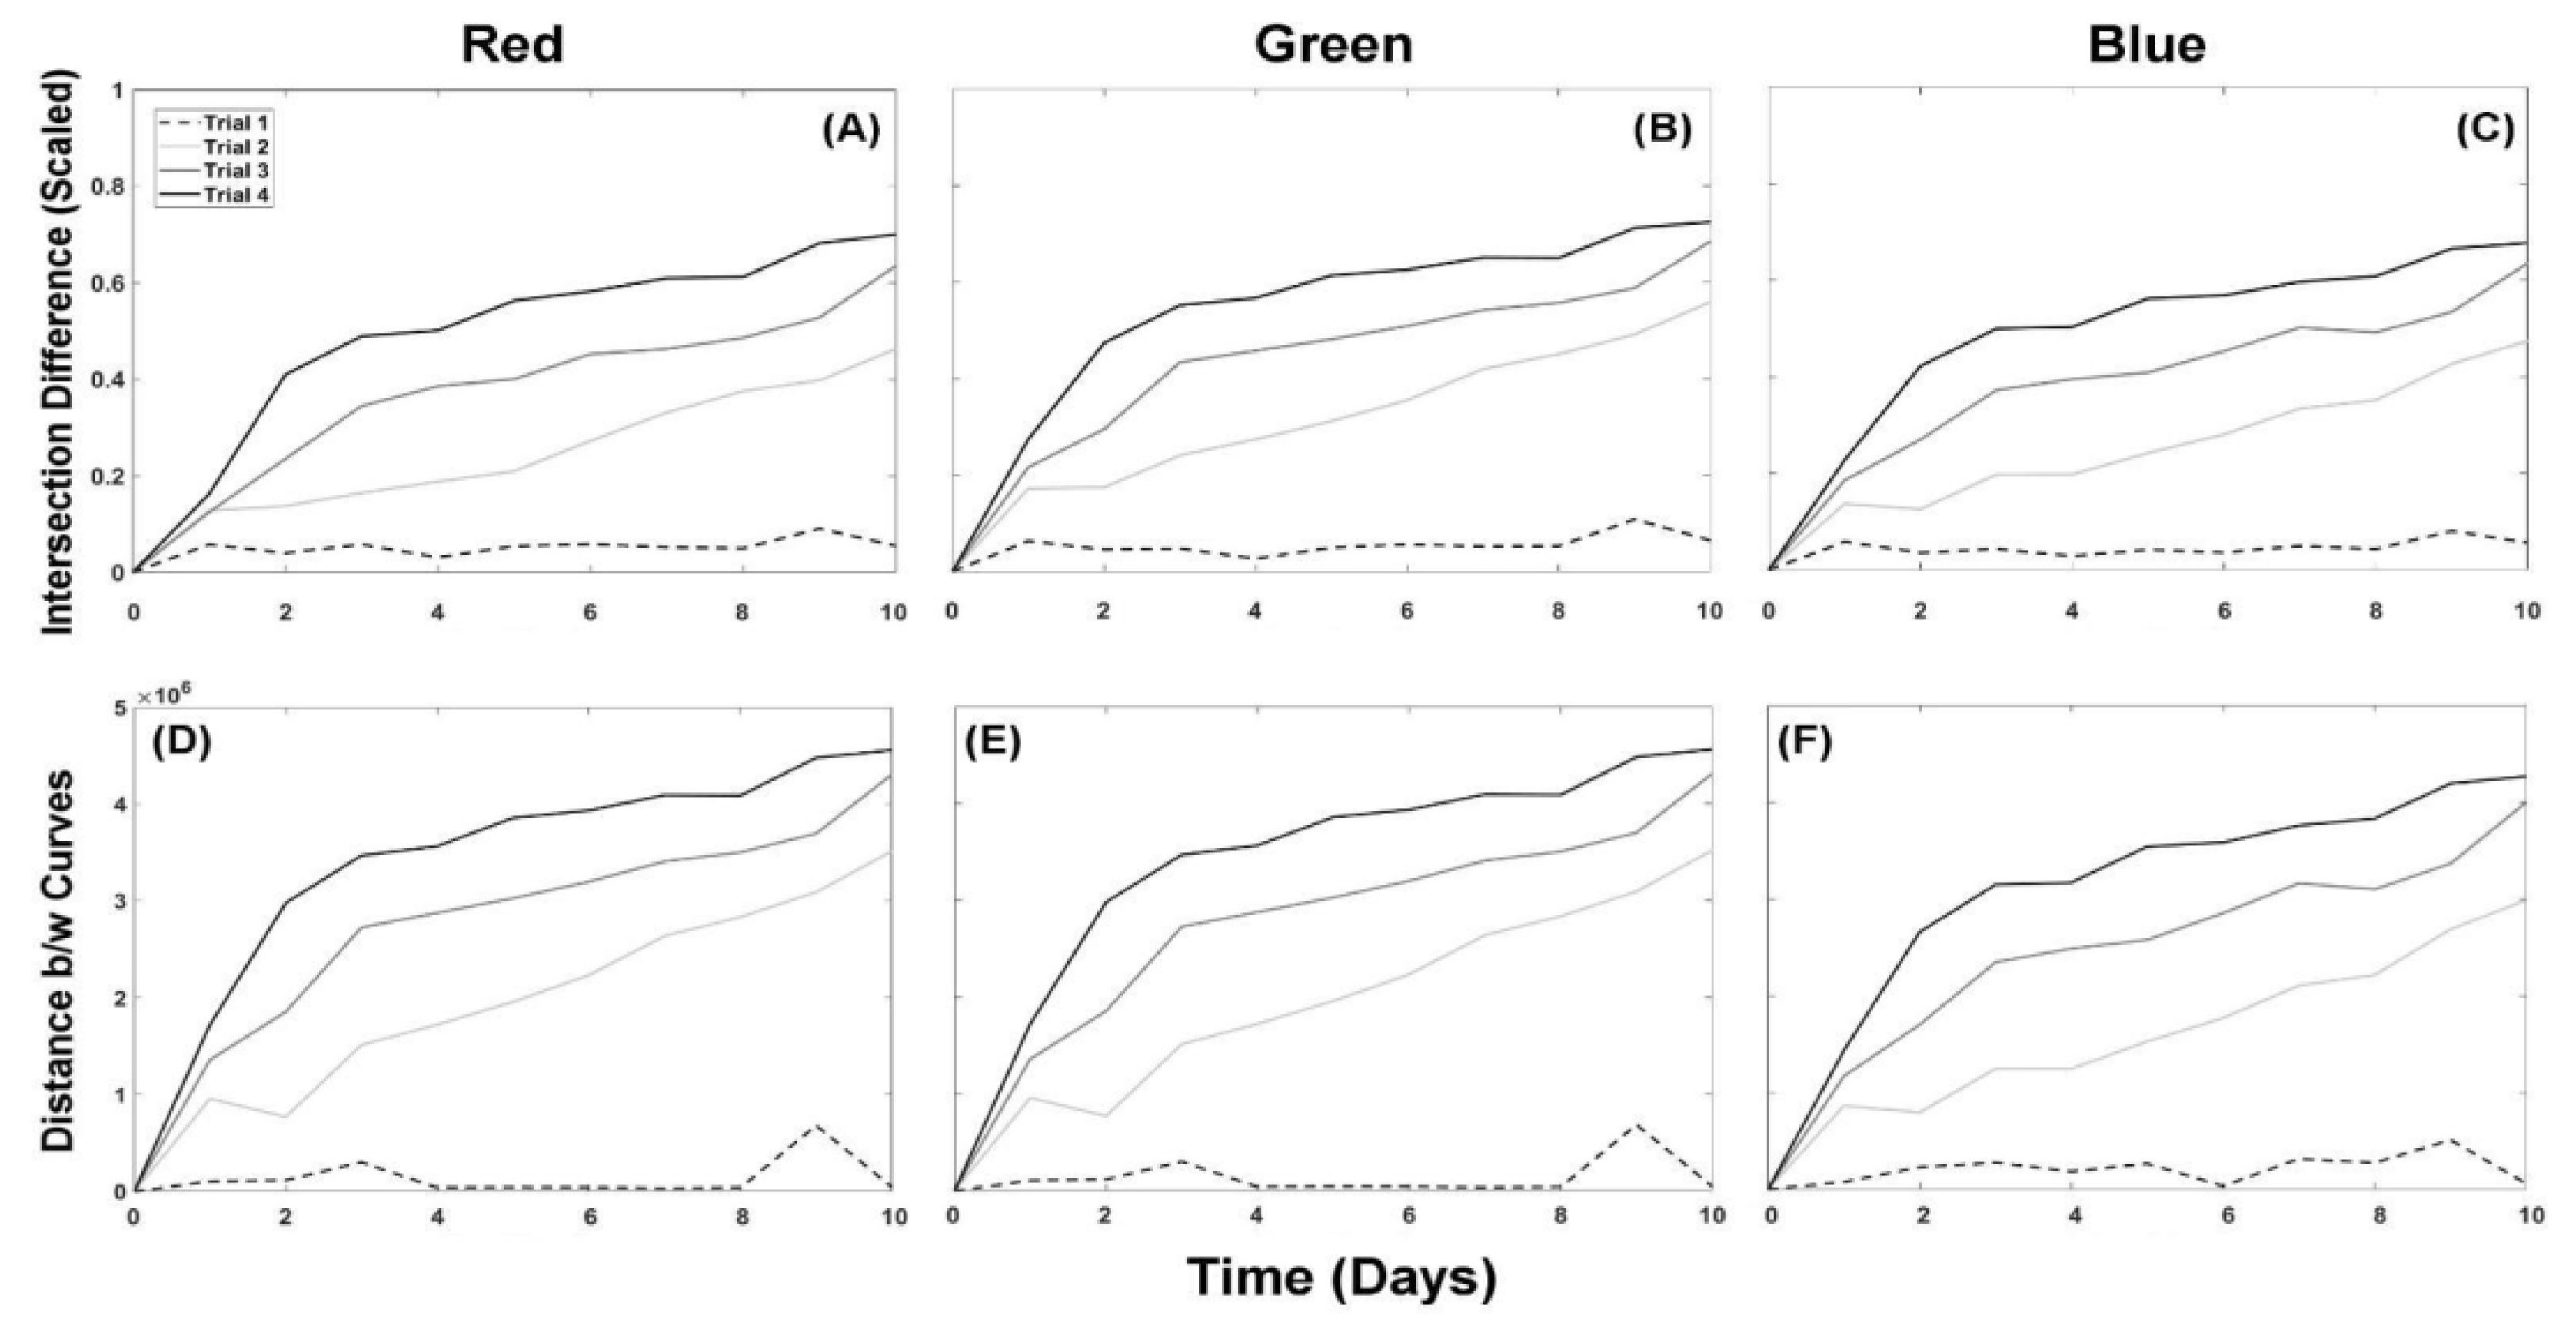
We used the scaled histogram difference (3) calculations to compare the R, G, and B color histograms from images from all trials from days 1 to 10 to their respective day-0 color histograms. Larger difference values express less similarity between color histograms of Cu-treated samples and corresponding day-0 images. The histogram differences (Figure 9A–C) for each color channel showed visible separation between treated trials (2, 3, and 4) and the trial 1 control. The histogram difference values for the control fluctuated very little over the 10 days. Differences in the color histogram of R, G, and B appeared similar (Table A1); thus, the red color channel was chosen for the following discussion to illustrate the relationship between scaled histogram difference and Cu dose.
For comparison, we also used DTW analysis to compare the R, G, B raw color histograms from images from all trials from days 1 to 10 to their respective day-0 raw color histograms. DTW expresses the minimum cumulative difference between histograms. Figure 9D–F show the outcome of the DTW analysis, while Table A2 displays the results numerically. The minimum cumulative differences plotted against time showed significant separation between treated trials (2, 3, and 4) and the trial 1 control. The histogram minimum cumulative differences for the control, again, varied minimally over the 10-day experiment.
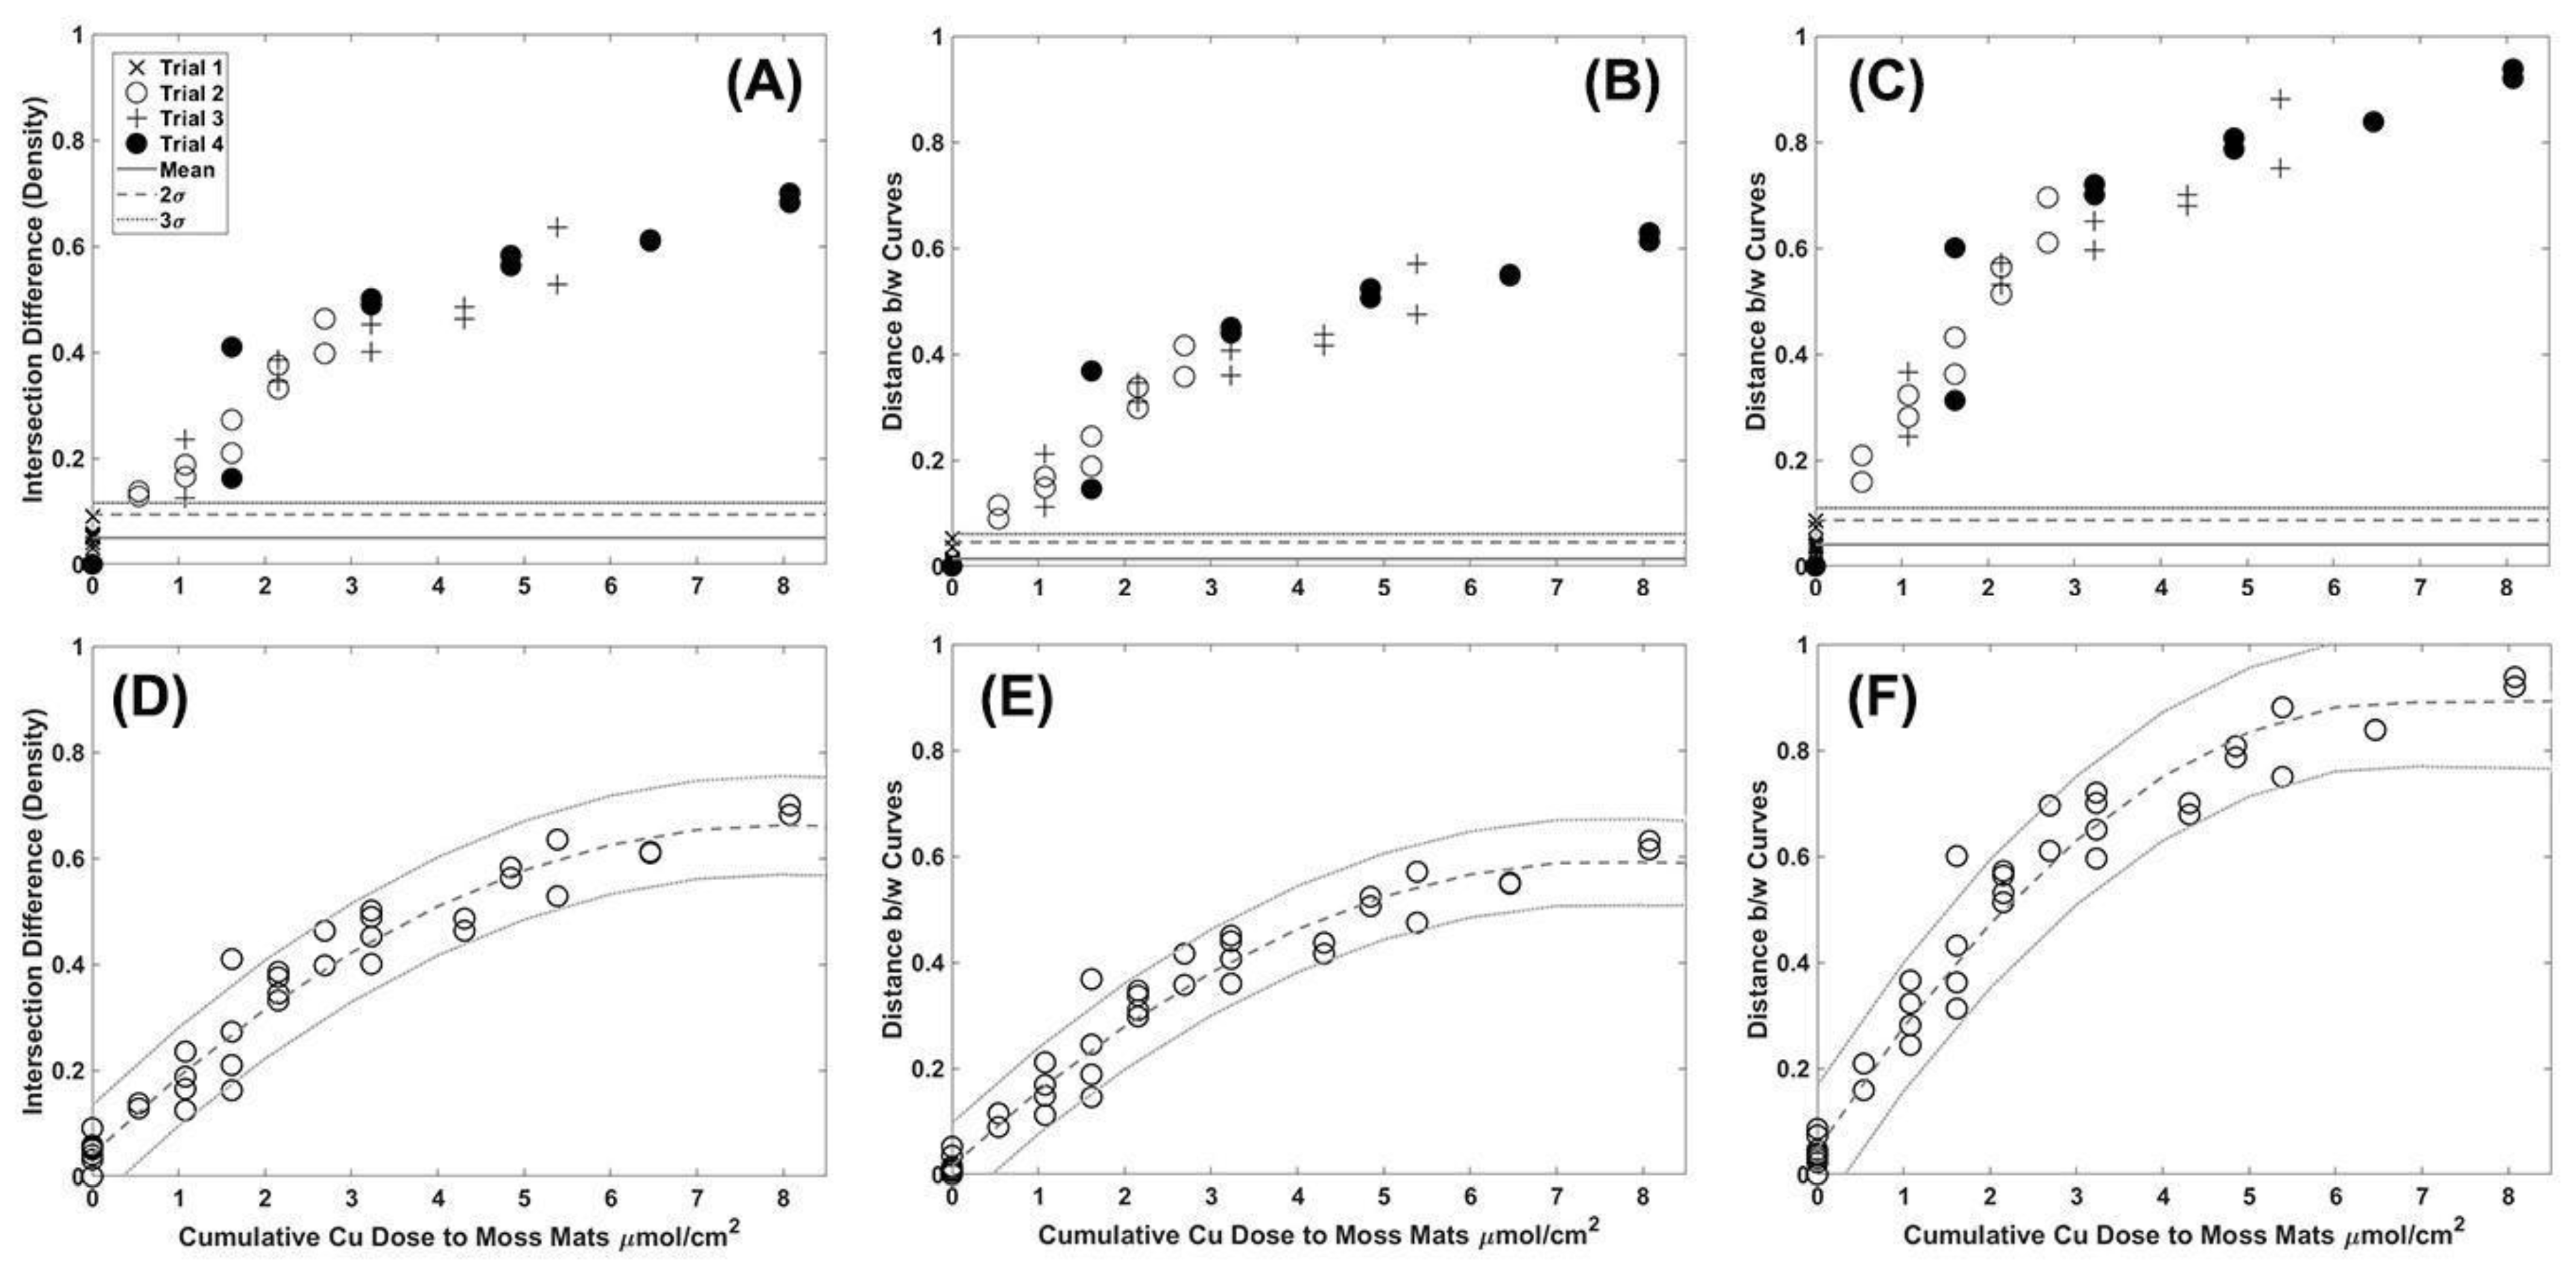
The difference between scaled histograms for the red color channel of each trial (Table A1) and DTW results (Table A2) were plotted against the corresponding cumulative Cu treatments (Table 1; Figure 10A,B). Trial 1 conditions were kept constant, and its images from 1 to 10 days could be used to estimate the uncertainty due to measurement error and random fluctuations in the conditions during the experiment. The mean and standard deviation of the control (2σ and 3σ) are included in Figure 10A–C. Figure 10A–C reveal that all histogram shifts associated with treatment were outside the 3σ interval associated with uncertainty in the control. We had no replicate images for the treatments, so we have no error assignable to those histogram shifts and DTW difference values. However, because a range of Cu levels were achieved through multiple treatments across all trials, we could estimate a relationship between Cu levels and histogram shifts by fitting a curve through all data points. We could also estimate the uncertainty of this relationship by calculating the root mean squared error associated with the fit (Figure 10D–F). The root mean square error is the standard deviation of the residuals or the variation in the data that is not explained by the fitted line. The root mean squared errors for Figure 10D–F with a 95% confidence were 0.0464, 0.0406, and 0.06059, respectively. Single-color analysis for the red color channel using the histogram shift or DTW method (Figure 9D,E) gives similar results, while the two-color DTW analysis accentuates the separation between individual days exposed to the same 48 h dose (Figure 10F). Similar results were obtained using the green and blue colors (results not shown).

3.4.3. Two-Color Histogram Comparison

The analyses above focused on quantifying the difference between individual color channels over time, but did not utilize the possible advantage of the compound information provided by the combination of multiple color channels extracted from the moss images. In order to express differences in the looped shapes resulting from two-color comparison (Figure 8), we applied DTW analysis of the minimum cumulative difference in red vs. green figure shapes from all trials between days 1 and 10 to their respective day-0 color shapes. DTW analysis results for red versus green comparisons are shown in Table A3 and Figure 10C. We also plotted these results against cumulative Cu doses (Figure 10C), duplicating the same approach for single-color analysis. Minimum cumulative differences for all trials treated with Cu were outside of the mean ± 3σ interval of control trial 1. Figure 10 suggests that the DTW two-color analysis provides better separation and may be more sensitive than either single-color analysis method.

4. Discussion

The qualitative and quantitative analysis of trial 1 (control) images showed only minor variation across the three color channels for the duration of the 10-day experiment. These results would therefore suggest that the conditions maintained within the grow tent were appropriately set to sustain a stable environment for moss growth. Evaluations of images collected at day and night or before and after wetting (Figure 5) revealed that no discernable difference could be found in the control moss response over the 48 h period of examination. This gives us confidence that imaging after wetting or at different times of the day should not have affected our results. Alternatively, Cu-treated moss developed characteristic patterns discernable from qualitative observations that could be classified as shifts in the modes of red and green color distributions from higher to lower, or “darker” decimal code values in their scaled histograms (Figure 6). Observing that the control remained unchanged while shifts toward a taller, more right-skewed distribution occurred with increasing Cu toxicity, was qualitatively significant information. By the end of the 10-day experiment, only trial 4 exhibited discoloration in the moss observable with the human eye, but LIF results clearly show a change in fluorescence for the other trials dosed with Cu.
Individual colors from the collected images were analyzed quantitatively using scaled histogram differences (Figure 9A–C) as well as a DTW technique (Figure 9D–F). Both methods allowed the difference between selected colors from trial images taken before and after Cu dosing to be represented as single numerical values. These values could then be used to compare the difference of treated trials from the mean ± standard deviation of the control (trial 1). Analysis of the differences between scaled histograms, DTW for single-color histograms, and DTW for two-color histograms (red versus green) in Figure 10 all show treated samples imaged throughout the 10-day experiment being separated from the control mean ± standard deviation at 3σ (99.7%). Agreement between all three analysis methods is encouraging, but most importantly, the results show that the LIF technique is capable of differentiating between moss treated with Cu from control samples at a Cu wet deposition level of 0.034 mg/cm2 for singular doses and 0.515 mg/cm2 for cumulative doses tested within this work, or potentially higher. Multi-colot analysis using red vs. green color channels appeared to be more sensitive to the Cu dose, i.e., the % differences of the treated samples were larger (Table A2 and Table A3).
Further, when observing the results, we found that multiple incremental doses as opposed to a single dose amounting to the same Cu levels result in a comparable Cu-induced response (Figure 10). The trial 2 dose administered on day 5 (0.102 mg/cm2 achieved in three doses) plots very near the trial 4 dose for day 1 (0.103 mg/cm2 achieved in one dose). In comparing days 7 and 8 of trial 2 (dose of 0.138 mg/cm2) with day 3 and 4 of trial 3 (0.136 mg/cm2), the overlap can be clearly seen. These results are encouraging and suggest that LIF might be able to quantify cumulative Cu exposure in moss for both long-term environmental input and after individual deposition events.
Red versus green plots of pixel counts were also explored in an attempt to better understand the co-evolution and possible relationship between changes in two colors. The produced shapes resulting from the original histograms for red and green color channels produced a looped shape, showing a shift over the experiment in which the loops both narrowed and lengthened with increasing Cu dose (Figure 8), making for a quantitatively distinct difference from the control. We were successful in employing the DTW method to quantify these shapes when compared to the control, and they separated clearly from the mean ± standard deviation of 3σ. Unfortunately, since all Cu levels tested resulted in clear quantifiable separation from the control, it is not currently possible to define the lowest detection threshold for this method. More work needs to be carried out to explore minimum detection limits with this particular design, and we can currently only say that the methodology of using LIF can identify our lowest applied dose of Cu at 0.034 mg/cm2. While the presented results show the viability of LIF to detect a physiological change in moss in response to Cu treatment, its applicability in the confirmed Cu ranges to environmental contamination is limited but may be relevant to industrially contaminated areas as is discussed next.
The lowest Cu dose administered in this work, 0.034 mg/cm2 or 340 mg/m2, is much higher than wet deposition values reported by published environmental levels for urban environments. Such measurements in the US vary from as low as 0.49 to 2.2 mg/m2/yr for five cities reported in New Jersey [38], and 0.70 mg/m2/yr to 1.06 mg/m2/yr for the more suburban areas of Reston, Virginia [39], and Chicago, Illinois [40]. Global studies reported similar Cu values of 0.8 ± 0.7 mg/m2/yr in urban areas for an average wet deposition [41]. However, higher levels of Cu were recorded in areas of Asia at 4.7 mg/m2/yr for Hong Kong, 14.6 mg/m2/yr for Singapore, and 10.5 mg/m2/yr in the North Sea [41]. When considering dry weight, the lowest measured Cu concentrations in moss fronds from the current experiment were 1300 ± 700 μg/g (equivalent to ppm). Correspondingly, examples of Cu levels observed in mosses, e.g., from Chengdu in Southwest China, range from 19.5 ± 3.6 to 139 ± 27 μg/g [42]. A survey in Portugal used two mosses (Scleropodium touretii (Brid.) L. Kock) and Hypnum cupressiforme Hedw.) across 178 sites, resulting in a documented Cu range of 0.4–52 μg/g [43]. A total of 79 samples of Orthotrichum lyellii Hook. & Taylor were collected from 18 sites in Seattle, Washington, and showed varying levels of Cu ranging from 15.6 to 114.6 mg/kg [44]. Likewise, 346 moss samples of the same moss species were collected in Portland, Oregon, over a 3-week period, and, though the work showed a mean of 20 μg/g, the maximum observed value was 357.25 μg/g [45]. Clearly, the demonstrated sensitivity range of this LIF method does not extend to urban environments. However, while urban areas are of great interest to immediate human health, higher Cu levels of concern and sustained environmental impacts are predominately from mining and industrial activities.
Introduction of PTEs into the environment comes mostly from anthropogenic sources, mainly due to the processing or production of metals through mining, smelting, waste incineration, and fossil fuel industries [46]. When observing industrial areas such as the Serbian thermoelectric Nikola Tesla power plant, examples of Cu levels 100× above urban areas are reported [46], which would fall closer to the currently detectable levels found while using LIF in this study. Sampling of moss around the Nikola Tesla plant revealed a range of 14.27 to 37.23 μg/g in comparison to moss measured near Canadian thermal power plants, which had an average of 19.8 μg/g [47]. In Turkey, the Murgul copper mine had 9–13 μg/g/day of copper deposited via dry deposition [48]. However, 13 moss species collected at 23 sites around the plant revealed a range from 105 to 1916 μg/g [48]. Comparison of soil samples at the same sites showed Cu ranges of 81–1266 μg/g [48]. Assessment of metal toxicity in soils and their accumulation in plants throughout 17 sites across Northeast Italy revealed measurements of 20–3975 μg/g even though limits for industrial sites are set to 600 μg/g [49]. Plant accumulation of Cu in dandelions (Taraxacum officinale Weber ex F.H.Wigg. 1780) and willows (Salix caprea L., Salix elaeagnos Scop., and Salix purpurea L.) was much lower than that in the soil at 16–81 μg/g [49].
This short review of environmental Cu levels is used to illustrate that the current LIF method would only be applicable for detecting Cu in the most extreme cases, such as the 1900 μg/g of moss near the Murgul copper mine [48]. The lowest threshold determined in our experiment, 340 mg/m2, is one to two magnitudes higher than levels found in urban areas. These results show that this preliminary experiment needs further improvements to the optical system, e.g., adjustment of laser intensity or gain controls on the camera, which could be made in future studies. For now, we conclude that the analysis techniques using histogram differences and DTW single-color comparison and red vs. green color plots are in good agreement and appropriate for Cu detection. The technique shows potential for in situ monitoring where collected moss images could be evaluated against uncontaminated controls. However, applications of in situ imaging using LIF may still encounter possible challenges, such as the natural response of moss to environmental conditions in the field instead of the controlled grow tent used for testing. Moss growth, like many plants, can be affected by a number of factors that can impact LIF and chlorophyll behavior including temperature, water content, nutrient availability, and light [50].
Another aspect of this study that needs to be explored further is the underlying cause of image color changes. We hypothesized that the shift in decimal code to the “darker”, lower end may be linked to a change in chlorophyll content in response to metal toxicity that results in either a shift from chl-a to chl-b or a reduction in the chl-a-to-chl-b ratio [1,9,17]. It is proposed that the addition of measuring the chl-a and chl-b levels through experiments extracting chlorophyll content may help confirm that hypothesis. At this time, the exact mechanism(s) responsible for change in moss fluorescence have yet to be determined. Independently of the underlying physiological cause, however, LIF as applied here demonstrated reproducible and convincing results, showing that it can detect Cu contamination in moss samples.

5. Conclusions

The research presented throughout this paper aimed to design and implement a new, repeatable methodology applying a new LIF technology (Biofinder) [26] for the detection of Cu contamination in moss. Fluorescence in moss samples was captured through images, which were processed into color histograms that showed that modes of red and green color histograms from Cu-treated trials were shifted compared to the control. Color comparison was achieved through the successful application of scaled histogram differences and DTW for single- and two- color analyses. Quantitative analysis of results proves that metal contamination at a level of 0.034 mg/cm2 or higher in moss samples can be identified using the Biofinder and that there is a predictable relationship between Cu dose and color shifts. Though the levels of Cu tested were much higher than those found in background sources or urban settings, the current system could still have applications in highly toxic sites affected by industry, mining, Superfund, or sewage sludge deposit sites. To make the technique more applicable, improving the sensitivity by two to three magnitudes will be the focus for future work. Distinguishing lower and higher toxicities will help separate PTEs from background levels and provide better guidance for identification of the degree of contamination present at any given site.

Supplementary Materials

The following supporting information can be downloaded at: https://www.mdpi.com/article/10.3390/app122211580/s1, File S1: 48 h image analysis (48 master); File S2: DTW function for use with other files (dtw); File S3: Histogram code for running qualitative analysis on Green Laser images only (GreenQualitative); File S4: Histogram code for running qualitative analysis on Both Laser images (Qualitative); File S5: Density Difference and DTW analysis for Both Laser images (Quantitative). Each File is provided in its original Matlab version (.m) and with code copied to Word (.docx) for viewing use.

Author Contributions

Conceptualization, K.T., H.D. and A.M.; methodology, K.T. and H.D.; software, K.T.; validation, K.T., H.D., W.K. and P.F.; formal analysis, K.T., H.D. and P.F.; investigation, K.T. and H.D.; resources, K.T., H.D. and A.M.; data curation, K.T.; writing—original draft preparation, K.T.; writing—review and editing, K.T., H.D., A.M., W.K. and P.F.; visualization, K.T., H.D. and P.F.; supervision, K.T.; project administration, K.T.; funding acquisition, H.D. and K.T. All authors have read and agreed to the published version of the manuscript.

Funding

This work was funded by the Consortium for Monitoring, Technology, and Verification under the Department of Energy National Nuclear Security Administration award number DE-NA0003920. A.M. acknowledges support from ONR and NASA. This is SOEST publication number 11595.

Institutional Review Board Statement

Not applicable.

Informed Consent Statement

Not applicable.

Data Availability Statement

The datasets and images analyzed for this study can be found in the following Google Drive folder: Quantifying Moss Response–Frontiers–Data Availability at https://drive.google.com/drive/folders/1IeRay6cpX2g5t3iIekbwIvHpFX3_16qB?usp=sharing (accessed on 12 August 2022).

Conflicts of Interest

The authors declare no conflict of interest.

Appendix A

Table A1. Density intersection difference results for all trial histograms delineated by color channel using day-0 control images specific to each trial. The table heading denotes the day of treatment that was compared to the day-0 control for each individual trial. The side of the table denotes trial number as detailed in Table 1. Here, the scaled values are presented as percentages of change in comparison to the control.
Trial12345678910Mean
Red15.804.005.803.105.405.905.205.009.105.505.50
212.8013.7016.5018.8021.0027.3033.1037.5039.8046.3026.70
312.4023.5034.5038.6040.1045.2046.3048.6052.8063.5040.60
416.2041.0048.9050.1056.3058.3061.0061.2068.2070.0053.10
Green16.404.604.802.705.005.605.205.3010.906.405.70
217.2017.5024.1027.4031.2035.5042.0045.1049.2055.9034.50
321.6029.5043.4045.8048.2050.9054.2055.7058.8068.5047.70
427.4047.4055.2056.7061.4062.6065.1065.0071.2072.5058.40
Blue15.903.604.402.904.203.705.004.408.105.604.80
213.7012.6019.8019.8024.3028.1033.4035.2042.7047.5027.70
318.6027.0037.3039.5040.9045.3050.2049.2053.5063.5042.50
422.7042.3050.0050.4056.3056.9059.7060.9066.6067.8053.40
Table A2. Dynamic time warping non-linear (elastic) alignment distance results for all trial histograms delineated by color channel using day-0 control images specific to each trial. The table heading denotes the day of treatment that was compared to the day-0 control for each individual trial. The side of the table denotes trial number as detailed in Table 1. Values are represented as percentage DTW difference relative to a 7 × 106-pixel maximum.
Trial12345678910Mean
Red10.150.605.200.520.881.020.740.733.530.651.53
211.518.9314.8616.8618.8624.4329.7133.7135.7141.5723.57
311.1921.1431.0034.7136.0040.5741.5743.7147.4357.1436.43
414.5736.8644.0045.0050.5752.4354.8655.0061.2963.0047.71
Green11.531.694.310.060.630.620.480.589.760.662.09
213.7111.0321.5724.5728.0032.0037.7140.5744.1450.2930.43
319.432.6639.004.1243.2945.7148.7150.0052.8661.5742.86
424.5742.5749.5751.0055.1456.2958.5758.4364.0065.1452.57
Blue11.103.243.912.633.794.804.493.917.270.823.16
212.3111.3317.7117.7121.8625.2930.0031.5738.4342.7124.86
316.7124.2933.5735.5736.8640.7145.1444.2948.0057.1438.14
420.4338.0045.0045.2950.5751.1453.7154.7159.8660.8648.00
Table A3. Distance time warping non-linear (elastic) alignment distance results for all trials’ red versus green plots using day-0 control images specific to each trial. Values are represented as percentage DTW difference relative to a 7 × 106-pixel maximum.
Day12345678910
Trial 13.873.547.362.272.944.613.633.948.593.94
Trial 220.8615.8628.1432.2936.2943.1451.2956.4361.0069.57
Trial 324.4336.5753.0057.2959.5765.0067.8670.0075.0088.14
Trial 431.2960.0070.0072.0078.7180.7183.8683.8692.0093.86

References

  1. Tremper, A.H.; Agneta, M.; Burton, S.; Higgs, D.E.B. Field and Laboratory Exposures of Two Moss Species to Low Level Metal Pollution. J. Atmos. Chem. 2004, 49, 111–120. [Google Scholar] [CrossRef]
  2. Lazo, P.; Kika, A.; Qarri, F.; Bekteshi, L.; Allajbeu, S.; Stafilov, T. Air Quality Assessment by Moss Biomonitoring and Trace Metals Atmospheric Deposition. Aerosol Air Qual. Res. 2022, 22, 220008. [Google Scholar] [CrossRef]
  3. Krzesłowska, M. The cell wall in plant cell response to trace metals: Polysaccharide remodeling and its role in defense strategy. Acta Physiol. Plant. 2011, 33, 35–51. [Google Scholar] [CrossRef] [Green Version]
  4. Carginale, V.; Sorbo, S.; Capasso, C.; Trinchella, F.; Cafiero, G.; Basile, A. Accumulation, localisation, and toxic effects of cadmium in the liverwort Lunularia cruciata. Protoplasma 2004, 223, 53–61. [Google Scholar] [CrossRef]
  5. Choudhury, S.; Panda, S.K. Toxic Effects, Oxidative Stress and Ultrastructural Changes in Moss Taxithelium Nepalense (Schwaegr.) Broth. under Chromium and Lead Phytotoxicity. Water Air Soil Pollut. 2005, 167, 73–90. [Google Scholar] [CrossRef]
  6. Schröder, W.; Nickel, S. Moss species-specific accumulation of atmospheric deposition? Environ. Sci. Eur. 2019, 31, 78. [Google Scholar] [CrossRef] [Green Version]
  7. Degola, F.; De Benedictis, M.; Petraglia, A.; Massimi, A.; Fattorini, L.; Sorbo, S.; Basile, A.; di Toppi, L.S. A Cd/Fe/Zn-Responsive Phytochelatin Synthase is Constitutively Present in the Ancient Liverwort Lunularia cruciata (L.) Dumort. Plant Cell Physiol. 2014, 55, 1884–1891. [Google Scholar] [CrossRef] [Green Version]
  8. Zvereva, E.L.; Kozlov, M.V.; Kozlov, M. Impacts of Industrial Polluters on Bryophytes: A Meta-analysis of Observational Studies. Water Air Soil Pollut. 2010, 218, 573–586. [Google Scholar] [CrossRef]
  9. Koz, B.; Cevik, U. Lead adsorption capacity of some moss species used for heavy metal analysis. Ecol. Indic. 2014, 36, 491–494. [Google Scholar] [CrossRef]
  10. Sun, S.-Q.; He, M.; Cao, T.; Zhang, Y.-C.; Han, W. Response mechanisms of antioxidants in bryophyte (Hypnum plumaeforme) under the stress of single or combined Pb and/or Ni. Environ. Monit. Assess. 2008, 149, 291–302. [Google Scholar] [CrossRef]
  11. Onianwa, P.C. Monitoring Atmospheric Metal Pollution: A Review of the Use of Mosses as Indicators. Environ. Monit. Assess. 2001, 71, 13–50. [Google Scholar] [CrossRef] [PubMed]
  12. Boquete, M.T.; Lang, I.; Weidinger, M.; Richards, C.L.; Alonso, C. Patterns and mechanisms of heavy metal accumulation and tolerance in two terrestrial moss species with contrasting habitat specialization. Environ. Exp. Bot. 2020, 182, 104336. [Google Scholar] [CrossRef]
  13. Reski, R. Development, Genetics and Molecular Biology of Mosses. Bot. Acta 1998, 111, 1–15. [Google Scholar] [CrossRef]
  14. Berg, T.; Røyset, O.; Steinnes, E.; Vadset, M. Atmospheric trace element deposition: Principal component analysis of ICP-MS data from moss samples. Environ. Pollut. 1995, 88, 67–77. [Google Scholar] [CrossRef]
  15. Chaligava, O.; Shetekauri, S.; Badawy, W.M.; Frontasyeva, M.V.; Zinicovscaia, I.; Shetekauri, T.; Kvlividze, A.; Vergel, K.; Yushin, N. Characterization of Trace Elements in Atmospheric Deposition Studied by Moss Biomonitoring in Georgia. Arch. Environ. Contam. Toxicol. 2020, 80, 350–367. [Google Scholar] [CrossRef] [PubMed]
  16. Stanković, J.D.; Sabovljević, A.D.; Sabovljević, M.S. Bryophytes and heavy metals: A review. Acta Bot. Croat. 2018, 77, 109–118. [Google Scholar] [CrossRef]
  17. Shakya, K.; Chettri, M.K.; Sawidis, T. Impact of Heavy Metals (Copper, Zinc, and Lead) on the Chlorophyll Content of Some Mosses. Arch. Environ. Contam. Toxicol. 2007, 54, 412–421. [Google Scholar] [CrossRef]
  18. Kinsey, J.L. Laser-Induced Fluorescence. Annu. Rev. Phys. Chem. 1977, 28, 349–372. [Google Scholar] [CrossRef]
  19. Maarek, J.-M.I.; Kim, S. Multispectral excitation of time-resolved fluorescence of biological compounds: Variation of fluorescence lifetime with excitation and emission wavelengths. Proc. SPIE 2001, 4252, 124–131. [Google Scholar] [CrossRef]
  20. Zare, R.N. My Life with LIF: A Personal Account of Developing Laser-Induced Fluorescence. Annu. Rev. Anal. Chem. 2012, 5, 1–14. [Google Scholar] [CrossRef]
  21. García-Sánchez, F.; Galvez-Sola, L.; Nicolás, J.J.M.; Muelas-Domingo, R.; Nieves, M. Using Near-Infrared Spectroscopy in Agricultural Systems. In Developments in Near-Infrared Spectroscopy; IntechOpen: London, UK, 2017. [Google Scholar] [CrossRef] [Green Version]
  22. Tan, J.Y.; Ker, P.J.; Lau, K.Y.; Hannan, M.A.; Tang, S.G.H. Applications of Photonics in Agriculture Sector: A Review. Molecules 2019, 24, 2025. [Google Scholar] [CrossRef] [PubMed] [Green Version]
  23. Amir, M.; Chen, J.; Chen, B.; Wang, S.; Zhu, K.; Li, Y.; Meng, Z.; Ma, L.; Wang, X.; Liu, Y.; et al. Reflectance and chlorophyll fluorescence-based retrieval of photosynthetic parameters improves the estimation of subtropical forest productivity. Ecol. Indic. 2021, 131, 108133. [Google Scholar] [CrossRef]
  24. Chappelle, E.W.; Wood, F.M.; McMurtrey, J.E.; Newcomb, W.W. Laser-induced fluorescence of green plants 1: A technique for the remote detection of plant stress and species differentiation. Appl. Opt. 1984, 23, 134–138. [Google Scholar] [CrossRef] [PubMed]
  25. Na Ayudhya, T.I.; Posey, F.T.; Tyus, J.C.; Dingra, N.N. Using a Microscale Approach to Rapidly Separate and Characterize Three Photosynthetic Pigment Species from Fern. J. Chem. Educ. 2015, 92, 920–923. [Google Scholar] [CrossRef]
  26. Misra, A.K.; Acosta-Maeda, T.E.; Sandford, M.; Gasda, P.J.; Porter, J.N.; Sharma, S.K.; Lucey, P.; Garmire, D.; Zhou, J.; Oyama, T.; et al. Standoff Biofinder: Powerful search for life instrument for planetary exploration. In Proceedings of the Lidar Remote Sensing for Environmental Monitoring XVI, Honolulu, HI, USA, 24–25 September 2018. [Google Scholar] [CrossRef]
  27. Krzesłowska, M.; Rabęda, I.; Lewandowski, M.; Samardakiewicz, S.; Basinska, A.; Napieralska, A.; Mellerowicz, E.J.; Wozny, A. Pb induces plant cell wall modifications—in particular—the increase of pectins able to bind metal ions level. E3S Web Conf. 2013, 1, 26008. [Google Scholar] [CrossRef]
  28. Staples, G.W.; Imada, C.T.; Hoe, W.J.; Smith, C.W. A revised checklist of Hawaiian mosses. Bryophyt. Divers. Evol. 2004, 25, 36–69. [Google Scholar] [CrossRef] [Green Version]
  29. Hu, R.; Yan, Y.; Zhou, X.; Wang, Y.; Fang, Y. Monitoring Heavy Metal Contents with Sphagnum Junghuhnianum Moss Bags in Relation to Traffic Volume in Wuxi, China. Int. J. Environ. Res. Public Health 2018, 15, 374. [Google Scholar] [CrossRef] [Green Version]
  30. González, A.; Pokrovsky, O. Metal adsorption on mosses: Toward a universal adsorption model. J. Colloid Interface Sci. 2014, 415, 169–178. [Google Scholar] [CrossRef]
  31. Maresca, V.; Bellini, E.; Landi, S.; Capasso, G.; Cianciullo, P.; Carraturo, F.; Pirintsos, S.; Sorbo, S.; di Toppi, L.S.; Esposito, S.; et al. Biological responses to heavy metal stress in the moss Leptodictyum riparium (Hedw.) Warnst. Ecotoxicol. Environ. Saf. 2021, 229, 113078. [Google Scholar] [CrossRef]
  32. Ryan, G.F. Controlling Mosses and Liverworts. Breeders Roundtable in Eugene, Oregon. Western Washington Research and Extension Center. 1977. Available online: https://scholar.lib.vt.edu/ejournals/JARS/v32n2/v32n2-ryan.htm (accessed on 15 July 2020).
  33. Brown, D.H.; Wells, J.M. Sequential elution technique for determining the cellular location of cations. In Methods in Bryology. Proceedings of the Bryological Methods; Glime, J.M., Ed.; Hattori Botanical Laboratory: Nichinan, Japan, 1988; pp. 227–233. [Google Scholar]
  34. Vázquez, M.; López, J.; Carballeira, A. Modification of the sequential elution technique for the extraction of heavy metals from bryophytes. Sci. Total Environ. 1999, 241, 53–62. [Google Scholar] [CrossRef]
  35. Pérez-Llamazares, A.; Galbán-Malagón, C.J.; Aboal, J.R.; Fernández, J.; Carballeira, A. Evaluation of cations and chelating agents as extracellular extractants for Cu, Pb, V and Zn in the sequential elution technique applied to the terrestrial moss Pseudoscleropodium purum. Ecotoxicol. Environ. Saf. 2010, 73, 507–514. [Google Scholar] [CrossRef] [PubMed]
  36. Swain, M.J.; Ballard, D.H. Indexing via Color Histograms. In Active Perception and Robot Vision; Springer: Berlin/Heidelberg, Germany, 1992; pp. 261–273. [Google Scholar] [CrossRef]
  37. Jekel, C.F.; Venter, G.; Venter, M.P.; Stander, N.; Haftka, R.T. Similarity measures for identifying material parameters from hysteresis loops using inverse analysis. Int. J. Mater. Form. 2018, 12, 355–378. [Google Scholar] [CrossRef]
  38. Reinfelder, J.R.; Totten, L.A.; Eisenreich, S.J.; Aucott, M. Research Project Summary. New Jersey Atmospheric Deposition Network (April, 2005). Available online: https://www.nj.gov/dep/dsr/nutrients/NJ%20Atmospheric%20Deposition%20Network_RPS.pdf (accessed on 5 August 2021).
  39. Conko, K.M.; Rice, K.C.; Kennedy, M.M. Atmospheric wet deposition of trace elements to a suburban environment, Reston, Virginia, USA. Atmos. Environ. 2004, 38, 4025–4033. [Google Scholar] [CrossRef]
  40. Colman, J.A.; Rice, K.C.; Willoughby, T.C. Methodology and Significance of Studies of Atmospheric Deposition in Highway Runoff; Open-File Report 01-259; US Geological Survey: Northborough, MA, USA, 2001. Available online: https://pubs.usgs.gov/of/2001/ofr01-259/pdf/ofr01259.pdf (accessed on 5 August 2021).
  41. Pan, Y.P.; Wang, Y.S. Atmospheric wet and dry deposition of trace elements at 10 sites in Northern China. Atmos. Chem. Phys. 2015, 15, 951–972. [Google Scholar] [CrossRef] [Green Version]
  42. Chen, Y.; Yuan, S.; Su, Y.; Wang, L. Comparison of heavy metal accumulation capacity of some indigenous mosses in Southwest China cities: A case study in Chengdu city. Plant Soil Environ. 2010, 56, 60–66. [Google Scholar] [CrossRef] [Green Version]
  43. Figueira, R.; Sérgio, C.; Sousa, A. Distribution of trace metals in moss biomonitors and assessment of contamination sources in Portugal. Environ. Pollut. 2002, 118, 153–163. [Google Scholar] [CrossRef]
  44. Jovan, S.E.; Zuidema, C.; Derrien, M.M.; Bidwell, A.L.; Brinkley, W.; Smith, R.J.; Blahna, D.; Barnhill, R.; Gould, L.; Rodríguez, A.J.; et al. Heavy metals in moss guide environmental justice investigation: A case study using community science in Seattle, WA, USA. Ecosphere 2022, 13, e4109. [Google Scholar] [CrossRef]
  45. Gatziolis, D.; Jovan, S.; Donovan, G.; Amacher, M.; Monleon, V. Elemental Atmospheric Pollution Assessment via Moss-Based Measurements in Portland, Oregon; Gen. Tech. Rep. PNW-GTR-938; U.S. Department of Agriculture, Forest Service, Pacific Northwest Research Station: Portland, OR, USA, 2016. Available online: https://www.fs.usda.gov/treesearch/pubs/51076 (accessed on 5 August 2021).
  46. Ataabadi, M.; Najafi, P. Biomonitoring of Airborne Heavy Metal Contamination. In Air Pollution. Monitoring, Modelling, Health and Control; Mukesh Khare, M., Ed.; Intechopen: London, UK, 2012; Available online: https://www.intechopen.com/books/air-pollution-monitoring-modelling-health-and-control/biomonitoring-of-airborne-heavy-metal-contamination (accessed on 5 August 2021).
  47. Ćujić, M.; Dragović, S.; Sabovljević, M.; Slavković-Beškoski, L.; Kilibarda, M.; Savović, J.; Onjia, A. Use of Mosses as Biomonitors of Major, Minor and Trace Element Deposition Around the Largest Thermal Power Plant in Serbia. CLEAN–Soil Air Water 2013, 42, 5–11. [Google Scholar] [CrossRef]
  48. Koz, B.; Cevik, U.; Akbulut, S. Heavy metal analysis around Murgul (Artvin) copper mining area of Turkey using moss and soil. Ecol. Indic. 2012, 20, 17–23. [Google Scholar] [CrossRef]
  49. Wahsha, M.; Bini, C.; Fontana, S.; Wahsha, A.; Zilioli, D. Toxicity assessment of contaminated soils from a mining area in Northeast Italy by using lipid peroxidation assay. J. Geochem. Explor. 2012, 113, 112–117. [Google Scholar] [CrossRef]
  50. Chen, Y.-E.; Wu, N.; Zhang, Z.-W.; Yuan, M.; Yuan, S. Perspective of Monitoring Heavy Metals by Moss Visible Chlorophyll Fluorescence Parameters. Front. Plant Sci. 2019, 10, 35. [Google Scholar] [CrossRef] [PubMed]
Figure 1. The figure shows example images of a control sample (A) and a Cu-treated sample (B) at 48 h after the first dose for visual comparison under natural light (A1,B1), both lasers (A2,B2), the 532 nm green laser (A3,B3), and the 355 nm UV laser (A4,B4).
Applsci 12 11580 g001
Figure 2. Density histogram profiles from pixel counts are provided for trial 4 day 0 in the red channel (A) and trial 4 day 10 in the red channel (B). (C) shows (A,B) plotted together, and the blue shaded area represents the area between both curves that does not overlap, i.e., is different. (D) is a representation of the Dynamic Time Warping (DTW) method applied to the same two curves in (A,B). The red squares represent the minimum distance between any two points when comparing the best fit of the two curves. The minimum distance at every point along the curves is then summed to create a single distance difference value representing the best fit between the two curves, or the amount of change necessary to make them as similar as possible.
Applsci 12 11580 g002
Figure 3. Comparison of the cumulative Cu dose (μmol/cm2) applied throughout the experiment to moss masses against the Cu content found in moss fronds (μmol/g dry wt). Error bars represent 1 standard deviation of the average of 3 frond pairs; these are only available for samples collected on days 1, 3, and 10 and provide a measure of scatter of Cu application within the mass moss. For samples where an error bar is absent, a horizontal line may be visible (trial 2) in the center of the marker.
Applsci 12 11580 g003
Figure 4. Color histogram: number of pixels corresponding to each red, green, and blue level of intensity scaled by the total number of pixels. Top row shows images at 5 gain levels collected from the day-0 control sample using both lasers. The bottom row shows the corresponding density histogram profiles of each RGB decimal code value found in each pixel of the images. Here, (255, 0, 0) is the decimal code for red, (0, 255, 0) is the decimal code for green, and (0, 0, 255) is the decimal code for blue. Code (0, 0, 0) would be absolute black and (255, 255, 255) absolute white.
Applsci 12 11580 g004
Figure 5. (A) Plot of intersection density difference over time in hours (A) and by dosage (B) for each trial over the first 48 h. Blue arrows indicate dosing on day 1 and day 2 of the experiment. For the control trial 1, these doses were both 30 mL of DI water. For all other treated trials, the day 1 dose was a Cu and DI solution at 30 mL. The day 2 dose was just 30 mL of DI.
Applsci 12 11580 g005
Figure 6. Histograms of RGB colors from moss LIF images taken using the green and UV lasers together, separated by trials matching Cu doses indicated in Table 1.
Applsci 12 11580 g006
Figure 7. The red channel of images collected with the CMOS camera after LIF with Biofinder. The resolution of the images was reduced to 10% of their original size for easier analysis (150 × 200 pixels). Yellow colors represent the highest decimal codes while black represents the lowest.
Applsci 12 11580 g007
Figure 8. Stacked red versus green color plots (both lasers) using color channels generated from initial images and their histogram profiles (Figure 4). From darkest to lightest: dashed black is trial 1 (control), light gray is trial 2, medium gray is trial 3, and dark gray is trial 4. Profiles were plotted for each day to compare each trial’s potential separation from the control.
Applsci 12 11580 g008
Figure 9. Intersection analysis with curve differences for R, G, and B (AC) on top and the minimum cumulative difference in distance of R, G, and B curves between day-0 and consecutive day images as determined using DTW vs. time (DF) on the bottom. The control (dashed line) remained within a narrow range, while treated trials continued to show a larger difference with increasing Cu doses delivered over time (Table 1).
Applsci 12 11580 g009
Figure 10. Red color histogram differences (A), DTW (B), and red versus green DTW (C) for each trial on each day of the experiment relative to their day-0 control plotted against the cumulative Cu dose. The 2 σ (dashed line) and 3 σ (dotted line) confidence intervals are shown for the mean of trial 1. (DF) show a curve fitting through all data points corresponding to dose (AC). As seen in (DF), the root mean squared errors with 95% confidence were 0.0464, 0.0406, and 0.06059, respectively.
Applsci 12 11580 g010
Table 1. Experimental doses of metal added each day (μmol Cu per cm2), with cumulative concentrations of Cu reached by that day of the experiment provided in parentheses.
Individual and Cumulative Cu Dose in μmol/cm2
Day12345678910
Trial 10 (0)0 (0)0 (0)0 (0)0 (0)0 (0)0 (0)0 (0)0 (0)0 (0)
Trial 20.538 (0.538)0 (0.538)0.538 (1.076)0 (1.076)0.538 (1.614)0 (1.614)0.538 (2.152)0 (2.152)0.538 (2.690)0 (2.690)
Trial 31.077 (1.077)0 (1.077)1.077 (2.154)0 (2.154)1.077 (3.231)0 (3.231)1.077 (4.308)0 (4.308)1.077 (5.385)0 (5.385)
Trial 41.615 (1.615)0 (1.615)1.615 (3.230)0 (3.230)1.615 (4.845)0 (4.845)1.615 (6.46)0 (6.460)1.615 (8.075)0 (8.075)
Table 2. Cu measured in moss fronds μmol/g dry wt. based on 3 frond pairs sampled after each treatment for each day in the experiment. Days 1, 3, and 10 show Cu averages with standard deviation for all 3 frond pairs per trial. The other days only have 1 frond pair that was analyzed so no standard deviation. Trial 1 only has data available for 1 frond pair on days 1, 5, and 10.
Frond Cu Average and Standard Deviation in Μmol/G Dry Weight
Day12345678910
Trial 10.24---0.32----0.62
Trial 220.67 ± 10.424.9523.98 ± 19.835.0762.6137.12197.7389.69128.7781.42 ± 15.5
Trial 347.79 ± 12.827.3676.69 ± 30.443.7867.7184.0882.8269.30110.08100.92 ± 39.9
Trial 470.46 ± 13.561.99169.78 ± 13.9170.45339.11122.05211.35371.17301.30359.62 ± 90.9
Publisher’s Note: MDPI stays neutral with regard to jurisdictional claims in published maps and institutional affiliations.