Featured Application
Resource and environmental effects of the Tibetan Plateau.
Abstract
Well water levels can reflect the stress placed on a confined subsurface aquifer system in a similar manner to a strain meter. Based on observations of the geophysical field in Lhasa combined with digital data recorded at an underground fluid well at the Lhasa geomagnetic station in recent years, we comprehensively analyzed the characteristics of co-seismic changes caused by 14 different-magnitude M ≥ 5 earthquakes recorded in the well. The results show that (1) the co-seismic changes in water temperature and water level are different; the water level exhibits oscillation-type changes, while the water temperature variations indicate first heating and subsequent recovery. (2) The co-seismic changes are related to the epicentral distance, magnitude and focal depth of the earthquake. The closer the epicenter is to the well, the earlier the co-seismic responses occur, but the time interval between the co-seismic changes in the water level and temperature differs. (3) The co-seismic ratio of the water temperature is higher than that of the water level; this may be related to faulty water level instrumentation or segmented records.
1. Introduction
The changes in groundwater levels due to earthquakes may occur not only in the areas surrounding the epicentral zone but also in some distant wells (e.g., [1,2]). The mechanism is probably attributable to the fact that when a confined well aquifer system is subjected to a wave force, a dynamic change occurs in the level of underground fluid (e.g., [3]). Other hydrological responses caused by earthquakes have also been noticed by many researchers, such as the groundwater temperature and chemical composition [4,5,6]. The relationship between seismic events and various hydrological responses is complex. Previous studies suggested that the co-seismic response of underground fluid is usually affected by earthquake characteristics, formation-medium properties, the tectonic environment where the well is located, and hydrogeological conditions and is thus a comprehensive reflection of multiple influencing factors (e.g., [7,8,9,10]). It is noteworthy that measuring the well water level and related well water temperature is an effective way to reveal the response of the crustal medium to the stress‒strain process and can reflect the variation characteristics of underground-medium strain and pore pressure under dynamic crustal action (e.g., [11,12,13,14,15]). Many studies have investigated the relationship between earthquake magnitude, co-seismic changes in water levels and water temperature and have provided mechanism explanations (e.g., [11,14,15]). Roeloffs et al. [16] proposed that the variation amplitude of the water level increases with earthquake magnitude and decreases with earthquake source distance. Shi et al. [17] suggested that the amplitude of water level oscillation can change the water temperature. This means that water level and water temperature changes caused by the same earthquake are strongly correlated. Chen et al. [18] claimed that the co-seismic responses of water level and water temperature for large earthquakes in the far field have similar trends.
In China, the study of co-seismic changes in water temperature and water level have emerged as a new tool that can provide an improved understanding of earthquake processes (e.g., [19,20]). However, the study of the co-seismic response of fluids in the Tibetan Plateau is still a gap where tectonic complexes are quite unique due to the collision between the Indian and Eurasian plates [21]. The uplift of the mountains and thickened crusts after the collision significantly influenced the properties of the Tibetan lithosphere [22]. Therefore, it is important to investigate the co-seismic response of well fluids in this region. We can also explore the response abilities and characteristics of borehole aquifer systems to underground stresses and strains by studying the co-seismic response to further understand the dynamic processes associated with underground media, which is of great significance in earthquake disaster risk reduction (e.g., [23,24,25]). On the other hand, the co-seismic response of fluids was demonstrated to be a useful earthquake precursor for predicting earthquakes (e.g., [26,27]). The co-seismic response of fluids can also be used as an indicator to assess the environmental effects caused by earthquakes [28,29]. Nevertheless, such application requires long-term and better-recorded data sets. Due to instrumental and data limits in the Tibetan Plateau, these aspects could not be investigated previously. These works will be performed when the observation network in Tibet is greatly densified and enhanced in the future.
The underground fluid observation well considered in this study is located in the Lhasa geomagnetic observatory (Figure 1). The Lhasa geomagnetic platform (91.0° E, 29.6° N) is located in a region consisting of quaternary sand gravels composing river valley alluvial plains, and the platform foundation comprises gravel alluvium with a thickness of approximately 70 m and an elevation of approximately 3633 m. In addition to underground fluid measurements, the Lhasa geomagnetic station also takes geomagnetism, geoelectric field and auxiliary direction-finding meteorologic measurements. The station is adjacent to the Lhasa River in the south, the Lhasa super railway bridge in the southwest, a highway in the west, and a plastic vegetable shed of the Tibet Agricultural Science and Technology Park in the north (Figure 1).
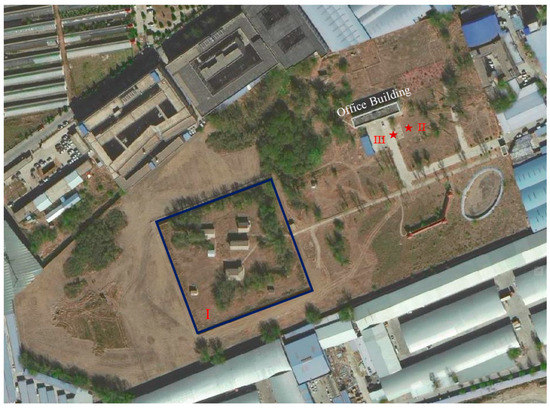
Figure 1.
Satellite view of the fluid observation well considered herein and the local facility layout. I, geomagnetic observation area; II (right red star), observation wells; III (left red star), WYY-1 comprehensive temperature, pressure, and rainfall meters.
2. Data Selection and Methods
In this study, we primarily used various instruments to observe the geophysical field in Tibet and analyzed the responses of the water temperature and water level to large earthquakes in combination with digital data observed since 2007. Figure 2 and Table 1 show the arrangement of instruments and the distribution of measurement items related to fixed-point deformation, fluids and electromagnetics. The time intervals of sampling are at the order of one minute.
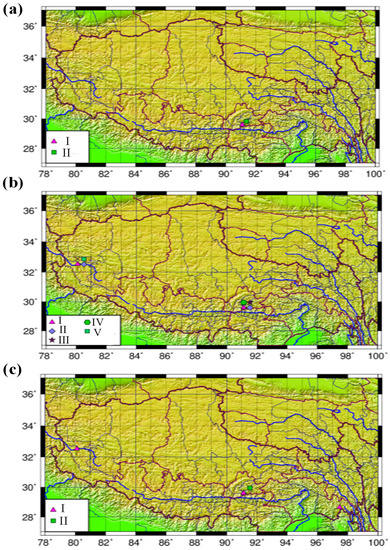
Figure 2.
(a) Distribution of fluid measurement items in Tibet. I, water temperature; II, water level. (b) Distribution map of deformation measurement items: I, gravity; II, Vp; III, horizontal pendulum × vertical pendulum; IV, volumetric strain; and V, water meter. (c) Distribution map of electromagnetic measurement items: I, geomagnetism; II, geoelectricity.

Table 1.
Statistical table of stations/instruments composing the Tibetan Regional Seismic and Geophysical Network.
In July 2006, we completed the construction of the underground fluid observation well considered herein. The well is approximately 110 m deep, the opening hole diameter is 220 mm, the final hole diameter is 220 mm, the well tube is 165 mm, and the inner diameter is 150 mm. The final well (hole depth) is 111.2 m, and the length of the filter tube is 22.56 m. The length of the ground cable from the observation well to the observation room is approximately 26.5 m. The Lhasa River is approximately 500 m to the south of the observation well. The power supply of the instrument is basically stable. The lithology consists of sands and gravels. The underground fluid instruments installed at the Lhasa geomagnetic station include an LN-3A static water level meter, an SZW-1A water temperature meter, and a WYY-1 comprehensive temperature, pressure, and rainfall meter (SL-3 type tensor) auxiliary observations. The probes of the static water level meter and the surface water temperature meter are set up in the same observation well. The data are collected in the observation room. The temperature probe and the rainfall bucket of the meteorological three-element meter are set up in the station yard. The boundaries around this temperature probe and rainfall bucket are open, and there are no tall buildings nearby. The distance between the temperature probe/rainfall bucket and the observation room is approximately 15 m (Figure 3a). The co-seismic observation of the well covers the major M > 7 earthquakes in the last two decades in the periphery (Figure 3b).
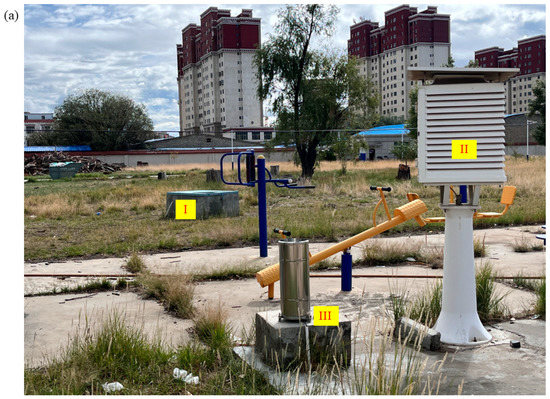
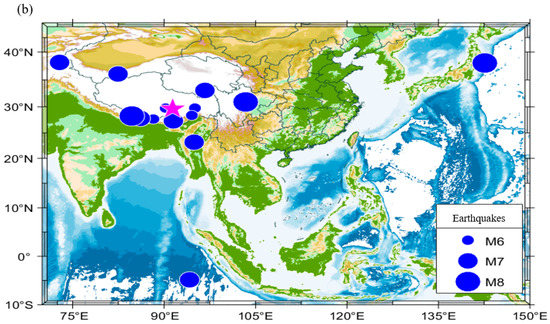
Figure 3.
Observation wells and auxiliary direction-finding meteorological instruments. (a) I, observation wells; II and III, WYY-1 comprehensive temperature, pressure, and rainfall (SL-3 type tensor) auxiliary observations. (b) Observation well locations and earthquake distribution in the last two decades. The pink star indicates the observation well system of this study.
The measurements at the Lhasa station include state-of-the-art instruments in China, such as the LN-3A meter (for static water level observation), SZW-1A meter (for water temperature observation), and SL-3 type tensor (for rainfall observation) in the WYY-1 system.
The LN-3A digital water level sensor’s main technical indicators include a water level range of 0–10 m and an error range for a water level of less than 1 mm, which implies that the measurement accuracy is ±0.2% at full scale, and the measurement repeatability is ±0.1% at full scale. The overall measurement stability is ±0.2% full scale per year, while the dynamic response speed is 1 m/s. The operating temperature ranges from 0 °C to 40 °C for the LN-3A water level meter. The analog measurement resolution is a decimal of 4½ bits, and the sampling rate (least count) is 1 time per minute for normal events and 1 per second for events.
The SZW-1A water temperature meter measurement resolution (error range) is <0.0001 °C, with a short-term drift of less than 0.0001 °C per day and a long-term drift of less than 0.01 °C per year. The absolute accuracy is ±0.05 °C (given the calibration certificate one by one, 0 °C–100 °C range, one calibration point every 5 °C). The dynamic range is 0–70 °C. The sampling rate (least count) was once per minute (high-extraction data five times per minute).
The SL-3-type rainfall tensor indicators involve a conversion grid value of 0.1 mm rainfall per mV and a rainfall intensity error range of <4 mm per minute, which indicates that for precipitation < 10 mm, the error range is ±0.4 mm, while for precipitation > 10 mm, the resolution is ±4 mm.
3. Results
3.1. Variation in the Water Temperature and Water Level of the Observation Well at Lhasa Station
The warming of the plateau climate during the decade 2009 to 2019 caused the well water temperature to increase by approximately 0.03 °C per year. In addition, equipment and human activities had an impact on the change in temperature trend, including the water temperature probe data line immersed in water for a long time, resulting in a slow increase in temperature due to the slow downward movement of the probe. Due to the arrival of the rainy season and the role of rainfall supply, the water level was maximized each year from June to August and then began to slowly drop (Figure 4). The annual water temperature change pattern undulated and rose without obvious seasonal changes (Figure 5). Regarding the water level, the tidal characteristics were prominent, and the solid-tide phenomenon was obvious. The probe can record both the water level and tide conditions. The change directions of the water temperature and water level differ and were often negatively correlated. When the water level drops, the water temperature usually rises; when the water level rises, the water temperature often drops. However, compared to the recorded water level changes, the water temperature is relatively constant [30,31,32].
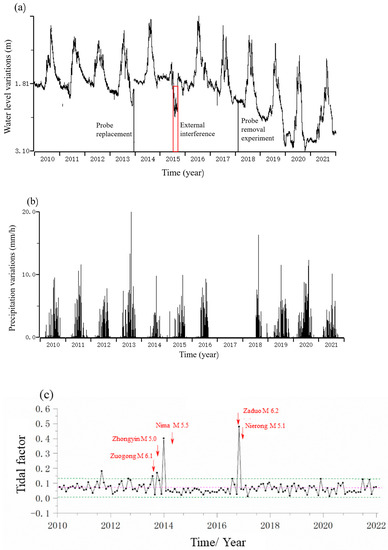
Figure 4.
Annual dynamic characteristics of the water level, obtained via a modification of the method by Gesang et al. [30]. (a) Water level variation (unit: m). Red frame indicates the external interference. (b) Precipitation variation every 10 days (unit: mm/h). (c) Tidal factors from 2012 to 2022.
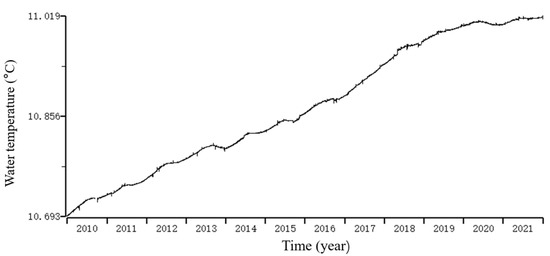
Figure 5.
Annual dynamic characteristics of water temperature (unit: °C) over the period from 2010 to 2021.
3.2. Co-Seismic Response of Underground Fluid Observation Wells at Lhasa Station
In the digital water temperature and water level series measured at the fluid well at the Lhasa geomagnetic station, 15 co-seismic (or postearthquake) responses were recorded, of which the water level series recorded 10 responses (Table 2). The statistical results show that the response ratio of the digitized water temperature to the same earthquake (postseismic) was higher than that of the digitized water level; this difference may be related to faulty water level instrumentation or to the segmented record [13]. However, no water level data were recorded alongside the water temperature data following two earthquakes in Tibet. From the perspective of time, this lack of data may have been related to the probe. Both earthquakes were co-seismic events that occurred after the probe was replaced in 2016 (an earthquake of magnitude 6.9 occurred in Minlin County, Linzhi, Tibet on 18 November 2017, and an earthquake of magnitude 6.3 occurred in Metok in 2019).

Table 2.
Statistical table of the responses of the digitized water level and water temperature to large earthquakes in the Lhasa geomagnetic platform well.
3.2.1. Co-Seismic Response Characteristics of Water Level and Water Temperature
The water level co-seismic response refers to the “resonance” phenomenon of the water level when a seismic wave propagates outward after a strong earthquake. When the seismic wave passes through the measurement site, it causes instantaneous deformation of the aquifer, thus stimulating a change in pore pressure and preventing the pore water from having enough time to be exchanged with the outside world. Therefore, the deformation of an aquifer caused by a seismic wave can be considered to represent an approximately undrained aquifer. In open well-aquifer systems, the exchange of water between the aquifer and well is strongly related to the permeability coefficient of the aquifer. When a seismic wave passes through, the larger this permeability coefficient is, the greater the amplitude of water level oscillation is, and the more obvious the resulting seismic reflection effect is [18,25,33]. In addition, the well diameter, the water column height and the frequency characteristics of the water level meter are all related to the recorded water seismic waves. The effect of the groundwater level during and after an earthquake can be divided into two types: a rapid step change, mainly characterized by the well water level effect of a nearby earthquake, while the other type, an oscillation change of the water level, is the result from the effect of a water shock wave; this effect is generally common in wells with epicentral distances greater than 2000 km [18,25,33].
Seismic waves can cause certain deformations of the medium in a well-aquifer system and cause corresponding changes in the water transport channel flowing through the aquifer. These changes affect the flow speed and path of groundwater; in addition, they affect the heat exchange between groundwater and the surrounding rock mass, thus affecting the temperature change in the water body in the observation well [34,35].
3.2.2. Case Analyses of Earthquakes with Different Magnitudes
We selected five earthquakes with different magnitudes from the 15 earthquakes recorded in the study area for a case study analysis (Figure 6 and Table 2).
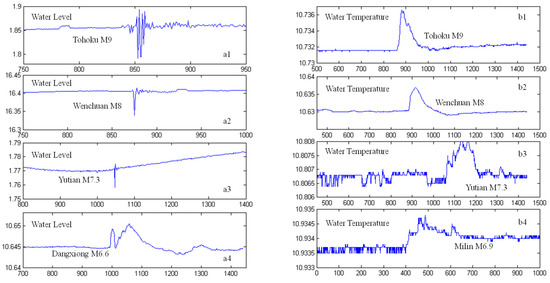
Figure 6.
Co-seismic response curves of the digital water level (unit: m) and water temperature (°C) series at the Lhasa geomagnetic station: (a1) water level response to the 2011 M9 Tohoku earthquake; (a2) water level response to the 2008 M8 Wenchuan earthquake; (a3) water level response to the 2014 Yutian M7.3 earthquake; (a4) water level response to the 2008 Dangxiong M6.6 earthquake; (b1) water temperature response to the 2011 M9 Tohoku earthquake; (b2) water temperature response to the 2008 M8 Wenchuan earthquake; (b3) water temperature response to the 2014 Yutian M7.3 earthquake; (b4) water temperature response to the 2017 Milin M6.9 earthquake.
(1) M9.0 earthquake in Japan [36,37,38]. On 11 March 2011, an M9.0 earthquake occurred in Japan, approximately 4790 km away from the Lhasa geomagnetic station. The water level and water temperature of the observation well exhibited obvious co-seismic responses to this earthquake. The water level oscillated (hydroximic wave), and the double amplitude of the water level reached 0.101 m before slowly dropping after the earthquake (Figure 6(a1)). Figure 6(a1) shows that the sudden convex jump that occurred approximately one hour before and after the earthquake had nothing to do with the earthquake. From 27 July to 23 November 2009, the record was broken, and this phenomenon continued since work was resumed on the 24th. At the same time, the water temperature of the well experienced a rapid co-seismic (postearthquake) rise for 21 min and then dropped back to the pre-earthquake level after 2 h and 10 min. The maximum range of the well water temperature was 0.0056 °C (Figure 6(b1)).
(2) M8.0 earthquake in Wenchuan [39,40,41,42,43,44]. On 12 May 2008, an M8.0 earthquake occurred in Wenchuan County, Sichuan Province. The earthquake was approximately 1200 km away from the well at the Lhasa geomagnetic station. The water temperature and water level series recorded at the observation well exhibited obvious responses to this earthquake. The water level exhibited a water shock wave (shock), but no obvious change occurred subsequently. The maximum single amplitude was 0.075 m (Figure 6(a2)). At the same time, the water temperature series also recorded that the co-seismic temperature (postearthquake) first increased by 0.0066 °C and then decreased to 0.0079 °C (Figure 6(b2)).
(3) M7.3 earthquake in Yutian, Xinjiang [45]. On 12 February 2014, an M7.3 earthquake occurred in Yutian, Xinjiang, approximately 1070 km from the Lhasa well. The response of the well water level to this earthquake was obvious. The water level exhibited a water shock wave and slowly rose following the earthquake, with a maximum amplitude of 0.17 m. In contrast to the other earthquake trains, small convex steps appeared approximately 7 h and 2 min before the earthquake. Whether an abnormality was recorded before the earthquake needs to be analyzed in-depth (Figure 6(a3)). At the same time, the water temperature recorded at our well exhibited a co-seismic (postearthquake) response, first slowly rising and then slowly falling, with a maximum amplitude of 0.002 °C (Figure 6(b3)).
(4) M6.6 earthquake in Dangxiong, Tibet. On 6 October 2008, an M6.6 earthquake occurred in Dangxiong, Tibet. This earthquake occurred 72.9 km away from the Lhasa well. Although the water level instrumentation was damaged and failed to record any co-seismic data, the water temperature at our station exhibited an obvious co-seismic effect. After 9 min comprising a rapid rise of 0.0043 °C, the water temperature rapidly dropped back to 0.0044 °C and then increased by 0.0057 °C over 46 min before returning to 0.0072 °C, slowly increasing to 0.0176 °C, and then slowly recovering to the pre-earthquake level after 7 days.
(5) M6.9 earthquake in Milin, Tibet [46,47]. On 18 November 2017, an M6.9 earthquake occurred in Milin County, Linzhi, Tibet. This earthquake was approximately 385 km away from the Lhasa well. The water level series of the Lhasa well did not record any co-seismic event (nor was any event recorded following the Motuo M6.3 earthquake in 2019), and the water temperature of the well failed to return to the pre-earthquake level after rising 0.0013 °C, which was 0.0008 °C higher than the pre-earthquake water temperature.
4. Discussion
4.1. Co-Seismic Responses of the Water Temperature and Water Level to Large Earthquakes
In this paper, we carried out an analysis of two M8.0 earthquakes for which co-seismic responses were recorded (Figure 7), which indicates the seismic wave travel time from the moment of seismogenesis to the moment of sudden energy change. Since the attenuation of seismic waves is more obvious due to the thick crust (>60 km) unique to the Tibetan Plateau, the corresponding co-seismic effects of water level and water temperature tend to be more obvious for large and deep earthquakes.
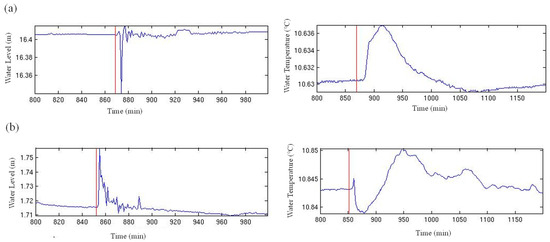
Figure 7.
Response to occurrence (red line) of large earthquakes. (a) The M8.0 Wenchuan great earthquake on 12 May 2008. (b) M8.1 earthquake that occurred in Nepal on April 25th, 2015.
The epicenter of the Wenchuan M8.0 earthquake that occurred on 12 May 2008, was 1189 km away from the observation well, and the source depth was 14 km. Through calculation, we found that the shock wave propagated westward and that the water temperature continued to heat up from 40 min to 920 min post-earthquake. On 25 April 2015, an M8.1 earthquake occurred in Nepal. The epicenter of this earthquake was 648 km away from the observation well, and the source depth was 20 km. Due to the close distance, the water temperature rapidly decreased in the early stage and then quickly returned to the pre-earthquake value.
We further involved a comparison of the Lhasa station data set with the 400 wells in the China groundwater monitoring network (China Earthquake Network Center, Beijing, China) (e.g., [48]) for their different co-seismic responses in the water level (rise > 1 m, drop > 1 m, or oscillation) to the 2008 M8.0 Wenchuan earthquake (Figure S1). We noticed that the Lhasa station water level during the 2008 Wenchuan earthquake ranged from 16.35 m to 16.42 m, with an amplitude of approximately 0.07 m, while most of the adjacent wells in the China groundwater monitoring network exhibited a co-seismic rise (or drop) of as large as >1 m [48]. Wells in Northeast China even showed the largest amplitude of water-level oscillations (as large as 1.1 m at an epicenter distance of 1400 km) despite the large well-epicenter distance [48]. Although the Lhasa well is closer (1189 km) to the epicenter, the water level oscillation is nearly ten times smaller than that of the well in Northeast China. This is likely due to the larger attenuation of seismic waves in the thick crust (>60 km) unique to the Tibetan Plateau. It is also noteworthy that 2015 M8.1 Nepal earthquake results in a similar small-scale water level oscillation with the largest amplitude of 0.045 m, despite a well-epicenter distance of merely 648 km. In particular, corresponding to the 2011 M9 Tohoku earthquake, the co-seismic water level varied from 1.79 m to 1.89 m (in Figure 6(a1)), which implied that the far-field giant earthquake caused an amplitude of only 0.1 m in the water level of the Lhasa well, comparable to the oscillation amplitude caused by adjacent M8 earthquakes.
As the only fluid monitoring well above high-altitude (>3000 m) in China, it is evident that the groundwater temperature response is significantly correlated with water level changes, especially the co-seismic response to large earthquakes [44]. Previous studies have concluded that the amplitudes of changes in water level and temperature are related to the earthquake magnitude and the distance from the epicenter [49].
Earthquakes with larger magnitudes tend to cause a rise or drop with greater amplitude, while earthquakes further from the epicenter tend to cause oscillations of smaller amplitude. The plateau fluid wells in the Tibetan region recorded the water temperature change of the Wenchuan earthquake as rising by 0.0065 °C and then dropping to 0.0079 °C, while the water temperature change after the Nepal earthquake was a rapid drop followed by a rapid rise finally oscillating to normal values (Figure 7a,b). This result suggests that closer and larger magnitude earthquakes trigger greater water temperature changes, e.g., the M8.1 Nepal earthquake (0.0072 °C) and the M8.0 Wenchuan earthquake (0.0065 °C). Chen et al. [18] asserted that changes in water level and temperature were caused by gas heat dissipation, and Yang et al. [50] demonstrated that convection in a well would accelerate with the arrival of seismic waves at the aquifer, resulting in the ascent of warmer water at the bottom of the well. These different mechanisms would result in a co-seismic change in temperature. Based on the fact that the eastern part of the Tibetan Plateau has a strong heat flow background, the groundwater is heated by the heat source and then circulates along the fault to the surface, which eventually causes the observed water temperature changes [51,52]. The spectral peak splitting of 12 and 24 h tidal harmonics can sometimes lead to variations in groundwater levels (e.g., Figure 4c and Figure 6(a3)), as well as seasonal rainfall and drought on a monthly timescale [53,54].
4.2. Characteristics of the Water Temperature and Water Level Variation and Their Correlation
We collected and sorted all co-seismic data recorded by two sets of underground fluid instruments since the establishment of the station and compared and analyzed the observation data recorded following earthquakes of different magnitudes and of the same magnitudes. We concluded the following characteristics of the co-seismic responses of the water level and water temperature at Lhasa station. (1) The post-seismic response of the water level oscillation shows that the water level rise is greater than the water level fall depending on the intensity of the water level oscillation. Although the water level oscillation can take tens of minutes or even hundreds of minutes, once this oscillation stops, the water level returns to the pre-earthquake level, and the decline is not large. (2) Regarding the co-seismic water temperature response, a continuous step rise in water temperature spans several hours following an earthquake before returning to the preearthquake value. However, this change depends on the distance of the measurement site from the epicenter of the earthquake. The recovery time following this change is faster if the distance is shorter and slower if the distance is longer. (3) The magnitude and focal depth of an earthquake are closely related to the oscillation amplitudes of the water level and water temperature. If the magnitude is large and the earthquake depth is shallow, the oscillation amplitude of the water level will be relatively large. In view of this increased amplitude, the water temperature will also increase faster; that is, the larger the oscillation amplitude of the water level is, the higher the increase in water temperature will be. (4) In 2017, after the water level probe was damaged by a lightning strike and replaced, the water level recorded by the water temperature was not the same as that recorded in the well.
The co-seismic change behavior of water temperature is closely related to the change in the water level. Previous studies suggested that the co-seismic change in the water level is the necessary condition for a co-seismic change in the water temperature (e.g., [55]). Water level co-seismic changes occur in all cases alongside water temperature co-seismic changes [56,57,58,59,60]. However, water level co-seismic changes do not necessitate water temperature co-seismic changes [61]. The data from the Lhasa station show that the water temperature but not the water level can record some cases of co-seismic changes (e.g., the M6.9 earthquake that occurred in Milin, Tibet on 18 November 2017, and the M6.3 earthquake that occurred in Metok in 2019) [62,63]. Judging from the timing of these events, this result may have been related to issues with the probe. All of these instances occurred after the probe was replaced in 2016, but other possibilities are not excluded, and this issue needs to be further studied.
4.3. Analyses of Geophysical Field Anomalies
The annual normal dynamics of the water temperature and water level observation data at the Lhasa station reveal that rainfall has a great impact on the water level. The annual peak well water level is closely related to the seasonal rainfall. Basically, the water level is relatively stable from January to May each year, the rainfall is more concentrated, the water level is on an upward trend from June to September, and the water level is on a downward trend in mid to late October. The curves of water temperature and tide and water level change in different directions, but the changes are consistent. The water level exhibits a perennial trend of decreasing in the dry season and rising in the rainy season, and the water temperature exhibits a trend of slowly increasing [49,53,54].
4.3.1. Principle Water Temperature Abnormalities
Equipped with a water temperature meter and water level meter, the Lhasa geomagnetic station is the only fluid observation station in the Tibetan geophysical network. The water temperature at the Lhasa geomagnetic station is rising and has been rising since 2007. The observation curve recorded from 1 November 2021 to 20 May 2022 is shown in Figure 8. While the curve is rising overall, it is also greatly affected by the local environmental conditions and artificial interference. The long-term observation curve (Figure 9) reflects a rising pattern in the water temperature of the well. This increase decelerates in winter in all years, and the amplitude was smallest in 2018. In the summer of 2020, the water temperature dropped for a period of time due to the large amount of construction-related pumping around the observation station; then, the water temperature rose slowly after the shutdown of these activities in the surrounding area. The observation results recorded over the last half year are consistent with those obtained in previous years, and no abnormalities were observed.
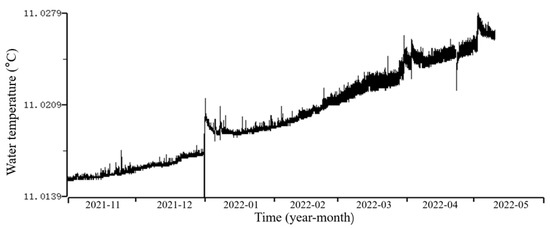
Figure 8.
Observation curve of water temperatures at the Lhasa geomagnetic station from November 2021 to May 2022.
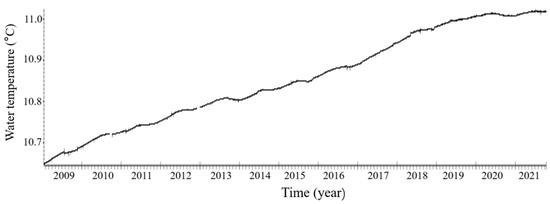
Figure 9.
Long-term observation curve of water temperatures at the Lhasa geomagnetic station from 15 January 2009 to 13 October 2021.
4.3.2. Principle Static Water Level Abnormalities
The static-water-level observation well of the Lhasa geomagnetic station is located on a terrace of the Lhasa River. Because the well does not penetrate the bearing layer, it is affected by both rainfall and evaporation, exhibiting severe annual fluctuations. At the same time, anthropogenic and environmental interference around the observation well impose certain impacts on the annual water level variation (Figure 10) (e.g., [64,65,66,67]). Since 2010, the annual changes have been obvious; the rainy season presents an obvious rising pattern, while the water level is relatively stable in the dry season. This change trend was reversed in 2015, and this year has been verified as an abnormality caused by the large amount of groundwater that was extracted for construction near the station. Since the reconstruction and closure of the Lhasa River in 2018, the water level has been greatly affected. This closure has gradually reduced the water content in the soil, thus resulting in the overall water level decreasing every year. The closure was halted in the last two years, and the water level has since gradually stabilized. At present, the water level anomaly has passed the prediction time limit, and no new abnormal values have occurred since then. Some data are missing due to power failures and due to scheduled water level gradient calibrations being canceled.
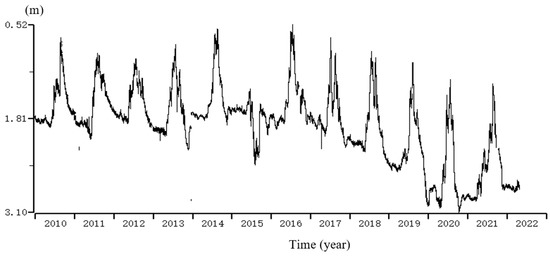
Figure 10.
Long-term observation curve of the static water level (unit: m) at the Lhasa geomagnetic station.
5. Conclusions
Although it is currently a single well, as the world’s rare highest altitude (>3500 m) and well-equipped well water level and temperature observation system, and as the frontier of geodynamics research on the Tibetan Plateau, our data from the Lhasa station will undoubtedly be of great reference value to other research colleagues (both within China and worldwide). By analyzing the responses of the water temperature and water level at the Lhasa geomagnetic station to large earthquakes, the following conclusions can be obtained.
(1) The co-seismic changes in water temperature and water level differ: the water level changes are of oscillation type, while the water temperatures exhibit first heating and then recovery. For the M8.0 Wenchuan earthquake, the water level exhibited a water shock wave, and the co-seismic temperature first increased by 0.0066 °C and then decreased to 0.0079 °C.
(2) The co-seismic changes are related to the epicentral distance, magnitude, and focal depth of the earthquake. The closer and larger magnitude earthquakes triggered greater water temperature changes, such as the M8.1 Nepal earthquake (0.0072 °C) and the M8.0 Wenchuan earthquake (0.0065 °C). The smaller the epicentral distance is, the earlier the co-seismic responses of the well water level and the well water temperature occur; however, the time interval between the co-seismic changes in the well water level and the well water temperature differ.
(3) The co-seismic ratio of the water temperature is higher than that of the water level; this may be related to faulty water level instrumentation or paragraph recordings, although the specific reasons need to be further studied.
Supplementary Materials
The following supporting information can be downloaded at: https://www.mdpi.com/article/10.3390/app122211584/s1.
Author Contributions
Z.G. performed the observation analysis and interpreted the results. Z.G., Y.Z., Y.J., W.Z. and R.Q. elaborated the study and wrote the manuscript. D.C. and C.X. provided comments to improve the manuscript. All authors examined the results and interpretations and participated in manuscript writing. All authors have read and agreed to the published version of the manuscript.
Funding
This study benefited from financial support provided by the Chinese Academy of Sciences (CAS) Pioneer Hundred Talents Program and the Second Tibetan Plateau Scientific Expedition and Research Program (2019QZKK0708).
Institutional Review Board Statement
Not applicable.
Informed Consent Statement
Not applicable.
Data Availability Statement
Data are available in figures or from the authors upon reasonable request.
Acknowledgments
We are thankful to the China Earthquake Administration and the Seismological Bureau of the Tibet Autonomous Region for sharing the data used in this study.
Conflicts of Interest
All the authors listed certify that they have no involvement in any organization or entity with any financial interest (including honoraria; educational grants; participation in speakers’ membership, bureaus, consultancies, stock ownership, employment, or other equity interest; and patent-licensing arrangements or expert testimony) or nonfinancial interest (including professional or personal relationships, knowledge or beliefs, and affiliations) in the subject materials or matter discussed.
References
- Ferreira, J.M.; Oliveira, R.T.D.; Assumpção, M.; Moreira, J.A.; Pearce, R.G.; Takeya, M.K. Correlation of seismicity and water level in the Açu reservoir—An example from northeast Brazil. Bull. Seismol. Soc. Am. 1995, 85, 1483–1489. [Google Scholar] [CrossRef]
- Brodsky, E.E.; Roeloffs, E.; Woodcock, D.; Gall, I.; Manga, M. A mechanism for sustained groundwater pressure changes induced by distant earthquakes. J. Geophys. Res. Solid Earth 2003, 108, 2390. [Google Scholar] [CrossRef]
- He, A.; Fan, X.; Zhao, G.; Liu, Y.; Singh, R.P.; Hu, Y. Co-seismic response of water level in the Jingle well (China) associated with the Gorkha Nepal (Mw 7.8) earthquake. Tectonophysics 2017, 714, 82–89. [Google Scholar]
- Riggio, A.; Santulin, M. Earthquake forecasting: A review of radon as seismic precursor. Boll. Geofis. Teor. Appl. 2015, 56, 95–114. [Google Scholar]
- Shi, Z.; Wang, G.; Manga, M.; Wang, C.Y. Mechanism of co-seismic water level change following four great earthquakes–insights from co-seismic responses throughout the Chinese mainland. Earth Planet. Sci. Lett. 2015, 430, 66–74. [Google Scholar] [CrossRef]
- Cooper Jr, H.; Bredehoeft, J.D.; Papadopulos, I.S.; Bennett, R.R. The response of well-aquifer systems to seismic waves. J. Geophys. Res. 1965, 70, 3915–3926. [Google Scholar] [CrossRef]
- Chen, L.; Gao, X. Coseismic response characteristics of water level and water temperature in Xin 04 well. Shanxi Earthq. 2011, 1, 16–20. (In Chinese) [Google Scholar]
- Lv, F.; Cao, W.; Shen, X. Analysis of the responsiveness of microdynamic information on water level in Taiyuan wells. Shanxi Earthq. 2017, 2, 1–3. (In Chinese) [Google Scholar]
- Chia, Y.; Chiu, J.J.; Chiang, Y.H.; Lee, T.P.; Wu, Y.M.; Horng, M.J. Implications of coseismic groundwater level changes observed at multiple-well monitoring stations. Geophys. J. Int. 2008, 172, 293–301. [Google Scholar]
- Shalev, E.; Kurzon, I.; Doan, M.L.; Lyakhovsky, V. Water-level oscillations caused by volumetric and deviatoric dynamic strains. Geophys. J. Int. 2016, 204, 841–851. [Google Scholar] [CrossRef]
- Roeloffs, E. Persistent water level changes in a well near Parkfield, California, due to local and distant earthquakes. J. Geophys. Res. Solid Earth 1998, 103, 869–889. [Google Scholar] [CrossRef]
- Montgomery, D.R.; Manga, M. Stream flow and water well responses to earthquakes. Science 2003, 300, 2047–2049. [Google Scholar] [PubMed]
- Zhang, B.; Liu, Y.; Gao, X.; Yang, X.; Ren, H.; Li, Y. Correlation analysis on co-seismic response between well water level and temperature caused by the Nepal Ms8.l earthquake. Acta Seismol. Sin. 2015, 37, 533–540. [Google Scholar]
- He, A.; Singh, R.P.; Sun, Z.; Ye, Q.; Zhao, G. Comparison of regression methods to compute atmospheric pressure and earth tidal coefficients in water level associated with Wenchuan Earthquake of 12 May 2008. Pure Appl. Geophys. 2016, 173, 2277–2294. [Google Scholar] [CrossRef]
- Wang, C.Y.; Cheng, L.H.; Chin, C.V.; Yu, S.B. Coseismic hydrologic response of an alluvial fan to the 1999 Chi-Chi earthquake, Taiwan. Geology 2001, 29, 831–834. [Google Scholar]
- Roeloffs, E.; Sneed, M.; Galloway, D.L.; Sorey, M.L.; Farrar, C.D.; Howle, J.F.; Hughes, J. Water-level changes induced by local and distant earthquakes at Long Valley caldera, California. J. Volcanol. Geotherm. Res. 2003, 127, 269–303. [Google Scholar] [CrossRef]
- Shi, Y.L.; Cao, J.L.; Ma, L.; Yin, B.J. Tele-seismic coseismic well temperature changes and their interpretation. Acta Seismol. Sin. 2007, 20, 280–289. [Google Scholar]
- Chen, D.Q.; Liu, Y.W.; Yang, X.H.; Liu, Y.M. Co-seismic Water Level and Temperature Responses of Some Wells to Far-Field Strong Earthquakes and Their Mechanisms. Earthq. Res. China 2007, 21, 333–344. [Google Scholar]
- Huang, F.Q.; Jian, C.L.; Tang, Y.; Xu, G.M.; Deng, Z.H.; Chi, G.C. Response changes of some wells in the mainland subsurface fluid monitoring network of China, due to the 21 September 1999, Ms7.6 Chi-Chi Earthquake. Tectonophysics 2004, 390, 217–234. [Google Scholar] [CrossRef]
- Yang, Z.; Deng, Z.; Deng, S.; Yang, Y.; Tao, J. Analysis on the dynamic variations of well water temperature: With example of the Dangxiao well in Lijiang area, Yunnan Province. Acta Seismol. Sin. 2018, 40, 172–184. [Google Scholar]
- Yin, A.; Harrison, T.M. Geologic evolution of the Himalayan-Tibetan orogen. Annu. Rev. Earth Planet. Sci. 2000, 28, 211–280. [Google Scholar]
- Ding, L.; Spicer, R.A.; Yang, J.; Xu, Q.; Cai, F.; Li, S.; Lai, Q.; Wang, H.; Spicer, T.; Yue, Y.; et al. Quantifying the rise of the Himalaya orogen and implications for the South Asian monsoon. Geology 2017, 45, 215–218. [Google Scholar] [CrossRef]
- Ingebritsen, S.E.; Manga, M. Hydrogeochemical precursors. Nat. Geosci. 2014, 7, 697–698. [Google Scholar] [CrossRef]
- Xi, J.; Guan, H.; Liu, C.; Zhuang, N.; Yang, X.; Zhang, Z.; Ci, Z.; Gesang, Z.; Ma, A. Analysis of changes in geoelectric field observations in Lhasa before and after the 2015 M8.1 earthquake in Nepal. Earthquake 2016, 36, 1–13. (In Chinese) [Google Scholar]
- Geng, J.; Chen, A.; Pan, S. Responding Characteristics of Dynamic Underground Water in Observation Wells of Shandong Province to Indonsia M8.5 Earthquake in 2007. Northwestern Seismol. J. 2008, 30, 173–178. (In Chinese) [Google Scholar]
- Roeloffs, E.A. Hydrologic precursors to earthquakes: A review. Pure Appl. Geophys. 1988, 126, 177–209. [Google Scholar]
- Roeloffs, E.A.; Burford, S.S.; Riley, F.S.; Records, A.W. Hydrologic effects on water level changes associated with episodic fault creep near Parkfield, California. J. Geophys. Res. Solid Earth 1989, 94, 12387–12402. [Google Scholar] [CrossRef]
- Michetti, A.M.; Esposito, E.; Guerrieri, L.; Porfido, S.; Serva, L.; Tatevossian, R.; Vittori, E.; Audemard, F.; Azuma, T.; Clague, J.; et al. Environmental seismic intensity scale-ESI 2007. Mem. Descr. Carta Geol. D’Ital. 2007, 74, 7–23. [Google Scholar]
- Serva, L.; Vittori, E.; Comerci, V.; Esposito, E.; Guerrieri, L.; Michetti, A.M.; Mohammadioun, B.; Mohammadioun, G.C.; Porfido, S.; Tatevossian, R.E. Earthquake hazard and the Environmental Seismic Intensity (ESI) scale. Pure Appl. Geophys. 2016, 173, 1479–1515. [Google Scholar] [CrossRef]
- Gesang, Z.; Wang, J.; Gesang, N.; Luobu, Z.; Tudan, C.; Xu, L. Preliminary establishment of ground water level analysis and prediction indicators for the Lhasa Geomagnetic Terrace. Tibet Sci. Technol. 2019, 3, 75–77. (In Chinese) [Google Scholar]
- Gesang, N.; Gesang, Z.; Luobu, Z.; Tudan, C.; Tudan, C. Exploration of co-seismic response and mechanism of water level and water temperature in Lhasa geomagneticstation. Tibet Sci. Technol. 2019, 12, 33–35. (In Chinese) [Google Scholar]
- Gesang, Z.; Ciren, D.; Tudeng, C.; Yixi, L.; Ciji, Z.; Luobu, Z. Analysis of disturbance factors of subsurface fluid measurement term at Lhasa geomagnetic station. Geod. Geodyn. 2017, 37, 175–179. (In Chinese) [Google Scholar]
- Zhou, Z.; Huang, F.; Ma, Y. Coseismic Changes of Water Level Caused by the Minxian—Zhangxian Ms6.6 Earthquake. China Earthq. Eng. J. 2013, 35, 529–534. (In Chinese) [Google Scholar]
- Liu, Y.; Yang, X.; Liu, Y.; Ma, Y.; Teng, R. The M8.7 earthquake in Sumatra, Indonesia, and its impact on mainland China. Department of Monitoring and Forecasting, China Earthquake Administration. Subsurf. Fluids Sumatra 2004, 8, 131–258. (In Chinese) [Google Scholar]
- Sun, S.; Liu, Y. Water temperature variation caused by Sumatra Ms8.5 earthquake. North China Earthq. Sci. 2008, 26, 35–40. (In Chinese) [Google Scholar]
- He, A.; Zhao, G.; Sun, Z.; Singh, R.P. Co-seismic multilayer water temperature and water level changes associated with Wenchuan and Tohoku-Oki earthquakes in the Chuan no. 03 well, China. J. Seismol. 2017, 21, 719–734. [Google Scholar] [CrossRef]
- Lee, H.; Woo, N. Influence of the M9. 0 Tohoku Earthquake on groundwater in Korea. Geosci. J. 2012, 16, 1–6. [Google Scholar]
- Enescu, B.; Aoi, S.; Toda, S.; Suzuki, W.; Obara, K.; Shiomi, K.; Takeda, T. Stress perturbations and seismic response associated with the 2011 M9.0 Tohoku-oki earthquake in and around the Tokai seismic gap, central Japan. Geophys. Res. Lett. 2012, 39, L00G28. [Google Scholar] [CrossRef]
- He, A.; Singh, R.P. Groundwater level response to the Wenchuan earthquake of May 2008. Geomat. Nat. Hazards Risk 2019, 10, 336–352. [Google Scholar]
- Shi, Z.; Wang, G.; Liu, C. Co-seismic groundwater level changes induced by the May 12, 2008 Wenchuan earthquake in the near field. Pure Appl. Geophys. 2013, 170, 1773–1783. [Google Scholar] [CrossRef]
- Lai, G.; Jiang, C.; Han, L.; Sheng, S.; Ma, Y. Co-seismic water level changes in response to multiple large earthquakes at the LGH well in Sichuan, China. Tectonophysics 2016, 679, 211–217. [Google Scholar]
- Shi, Z.; Wang, G.; Wang, C.Y.; Manga, M.; Liu, C. Comparison of hydrological responses to the Wenchuan and Lushan earthquakes. Earth Planet. Sci. Lett. 2014, 391, 193–200. [Google Scholar] [CrossRef]
- Haolin, J.; Jiangrong, Z. Co-seismic responses of water wells in Jiangsu province to 2008 Wenchuan and 2011 Japan earthquakes. Geod. Geodyn. 2011, 2, 31–36. [Google Scholar]
- He, A.; Singh, R.P. Coseismic groundwater temperature response associated with the Wenchuan earthquake. Pure Appl. Geophys. 2020, 177, 109–120. [Google Scholar]
- Huang, F.; Li, M.; Ma, Y.; Han, Y.; Tian, L.; Yan, W.; Li, X. Studies on earthquake precursors in China: A review for recent 50 years. Geod. Geodyn. 2017, 8, 1–12. [Google Scholar]
- Zhao, B.; Li, W.; Wang, Y.; Lu, J.; Li, X. Landslides triggered by the Ms 6.9 Nyingchi earthquake, China (18 November 2017): Analysis of the spatial distribution and occurrence factors. Landslides 2019, 16, 765–776. [Google Scholar] [CrossRef]
- Huang, Y.; Xu, C.; Zhang, X.; Xue, C.; Wang, S. An updated database and spatial distribution of landslides triggered by the Milin, Tibet Mw6. 4 Earthquake of 18 November 2017. J. Earth Sci. 2021, 32, 1069–1078. [Google Scholar]
- Shi, Z.; Wang, G.C.; Manga, M.; Wang, C.Y. Continental-scale water-level response to a large earthquake. Geofluids 2015, 15, 310–320. [Google Scholar] [CrossRef]
- Sun, X.; Liu, Y. Changes in groundwater level and temperature induced by distant earthquakes. Geosci. J. 2012, 16, 327–337. [Google Scholar]
- Yang, Z.Z.; Deng, Z.H.; Tao, J.L.; Gu, Y.Z.; Wang, Z.M.; Liu, C.L. Coseismic effects of water temperature based on digital observation from Tayuan well, Beijing. Acta Seismol. Sin. 2007, 29, 203–213, (In Chinese with English Abstract). [Google Scholar]
- Li, C.; Zhou, X.; Yan, Y.; Ouyang, S.; Liu, F. Hydrogeochemical Characteristics of Hot Springs and Their Short-Term Seismic Precursor Anomalies along the Xiaojiang Fault Zone, Southeast Tibet Plateau. Water 2021, 13, 2638. [Google Scholar] [CrossRef]
- Tang, X.; Zhang, J.; Pang, Z.; Hu, S.; Wu, Y.; Bao, S. Distribution and genesis of the eastern Tibetan Plateau geothermal belt, western China. Environ. Earth Sci. 2017, 76, 31. [Google Scholar]
- Ma, Y.; Huang, F. Coseismic water level changes induced by two distant earthquakes in multiple wells of the Chinese mainland. Tectonophysics 2017, 694, 57–68. [Google Scholar]
- Yang, P.; Sun, X.; Liu, D.; He, Z.; Li, Y. Hydrochemical Characteristics of Groundwater at the Epicenter of the 2021 Biru M6.1 Earthquake in Central Tibet. Water 2021, 13, 3111. [Google Scholar] [CrossRef]
- Yang, Z. Seismic wave-induced isoseismic variation of well water level and temperature and its mechanism. Int. Seism. Dyn. 2012, 11, 42–47. (In Chinese) [Google Scholar]
- Yongtai, C.; Anhua, H.; Jinzi, Y. Mechanisms of water-heat dynamics and earth-heat dynamics of well water temperature micro-behavior. Acta Seismol. Sin. 2014, 36, 106–117. [Google Scholar]
- Chen, S.; Liu, P.; Guo, Y.; Liu, L.; Ma, J. Co-seismic response of bedrock temperature to the Ms6. 3 Kangding earthquake on 22 November 2014 in Sichuan, China. Pure Appl. Geophys. 2019, 176, 97–117. [Google Scholar] [CrossRef]
- Asteriadis, G.; Livieratos, E. Pre-seismic responses of underground water level and temperature concerning a 4.8 magnitude earthquake in Greece on October 20, 1988. Tectonophysics 1989, 170, 165–169. [Google Scholar] [CrossRef]
- Shen, P.; Jing, S.Q.; Yao, H.D.; Tian, Y.P.; Yu, P.; Tong, M. Analysis on co-seismic response characteristics to teleseism recorded by Changsha well’s dynamic water level in Hunan province. Prog. Geophys. 2018, 33, 74–83. [Google Scholar]
- Shi, Z.; Wang, G. Hydrological response to multiple large distant earthquakes in the Mile well, China. J. Geophys. Res. Earth Surf. 2014, 119, 2448–2459. [Google Scholar] [CrossRef]
- Duan, S. Co-seismic response characteristics of water temperature and water level to Nepal M8.1 earthquake at Tengchong Station. South China Earthq. 2017, 37, 29–33. (In Chinese) [Google Scholar]
- Zhang, Y.; Wang, C.Y.; Fu, L.Y.; Yan, R.; Chen, X. Mechanism of the coseismic change of volumetric strain in the far field of earthquakes. Bull. Seismol. Soc. Am. 2017, 107, 475–481. [Google Scholar]
- Sun, X.; Xiang, Y.; Shi, Z.; Wang, B. Preseismic changes of water temperature in the Yushu well, western China. Pure Appl. Geophys. 2018, 175, 2445–2458. [Google Scholar] [CrossRef]
- Arabelos, D.; Asteriadis, G.; Contadakis, M.; Zioutas, G.; Xu, D.; Zhang, C.; Zheng, B. The use of an outlier detecting method in time series of continuous daily measurements of underground water level and temperature in earthquake prediction investigation. Tectonophysics 2001, 338, 315–323. [Google Scholar] [CrossRef]
- Lee, H.A.; Hamm, S.Y.; Woo, N.C. Pilot-scale groundwater monitoring network for earthquake surveillance and forecasting research in Korea. Water 2021, 13, 2448. [Google Scholar]
- Shi, Z.; Zhang, H.; Wang, G. Groundwater trace elements change induced by M5. 0 earthquake in Yunnan. J. Hydrol. 2020, 581, 124424. [Google Scholar]
- Charmoille, A.; Fabbri, O.; Mudry, J.; Guglielmi, Y.; Bertrand, C. Post-seismic permeability change in a shallow fractured aquifer following a ML 5.1 earthquake (Fourbanne karst aquifer, Jura outermost thrust unit, eastern France). Geophys. Res. Lett. 2005, 32, L8406. [Google Scholar] [CrossRef]
Publisher’s Note: MDPI stays neutral with regard to jurisdictional claims in published maps and institutional affiliations. |
© 2022 by the authors. Licensee MDPI, Basel, Switzerland. This article is an open access article distributed under the terms and conditions of the Creative Commons Attribution (CC BY) license (https://creativecommons.org/licenses/by/4.0/).