Featured Application
This work proposed a novel necking heat pipe with double-end heating, which could be utilized in the heat pipe systems to obtain different thermal performances for complicated working situations, especially for the overload operation situation. For example, the waste heat of a low-power chip can be utilized to drive a high-power chip working under the overload situation on the same circuit board, which can be considered waste heat recovery and utilization.
Abstract
This work proposed a novel necking heat pipe with double-end heating for thermal management of the overload operation. The addition of another heat load was adopted to obtain a higher threshold critical power for the heat pipe system. The thermal performance of thermal switch heat pipe (TSHP) and traditional grooved heat pipe (TGHP) was investigated experimentally, including the threshold critical power, starting characteristic, recovery characteristic, surface temperature distribution, thermal resistance, etc. The optimized TSHP exhibited a larger threshold critical power range with low additional heat load input (from 55 W to 65 W, almost 20% increase), low starting additional heat load input (2 W), good recovery characteristic (less than 150 s from 75 °C to normal after overload), and low thermal resistance with additional heat load input (less than 0.13 °C/W). These results indicate that the optimized TSHP can offer great potential for the overload operation situation with the additional heat load. Such a novel necking heat pipe with double-end heating can be utilized in heat pipe systems to obtain different thermal performances for complicated working situations, especially for the overload operation situation.
1. Introduction
In recent years, thermal management has been widely utilized in the aerospace industry [1,2], third-generation semiconductor fields [3,4,5], and new energy vehicles (NEVs) [6,7]. As the size decreased and the power density increased rapidly in the power devices field, heat dissipation gradually became the key problem of the next generation of power devices [5,8]. Additionally, Moore’s law was alive and well in the multicore arena, with manufacturers increasing the number of cores on chips at an ever-increasing rate [9]. Therefore, the high-power density of the power devices requires better cooling methods for heat dissipation specifically and effectively. Consequently, more effective heat dissipation performance devices and modules, better cooling systems and designs, and higher thermal conductivity materials should be put forward to solve the extremely high heat fluxes of the power devices [10,11,12].
At present, heat pipes serving as two-phase heat-transfer devices have been widely utilized for effective heat dissipation in the thermal management of high heat flux applications [13,14,15]. Unlike other heat dissipation methods, such as air cooling [16,17] or liquid cooling [18,19], heat dissipation with heat pipes can obtain the temperature uniformity status of power devices to avoid local hot spots due to their high thermal conductivity. As the number of cores on chips is increasing at an ever-increasing rate and the highly integrated electronic devices, the thermal management for single heat source dissipation might not be suitable for such multiple heat source systems with the rapid development of the industry. Hence, there were many reported investigations about multiple heat sources in thermal management by many researchers around the world. Some investigations mainly aimed at the theoretical deduction and simulation of the steam pressure distribution and surface temperature distribution in the thermal management systems, including single heat source and multiple heat source systems [20,21,22]. Bimal Subedi and his coworkers [21] proposed a theoretical investigation of a heat pipe system with multiple heat sources. The results indicated that the optimized key factors of wicks could be obtained for the threshold critical power of the heat pipe system with multiple heat sources. By means of such analytical solutions, the maximum surface temperature of the electronic devices could be obtained, which could direct practical experiments and even establish a calibration of the test data. However, this work could only offer a method for multiple heat sources on one side, which could be treated as a large heat source, and the scope of the applications was not wide enough for other situations. Others focused more on experimental investigations in order to explore the heat pipe systems with multiple heat sources for heat dissipation during different applications [23,24,25,26]. Cai et al. [23] presented a novel multiple-branch heat pipe system for heat dissipation in multi-heat source electronics. The optimized factors, including the filling ratio, the start-up characteristics, and thermal resistance, were experimentally investigated. The results showed directive significance for heat dissipation in multiple heat source systems. Zhong et al. [24] also proposed a heat dissipation method for a multi-branch heat pipe system. The difference between the two of them was that Cai focused on the experimental investigation of multiple heat sources for multiple heat source systems, while Zhong focused more on the experimental investigation of multiple cooling sources for a single heat source system. Tang et al. [25] adopted a combined method for heat dissipation. The multiple heat sources and double cooling sources for the heat pipe system were experimentally investigated, and the results indicated that such a design was well adapted for high heat fluxes application, especially for efficient heat dissipation for electronic devices inside the spacecraft. Han et al. [26] developed a novel flat heat pipe sink with multi-heat sources (a heat sink configured with four flat heat pipes). The results performed well in the experiment, showing its high heat flux transportation in heat dissipation of compact electronic devices.
From the literature mentioned above, both the theoretical deduction and experimental investigations were discussed by many researchers. Additionally, many designs for heat dissipation were proposed for multiple heat source systems, and many inspired results were obtained for other researchers to explore more interesting designs for thermal management. However, these works focused on the same size of the cross-section along the heat pipe, either a single heat source system or multiple heat source systems. The same size of the heat pipe might not be efficient enough for multiple heat sources to adjust their steam pressure and thermal resistance, especially for multiple heat sources with different heat load inputs. Therefore, the variable cross-section of the heat pipe might be better in multiple heat source systems for rapid changes in its steam pressure and then for better heat dissipation. Moreover, it could be distinguished between primary and additional heat sources in the experimental investigations of multiple heat source systems. These two heat sources could be distinguished as a low-power chip and a high-power chip on the same circuit board, respectively. Then, the waste heat of a low-power chip could be utilized to drive a high-power chip working under the overload situation, which could be considered waste heat recovery and utilization. Such investigations have not been studied.
In this work, the additional heat load (named heat load B) was adopted to obtain a higher threshold critical power for a novel necking heat pipe system. The thermal performance of thermal switch heat pipe (TSHP) and traditional grooved heat pipe (TGHP) was investigated experimentally, including the threshold critical power, starting characteristic, recovery characteristic, surface temperature distribution, thermal resistance, etc. The optimized TSHP exhibited well thermal performance. These results indicate that the optimized TSHP can offer great potential for the overload operation situation. Moreover, the addition of heat load B provides another method for adjusting the steam pressure distribution along the necking heat pipe to obtain a better heat pipe system of overload, stability, and low thermal resistance. Such distinction between primary and additional heat sources in the experimental investigations of multiple heat source systems can also provide a method for thermal resistance adjustment. Furthermore, the variable cross-section of the heat pipe can provide another method for efficiently adjusting steam pressure and thermal resistance. Additionally, even more addition of heat loads or condensation modules can be utilized in the heat pipe systems to obtain different thermal performances for the complicated working situation, especially for the overload operation situation.
2. Materials and Methods
2.1. The Geometric Parameters of the Heat Pipes
Due to the high thermal conductivity, long-term reliability, and ease of mass production of grooved heat pipes [27], they were utilized as experimental samples in our study. The geometric parameters of two types of grooved heat pipes, including thermal switch heat pipe (TSHP) and traditional grooved heat pipe (TGHP), were demonstrated, as shown in Table 1. Due to their simple structure, some key parameters were discussed in detail, including pipe length, necking length, and both their diameters. These parameters would be a great effect on the thermal performance of a heat pipe system, such as threshold critical power, the second start-up characteristic, etc. TSHP, with a total length of 310 mm and a necking length of 30 mm, was investigated experimentally in detail during this work, as shown in Figure 1. Additionally, the diameter of TSHP was 8 mm, while the necking part was 4 mm. As a control group, TGHP had the same length of 310 mm and the same diameter of 8 mm.

Table 1.
The geometric parameters of grooved heat pipes.

Figure 1.
A schematic diagram of TSHP. (a) Cross section of the heat pipe; (b) geometrical characteristics of grooves; (c) the necking shrinkage during the necking section; (d) the overview of TSHP.
2.2. Experimental Setups
The experimental setup for the thermal performance of TSHP is demonstrated in Figure 2. As shown in Figure 2, the whole setup consisted of three parts, including a DC power supply for heat input, a data receiver, and wireless acquisition unit for data collection, constant temperature adjustable cooling bath for heat dissipation. In this study, there were two heat load inputs located separately at both ends of heat pipes, which were called primary and additional heat sources. For distinction, the heat block on the left side of the heat pipes was called heat load A, while the other side was called heat load B. In this part, heat load A was discussed in detail due to heat loads A and B with the same structure. It should be noted that heat load B played the role of auxiliary heat source, which is similar to a thermal switch to adjust the threshold critical power of a heat pipe system. The DC power supply (MAISHENG MP6010D) was purchased from Dongguan Maihao Electronic Technology Co., Ltd., Dongguan, China. It was used to supply electric power for driving the heat block as the heat source. The heat block of dimensions 20 × 25 × 30 mm3 was made of copper with a high thermal conductivity of approximately 400 W/(m·K) for better heat loading, and the heat block was fixed to the test platform by spring and bolts to ensure test stability. The data acquisition module (HIOKI-LR8510) was purchased from HIOKI FOREST PLAZA CORPORATION, Nagano, Japan, and it was composed of a data receiver and wireless acquisition unit. There were nine micro-thermal couples attached tightly to the surface of TSHP or TGHP to obtain the surface temperature distribution of them. The data of the surface temperature were then transferred to the wireless acquisition unit through WiFi. Finally, data processing was carried out on a personal computer to obtain different thermal performances of the tested samples. The constant temperature adjustable cooling bath (DC-1006) for heat dissipation was purchased from Ningbo Scientz Biotechnology Co., Ltd., Ningbo, China. A flow meter was used for controlling the flow rate of cooling water, and thereby it could adjust the rate of heat dissipation. The cooling block was also made of copper with a water channel inner side, which served as the condensation section during testing, and it also fixed well to the test platform by spring and bolts. Moreover, TSHP or TGHP with heating and cooling blocks was covered by thermal insulation materials. A thin layer of thermal silicone grease was coated between TSHP or TGHP and heating or cooling blocks for lessening thermal contact resistance. All thermal tests were under room temperature and suitable humidity without airflow effects. All the micro-thermal couples were with accurate size and position among TSHP or TGHP. In order to distinguish two experimental heat pipe systems in this study, micro-thermal couples named T1 to T9 were utilized to discuss the thermal performance of TSHP, while t1 to t9 were for TGHP.
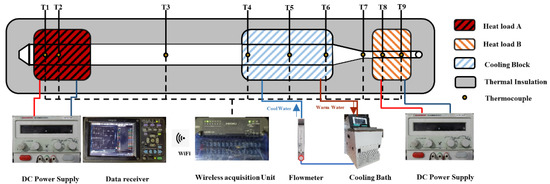
Figure 2.
Experimental setup of TSHP.
2.3. Data Reduction and Uncertainty Calculation
In general, both thermal resistance and threshold critical power are the key characteristics to evaluate the thermal performance of a heat pipe system. The threshold critical power means the highest operating power of a heat pipe before its inner working medium dries out. The thermal resistance of a heat pipe system is defined as the ratio of the temperature difference between the evaporation section and condensation section to the operating power. The total thermal resistance of two experimental heat pipe systems can be calculated as the following Equation (1):
where Teva and Tcon are the average surface temperature of the evaporation section and condensation section, respectively. Qin is the operating power during normal running. Teva and Tcon can be calculated as following Equations (2) and (3):
In this study, the experimental uncertainty was mainly caused by the accuracy of the instruments in the measurement process, including the accuracy of the wireless acquisition unit and DC power supply. The resolution of the DC power supply and wireless acquisition unit was 0.5 W and 0.05 °C. These measuring errors actually influenced the total thermal resistance of a heat pipe system according to Equation (1). The uncertainty of the thermal resistance could be calculated as following Equation (4) [28,29,30]:
where eT1, eT2, eT3, eT4, eT5, and eT6 are the resolution of the wireless acquisition unit, which is 0.05 °C; eQin is the resolution of DC power supply, which is 0.5 W. From Equation (4), it can be known that the uncertainty of the thermal resistance increases with the temperature difference between the evaporation section and condensation section (ΔT) and decreases with the operating power (Qin). Therefore, the maximum uncertainty of the total thermal resistance can be found when the temperature difference between the evaporation section and condensation section (ΔT) is the biggest one, while the operating power (Qin) is the smallest one. Therefore, in this study, the maximum uncertainty of the total thermal resistance was 8.2%.
3. Results and Discussion
3.1. The Effects of Power Distribution on the Threshold Critical Power of the Heat Pipe Systems
Figure 3 shows that the threshold critical power of the heat pipe systems was experimentally investigated under different power distributions, including heat load A and heat load B. In the experiment section, heat load B was introduced as an auxiliary heat source to make the threshold critical power of the heat pipe systems adjustable. Therefore, the additional heat load B is similar to a thermal switch. As shown in Figure 3a,b, the surface temperature of two heat pipe systems increased steadily with heat load A. Additionally, there was little difference in the threshold critical power of them without heat load B. For example, the threshold critical power of TSHP was 55 W, while TGHP was 50 W. It could be known that the same length of heat pipe might have almost the same threshold critical power, even though they had different structures. For example, TSHP had a necking section with a length of 30 mm and a diameter of 4 mm. TGHP was only a long straight grooved tube without a necking section. There were some interesting things that occurred that the surface temperature difference of the heat pipes showed obvious distinguish. Nine points for measuring the temperature of TSHP had good consistency, which meant that its thermal performance was pretty good. However, TGHP had good temperature consistency under the low operating power, while it obtained a large temperature deviation under the high operating power. Figure 3c,d demonstrated the threshold critical power of two heat pipe systems under different heat load B inputs in detail, respectively. Additionally, two kinds of the filling working liquid mass for two heat pipe systems were also experimentally investigated, respectively. In this study, the filling working liquid mass was not the key research factor. Therefore only two kinds of the filling working liquid mass for two heat pipe systems were chosen to show how it influenced the thermal performance of the heat pipe systems. Then, the heat pipes with better thermal performance were selected to push ahead with the following experiments. Two kinds of the filling working liquid mass (1.05 g and 0.95 g) for TSHP under different heat loads B were demonstrated as the following Figure 3c. For convenience, TSHP, with the filling working liquid mass of 0.95 g, was named TSHP-1, while the other was named TSHP-2. As mentioned previously, heat load B played a significant role in the threshold critical power adjustment of the heat pipe system. TSHP showed almost the same change with heat load B. Their threshold critical power increased rapidly with low heat load B and increased slowly or even kept constant with high heat load B. For example, both TSHP-1 and TSHP-2 had a large growth of 10 W with heat load B input less than 4 W. It was almost a 20% increase in threshold critical power for TSHP-1 and TSHP-2 (from 55 W to 65 W for TSHP-1; from 50 W to 60 W for TSHP-2). When heat load B increased from 4 W to 12 W, both TSHP-1 and TSHP-2 increased 5 W (from 65 W to 70 W for TSHP-1; from 60 W to 65 W for TSHP-2). Moreover, TSHP-1 could be speculated better than TSHP-2 in the threshold critical power with heat load B increase. As a result, TSHP-1 was chosen to carry on the following experiments. Two kinds of the filling working liquid mass (1.5 g and 1.1 g) for TGHP under different heat loads B were demonstrated as the following Figure 3d. For convenience, TGHP with the filling working liquid mass of 1.5 g was named TGHP-1, while the other was named TGHP-2. Their threshold critical power increased slowly or even kept constant with low heat load B and increased rapidly with high heat load B, which was in contrast with TSHPs. For example, both TGHP-1 and TGHP-2 had a small growth of only 5 W with heat load B input less than 4 W. It was just less than a 10% increase in threshold critical power for TGHP-1 and TGHP-2 (from 50 W to 55 W for TGHP-1; from 45 W to 50 W for TGHP-2). When heat load B increased from 4 W to 10 W, TGHP-1 increased rapidly (From 55 W to 80 W for TGHP-1), while TGHP-2 still increased slowly (from 50 W to 55 W for TGHP-2). It was almost a 50% increase in threshold critical power for TGHP-1 when heat load B increased from 4 W to 10 W. Moreover, TGHP-1 could be found to be better than TGHP-2 in the threshold critical power with heat load B increase, especially with high heat load B input. Therefore, TGHP-1 was chosen to carry on the following experiments. In conclusion, the addition of heat load B served as a thermal switch in both TSHP and TGHP, which could greatly increase the threshold critical power of a heat pipe system.

Figure 3.
The threshold critical power of the heat pipe systems under different power distribution: (a) the surface temperature distribution of TSHP-1 with different heat load A; (b) the surface temperature distribution of TGHP-1 with different heat load A; (c) the threshold critical power of TSHP-1 with different heat load B. (d) the threshold critical power of TGHP-1 with different heat load B.
The distribution of steam pressure inside the heat pipes is demonstrated in Figure 4. In this work, the addition of heat load B was introduced into the heat pipe systems, including TSHP-1 and TGHP-2. Therefore, it was quite different from the heat pipe system with only one single heat load, especially in the distribution of steam pressure inside the heat pipes. As shown in Figure 4a, the steam pressure of P1 increased when the heating block was under normal working, and then the steam flowed along the heat pipe to the condensation section. Finally, the steam was condensed into water. The condensed water reflowed to the evaporation section through the capillary structure. It also meant that the steam pressure of P2 was low when the heat pipe was working normally. Moreover, the steam pressures of P1 and P2 were under dynamic equilibrium, but the condensed water was blocked in the condensation section when the heat pipe was under working overload status. It meant that the heat pipe could not be carried on heat dissipation in time due to large heat input, which led to the dry-out status of the evaporation section. As a result, the steam pressure of P1 was much higher than that of P2. Figure 4b shows the distribution of steam pressure inside the heat pipe with two heat loads when the heat pipe was under normal and overload working status, especially for necking heat pipes such as TSHP-1. Before the heat pipe with two heat loads came into working overload status and the additional heat block was out of work, the distribution of steam pressure inside the heat pipe was the same as shown in Figure 4a. When TSHP-1 was under overload working status without heat load B working, the condensed water was blocked in the condensation section. However, the steam pressure of P4 and P5 rapidly grew up after heat load B was on working due to the small volume of the necking section. Therefore, the blocked working liquid reflowed because the steam pressure of P4 and P5 was higher than that of P3. As a result, TSHP-1 came into normal working under higher heat load A input. Then, the steam pressures of P3, P4, and P5 returned to dynamic equilibrium. In summary, the addition of heat load B served as a thermal switch could improve the threshold critical power of a heat pipe system by increasing the reflow flux of the blocked working liquid inside the condensation section.
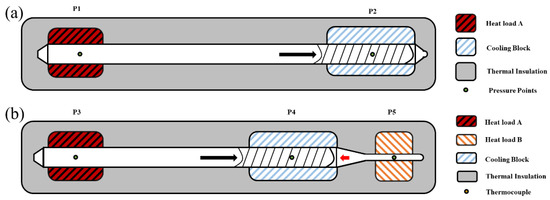
Figure 4.
The distribution of steam pressure inside the heat pipes: (a) the distribution of steam pressure inside the heat pipes with only one single heat load; (b) the distribution of steam pressure inside the heat pipes with two heat loads (one heat load for the heat source, and the others served as a thermal switch).
3.2. Dynamic Response Characteristics of the Heat Pipe Systems
Figure 5 demonstrated the surface temperature distribution of TSHP-1 after reaching the threshold critical power with different heat load B, including (a) 2 W and (b) 4 W. As shown in Figure 5a, TSHP-1 was under normal working before 700 s for the tested points T1–T9 remained relatively stable. TSHP-1 then came into overload working status with the increased heat load A after 700 s. It could be seen that the surface temperature of T1 increased quite rapidly, which meant that the evaporation section was dried-out. However, the surface temperature of T1 recovered stability with heat load B input of 2 W after 1000 s. The stable status of TSHP with heat load B input of 2 W remained at approximately 250 s, and then the surface temperature of T1 increased rapidly to cause the dry-out status of TSHP-1. The stable status of TSHP recovered after heat load B input of 4 W, as shown in Figure 5b. The surface temperature of T8 and T9 grew up when heat load B was input, while that of T1 decreased to the original state. Moreover, the surface temperature of the tested points was kept stable, which meant that the whole heat pipe system could maintain stability after heat load B input of 4 W. The surface temperature distribution of TGHP-1 after reaching the threshold critical power with different heat load B is shown in Figure 6. The changing situation of TGHP-1, which recovered from the dry-out status to the stable status, was almost the same as that of TSHP-1. However, the minimum heat load B input of TGHP-1 was quite different from that of TSHP-1. When heat load B input was 4 W, TSHP-1 could be recovered to the stable status, while TGHP-1 would be recovered stable when heat load B input was at least 6 W.

Figure 5.
The surface temperature distribution of TSHP-1 after exceeding the threshold critical power (heat load A was 65 W) with different heat load B, including (a) 2 W and (b) 4 W.
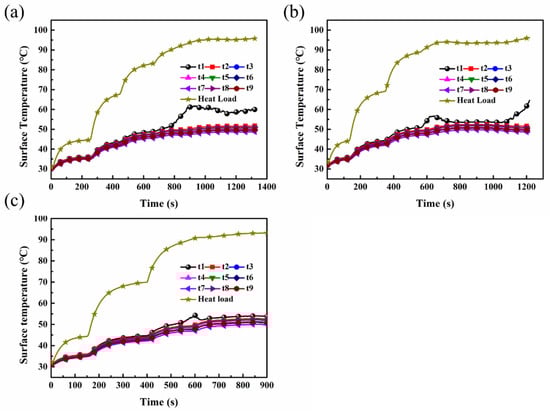
Figure 6.
The surface temperature distribution of TGHP-1 after exceeding the threshold critical power (heat load A was 65 W) with different heat load B, including (a) 2 W, (b) 4 W, and (c) 6 W.
From the above, it could be known that the heat pipe system would recover from the dry-out status to the stable status with a proper heat load B input. Furthermore, the recovery characteristics of TSHP-1 with heat load B input of 10 W after the surface temperature of T1 dried out to different temperatures, including 75 °C and 94 °C. As shown in Figure 7a, the recovery time of TSHP-1 after being dried out was quite short (less than 150 s) with heat load B input when the surface temperature of T1 was 75 °C. It meant that the addition of heat load B played a significant role in adjusting the status switching of TSHP-1. Moreover, TSHP-1 recovered rapidly when the surface temperature of T1 was low. Therefore, TSHP-1 recovered to a stable status quite rapidly when the evaporation section was under the dry-out status for a short time. On the contrary, TSHP-1 recovered quite slowly because the surface temperature of T1 was high. It also meant that TSHP-1 was out of stable status for a long time. As a result, nearly 450 s was paid for the status recovery of TSHP-1 in Figure 7b. The reason for the different recovery times of TSHP-1 with a different surface temperature of T1 may be that TSHP-1 under the dry-out status with different times caused different pressure distribution in the heat pipe, and it would greatly influence the rebuilding time of the stable status in the heat pipe because the imbalance pressure distribution of the heat pipe changed with time under the dry-out status. For example, it cost nearly 450 s for TSHP-1 to return to the stable status after the surface temperature of T1 was up to 94 °C. It could be seen that the pressure of the evaporation section was high enough to prevent the working liquid in the heat pipe from reflowing back. Additionally, the liquid slug might be formed in the condensation section. However, the liquid slug could be pushed back to the evaporation section with heat load B input of 10 W, even though it took a long time in this process. That was why nearly 450 s was the cost for TSHP-1 to recover to the stable status, which was approximately three times longer than that of status when the surface temperature of T1 was 75 °C. More detailed explanations about the pressure distribution of the heat pipe during different statuses can be found in Section 3.1.
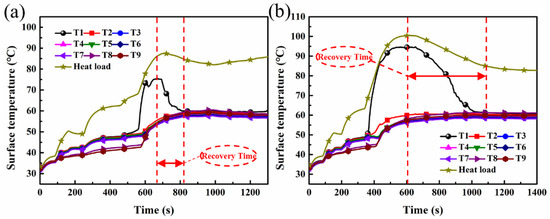
Figure 7.
The recovery characteristics of TSHP-1 with heat load B input of 10 W after the surface temperature of T1 increased to (a) 75 °C and (b) 94 °C caused by heat load A input up to 65 W.
Figure 8 demonstrates the surface temperature distribution of TSHP-1 versus heat load A and heat load B. As shown in Figure 8a, the surface temperature distribution of TSHP-1 with different heat load A from 45 W to 80 W under a certain heat load B input of 12 W was demonstrated in detail. It could be seen that the surface temperature along TSHP-1 from the evaporation section to the condensation section (from T1 to T6) showed a small difference before it dried out, except for the heat load B section (from T7 to T9). TSHP-1 would have good temperature uniformity performance with heat load A input less than 75 W under a certain heat load B input of 12 W. Because the heat pipe was under the stable status. However, the surface temperature of T7 to T9 was quite different from each other. The surface temperature increased successively from T7 to T9 due to the rapidly increasing steam pressure during the heat load B section. Moreover, the surface temperature of T1 and T9 would suddenly increase when TSHP-1 came to the threshold critical power under a certain heat load B of 12 W. It was worth noting that the surface temperature of the whole heat pipe slightly increased before TSHP-1 came to the threshold critical power. The surface temperature distribution of TSHP-1 with different heat load B from 0 to 12 W under a certain heat load A input of 45 W was shown in Figure 8b. The surface temperature along TSHP from the evaporation section to the condensation section (from T1 to T6) showed a small difference for TSHP-1 under the stable status during the whole testing process, except for the heat load B section (from T7 to T9). The surface teperature still increased successively from T7 to T9 due to the rapidly increasing steam pressure during the heat load B section. Firstly, the surface temperature of T7 was higher than that of T9 without heat load B input, and then the surface temperature of T9 increased slowly versus heat load B. Finally, it exceeded that of T7. In summary, the main section of TSHP-1 (from T1 to T6) had good temperature uniformity performance when it was less than the threshold critical power. The addition of heat load B for TSHP-1 could cover a larger power range than that of a heat pipe with the same dimension. Moreover, the necking section of TSHP also played an important role in the steam pressure distribution adjustment. Therefore, different heat loads B could obtain the different threshold critical power of TSHP-1, and it also meant that low threshold critical power heat pipe could normally work under an overpower status with heat load B input. It also meant that TSHP-1 with heat load B was especially suitable for overclocking work situations.
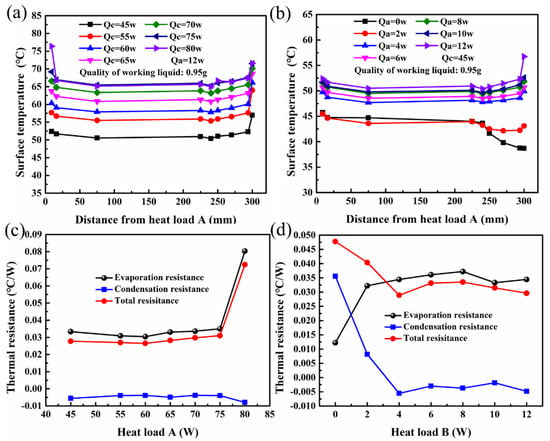
Figure 8.
(a) The surface temperature distribution of TSHP-1 with different heat load A (named Qc in the figure) from 45 W to 80 W under a certain heat load B input of 12 W; (b) the surface temperature distribution of TSHP-1 with different heat load B (named as Qa in the figure) from 0 to 12 W under a certain heat load A input of 45 W; (c) the thermal resistance of TSHP-1 with different heat load A from 45 W to 80 W under a certain heat load B input of 12 W; (d) the thermal resistance of TSHP-1 with different heat load B from 0 to 12 W under a certain heat load A input of 45 W.
The thermal resistance of TSHP-1 versus heat load A and heat load B was demonstrated in Figure 8c,d. It could be seen that the total resistance of TSHP-1 kept on a low level before TSHP-1 was under the dry-out status when a certain heat load B input was 12 W. When heat load A was over 80 W, TSHP-1 was out of normal working for the total resistance grew up rapidly. Moreover, the evaporation resistance of TSHP-1 was a little higher than the total resistance of TSHP-1, and the condensation resistance of TSHP-1 was even lower than 0. The reasons for the above phenomena were that the steam pressure of TSHP-1 might be under a dynamic balance status. Moreover, the status could be speculated as follows: two ends of TSHP-1 were under high steam pressure, while the middle side of TSHP-1 was low with the increase in heat load B. Here, heat load B served as a thermal switch to adjust the steam pressure distribution of TSHP-1. Then, as a result, the surface temperature of the adiabatic section of TSHP-1 was slightly lower than that of the condensation section. Furthermore, the surface temperature of TSHP-1 might have been influenced by the thermal conduction of the shell and then caused the phenomena above. As shown in Figure 8d, the thermal resistance of TSHP-1 with different heat load B from 0 to 12 W under a certain heat load A input of 45 W was demonstrated in detail. The overall trend was that the total resistance and condensation resistance of TSHP-1 decreased and then kept stable with the increase in heat load B, while the evaporation resistance increased first. The reason could be attributable to the addition of heat load B because the steam pressure of the condensation section was low firstly without heat load B input. Then, the condensation resistance was quite high compared with the others. As heat load B input increased, the balance of steam pressure was broken again. It caused the status where two ends of TSHP-1 were under high steam pressure, while the middle side of TSHP-1 was low. Therefore, the condensation resistance of TSHP-1 was even lower than 0.
The thermal resistance of TSHP-1 before and after it dried out is shown in the following Figure 9a,b. Figure 9a demonstrates the thermal resistance of TSHP-1 with different heat loads A from 10 W to 55 W, which meant that TSHP-1 was under a stable status. Additionally, heat load B was unworking. It could be seen that the total resistance of TSHP-1 appeared to have a U-shaped change with the increase in heat load A. When heat load A input was low, the evaporation section of TSHP-1 was not fully started up, which caused some working liquid accumulation. As a result, the evaporation section resistance of TSHP-1 was high. With the increase in heat load A, the working liquid accumulation gradually improved, and the evaporation section of TSHP-1 even dried out because the evaporation section resistance increased. Moreover, TSHP-1 obtained the minimum resistance with heat load A input of 35 W. The thermal resistance of TSHP-1 with different heat load B from 0 to 12 W under a certain heat load A input of 45 W is shown in Figure 9b. TSHP-1 could reach a certain threshold critical power with a certain heat load B. Firstly, the total resistance of TSHP-1 increased with a low heat load B. During this process, the balanced steam pressure of TSHP-1 was broken, and it was hard for TSHP-1 to recover to a stable status with such a low heat load B. However, the total resistance of TSHP-1 was still at a low level, which was also in line with the normal operating range of heat pipes. The total resistance of TSHP-1 was then reduced with heat load B input from 2 W to 6 W. Finally, the total resistance of TSHP-1 increased with heat load B input from 6 W to 12 W. The reason for it might be that localized drying occurred during the evaporation section of TSHP-1 with a high threshold critical power of heat load A input. Therefore, the total resistance of TSHP-1 increased even with a high heat load B input because the steam pressure distribution of TSHP-1 might be under a delicate balance. At this point, the steam pressure of the evaporation section was a little higher than that of the condensation section. The thermal resistance of TGHP-1 versus different heat load A and heat load B was demonstrated in the following Figure 9c,d. It could be seen that the general tendency of TGHP-1 was almost the same as that of TSHP-1. Therefore, the total resistance of TGHP-1 was a little higher than that of TGHP-1. Moreover, the condensation resistance of TGHP-1 was a little lower than 0. The reason for it might be that TGHP-1 still had a long section (about 30 mm) for heat load B with the same diameter as the main section along TGHP-1, and the liquid slug might have been formed easier without heat load B input. In summary, the addition of heat load B can adjust the steam pressure of TSHP-1 and TGHP-1 and thus increase the threshold critical power of TSHP-1 and TGHP-1. Moreover, TSHP-1 was more suitable for the real situation. Thus, it is very suitable for a real situation where the waste heat of a low-power chip can be utilized to drive a high-power chip working under the overload situation on the same circuit board, which can be considered waste heat recovery and utilization because a low heat load B input could obtain a high threshold critical power of TSHP-1.
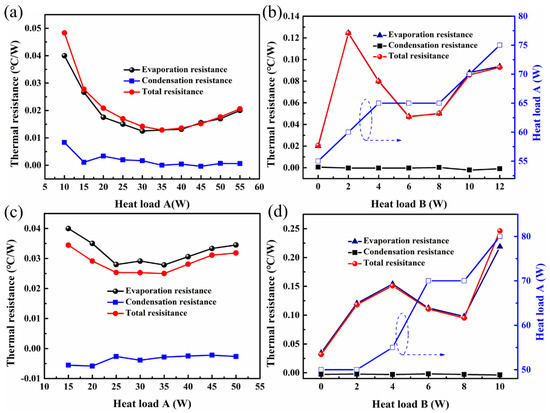
Figure 9.
(a) The thermal resistance of TSHP-1 with different heat load A from 10 W to 55 W; (b) the thermal resistance of TSHP-1 with different heat load B from 0 to 12 W under a certain heat load A input of 45 W; (c) the thermal resistance of TGHP-1 with different heat load A from 15 W to 50 W; (d) the thermal resistance of TGHP-1 with different heat load B from 0 to 10 W.
4. Conclusions
In this work, the addition of heat load B was adopted to obtain a higher threshold critical power for the heat pipe systems. Two kinds of heat pipes, including thermal switch heat pipe (TSHP) and traditional grooved heat pipe (TGHP), were investigated experimentally, respectively. The thermal performance of TSHP and TGHP was also investigated experimentally, including the threshold critical power, starting characteristic, recovery characteristic, surface temperature distribution, thermal resistance, etc. The optimized TSHP exhibited a larger threshold critical power range with low heat load B input (from 55 W to 65 W, almost 20% increase), low starting heat load B input (2 W), good recovery characteristic (less than 150 s at 75 °C after overload), low thermal resistance with heat load B input (less than 0.13 °C/W). These results indicate that the optimized TSHP can offer great potential for the overload operation situation with the addition of heat load B. Moreover, the addition of heat load B provides another method for adjusting the steam pressure distribution along the necking heat pipe to obtain a better heat pipe system of overload, stability, and low thermal resistance. Such distinction between primary and additional heat sources in the experimental investigations of multiple heat source systems can also provide a method for thermal resistance adjustment. Furthermore, the variable cross-section of the heat pipe can provide another method for adjusting steam pressure and thermal resistance of it. Such a novel necking heat pipe is very suitable and has the potential for a real situation where the waste heat of a low-power chip can be utilized to drive a high-power chip working under the overload situation on the same circuit board. Moreover, the addition of an extra heat load or condensation module can be utilized in the heat pipe systems to obtain different thermal performances for complicated working situations, especially the overload operation.
Author Contributions
J.L.: Conceptualization, Investigation, Methodology, Writing—original draft. S.Z.: Data curation, Writing—review and editing. H.T.: Investigation, Visualization. Y.L.: Visualization, Writing—review and editing. S.W.: Supervision. G.Z.: Writing—review and editing. Y.T.: Resources, Writing—review and editing, Funding acquisition. All authors have read and agreed to the published version of the manuscript.
Funding
This work was supported by the National Natural Science Foundation of China (No. 52105444, No. 51735004), Natural Science Foundation of Guangdong Province (2022A1515010375), S&T Innovation Projects of Zhuhai City (ZH01110405180034PWC) and Foshan Science and Technology Innovation Project (1920001000339).
Institutional Review Board Statement
Not applicable.
Informed Consent Statement
Not applicable.
Data Availability Statement
Not applicable.
Conflicts of Interest
The authors declare no conflict of interest.
Nomenclature and Abbreviation
| TSHP | thermal switch heat pipe |
| TGHP | traditional grooved heat pipe |
| NEVs | new energy vehicles |
| l | pipe length (mm) |
| lo | necking length (mm) |
| dn | necking diameter (mm) |
| di | pipe outer diameter (mm) |
| do | pipe inner diameter (mm) |
| h | groove depth (mm) |
| m | groove width (mm) |
| n | number of grooves |
| thermal resistance (°C/W) | |
| surface temperature difference (°C) | |
| surface temperature of the evaporation section (°C) | |
| surface temperature of the condensation section (°C) | |
| heat load input (W) |
References
- Xu, Y.C.; Chen, Q. Minimization of Mass for Heat Exchanger Networks in Spacecrafts Based on the Entransy Dissipation Theory. Int. J. Heat Mass Transf. 2012, 55, 5148–5156. [Google Scholar] [CrossRef]
- Zhao, Y.; Chang, S.; Yang, B.; Zhang, W.; Leng, M. Experimental Study on the Thermal Performance of Loop Heat Pipe for the Aircraft Anti-Icing System. Int. J. Heat Mass Transf. 2017, 111, 795–803. [Google Scholar] [CrossRef]
- Qian, C.; Gheitaghy, A.M.; Fan, J.; Tang, H.; Sun, B.; Ye, H.; Zhang, G. Thermal Management on IGBT Power Electronic Devices and Modules. IEEE Access 2018, 6, 12868–12884. [Google Scholar] [CrossRef]
- Joshi, Y.K.; Garimella, S.V. Thermal Challenges in next Generation Electronic Systems. Microelectron. J. 2003, 34, 169. [Google Scholar] [CrossRef]
- Garimella, S.V.; Fleischer, A.S.; Murthy, J.Y.; Keshavarzi, A.; Prasher, R.; Patel, C.; Bhavnani, S.H.; Venkatasubramanian, R.; Mahajan, R.; Joshi, Y.; et al. Thermal Challenges in Next-Generation Electronic Systems. IEEE Trans. Compon. Packag. Technol. 2008, 31, 801–815. [Google Scholar] [CrossRef]
- Jaguemont, J.; Van Mierlo, J. A Comprehensive Review of Future Thermal Management Systems for Battery-Electrified Vehicles. J. Energy Storage 2020, 31, 101551. [Google Scholar] [CrossRef]
- Kim, J.; Oh, J.; Lee, H. Review on Battery Thermal Management System for Electric Vehicles. Appl. Therm. Eng. 2019, 149, 192–212. [Google Scholar] [CrossRef]
- Chu, R.C.; Simons, R.E.; Ellsworth, M.J.; Schmidt, R.R.; Cozzolino, V. Review of Cooling Technologies for Computer Products. IEEE Trans. Device Mater. Reliab. 2004, 4, 568–585. [Google Scholar] [CrossRef]
- Filippin, F. Do Main Paths Reflect Technological Trajectories? Applying Main Path Analysis to the Semiconductor Manufacturing Industry. Scientometrics 2021, 126, 6443–6477. [Google Scholar] [CrossRef]
- Lu, Z.; Salamon, T.R.; Narayanan, S.; Bagnall, K.R.; Hanks, D.F.; Antao, D.S.; Barabadi, B.; Sircar, J.; Simon, M.E.; Wang, E.N. Design and Modeling of Membrane-Based Evaporative Cooling Devices for Thermal Management of High Heat Fluxes. IEEE Trans. Compon. Packag. Manuf. Technol. 2016, 6, 1056–1065. [Google Scholar] [CrossRef]
- Stagi, L.; Ren, J.; Innocenzi, P. From 2-D to 0-D Boron Nitride Materials, The Next Challenge. Materials 2019, 12, 3905. [Google Scholar] [CrossRef] [PubMed]
- Cai, Q.; Scullion, D.; Gan, W.; Falin, A.; Cizek, P.; Liu, S.; Edgar, J.H.; Liu, R.; Cowie, B.C.C.; Santos, E.J.G.; et al. Outstanding Thermal Conductivity of Single Atomic Layer Isotope-Modified Boron Nitride. Phys. Rev. Lett. 2020, 125, 085902. [Google Scholar] [CrossRef]
- Zhang, S.; Chen, G.; Jiang, X.; Li, Y.; Waqar Ali Shah, S.; Tang, Y.; Wang, Z.; Pan, C. Hierarchical Gradient Mesh Surfaces for Superior Boiling Heat Transfer. Appl. Therm. Eng. 2023, 219, 119513. [Google Scholar] [CrossRef]
- Siricharoenpanich, A.; Wiriyasart, S.; Srichat, A.; Naphon, P. Thermal Management System of CPU Cooling with a Novel Short Heat Pipe Cooling System. Case Stud. Therm. Eng. 2019, 15, 100545. [Google Scholar] [CrossRef]
- Jafari, D.; Wits, W.W.; Geurts, B.J. Phase Change Heat Transfer Characteristics of an Additively Manufactured Wick for Heat Pipe Applications. Appl. Therm. Eng. 2020, 168, 114890. [Google Scholar] [CrossRef]
- Fan, Y.; Bao, Y.; Ling, C.; Chu, Y.; Tan, X.; Yang, S. Experimental Study on the Thermal Management Performance of Air Cooling for High Energy Density Cylindrical Lithium-Ion Batteries. Appl. Therm. Eng. 2019, 155, 96–109. [Google Scholar] [CrossRef]
- Wang, N.; Li, C.; Li, W.; Huang, M.; Qi, D. Effect Analysis on Performance Enhancement of a Novel Air Cooling Battery Thermal Management System with Spoilers. Appl. Therm. Eng. 2021, 192, 116932. [Google Scholar] [CrossRef]
- Shang, Z.; Qi, H.; Liu, X.; Ouyang, C.; Wang, Y. Structural Optimization of Lithium-Ion Battery for Improving Thermal Performance Based on a Liquid Cooling System. Int. J. Heat Mass Transf. 2019, 130, 33–41. [Google Scholar] [CrossRef]
- Li, J.; Zhang, H. Thermal Characteristics of Power Battery Module with Composite Phase Change Material and External Liquid Cooling. Int. J. Heat Mass Transf. 2020, 156, 119820. [Google Scholar] [CrossRef]
- Do, K.H.; Kim, S.J.; Garimella, S.V. A Mathematical Model for Analyzing the Thermal Characteristics of a Flat Micro Heat Pipe with a Grooved Wick. Int. J. Heat Mass Transf. 2008, 51, 4637–4650. [Google Scholar] [CrossRef]
- Subedi, B.; Kim, S.H.; Jang, S.P.; Kedzierski, M.A. Effect of Mesh Wick Geometry on the Maximum Heat Transfer Rate of Flat-Micro Heat Pipes with Multi-Heat Sources and Sinks. Int. J. Heat Mass Transf. 2019, 131, 537–545. [Google Scholar] [CrossRef]
- Revellin, R.; Rullière, R.; Lefèvre, F.; Bonjour, J. Experimental Validation of an Analytical Model for Predicting the Thermal and Hydrodynamic Capabilities of Flat Micro Heat Pipes. Appl. Therm. Eng. 2009, 29, 1114–1122. [Google Scholar] [CrossRef]
- Cai, Y.; Li, Z.; Zhai, J.; Tang, Y.; Yu, B. Experimental Investigation on a Novel Multi-Branch Heat Pipe for Multi-Heat Source Electronics. Int. J. Heat Mass Transf. 2017, 104, 467–477. [Google Scholar] [CrossRef]
- Zhong, G.; Ding, X.; Tang, Y.; Yu, S.; Chen, G.; Tang, H.; Li, Z. Various Orientations Research on Thermal Performance of Novel Multi-Branch Heat Pipes with Different Sintered Wicks. Energy Convers. Manag. 2018, 166, 512–521. [Google Scholar] [CrossRef]
- Tang, H.; Tang, Y.; Li, J.; Sun, Y.; Liang, G.; Peng, R. Experimental Investigation of the Thermal Performance of Heat Pipe with Multi-Heat Source and Double-End Cooling. Appl. Therm. Eng. 2018, 131, 159–166. [Google Scholar] [CrossRef]
- Han, X.; Wang, Y.; Liang, Q. Investigation of the Thermal Performance of a Novel Flat Heat Pipe Sink with Multiple Heat Sources. Int. Commun. Heat Mass Transf. 2018, 94, 71–76. [Google Scholar] [CrossRef]
- Solomon, A.B.; Ram Kumar, A.M.; Ramachandran, K.; Pillai, B.C.; Senthil Kumar, C.; Sharifpur, M.; Meyer, J.P. Characterisation of a Grooved Heat Pipe with an Anodised Surface. Heat Mass Transf. 2017, 53, 753–763. [Google Scholar] [CrossRef]
- Anderson, A.M. Experimental Methods for Engineers. Exp. Therm. Fluid Sci. 1994, 9, 250. [Google Scholar] [CrossRef]
- Kline, S.; McClintock, F. Describing Uncertainties in Single-Sample Experiments. Mech. Eng. 1953, 75, 3–8. [Google Scholar]
- Moffat, R.J. Describing the Uncertainties in Experimental Results. Exp. Therm. Fluid Sci. 1988, 1, 3–17. [Google Scholar] [CrossRef]


Publisher’s Note: MDPI stays neutral with regard to jurisdictional claims in published maps and institutional affiliations. |
© 2022 by the authors. Licensee MDPI, Basel, Switzerland. This article is an open access article distributed under the terms and conditions of the Creative Commons Attribution (CC BY) license (https://creativecommons.org/licenses/by/4.0/).