1. Introduction
Controlling the stress–strain state of structures is important when high-rise buildings are put into operation. It is the uneven settlement of the foundation that leads to the cracking of the base of the building and its walls, and this can cause significant consequences. Simulation methods based on full design gravity load indeed demonstrate the distribution of deformation; however, they are used for predicting and preliminarily assessing the impact of loads on the building but cannot transmit the actual condition. Buranbayeva et al. [
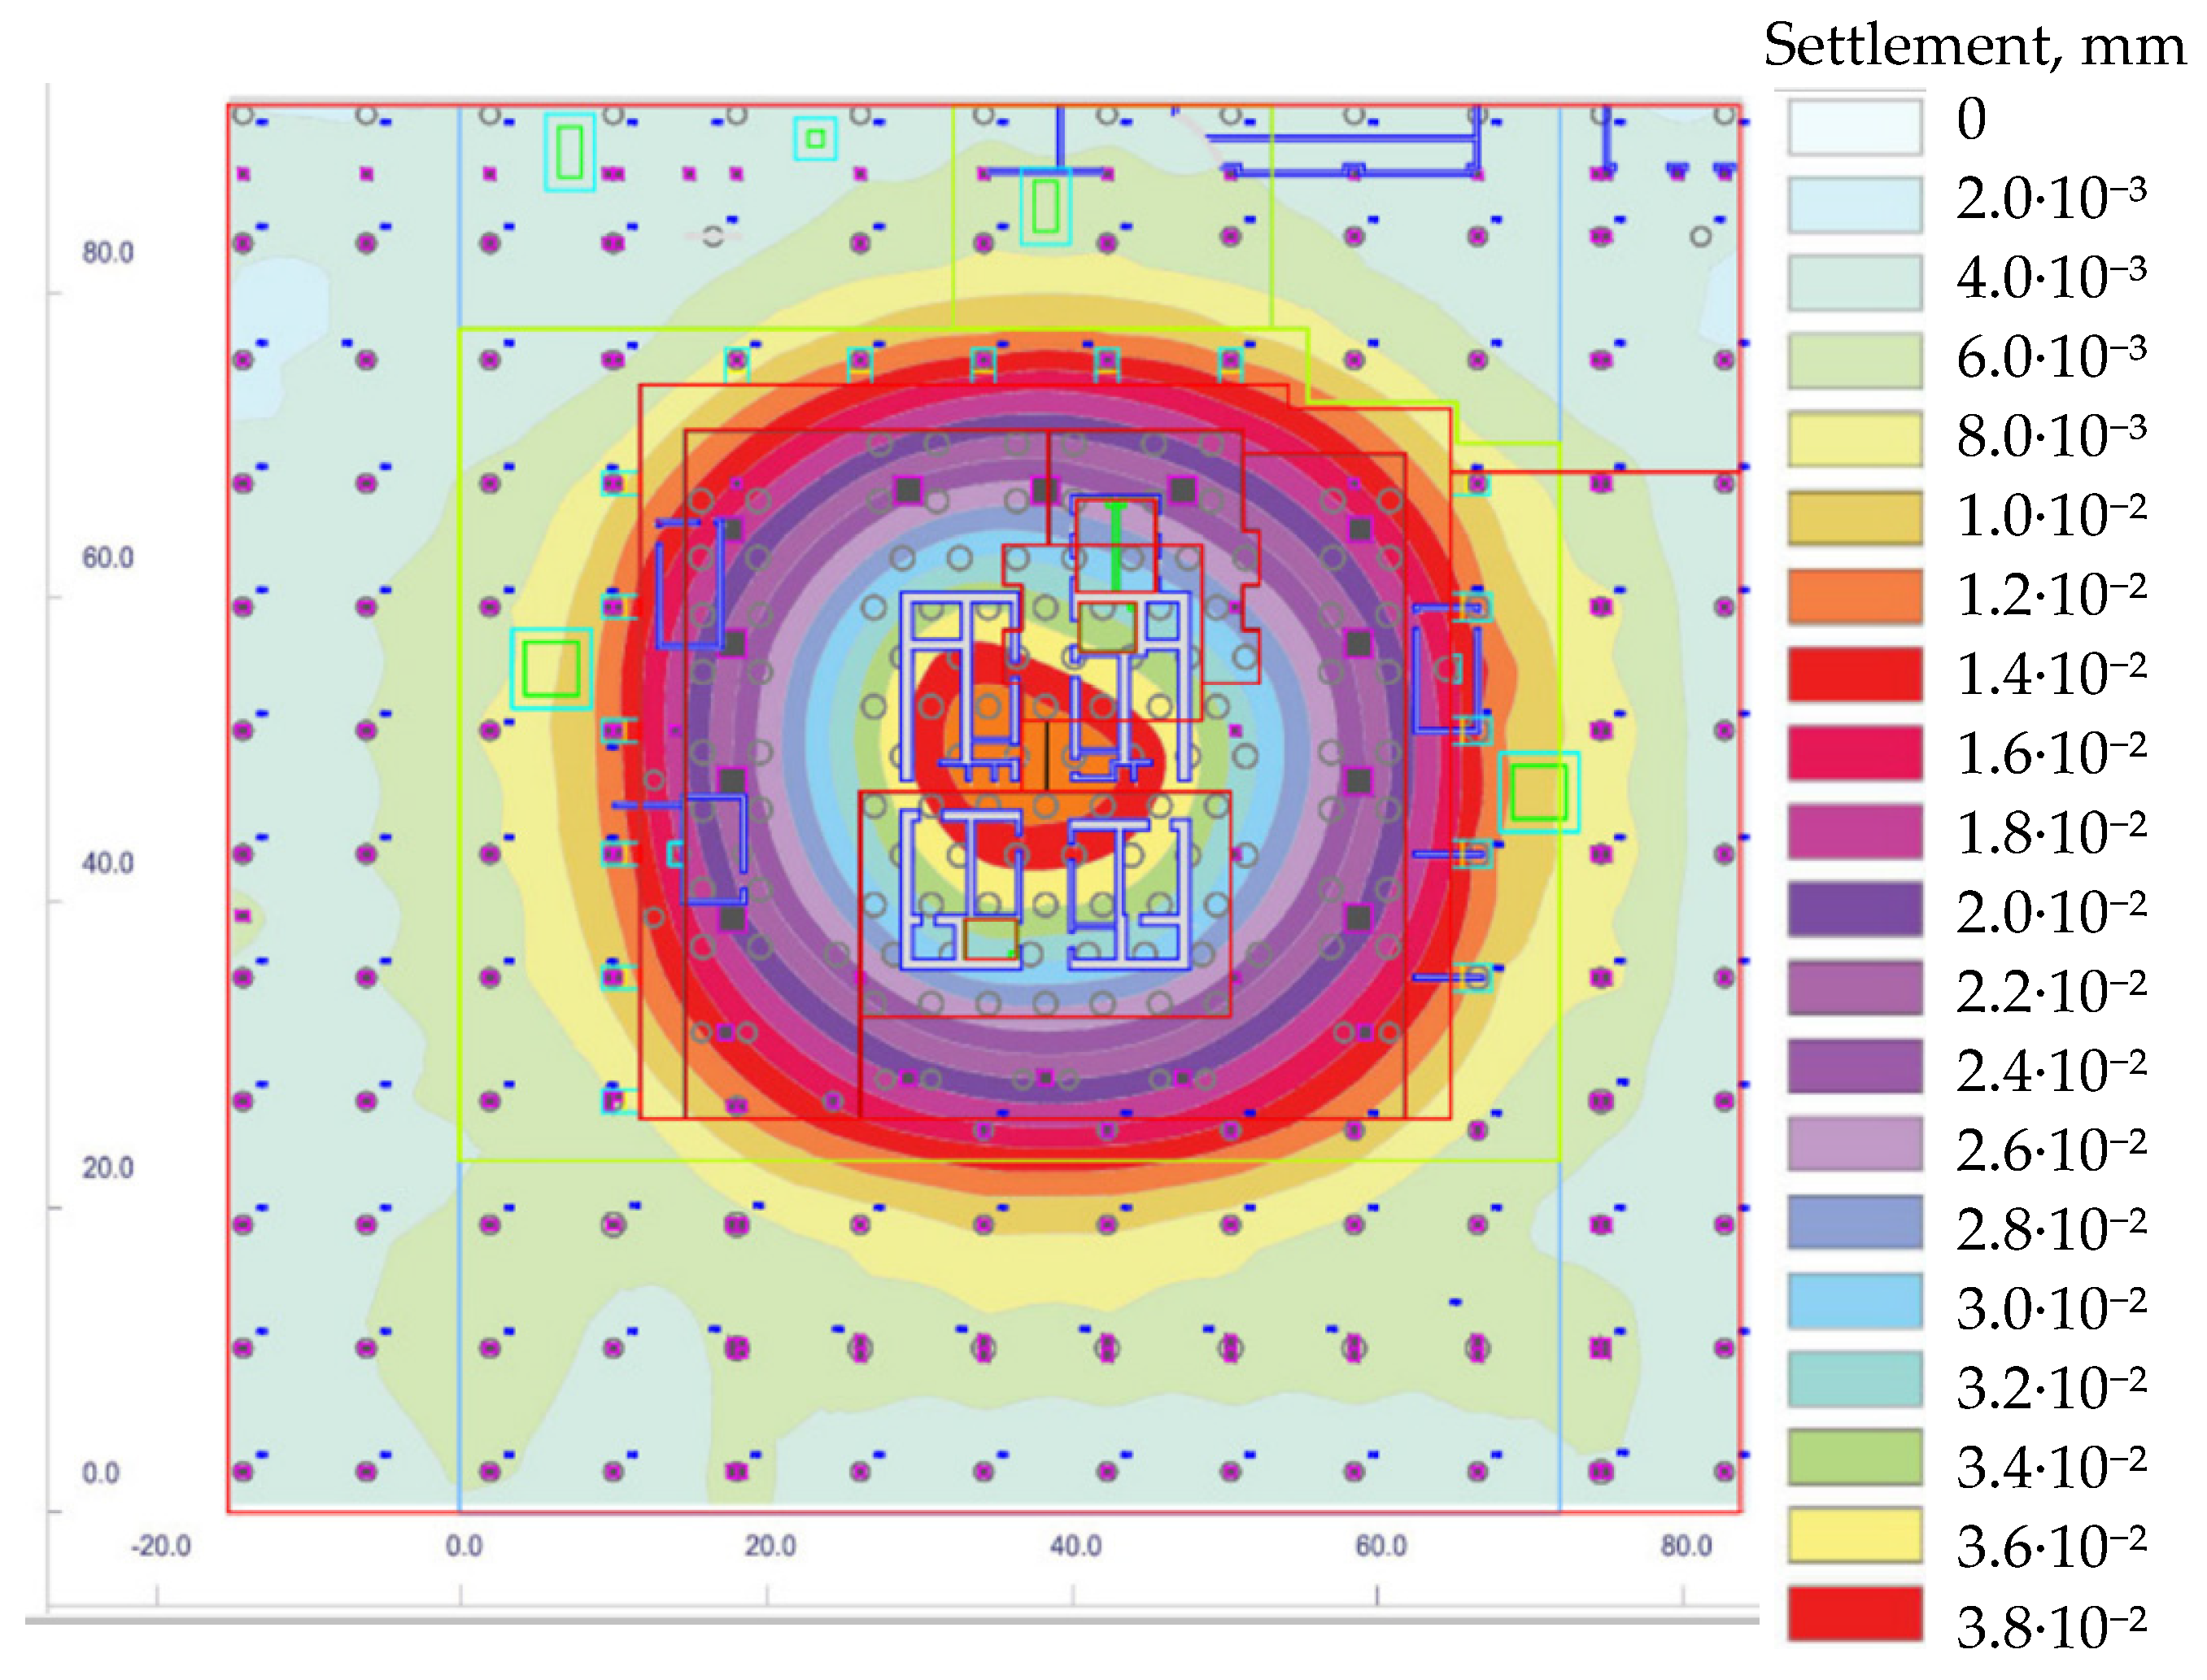
1] using the geotechnical analysis of raft and piles (GARP) program for modelling the loading-determined Deformation Contours of Basements (Raft Foundation) on a 75-storey tower in Abu-Dhabi Plaza complex in Astana city (Kazakhstan). According to the analysis of basement raft deformations, the maximum settlement of the core of the building reached 39.6 mm, while for columns around the perimeter, it was only 13.4 mm (
Figure 1). The settlement at each construction stage was calculated using the ratio of the vertical reaction at each stage to the vertical reaction at full design load using finite element analysis. The interaction between soils and piles and the stiffness parameters were established by using the GARP software.
Zhussupbekov et al. [
2] presented the results of the modelling of the same Abu-Dhabi Plaza high-rise building block with FLAC 3D program. According to the results, the estimated settlement for the core was 37.4 mm, while for columns it was 14 mm (
Figure 2).
Both simulation methods showed a similar pattern of radial load and settlement distribution, with the greatest influence at the center of the building. In order to determine the actual data on the strain–stress state of the basement raft area of the aforementioned high-rise building, the results of monitoring using fiber optics during the initial stage of building operation were considered. The results of the preliminary simulation helped to determine the placement of the fiber optic cable on the floor plan. The purpose of monitoring with the use of fiber optics was to observe the durability of concrete over time since the depth of the pit was significantly lower than the groundwater level, and the formation of cracks in concrete would allow water to penetrate them.
Fiber optics (FO) became an alternative instrumental method for monitoring deformation and tracking maximum allowable stresses in building structures [
3]. Even though fiber optics have been used for diverse purposes in many industries for a long time, the use of fiber optic cables as a strain sensing tool began relatively recently [
4]. Over the course of several decades, a breakthrough was made not only in improving the quality of the fiber and reducing the losses in the transmission of a light pulse, but also in significantly reducing its market value. An advantage of using optical fibers (OF) as a measuring body is energy passivity and intrinsic safety, because the light energy transmitted through the fiber is at or below a certain level of a power capable igniting explosive atmospheres [
5,
6]. In addition, fiber optic cables are not affected by noise and electromagnetic interference common in various industries [
6,
7]. The system for monitoring defects and damages of reinforced concrete foundations is based on the use of optical fibers of the G.652 standard. The main advantage of the fiber optic strain gauge is that, being distributed over a large area, it allows monitoring the stress–strain relationship of a huge number of points using only one optical fiber cable [
3,
4,
6]. Optical fibers are a transparent core surrounded by a transparent cladding material with a lower refractive index. Light is contained in the core by total internal reflection, which causes the fiber to act as a waveguide and carry complete information from the source to the receiver [
7]. However, the interpretation of the results and explanation of the development of strain would confuse even experienced engineers [
8], as a characteristic feature is the frequent alternation of signs of the strain passing along the length of the wire from compression to tension and vice versa [
8,
9].
There are several cases of fiber optic measurement application for monitoring the high-rise buildings in different parts of the world. In 2008, an 18-story Dongsheng Garden A5 building, located in Fushan Bay Area (Qingdao, China), was monitored during the construction period to analyze temperature and strain change in the vertical underground column and the first floor beam during the pouring and curing of concrete and the construction of subsequent upper floors of the building [
10]. The structure health monitoring a group of columns of a high-rise building in Punggol EC26 (Singapore) was carried out in order to fix uneven settlement using long-gauge fiber optic sensors [
11]. Distributed fiber optic cable was embedded in a 51 m long cast-in-place pile at a high-rise building construction site in London. A parametric study was conducted to examine the sensitivity of concrete and soil thermal properties on estimating the pile geometry [
12]. All these examples demonstrate the local use of a fiber optic cable to monitor a structural element, while a comprehensive study is complicated by the difficulty of introducing the cable and the high risk of damage when pouring concrete. The more difficult aspect is the explanation and interpretation of the obtained results for the entire structure.
This paper presents the results of the implementation of fiber optics to monitor the state of the raft pile foundations of a high-rise building using the example of Abu-Dhabi Plaza in Astana city and analyzes the results obtained.
2. Materials and Methods
The site of the experiment was in Astana city, in the basement of the tallest building complex in Central Asia—Abu Dhabi Plaza, 320 m high. Abu Dhabi Plaza is a complex high-rise building with a retail and leisure podium and a hotel cluster at the base that rises to form a series of office and residential towers to the north—a creation of the famous British architect Norman Foster (
Figure 3).
The tower’s wind loads fluctuate depending on wind speed, wind direction, and local effects such as swirls. The ambient temperature during the measurement of the tower settlement was recorded to ensure normalization of the results. The measured data had to be collected to minimize the effect of temperature effects throughout the tower and to limit the effect of localized heating, the effect of solar warm amplification, and the settlement of the sun during the day. Localized temperature control was considered in specific work sites below the working front. Structural elements in unloaded floors opened to the environment were considered at ambient temperature during the collection of these readings. Hydrostatic pressure under the raft foundation was not considered. Ground conditions are presented in
Table 1 and correspond to the conditions of zone 4 of the city of Astana [
13]. The engineering geological profile of the construction site is presented in
Figure 4. A detailed description of foundation casting technology during the construction is presented by Zhussupbekov et al. [
14].
Block R is the tallest building in the complex and is a 75-storey residential building with a 4-storey underground parking at the base. The foundation structure of the building consists of a pile raft, including Auger Cast Piles of 1125 m and boring piles with a diameter of 1.2 to 1.5 m. The length of the piles varies depending on the height of blocks, from 13 to 25 m, of high-strength concrete with an exposure durability of 40 MPa. The raft is built form the C28/35 concrete. The maximum design excavation level for the construction of a raft for block R was −19.30 m. The basement floors consist of 4 levels from B1 to B4.
On the B1 level there is an analyzer of the monitoring system for temperature and strain data collected via a distributed fiber optic strain sensing system (DFOSS) on the B4 level (
Figure 5). The direction of data reading is shown by arrows. The applied DFOSS system transmits the signal via a grid of fiber optic cable to the B4 raft linked to an analyzer located in a temperature- and humidity-controlled room at the B1 level. The transmission process is based on the backscattering of light, which is transmitted through an optical fiber almost without loss. The basis of backscattered light is produced by Brillouin scattering [
15]. The frequency of Brillouin backscattering of light at any point along the length of the fiber depends on the strain and temperature at that point. Thus, given that the optical fiber transmits light pulses in full, by analyzing the frequency of backscattered light, it is possible to accurately determine the effects of temperature and deformation anywhere along the fiber.
Brillouin frequency shift
is proportional to the local velocity of the acoustic waves.
where
n is the refractive index of the fiber core,
is the velocity of sound in glass and
λ is the free-space wavelength.
Changes in strain and temperature are obtained by calculating the difference between the backscattered Brillouin frequency shift measured at different times, so Equation (1) can be extended into the following form using the temperature and strain conversional coefficients (
Cε and
CT).
where
is the Brillouin frequency shift at location
z,
is the original Brillouin frequency shift,
ε(
z) is the strain change, and
T(
z) is the temperature change. The location
z where Brillouin backscattering happens is determined as a function of time
t with known light velocity
in a vacuum:
The proposed layout for the fiber optic cable on the base raft as illustrated in
Figure 6 was made according to the results of the preliminary simulation to cover the areas expected to have the greatest settlement and based upon an eight-meter grid spacing. However, there are areas, especially around the core of block R, where the distance is well over eight meters. For any point on the raft within the core, the greatest distance between that point and the nearest fiber optic cable is approximately six meters, corresponding to an equivalent grid spacing of 12 m. The routing generally maintains a half-meter separation between the channel and vertical reinforced concrete elements, such as walls and columns. The cores at Blocks Y and Z are constructed adjacent to ramps connecting to the B3 level, and the fiber optic cable routing avoids these ramped areas. The routing also avoids penetrating reinforced concrete walls, but in places the cable passes beneath blockwork walls. In these places, the blocks immediately above the channel used to be temporarily removed to enable access for both cutting the channel and passing the cable reel through the gap in the wall. To reduce the number of additional connections, the reel used to be passed through the blockwork wall wherever possible, and no additional connections were made. Between levels B1 and B4, as well as between the Block R observation zone and the riser, there is a conduit containing two cables: one cable routes the light from the analyzer into the monitoring zone, whilst the other routes the light back to the analyzer. The total length of the fiber optic cable on the tested sections was 2153 m, on which 2261 m of reels were used to avoid kinks when turning (
Figure 6). The distance range is the maximum distance along the cable from the analyzer where a measurement is required and is equal to 2040 m. A light tension was applied to the cable by pulling the cable taut before being locked down at the fixing points so that it could register compressive strains along the gauge lengths. The total optical loss is estimated in
Figure 6 to be 11.0 dB and assumes the following:
- -
cable lengths and connectivity;
- -
a total fiber length of 4.4 km, including both the strain and temperature-measuring fibers running in parallel within the same cable;
- -
unit attenuations;
- -
the use of connectors rather than splices to join two fiber ends on site.
To maintain the structural integrity of the basement raft, no part of the cable installation interfered with the top reinforcement of the raft, the cover of which is 40 mm, and 25 mm–deep channels are shallow enough to clear the reinforcement (
Figure 7). The minimum bending radius of the fiber optic cable during installation was 400 mm. Each cable section was tested after laying and fixing the cable with optical time domain reflectometry (OTDR) for cable integrity before any channels were infilled with cement mortar, allowing any breakages or localized losses arising from fiber damage to be rectified [
13,
16,
17].
Two different tests for the whole circuit were performed for the measurement precision error once the entire circuit installation was complete. One of the most important factors causing precision error is the thermal shift in the electronic components within the analyzer. Therefore, in the first test the analyzer was kept continuously on, whilst in the second test the analyzer was powered off after each reading.
3. Results
Particular emphasis in obtaining the results of the fiber optics was given to high-rise blocks, namely block R where, as expected, the highest strain values of the fiber optic cable were obtained.
was found as 1.113 MHz/°C, and
Cε was equal to 0.054 MHz/με. At the time of the measurements, the temperature field distribution was relatively stable and varied within +4 to +8 °C over the entire area of the B4 level of block R (
Figure 8). The location of areas with lower temperatures in the center of the building along the load-bearing walls of the core is explained by the greater thermal conductivity of reinforced concrete structures. Considering the depth of the raft at −19 m and the allocation of the block R in the middle of the complex of buildings, the ambient temperature did not affect to the results of the FO strain measurements during recording. Considering that the measurements were taken in February 2022, as well as the cold climate of Astana, the data obtained from the temperature field in
Figure 8 correspond to the expected results.
Figure 9 represents a strain fluctuation along the fiber optic cable from 115 m to 615 m in length in the Y direction layout under the R block, embedded in the B4 level raft. The vertical axis represents the strain in the cable in µε: positive values in tension, negative values in compression. The horizontal axis determines the position along the length of the fiber optic. In this case, the location of the cable along the Y axis in the high-rise block basement raft starts from 115 m, and the length is 567 m.
Figure 10 shows the results of the strain for the fiber optic cable for R block in the back direction, i.e., after bypassing the Z and Y blocks, embedded in the horizontal X direction in the section from 1334 m to 1934 m. Here, the significant compression strains recorded in the sections were from 1379 m to 1499 m and from 1715 to 1948, and significant tension strain was seen in the area on the south side of the block R building with less load applied.
As can be seen in
Figure 11, the fiber optic results show alternating strain signs along the length of the fiber optic cable embedded in the raft of the lowest level, B4, of block R. Compression deformations prevail in the central part of the building core, in the zone of increased load from the reinforced concrete load-bearing walls. Tensile deformations are most focused on the extreme axes, as well as near the joints of the columns. The interpretation of compression zones by values is shown in
Figure 12 and tensile zones in
Figure 13.
Tension zones according to
Figure 13 are evenly distributed over values from −20 to −40 µε, with a slight predominance on the right (east) side of the building. Individual spots of −40 to −60 µε are occasionally located along the outer contour of the building. The center, north, and east parts of the building have more stable patterns of accumulation of tensile stresses.
4. Numerical Modeling
Numerical modeling for the R block using Plaxis 3D software to determine the horizontal and vertical deformations of the raft was performed. Modeling was designed for the 3.8 m thick raft within axes 12 to 19 in the Y-direction and axes C to K in X-direction.
Figure 14 shows the loading system on a reinforced concrete square-section raft podium with a side length of 72.9 m. The load transmitted from the columns at floor level B4 was represented by a point load (indicated in the figure with a blue circle), and from the walls of the core of the building as a linearly distributed load along the axis of the walls of the core (indicated as a blue line).
The columns had a different loading area and, accordingly, a different load, and therefore in
Figure 14b they have a different size of the arrow designation, depending on the magnitude of the applied load. The mesh was designed by software, and total dead and live load were applied at the final stage. The weather conditions were not considered in this simulation. The design soil parameters were taken from
Table 1.
Settlement in vertical direction at the raft surface level indicated the maximum displacement at the center of the core and was equal to 38 mm (
Figure 15). The smallest settlement of the column in the circle surrounding the building core was 14 mm at a distance of 26 m from the center of the core. The differential settlement was 24 mm in the horizontal plane.
Horizontal displacement at the surface level of the raft in block R ranges from 1 mm to −1 mm in the X-direction (
Figure 16). The sign of displacement alternates from tension to compression and corresponds to 1 mm deformation per 36 m, which is half of the building width. Thus, according to the results of Plaxis 3D modeling, the largest difference in the vertical displacement was 24 mm, and in the horizontal plane 1 mm within a distance from the center of the core up to 30 m. When determining the relative deformation in the horizontal plane, such a displacement is negligibly small and is less than 1 με. The distribution of deformations in the X- and Y-direction is presented gradually with smooth transitions and does not display point loads from columns.
5. Discussion
The simulation results represent a general picture of the distribution of settlements in the building plan; they do not take into account local effects from the concentrated load from columns and core walls and also do not detail the horizontal plane exactly where the points of dangerous tensile deformation are located. Since concrete does not work well in tension, the local tension of concrete is fraught with crack formation. WFO observations showed increased relative deformations near the zones of concentrated loads (columns) up to 80 με (0.8 mm per 1 m length) in the horizontal plane. In
Figure 17, single scattered tensile strain points are located in the immediate vicinity of the column and are explained by the tension of the upper part of the raft. Concrete in the places where the column is supported is subjected to compression because of a point load from the upper floors. The top layer of the raft near the column-raft joint is a subject of deflection. Since the optical fiber is located in the upper layers, it undergoes tension in this place. However, in the middle of the deflection zone, the cable is subjected to compression.
In the middle part of the flight, where the spread load is applied, the raft plain is evenly compressed and leads the compression strain of the fiber optic cable. Similarly, compressive stress occurs in the immediate area of the building core with the increased load from the core walls. The increased settlement (negative displacement in Z axis) of the R building core, with a slight focus on the northern part of the building, is also confirmed by the results of computer simulation in the articles by Buranbayeva et al. [
1]. Zhussupbekov et al. [
2] presented the results of foundation settlement in computer simulation symmetrically to the contour of the building, finding a maximum in the center with a gradual decrease along the edges.
According to Buranbayeva et al., in GARP (Geotechnical analysis on raft and piles) simulation the maximum settlement of the core was 39.6 mm, and the minimum was in the surrounding columns, at 13.4 mm (
Figure 1). So, the differential settlement between the core walls in the middle and the columns by the perimeter of block R is 26 mm, and the distance in horizontal plane is 26.31 m. The values of tensile strain in the horizontal plane are negligible at less than 1 με.
The results of FLAC 3D simulation program (
Figure 2) show the core of the building reaches the settlement of 37 mm in the raft surface level. The least settled column around the core gains 14 mm of the settlement. So, the differential settlement is 23 mm, and the distance between the core and the least settled column is 20.25 m. With such values of settlement difference, the tensile strain in the horizontal plane in the upper layer of concrete would be less than 1 με (0.01 mm per 1 m length). However according to SHM, with fiber optic measurement tensile strains with the values varying between −20 to −40 με, compression from +20 to +40 με near the walls of the core was registered. Fiber optic cable measures the actual data of the concrete strain exactly in coordinates in the horizontal plane; nevertheless, the pre-simulated modelling shows the most appropriate location for laying the fiber optic cable for further measurement. The simulation shows the overall picture of the settlement of buildings in the plan and omits local effects from the concentrated load of the columns.
In the considered case, the fiber optic cable layout was placed according to the results of the preliminary simulation to cover the areas expected to have the most subsidence. The results of the fiber optic monitoring were aimed at determining areas at risk of cracking in concrete and not at measuring the settlement. The main difference from the results of previous simulations and forecasts on various computer programs on this object [
1,
2] is that the simulation considered vertical deformations perpendicular to the loading area, depending on the loading of the building and compression characteristics of the soils. Fiber optics transmit the actual stress–strain interaction results along the length of the cable, that is, in the horizontal plane of raft B4, resting directly on the ground and indicating the current state of the structure. It should be noted that the weather and changing ground conditions in seasonally frozen soils also have an effect, and therefore fiber optic measurements are the source of the most reliable data. The resulting vertical settlement distribution cannot be verified by the fiber optic method; however, the frequent transition of zones of compressive and tensile stresses obtained using fiber optic monitoring indicates local areas of uneven loading and indicates a high risk of crack formation in concrete. The excess of deformations of 600 με or 6 mm m
−1 requires a local diagnostic examination, including surveying with concrete sampling and testing for strength characteristics. At the time of testing, the obtained data did not exceed the allowable values; however, they characterize the general picture of the strain in the raft plane.


