Article

Research on the Spatiotemporal Evolution of the Patterns of Expressed Inferiority in Different Groups of Occupations and Education Stages

1
Research Institute for Smart Cities & Shenzhen Key Laboratory of Spatial Information Smart Sensing and Services, Shenzhen University, Shenzhen 518060, China
2
Institute of Environment and Development, Guangdong Academy of Social Sciences, Guangzhou 510635, China
3
Key Laboratory of Urban Land Resources Monitoring and Simulation, Ministry of Natural Resources, Shenzhen 518034, China
4
Peng Cheng Laboratory, Shenzhen 518055, China
5
School of Resource and Environmental Sciences, Wuhan University, Wuhan 430079, China
*
Author to whom correspondence should be addressed.
Appl. Sci. 2022, 12(22), 11735; https://doi.org/10.3390/app122211735
Submission received: 8 August 2022 / Revised: 25 October 2022 / Accepted: 15 November 2022 / Published: 18 November 2022
(This article belongs to the Special Issue Recent Advances in Geospatial Big Data Mining)

Abstract

:
Inferiority is a complex emotion of helplessness and self-deprecation. A lack of timely and effective treatment may cause serious consequences to people who experience inferiority. People with different occupational and educational backgrounds display different patterns of inferiority. Due to privacy issues, individuals who experience inferiority are often reluctant to seek face-to-face help. However, they often spontaneously share their feelings on social media, so social media can provide a large number of data on inferiority. Based on the data from Sina Weibo, the largest social media in China, this study explores the groups that are most affected by inferiority and reveals the spatiotemporal patterns of inferiority groups with different occupational and educational backgrounds based on the data from Sina Weibo, the largest social media in China. In this study, the Weibo data on inferiority-related topics published in 288 Chinese cities from 2012 to 2017 were collected, and the geospatial locations of the posts were extracted. The spatial variation of inferiority was analyzed, and the influence of the inferiority of people in different occupations and at education stages was examined. The results show that science and technology personnel, college students, and manufacturing workers are the groups most strongly affected by inferiority, and the expressed inferiority in the three groups show significant spatiotemporal non-stationarity. Excessive evaluation pressure increases the rate of inferiority among researchers and technicians, and inferiority among college students is increasing every year. In most areas in China, the increase in the density of manufacturing employees increases the risk of inferiority among these individuals. The findings of this study can help relevant organizations to better understand the regional distribution of inferiority and provide references for these organizations to develop regional treatment interventions for inferiority.

1. Introduction

Inferiority refers to individuals’ inferiority due to physiological or psychological defects or other shortcomings [1,2,3]. This can manifest as an underestimation of one’s abilities or qualities, which may further lead to depression and loneliness [4,5]. Previous research has shown that inferiority is significantly associated with world weariness, anger, depression, insomnia, and suicide [6,7,8]. Individuals who experience inferiority are prone to behavioral disorders, which may threaten social security [3,4,6,9]. Moreover, recent studies have found that inferiority is closely related to the incidence of death and poor quality of life [10,11]. Therefore, inferiority is not only a personal health problem, but it is also an important public health problem that affects the person’s quality of life as well as social security and economic development.
In the past hundred years, scholars have conducted extensive research on inferiority in psychiatry, psychology, and in other fields [1,6,9,10]. Their findings provide authoritative theoretical and clinical insights into the cognitive mechanism of inferiority. In addition, scholars have conducted research on the relationship between inferiority, social class, occupation, and education level over the past few decades. The results show that inferiority is affected by all of these factors, and there may be interactions among them [5,10,12,13,14]. For example, through a survey of 1540 people aged 16–90 years, Simons et al., (2017) found that social class perception had a significant effect on inferiority [15]. Kepalaite et al., (2015) explored the relationship between inferiority and the profession of teachers. Their results showed that inferiority is a source of stress for teachers, and stress is an important influencing factor of inferiority [13]. Yang et al., (2013) explored the characteristics of inferiority in junior high school students using a combination of questionnaires and experiments. Their results indicated that inferiority is common among junior middle school students, and there are significant differences according to their gender and grade [16]. However, as mentioned above, most of the existing research has been conducted by questionnaire surveys with limited groups of people. This method may entail concerns about the privacy of the respondents [7,13], who may not fill out the questionnaire truthfully. Furthermore, the sample size and questionnaire recovery rate are generally low [17,18]. In addition, questionnaire surveys inevitably have a high aggregation of the sample data, and it is difficult to increase the number of participants, which affects the reliability of the results and the scalability of the treatment strategy [19,20,21]. Therefore, it is necessary to adopt a passive, nonperceived, big data approach to better study individuals’ inferiority.
It is preferable to perform passive, nonperceived methods of understanding individuals who experience inferiority in targeted situations [7,18]. Fortunately, the rapid development of social media platforms, such as Twitter and Weibo, makes it possible for us to understand inferiority using such methods. Social media data have the advantage of not being limited by the sample size, time, and space, and they present the ability to eliminate a nonresponse bias [22,23]. As one of the largest and most popular social media platforms in China, Weibo has more than 500 million users, and its average daily posting volume exceeds 100 million [5,24]. Weibo posts are rich in content, and they are open to every user for discussion. Weibo has become an effective tool for people to express emotions and communicate with one another in a non-face-to-face format [14,17]. On the one hand, the anonymity of the users’ information makes Weibo an important community for many patients with psychological diseases to communicate their experiences and share their feelings [18,25,26]. On the other hand, a lot of information about individuals with psychological diseases, such as the time and their spatial location when they posted, and even the patients’ income, occupation, personality, and hobbies has been gathered via Weibo [7,19,27]. As the most populous country, China is also one of the countries with the most complete industrial, commercial, and educational systems in the world. The large number of employees and social media users in all of the industries can serve as a rich and massive data source for this study [28,29,30]. Through an analysis of the posts on inferiority using Chinese social media data, the temporal and spatial characteristics of inferiority among the employees in various industries and people at different educational stages worldwide can be revealed to make the experimental results more universal. Existing studies have demonstrated the value of Weibo data in the study of psychological or physiology-related diseases. Therefore, based on the Weibo data, this study explores the spatial characteristics of inferiority and its effects on different groups.
The main purpose of this study is to explore the spatial differences and changes in the people who experience inferiority at different occupational and educational stages and to reveal the spatial and temporal patterns of the people who experience inferiority at different occupational and educational stages. This study is different from previous studies on inferiority. The focus of this study is to explore the groups that are most affected by inferiority, and it reveals the spatiotemporal pattern of inferiority in groups with different occupational and educational backgrounds.
The significance of this study is as follows. Firstly, in the absence of clinical data that are provided by medical agencies, the results of this study can be used by relevant institutions to understand the spatial and temporal evolution of inferiority and the characteristics of the effects of inferiority on different groups. Secondly, when an authoritative data source (official data published by the government) can be obtained, the results of this study can be used to verify or refute the model’s predictions more objectively. Finally, the research methodology of this paper can provide a reference for other related studies. This paper includes a new attempt to apply social media data rather than personal surveys to obtain location-related information for public health purposes. The results of this paper provide not only a factual basis for future policy formulation in the public health sector, but also methodological references and theoretical support for the future research in this area.
This article is organized as follows: Section 2 introduces the data sources, the collection of the variables, and the data processing; Section 3 describes the characteristics of the study area; Section 4 introduces the research procedures and model specifications; Section 5 illustrates the experimental results; Section 6 analyzes the spatial change relationship of inferiority and its impact on three typical groups to offer policy recommendations. Finally, the study concludes with Section 7.

2. Data

In this study, it is necessary to build a mathematical model to explore the impact of the complexity of inferiority in people with different occupations and at different education stages, which requires dependent variables and evaluation variables. Therefore, in this section, we decompose the explanatory variables and evaluation variables to introduce the data.

2.1. Explanatory Variables

As a public dataset, Sina Weibo posts are used as an explanatory variable in this study. Specifically, during the registration process, the new users of Sina Weibo (also called Weibo) are informed that they can control the openness of their posts, and only public posts can be viewed and downloaded. Therefore, in this research, all of the Weibo posts we use are publicly visible.
The processing of the dependent variables is based on the data crawling procedure programmed by the Scrapy structure of Python, in which the key word “inferiority” was searched on Weibo between 2012 and 2017. There were 1,627,991 pieces of crawling data, which contained the content of the posts, the launch data, and information about the place, and the geographical location coordinates. Based on previous research, some posts that were initially downloaded were not relevant to this study, and the data cleaning had to be performed before we could proceed to the next step of the analysis. The specific workflow was as follows.
Firstly, this was a binary supervised classification problem; therefore, a training dataset was needed. However, to our knowledge, there is no such available dataset. Therefore, five researchers with a background in psychology marked random samples of 20,000 posts from 1,627,991 posts. Four of them were divided into two groups to read the posts and assess their relevance to inferiority. In cases of differing opinions, a fifth researcher participated in the discussion, and the posts were marked as per the principle of the minority obeying the majority.
Secondly, according to the data partitioning convention of machine learning, the labeled completed posts were divided into a training set, a validation set, and a test set consisting of 12,000, 4000, and 4000 posts, respectively. Since the support vector machine (SVM) is accurate for the Weibo classification [7,17,20], we chose the SVM to classify the data in this study. Additionally, the SVM was tested to identify the above dataset with an accuracy of 84.21%, which meets the classification accuracy requirement criteria.
Finally, 1,627,991 posts were classified using the SVM to identify the target posts. A total of 1,370,931 posts were identified as reflecting inferiority; among them, 48,725 posts with geographic coordinates (405 posts in 2012, 1932 posts in 2013, 2963 posts in 2014, 4613 posts in 2015, 14,954 posts in 2016, and 23,858 posts in 2017) were used for a further analysis. The overlay analysis and the statistical analysis of the extracted coordinate information and urban district vector graph of China indicated that the posts related to inferiority were posted in 288 cities. Taking the uneven population distribution into account, it was essential to correct the population distribution to prevent a deviation of the results. Considering the characteristics of the social media data, this paper used the ratio of the number of Weibo posts related to inferiority to the population of each region as the explanatory variable [20,24,28].

2.2. Evaluation Variable

According to previous studies, there is a strong correlation between the density of the people working in the same industry in a limited space and the inferiority of the people working in that industry [14,17,31,32,33]. Considering the data accessibility, the data that were used for the evaluation variables in this study were obtained from the China City Statistical Yearbook between 2012 and 2017, as shown in Table 1. We used the numbers of practitioners in the agriculture, manufacturing, and catering industries to measure the effect of inferiority on the practitioners in the primary, secondary, and tertiary industries, respectively. The number of practitioners in the scientific research and technical services was used to measure the effect of inferiority on scientific researchers. Additionally, the numbers of students in common higher education schools, secondary vocational education schools, and ordinary secondary schools were used to analyze the spatiotemporal characteristics of the students who experience inferiority at different education stages.

3. Study Area

Considering the data availability, 288 cities were selected as the study areas (Figure 1), most of which are southeast of the Heihe–Tengchong Line (Hu line) in China, where 96% of the Chinese population lives and 90% of China’s GDP is produced. Due to the lack of data availability, Hong Kong, Macau, Taiwan, Tibet, and other new cities were excluded.

4. Methods and Models

In this study, the gravity model was adopted to quantify the movement trajectory and the speed of inferiority to reveal the overall spatial change characteristics of the inferiority complex. The LMG model was adopted to measure the relative importance of the evaluation variables, so as to evaluate the significance of spatial heterogeneity of the expressed inferiority of the practitioners in different industries. A Geographically Weighted Regression (GWR) model was utilized to reveal both the spatial and temporal heterogeneity of the expressed inferiority of the practitioners in different industries and people at different educational stages.

4.1. Gravity Model

The gravity model was initially used to simulate Newton’s law of gravitation, and since then, it has been used to describe and simulate the spatial evolution in scientific research in many fields, such as housing prices [34], PM 2.5 spatiotemporal evolution [28], and disease transmission. The calculation formula is as follows:
X ¯ = i = 1 n C P i S i X i i = 1 n C P i S i Y ¯ = i = 1 n C P i S i Y i i = 1 n C P i S i
where   X ¯ represents the longitude of the gravity center of inferiority, Y ¯   represents the latitude of the gravity center of inferiority, n represents the number of cities in the study, and X i and Y i represent the longitude and latitude of the geometrical center of the i th city, respectively. S i represents the area of city i , and C P i represents the spatial weight of city i , namely, the number of posts relevant to inferiority in the i th city.

4.2. LMG

The LMG model was used in the OLS analysis of the variables without normalized correction and non-negative correction to calculate the relative importance of each variable with full consideration given to the independent contribution of each regression variable and the interactive contribution of the remaining regression variables [35]. The LMG model is described below.
Many independent variables and their permutations are given, and the contribution of the i th independent variable into the equation L M G x i can be represented as follows:
L M G x i = 1 n ! r p e r m u t a t i o n R 2 ( x i | r ) )
r p e r m u t a t i o n = r 1 , r 2 ! , , r n ! is the order in which the evaluation variable enters the equation, and it is a permutation of the subscripts {1, 2, …, n} of the evaluation variable; R 2 ( x i | r ) is the continuous sum of the squares of x i in the r th order.

4.3. GWR

The GWR model takes the influences of the variables in different regions into consideration, which reflects the spatial non-stationarity of the parameters. Moreover, the GWR model allows the relationship between the variables to change with the geographical location and utilizes the spatial visualization technique in the spatial comparative analysis of different geographical locations to provide more realistic results [35]. The definition formula of GWR is shown as (3).
y i = β i 0 u i , v i + k = 1 m β i k u i , v i x i k + ξ i                       i 1 , n
In the formula, y i is the value of the i th sample point of inferiority, u i , v i is the spatial coordinate of the sample point i of inferiority, β i 0 u i , v i is the spatial intercept of the sample point i , x i k is the evaluation variable k of the sample point i of inferiority, ξ i is the residual of the sample point i of inferiority, and β i k u i , v i is the regression coefficient of the evaluation variable k of the sample point i of inferiority.
β u i , v i = ( X T W u i , v i X ) 1 X T W u i , v i y
where   X represents the independent variable matrix and W u i , v i is a diagonal matrix with diagonal elements of w i j .
Notably, the weighting function w i j was introduced when the GWR was used to estimate the regression coefficient. The weight represents the influence of the observed value at different spatial locations on the coefficient estimate at the location i . In the weight function, the closest observed value at location i provides the optimum estimate value of the coefficient at location i . The mathematical expression of the weighting function is shown as follows:
w i j = exp [ 1 2 ( d i j b ) 2 ]
where b describes the non-negative decreasing parameter of the relationship between weight w i j and the distance d i j , which is usually referred to as the bandwidth. The higher b is, the slower the rate of w i j is with the decrease in d i j , and vice versa. When the bandwidth is zero, only the weight of the estimate point is one. When the bandwidth is infinity, then the weights of all of the sample points tend toward one as the global regression.

5. Results

5.1. Gravity Model

Figure 2 shows the moving track of the gravity center of inferiority. In Figure 2, for the moving region of the inferiority concentration gravity center, the gravity center is distributed in Henan Province, including in Nanyang (2012), Xuchang (2013), Pingdingshan (2014) and Luoyang (2015–2017), moving from south to north with a decrease in the moving rate.
Between 2012 and 2013, the gravity center moved to the northeast area from northern Nanyang to the east of Xuchang, reaching a distance of 112.92 km, during which the inferiority concentration in the eastern and northern areas increased significantly. From 2013 to 2014, the inferiority gravity center moved from the east to the west (from the north of Xuchang to the west of Pingdingshan); the moving rate was slower than that during the period between 2012 and 2013, reaching a distance of 79.61 km. During the period between 2014 and 2015, the gravity center of the concentration of inferiority slowly moved to the northwest area (west of Pingdingshan to the center of Luoyang), with an average moving distance of 61.70 km. From 2015 to 2017, the inferiority gravity center moved north and then south, with it still remaining in Luoyang, and the moving distance was short. The movement changed steadily after 2015. This phenomenon implies that mental health became a greater concern. On the one hand, mental health education was included in the primary and secondary schools curriculums, and psychological counseling centers were provided by many universities during the education system reform in China [36,37,38]. On the other hand, many companies and institutes were equipped with special psychologists as part of their staff [31,39]. Overall, the inferiority concentration gravity center moved on a small scale at a slow rate, and it was significantly concentrated in space.
Based on the analysis above in combination with spatial effect theory, inferiority in the whole of mainland China was influenced by the four directions of the driving force, including northwest, northeast, east and southeast, which are listed in order of their strength. The strength of the driving force in the different areas was most likely influenced by the amount of economic development, the level of people’s education, the geographical environment, the population density, and many other impact factors in the area [11,14,36,40,41].

5.2. GWR

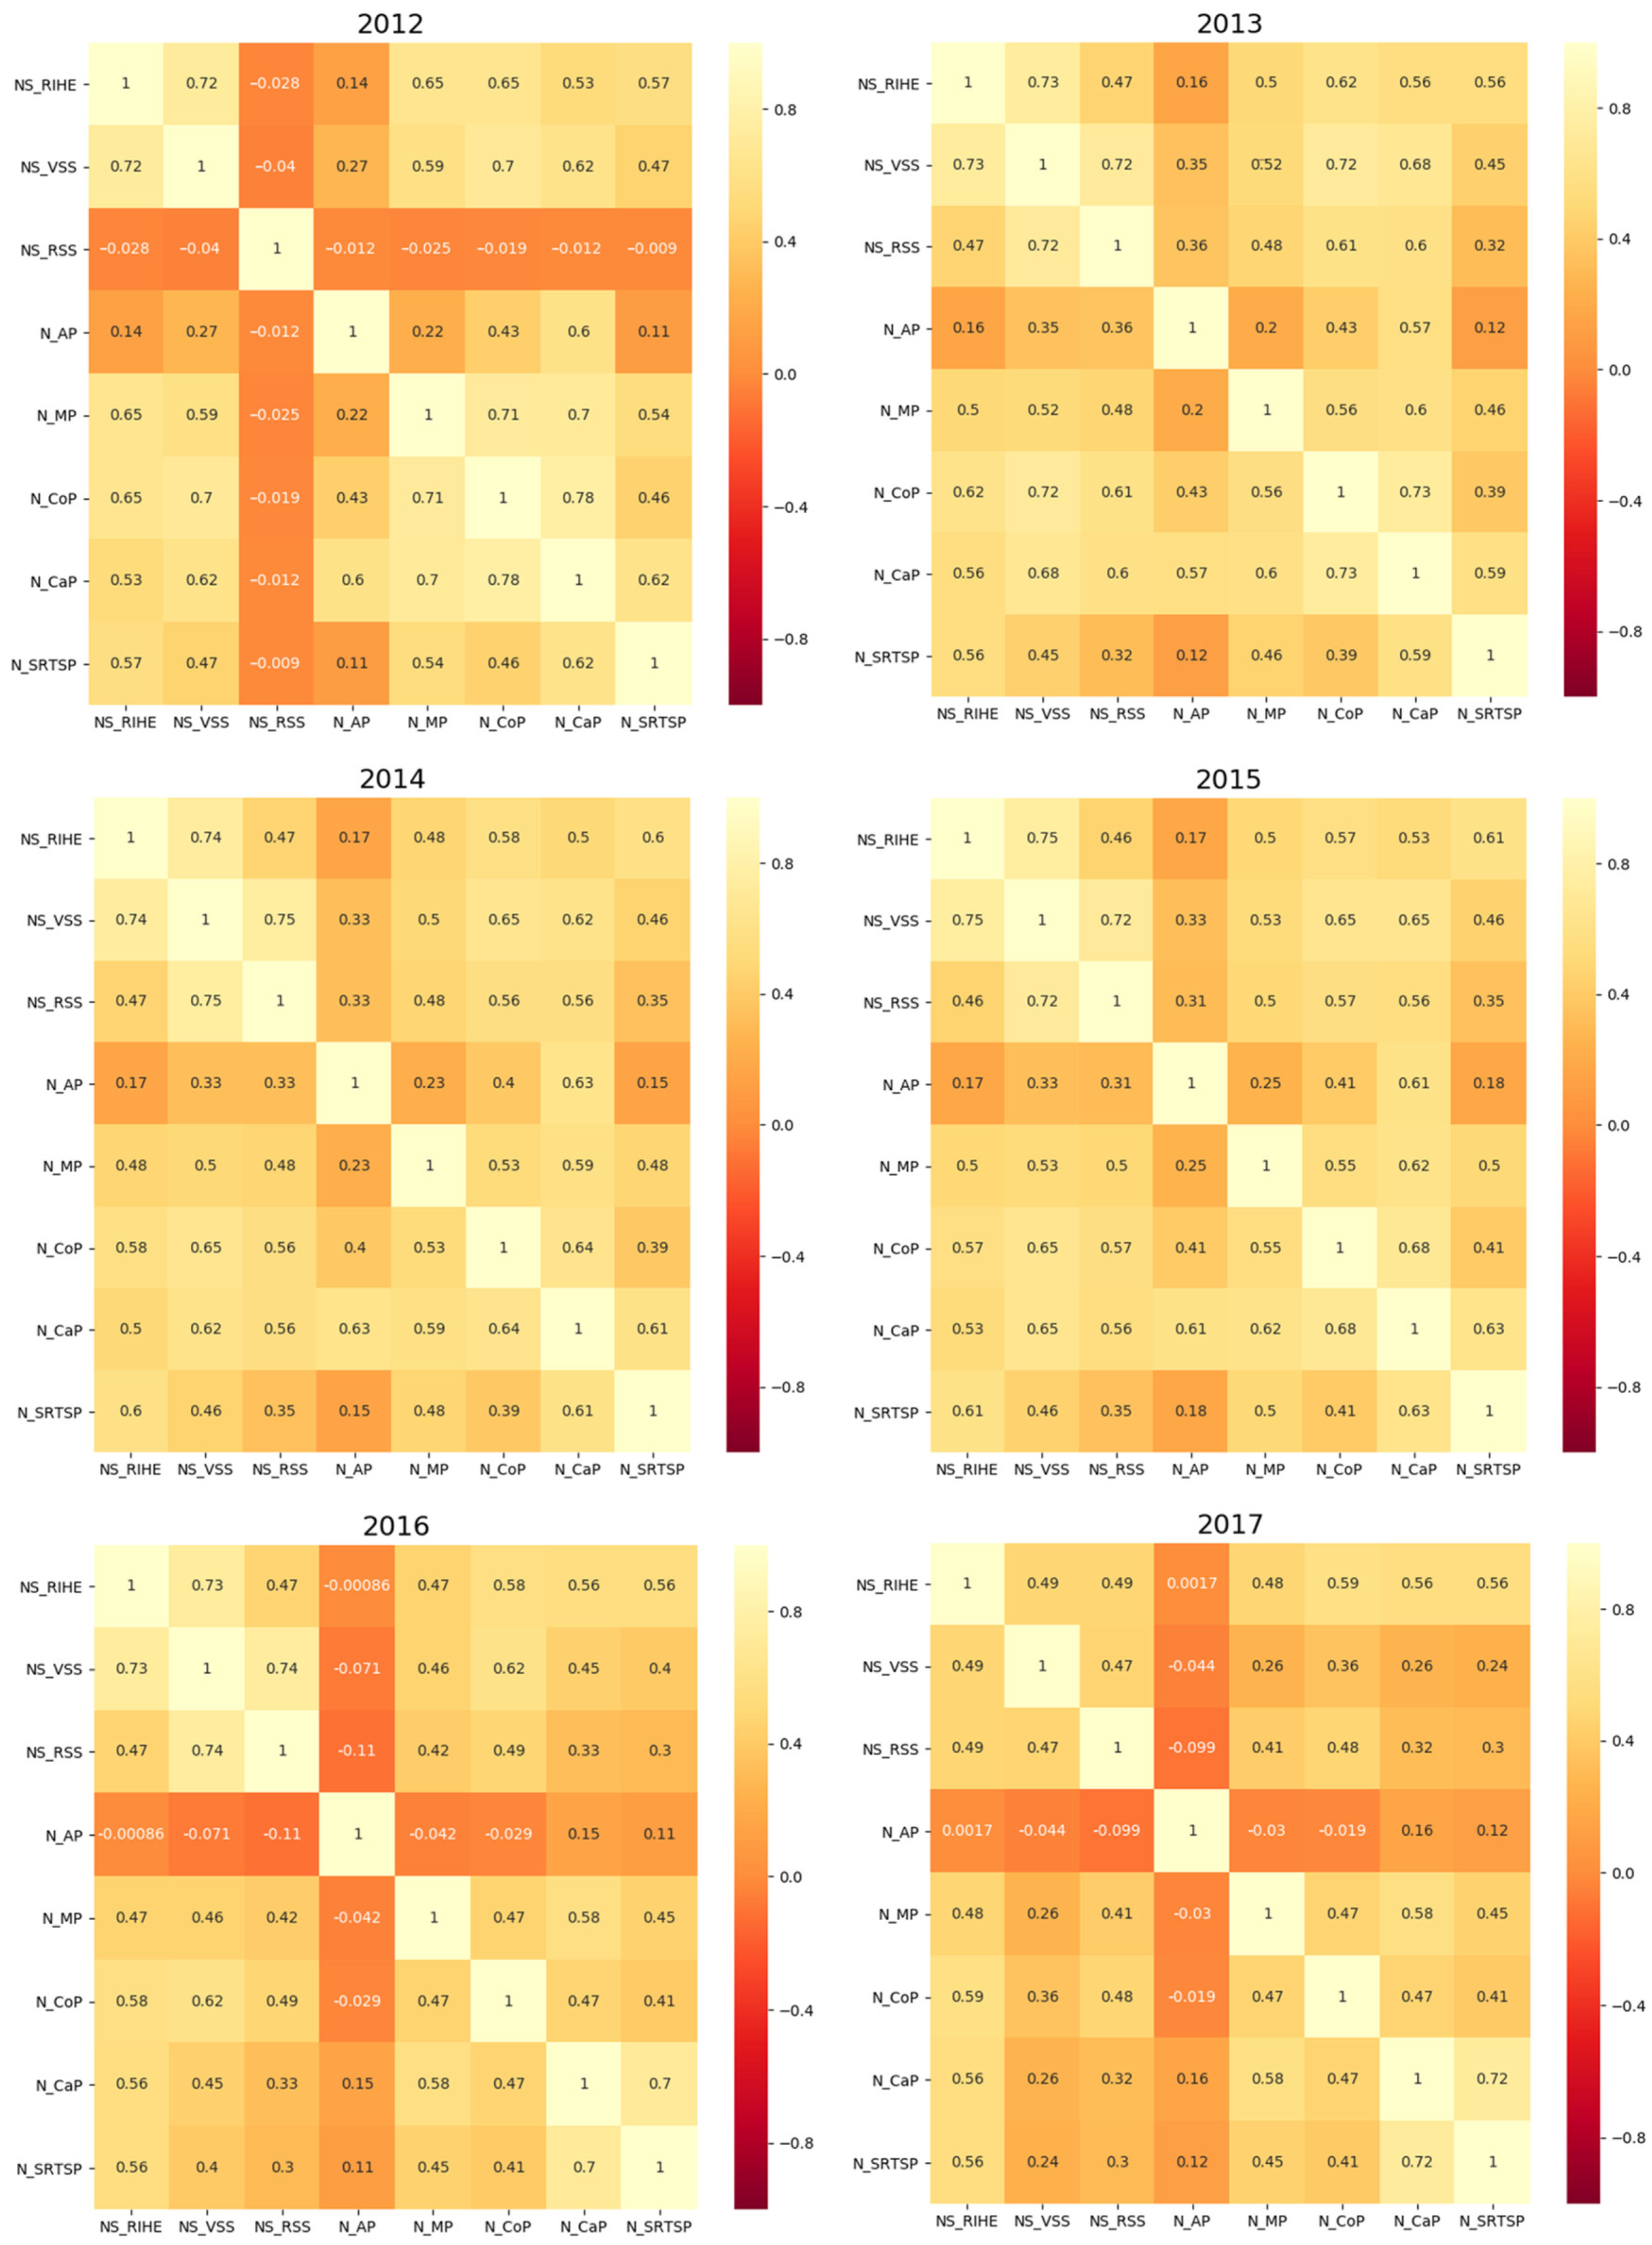
According to previous studies, the multicollinearity of the evaluation variables must be diagnosed before a geographically weighted regression analysis could be conducted [42,43]. In this paper, the PCA correlation coefficient method is utilized to measure the colinear relationship between the evaluation variables. When the PCA correlation coefficient between the variables was smaller than 0.9, there was no multiple collinearity or redundant dependent variable issue in the regression model [44,45]. In Figure 3, the PCA of the variables is smaller than 0.9 from 2012 to 2017, so there is no redundancy between the variables.
In Table 2, the values of R 2 in the GWR fitting model are 0.9461, 0.9989, 0.9922, 0.9644, 0.9551, and 0.7548, and the values of the adjusted R 2 are 0.8130, 0.8430, and 0.6130, which means that the model has a good fitting effect. Among the related evaluation variables, including NS_VSS, NS_RSS, N_AP, N_MP, N_CoP, N_CaP, and N_SRTSP, the smallest regression coefficient is negative, and the largest regression coefficient is positive. Specifically, the median regression coefficients of NS_RIHE, N_MP, and N_SRTSP are positive, which indicates that they are positively correlated with inferiority in most of the study area. In contrast, the median regression coefficients of N_CoP are negative in the six-year study, which illustrates that the variables are negatively correlated with inferiority in most of the regions. In addition, from 2015 to 2016, the maximum and minimum coefficients of NS_RIHE are both positive, which demonstrates that NS_RIHE is most positively correlated with inferiority throughout the space.

5.3. LMG

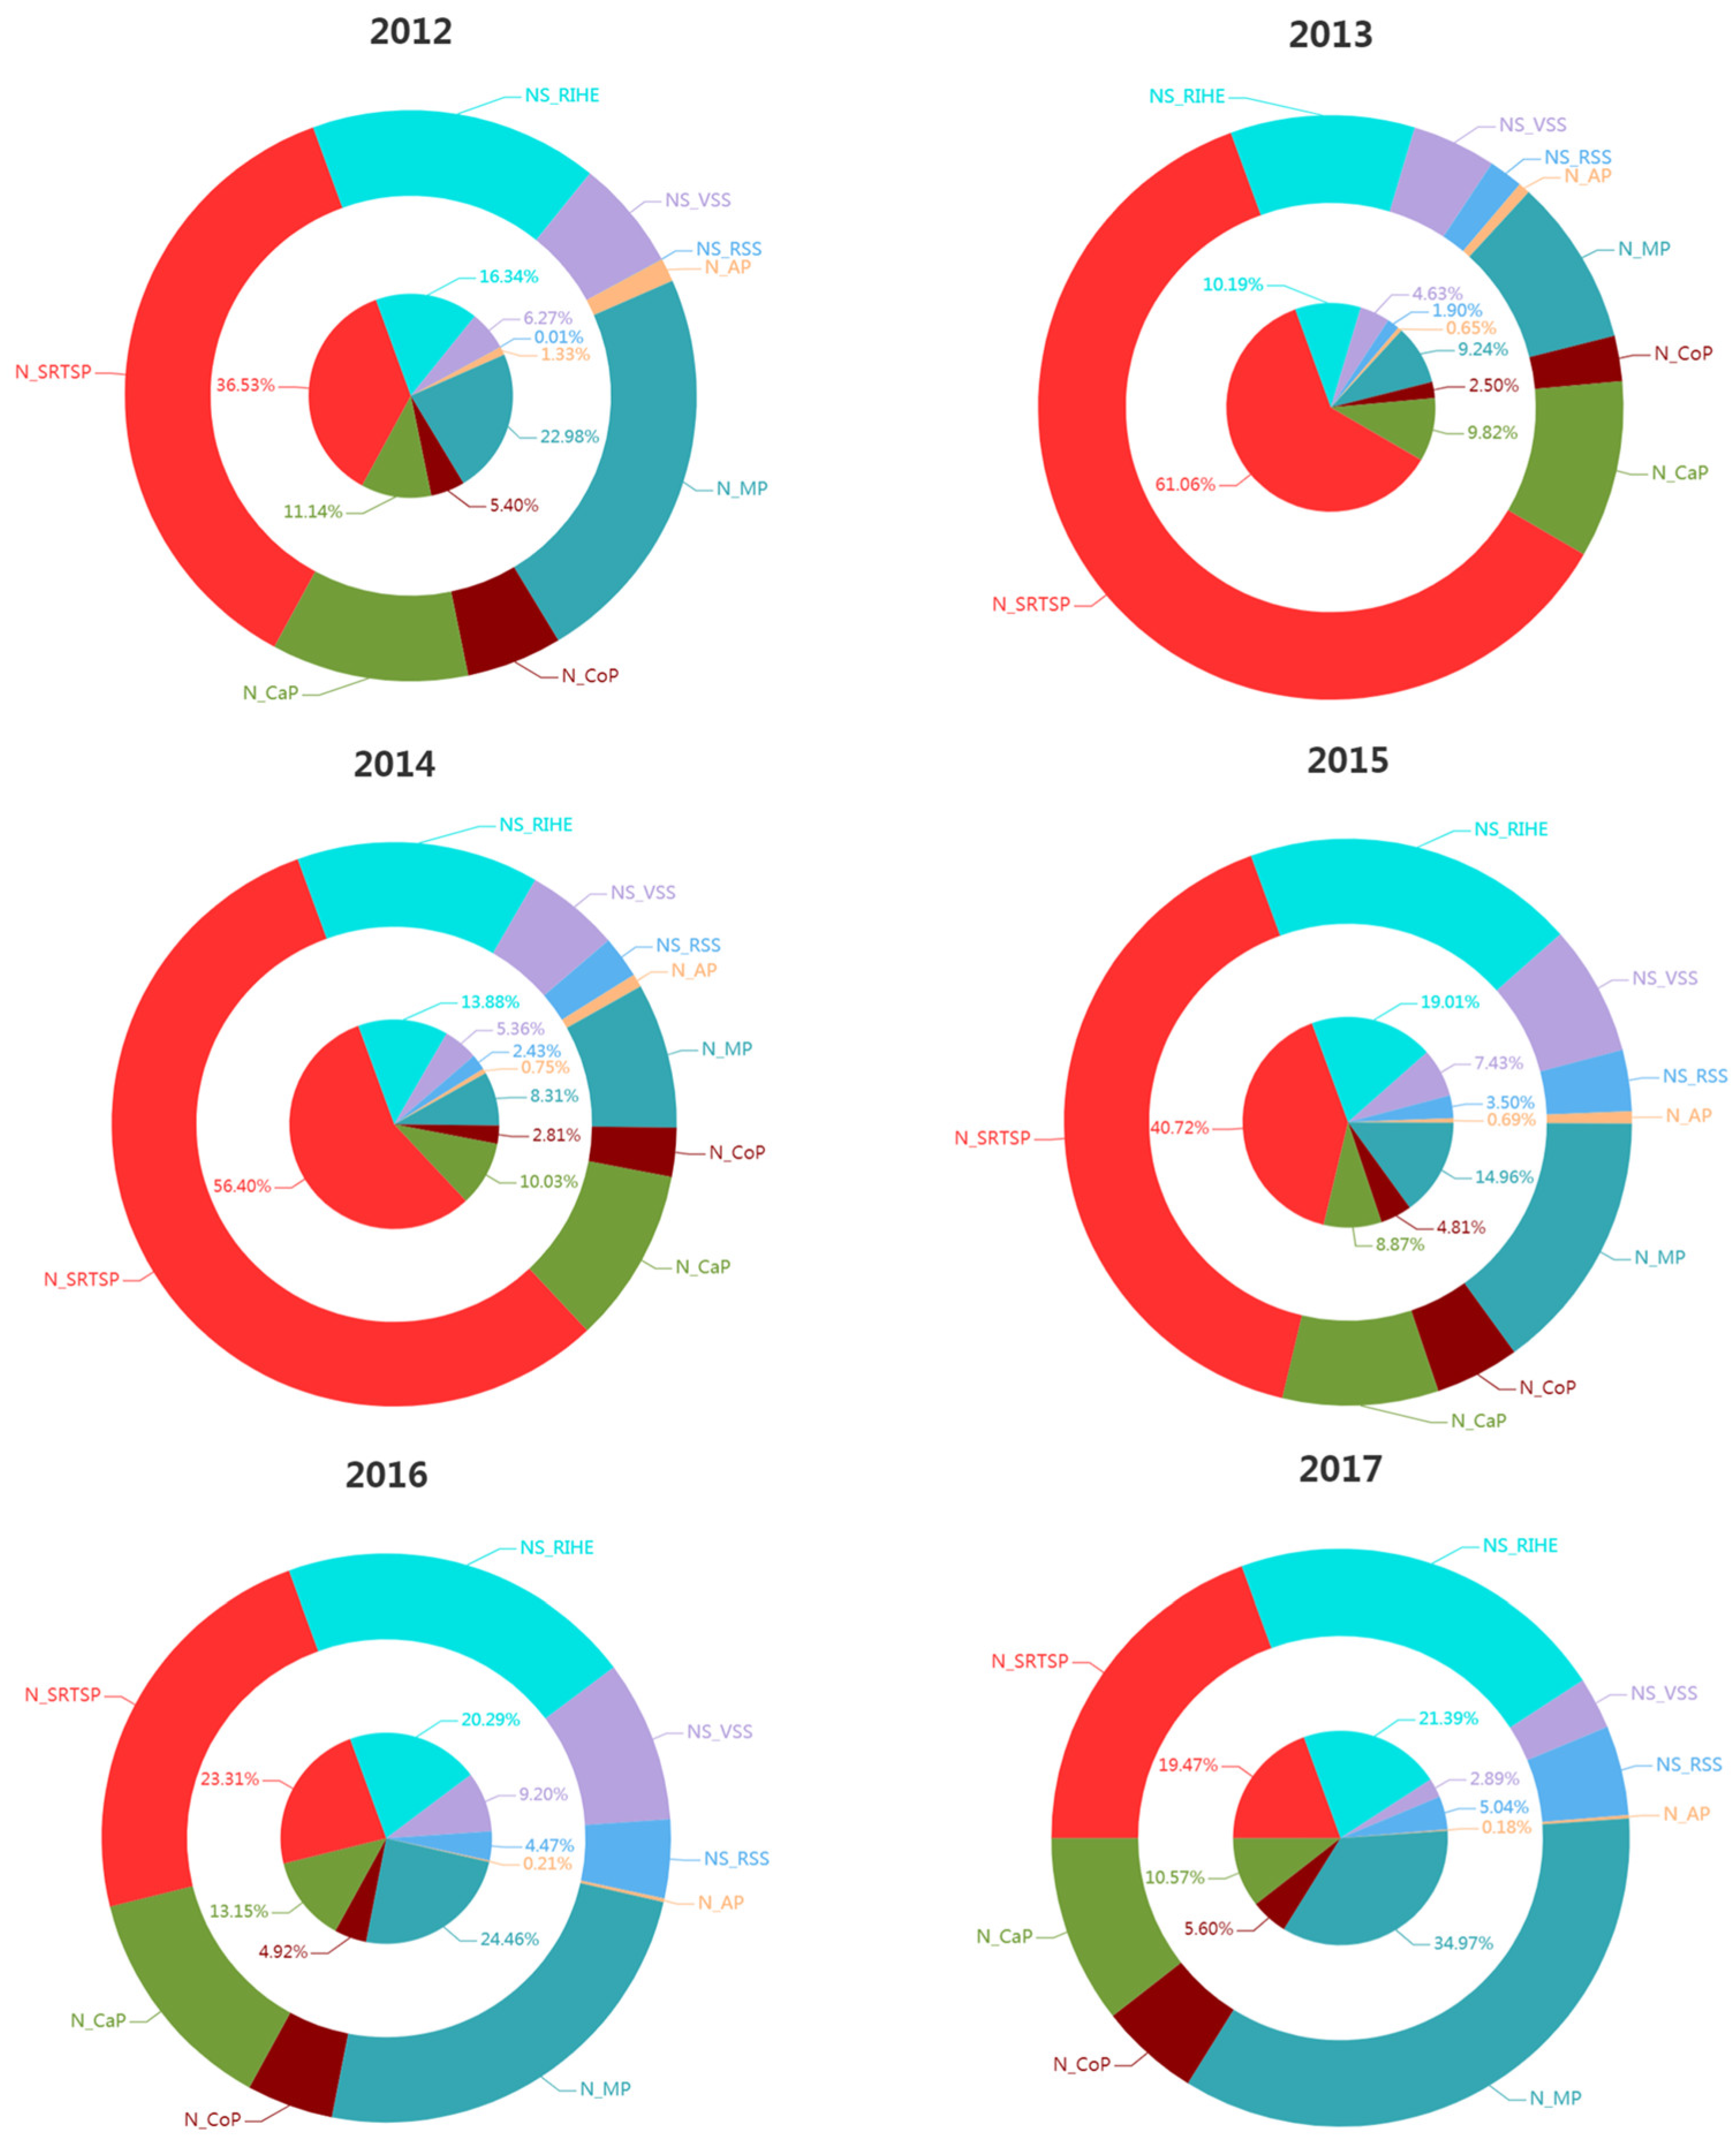
The LMG model evaluation results are shown in Figure 4. During the period from 2012 to 2015, the percentages of the relative importance of the N_SRTSP were 36.53%, 61.06%, 56.40%, and 40.72%, making it the most important evaluation variable. From 2013 to 2017, the percentage of the relative importance of NS_RIHE continued to increase from 10.19% to 21.39%, making it the evaluation variable with the third highest relative importance. In this study, the percentage of the relative importance of N_AP was stable, while the percentage of the relative importance of N_MP increased from 8.32% to 34.97%, making it the evaluation variable with the most relative importance.

6. Discussion and Limitations

6.1. Discussion

6.1.1. Number of Science and Technology Personnel (N_SRTSP)

During the six-year study period, the minimum value of the GWR regression coefficient of N_SRTSP was negative, while the maximum value was positive (Table 2). These results indicate that the N_SRTSP’s inferiority had significant spatial differentiation.
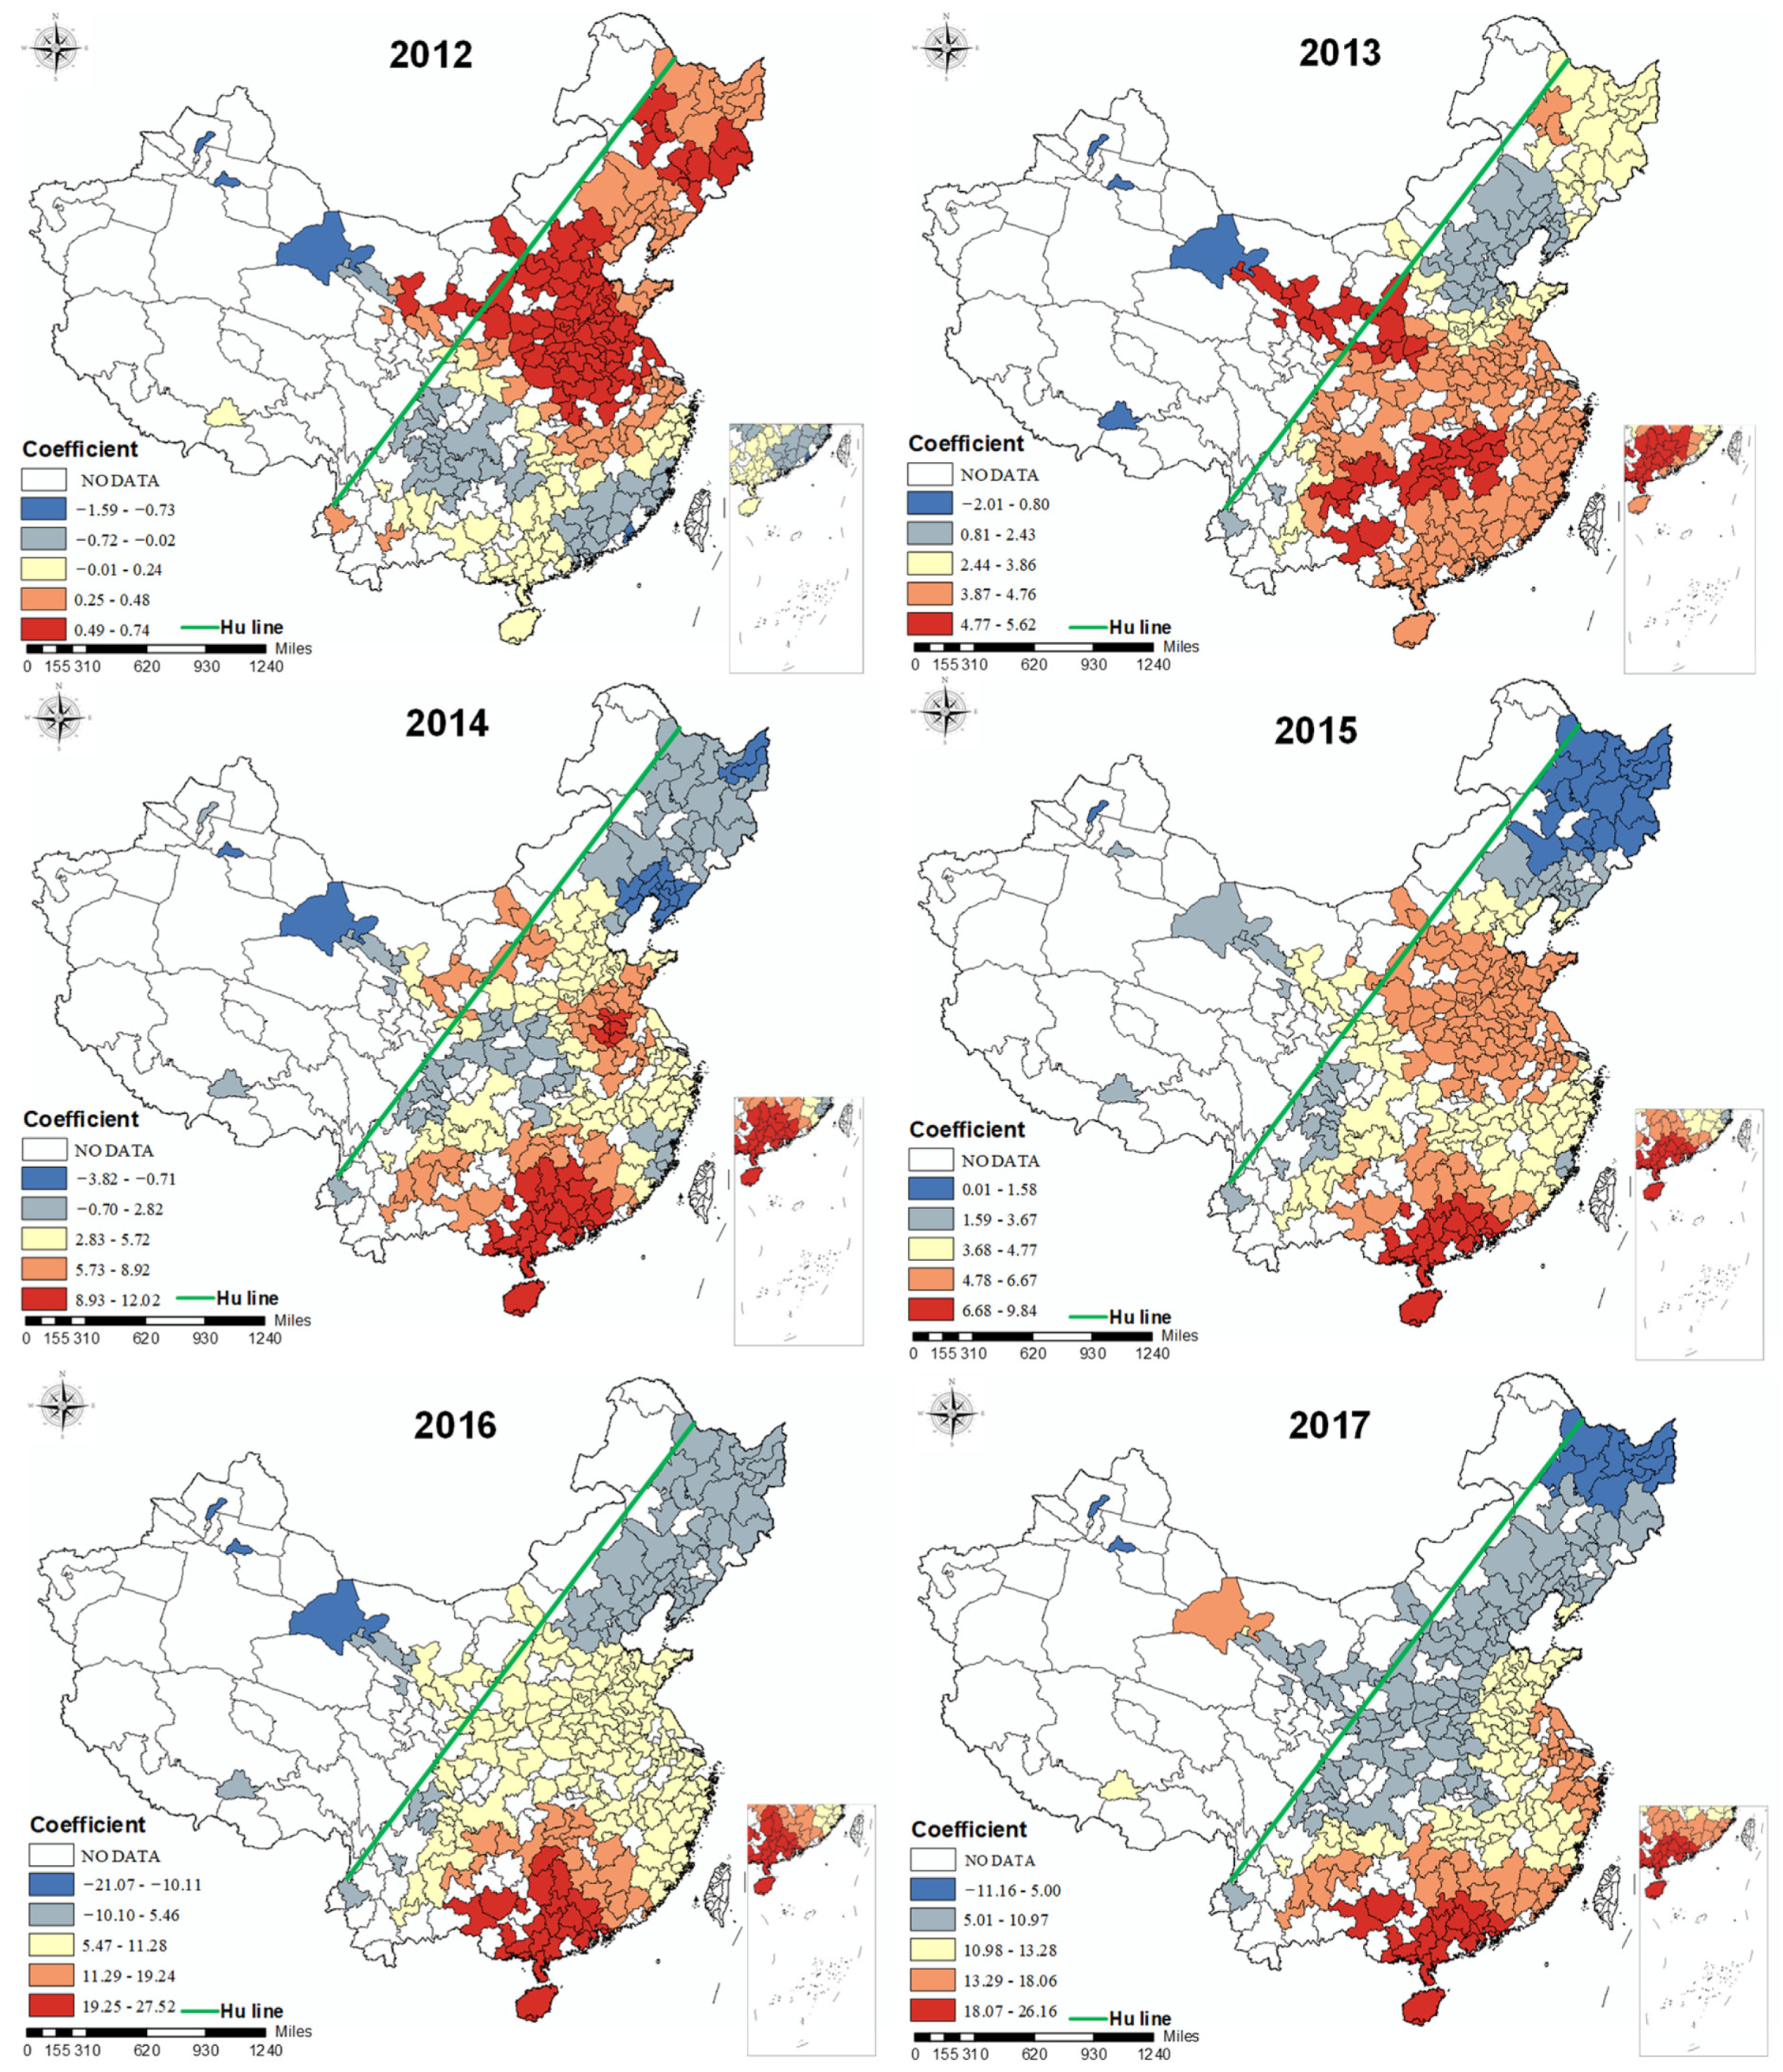
In Figure 5, the regression coefficients of N_SRTSP show apparent spatial heterogeneity and regularity in the 2012–2017 period. Specifically, in 2012, N_SRTSP and inferiority gradually changed from a positive to a negative correlation from north to south in China. The regions with the strongest positive correlation were mainly concentrated in northeast, north, and central China and in parts of the Yangtze River Delta, while the negative correlations were mainly concentrated in parts of northwest China. From 2013 to 2014, the negatively correlated areas were mainly located in parts of northeast and northwest China, and the negatively correlated areas nationwide decreased significantly. By 2017, inferiority and N_SRTSP showed a significant positive correlation in most of the areas in China.
A possible reason for these variations is that in 2015, China proposed the “double world-class project” to build several world-class universities and disciplines by the end of 2050 [46]. In the following years, universities and academic institutions (especially those in economically developed areas) accelerated the introduction of talent and significantly increased the assessment requirements for scientific researchers (especially young researchers who had just begun to work in the field) [29]. These excessive assessment requirements led to a dramatic increase in the amount of pressure on the scientific researchers. According to previous studies, excessive pressure can easily lead to inferiority [47,48]. On the other hand, for individual researchers, those who have not yet achieved results often feel inferior when other researchers who have been brought in during the same period have done so.
Therefore, the government and relevant departments need to take appropriate measures. On the one hand, they should guide universities and scientific research institutions to formulate policies and assessment mechanisms for the introduction of talent that are in line with their actual conditions to prevent excessive pressure, which can lead to inferiority [36,37,49]. On the other hand, steps should be taken to encourage scientific researchers to pay attention to the work-rest balance and take care of their mental health [14,15]. Finally, the government should increase their investment in the health and medical industry, actively improve local health and medical service facilities, and develop health and medical services [50,51]. Moreover, psychological counseling centers should be established in schools, communities, and other densely populated areas, and the informatization level of counseling should be actively improved to enhance people’s access to psychological support.

6.1.2. Number of Students in Regular Institutions of Higher Education (NS_RIHE)

Table 2 shows that during the 6-year study period; the medians of the NS_RIHE regression coefficients were all positive, which indicates that this factor has a strong positive correlation with inferiority. Figure 6 shows that there is spatial heterogeneity in the effect of inferiority on NS_RIHE.
Figure 6 clearly shows that in the six-year study period, the impact of inferiority on college students was spatially unstable. From 2012 to 2013, across China, the regression coefficients of NS_RIHE changed from negative to positive, from north to south, showing a “sandwich” distribution and implying that the correlation between inferiority and NS_RIHE changed from negative to positive, from north to south. The regions with the strongest positive correlation were mainly distributed in southern China and the southeast coastal areas. From 2014 to 2015, the negative correlation between inferiority and NS_RIHE gradually decreased, while the positive correlation area increased accordingly. Between 2016 and 2017, the regression coefficient of NS_RIHE showed that inferiority and NS_RIHE were positively correlated, nationwide, and the regions with the strongest positive correlation were mainly concentrated in areas to the north of the Yellow River. During the six-year study, the number of Chinese college graduates rose from 6.2 million in 2012 to nearly 8.2 million in 2017, and within the same period, the number of graduate students who applied for the exams increased from 1.65 million to 2.01 million [52]. As a group who are entering society, college students face unprecedented pressure for further education and employment, and this pressure is the main reason for the inferiority that they experience [14,49]. It is worth noting that during the time period that was covered by this study, the Chinese government adopted several measures and implemented a series of preferential and stimulus policies such as mass entrepreneurship and innovation subsidies to help college students find employment and entrepreneur roles [53,54]. The implementation of these measures may play a positive role in alleviating the employment pressure and psychological stress of college students in the future.
However, as shown in Figure 6, the maximum regression coefficients between 2012 and 2017 increased from 0.29 to 4.162. These figures show that the problem of inferiority among college students has been increasing year by year, which is consistent with the results of previous studies [14,49,53,55]. If this is not taken seriously, this situation can lead to mental disorders, such as anxiety and depression [41,56]. Therefore, relevant government departments should perform measures to formulate corresponding policies and regulations to promote the physical and mental health of college students [54,57]. In addition, schools and related departments should further strengthen the mental health education of college students to guide them to find reasonable ways to release academic and life pressures [11,40]. Finally, students should adjust their emotions and strive to maintain a positive state of mind, which helps to prevent depression, anxiety, and other negative mental states and to relieve inferiority [14,56,57,58].

6.1.3. Number of Manufacturing Practitioners (N_MP)

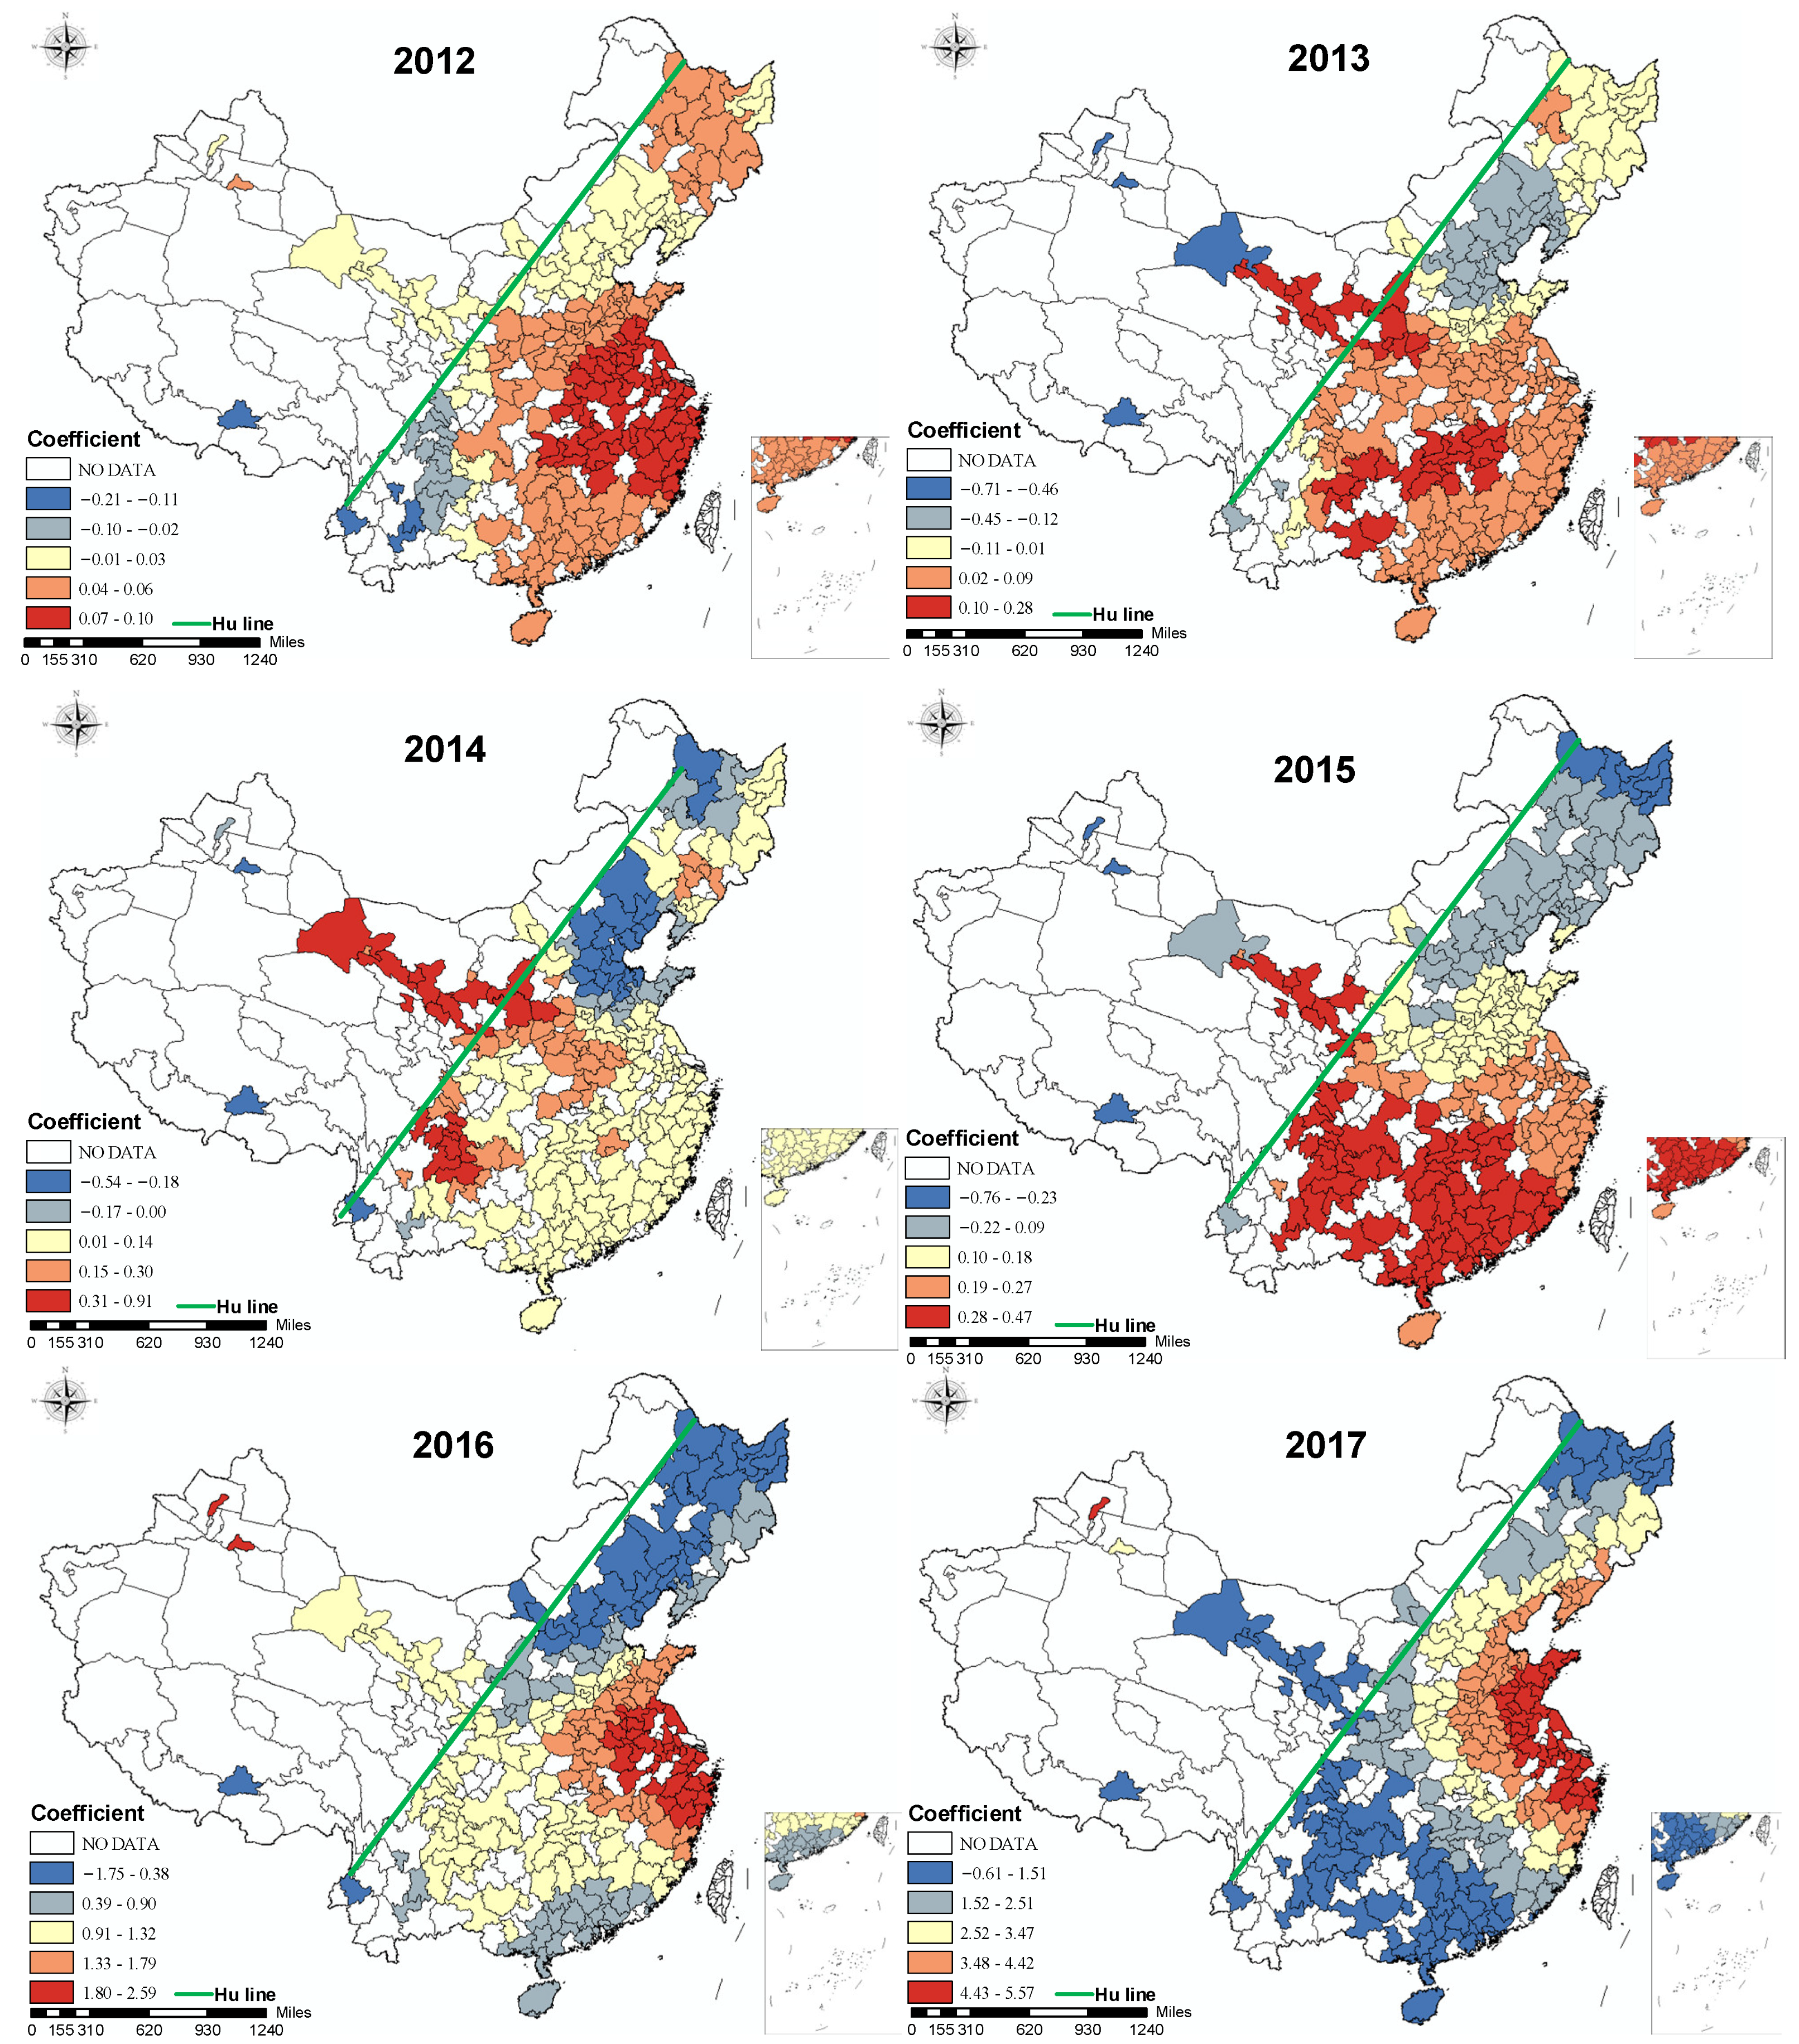
Figure 7 shows the spatial relationship between N_MP and inferiority. Figure 7 shows that in the six-year study, there were both positive and negative correlations between N_MP and inferiority. However, overall, the positive correlation was dominant, and the area with a positive correlation increased year by year, while the area with a negative correlation decreased. The areas with a negative correlation are mainly distributed in northeast and north China.
Moreover, in Figure 7, the positive correlation coefficient in the southern region is higher than that in the north. The regression coefficients of the Yangtze River Delta region and Shandong Province has consistently high values during the study period, suggesting that N_MP in these regions has a strong positive correlation with inferiority. Specifically, in 2017, the regression coefficients of N_MP showed a regular increasing trend from western China to eastern China. The regions with the largest regression values were mainly in the central and eastern regions of China, especially in the two important industrial bases in China—the Beijing–Tianjin–Tangshan region and the Yangtze River Delta. These phenomena show that N_MP has a strong positive correlation with inferiority in the regions that are mentioned above. Within these regions, the increase in the number of manufacturing employees leads to an increase in inferiority among the practitioners. With the in-depth implementation of the “Made in China 2025” strategy, China has significantly increased its investment in manufacturing, and the number of people employed in manufacturing has also increased dramatically [30,59]. By 2017, China’s manufacturing industry employed nearly 50 million people, and industry competition as well as competition among the practitioners in the industry has become unprecedentedly fierce [23]. In this competitive environment, individuals’ shortcomings in their ability or personality can lead to an increase in their sense of inferiority [6,53]. Previous studies have shown that moderate competition in the workplace is conducive to the development of people’s physical and mental health and an improvement in their work quality. However, when the intensity of the competition exceeds a certain threshold, it causes great psychological and physical harm [60]. In addition, excessive competition brings excessive pressure, which can lead to inferiority and may even cause physical reactions, such as headaches and dizziness, as well as severe psychological diseases, such as anxiety and depression [61,62].
Therefore, individuals need to adjust their mentality, find ways to reduce their stress, and develop a healthy lifestyle [13,36,63]. Relevant government departments and manufacturing enterprises should take effective intervention measures, such as offering mental health education, mental health counseling, and recreational activities [64,65]. Employees can develop healthy work and lifestyle practices to help individuals experiencing inferiority regulate their emotions and maintain a healthy life and work state [40,60].

6.2. Limitations

Despite the above findings, there are some limitations to this study. On the one hand, Weibo, which includes location information on inferiority, was used in this study. Location information is voluntarily shared by users. Due to various reasons, the users only selectively share part of their location data when they are posting content, so the data are sparse. This leads to difficulty in mining the spatial behavioral patterns of the individuals who experience inferiority. In addition, the acquisition of the data in this study was based on keywords, so many posts related to inferiority that did not include keywords were not collected. Furthermore, the selection of independent variables was not rigorous. In the future, we will establish specific spatial statistics or data mining methods to determine the scope of the influence of different types of influencing factors and the degree of the regional impact. Optimal models and methods should be adopted to simulate the spatial and temporal variation trend of inferiority and to reveal the temporal and spatial differences of inferiority on the practitioners in different types of occupations.

7. Conclusions

Based on the inferiority data from Weibo between 2012 and 2017, this study investigated the spatial variation in inferiority and revealed the influence patterns of inferiority among the practitioners with different professions and at various stages of education. The main findings are below.
The space-time evolution of inferiority is mainly influenced by the combination of regional economic development, people’s education, the population density, and other factors. Science and technology personnel, agriculture practitioners, and manufacturing practitioners are the three groups that are most affected by inferiority. The patterns of the expressed inferiority among students in regular institutions of higher education, students in vocational secondary schools, students in regular secondary schools, agriculture practitioners, manufacturing practitioners, construction practitioners, catering practitioners, and science and technology personnel display significant spatiotemporal heterogeneity. Excessive assessment pressure is a possible reason for the inferiority among scientific researchers. With the limited space in regular institutions of higher education, the increase in the number of students increases the risk of inferiority among the students. The increase in the density of manufacturing employees raises the risk of inferiority among the individuals in manufacturing. The government should take measures to guide relevant institutions to formulate corresponding measures to increase the attention to both the physical and mental health of the relevant groups. Universities and colleges and related authorities should strengthen the mental health education of students and guide them to establish correct mental health concepts. Relevant enterprises and institutions need to formulate effective intervention measures to find and help individuals experiencing inferiority in their enterprises to improve their mental condition and maintain a healthy life and work status.

Author Contributions

Conceptualization, X.K., L.L. and Y.L.; Software, X.K.; Visualization, Y.L., Writing original draft preparation, Y.L.; Review and editing, L.L. and X.K. All authors have read and agreed to the published version of the manuscript.

Funding

This research was funded by the Guangdong Office of Philosophy and Social Science (GD21CTS01, GD20XXY01), the National Natural Science Foundation of China (41901325), Guangdong Basic and Applied Basic Research Foundation (2022A1515010117), the Open Fund of Key Laboratory of Urban Land Resources Monitoring and Simulation, and the Ministry of Land and Resources (KF-2021-06-123).

Institutional Review Board Statement

Not applicable.

Informed Consent Statement

Not applicable.

Data Availability Statement

The datasets used and/or analyzed during the current study are available from the corresponding author on reasonable request.

Conflicts of Interest

The authors declare no conflict of interest.

References

  1. Smith, M.E. A study of the causes of feelings of inferiority. J. Psychol. 1938, 5, 315–332. [Google Scholar] [CrossRef]
  2. Peeters, M.C.W.; Buunk, B.P.; Schaufeli, W.B. Social interactions and feelings of inferiority among correctional officers—A daily event-recording approach. J. Appl. Soc. Psychol. 1995, 25, 1073–1089. [Google Scholar] [CrossRef] [Green Version]
  3. Bagherian, F.; Asgari, A. Reliability, Validity and Standardization the Comparative Feeling of Inferiority Index. 2017. Available online: https://www.sid.ir/paper/151837/en (accessed on 24 October 2022).
  4. Meng, J. On Inferiority Mental of College Students; Southwest University: Chongqing, China, 2005. [Google Scholar]
  5. Zhang, X.C.; Sun, Y.R.; Zheng, A.Y.; Wang, Y. A New Approach to Refining Land Use Types: Predicting Point-of-Interest Categories Using Weibo Check-in Data. ISPRS Int. J. Geo-Inf. 2020, 9, 124. [Google Scholar] [CrossRef] [Green Version]
  6. Han, P. Inferiority Feelings of College Student: A Research Based on Social Comparison. Master’s Thesis, Guangxi Normal University, Guangxi, China, 2006. [Google Scholar]
  7. Tian, X.; Yu, G.; He, F. An analysis of sleep complaints on Sina Weibo. Comput. Hum. Behav. 2016, 62, 230–235. [Google Scholar] [CrossRef]
  8. Akdoğan, R.; Çimşir, E. Linking inferiority feelings to subjective happiness: Self-concealment and loneliness as serial mediators. Pers. Individ. Differ. 2019, 149, 14–20. [Google Scholar] [CrossRef]
  9. Yu, J. Inferiority Complex Formation Factors from the Family Environment. Guide Sci. Educ. 2012, 8, 230–231. [Google Scholar]
  10. Kabir, S.; Rashid, U.K. Interpersonal Values, Inferiority Complex, and Psychological Well-being of Teenage Students. Tagannath Univ. J. Life Earth Sci. 2017, 3, 127–135. [Google Scholar]
  11. Toyama, T.; Nakasuga, T.; Sugiyama, Y. Inferiority complex seen as a like or dislike and adaptation to physical education classes in junior high school students. Int. J. Sport Exerc. Psychol. 2021, 19, S446–S447. [Google Scholar]
  12. Wilkinson, R.G. Health, hierarchy, and social anxiety. Ann. N. Y. Acad. Sci. 1999, 896, 48–63. [Google Scholar] [CrossRef]
  13. Kepalaitė, A. Peculiarities of teachers’ inferiority feeling and experienced stress. Soc. Welf. Interdiscip. Approach 2015, 5, 54–62. [Google Scholar] [CrossRef]
  14. Li, S.; Chen, S. Analysis of influencing factors and countermeasures of college students’ physical health level. Basic Clin. Pharmacol. Toxicol. 2019, 125, 58. [Google Scholar]
  15. Simons, A.M.; Koster, A.; Groffen, D.A.; Bosma, H. Perceived classism and its relation with socioeconomic status, health, health behaviours and perceived inferiority: The Dutch Longitudinal Internet Studies for the Social Sciences (LISS) panel. Int. J. Public Health 2017, 62, 433–440. [Google Scholar] [CrossRef] [Green Version]
  16. Yang, J. A Research on Middle School Students Inferiority Feelings and Its Relationship with Social Comparison and Achievement Motivation; Chongqing Normal University: Chongqing, China, 2013. [Google Scholar]
  17. Tian, X.; He, F.; Batterham, P.; Wang, Z.; Yu, G. An Analysis of Anxiety-Related Postings on Sina Weibo. Int. J. Environ. Res. Public Health 2017, 14, 775. [Google Scholar] [CrossRef] [Green Version]
  18. Li, A.; Jiao, D.; Zhu, T. Detecting depression stigma on social media: A linguistic analysis. J. Affect. Disord. 2018, 232, S0165032717321845. [Google Scholar] [CrossRef]
  19. Huang, W.D.; Qian, C.; Cui, Y. Study on multimedia network Weibo situational awareness model and emotional algorithm. Multimed. Tools Appl. 2020, 79, 10383–10403. [Google Scholar] [CrossRef]
  20. Liu, Y.; Luo, Q.; Shen, H.; Zhuang, S.; Deng, H. Social Media Big Data-Based Research on the Influencing Factors of Insomnia and Spatiotemporal Evolution. IEEE Access 2020, 8, 41516–41529. [Google Scholar] [CrossRef]
  21. Roszkowska, N.; Lazarus, E.; Bannon, J.A.; Dowshen, N.; Stevens, R. From bots to jokes: Is there a place for hiv prevention on twitter? J. Adolesc. Health 2020, 66, S1–S2. [Google Scholar] [CrossRef]
  22. Lin, L.; Lei, Y.; Zhu, H.; Dai, R.; Torres, C.O.C. Explorative Analysis of Wuhan Intra-Urban Human Mobility Using Social Media Check-In Data. PLoS ONE 2015, 10, e0135286. [Google Scholar]
  23. Zhou, Y. Research on the Impact of Manufacturing Upgrade on Employment. Master’s Thesis, Lanzhou University of Finance and Economics, Lanzhou, China, 2020. [Google Scholar]
  24. Zhou, J.; Ye, S.L.; Lan, W.; Jiang, Y.W. The effect of social media on corporate violations: Evidence from Weibo posts in China. Int. Rev. Finance 2021, 21, 966–988. [Google Scholar] [CrossRef]
  25. Li, X. The Plight of the Legalization of Gay Organizations and Their Thinking. Ph.D. Thesis, Southwest University of Political Science & Law, Chongqing, China, 2015. [Google Scholar]
  26. Song, C.; Guo, C.Y.; Hunt, K.; Zhuang, J. An Analysis of Public Opinions Regarding Take-Away Food Safety: A 2015–2018 Case Study on Sina Weibo. Foods 2020, 9, 511. [Google Scholar] [CrossRef] [Green Version]
  27. Su, X.; Spierings, B.; Hooimeijer, P.; Scheider, S. Where day trippers and tourists go: Comparing the spatio-temporal distribution of Mainland Chinese visitors in Hong Kong using Weibo data. Asia Pac. J. Tour. Res. 2020, 25, 505–523. [Google Scholar] [CrossRef]
  28. Zhou, L.; Zhou, C.; Yang, F.; Wang, B.; Sun, D. Spatio-temporal evolution and the influencing factors of PM2.5 in China between 2000 and 2015. J. Geogr. Sci. 2019, 29, 253–270. [Google Scholar] [CrossRef] [Green Version]
  29. Gao, J.; Li, C.N. Version 2.0 of Building World-Class Universities in China: Initial Outcomes and Problems of the Double World-Class Project. High. Educ. Policy 2020, 35, 397–413. [Google Scholar] [CrossRef]
  30. Wang, M.; Ye, C. Evaluation of City Green Manufacturing Level Based on Optimal Combination Weight and GRA: Taking “Made in China 2025” Demonstration Cities as an Example. Ecol. Econ. 2022, 38, 8. [Google Scholar]
  31. Liu, G. Research on Psychological Health Education of Graduate Employment under the Employment Plight; Results of 2016 International Conference on Education Innovation and Practice (Education Innovation and Practice Volume II); China Scientific Research Publishing: Wuhan, China, 2016; pp. 153–158. [Google Scholar]
  32. Soo, K.K.; Choi, T.; Han, N.; Hwan, S.Y.; Cha, H.; Nam, Y.-S. A Comparison of Factors Affecting Perspective on Body Type, Appearance Satisfaction, and Subjective Health Status Level of Diet Behavior of Korean and Japanese Female College Students. Korean J. Sport Stud. 2019, 58, 329–343. [Google Scholar]
  33. Zhou, X. Comparing the Effectiveness of Acceptance and Commitment Therapy and Rational-Emotional-Behavior Therapy on University Students’ Inferiority Feelings. Ph.D. Thesis, Northeast Normal University, Changchun, China, 2019. [Google Scholar]
  34. Benson, E.D.; Hansen, J.L.; Schwartz, A.L.; Smersh, G.T. Pricing Residential Amenities: The Value of a View. J. Real Estate Finance Econ. 1998, 16, 55–73. [Google Scholar] [CrossRef]
  35. Brunsdon, C.; Fotheringham, A.S.; Charlton, M.E. Geographically weighted regression: A method for exploring spatial nonstationarity. Geogr. Anal. 1996, 28, 281–298. [Google Scholar] [CrossRef]
  36. Zhao, Y. The Relationship of Psychological Stress, Type a Personality, Psychological Capital and Psychological Stress Response in College Student. Ph.D. Thesis, Fujian Normal University, Fujian, China, 2017. [Google Scholar]
  37. Zhang, C.; Xu, W.; Lu, H. Longitudinal relationship between inferiority and aggression in Chinese college students: The moderation of left-behind experience. Pers. Individ. Differ. 2020, 156, 109791. [Google Scholar] [CrossRef]
  38. Sun, W.F.; Yang, W.B.; Sun, G.H.; Yang, X. Inferiority complex of higher vocational students based on improved random sampling. J. Comput. Methods Sci. Eng. 2021, 21, 1739–1746. [Google Scholar] [CrossRef]
  39. Wei, Y. Research on Psychological Problems of Single Mother Case Work—Taking the City of Anshan X Community as the Example. Master’s Thesis, Liaoning University, Liaoning, China, 2016. [Google Scholar]
  40. Rao, W.; Tian, Y.; Jing, Y. The status quo of research on inferiority of university students. Chin. Nurs. Res. 2009, 23, 3011–3013. [Google Scholar]
  41. Li, J.; Huang, F.; Zhang, X. An Analysis of Doctoral Students’ “Difficulties in Graduation” and Its Countermeasures. J. Jimei Univ. 2017, 18, 50–57. [Google Scholar]
  42. Fotheringham, A.S.; Oshan, T.M. Geographically weighted regression and multicollinearity: Dispelling the myth. J. Geogr. Syst. 2016, 18, 303–329. [Google Scholar] [CrossRef]
  43. Fotheringham, A.S.; Yang, W.B.; Kang, W. Multiscale Geographically Weighted Regression (MGWR). Ann. Am. Assoc. Geogr. 2017, 107, 1247–1265. [Google Scholar] [CrossRef]
  44. Xu, H.; Caramanis, C.; Sanghavi, S. Robust PCA via Outlier Pursuit. IEEE Trans. Inf. Theory 2012, 58, 3047–3064. [Google Scholar] [CrossRef] [Green Version]
  45. Granato, D.; Santos, J.S.; Escher, G.B.; Ferreira, B.L.; Maggio, R.M. Use of principal component analysis (PCA) and hierarchical cluster analysis (HCA) for multivariate association between bioactive compounds and functional properties in foods: A critical perspective. Trends Food Sci. Technol. 2018, 72, 83–90. [Google Scholar] [CrossRef]
  46. Zhao, K.; You, Z. Isomorphism, Diversification, and Strategic Ambiguity: Goal Setting of Chinese Higher Education Institutions in the Double World-Class Project. High. Educ. Policy 2021, 34, 841–860. [Google Scholar] [CrossRef]
  47. Luo, F.; Huang, R. Research on Early Warning and Precontrol Management of Brain Drain Based on Work Pressure. Wuhan Univ. Technol. 2010, 23, 4. [Google Scholar]
  48. Guo, B.; Lu, S. The Characteristics of the Talent Recruitment Policies of Higher-learning Institutions and the Related Problems and the Counter Measures: Based on the analysis from six Normal Universities Affiliated to the Ministry of Education. J. Grad. Educ. 2020, 5, 70–82. [Google Scholar]
  49. Myung, S.S. A Study on the Effects of College Students’ vocational Image on Major Satisfaction and Career Identity Formation -Focused on the college students with Aviation Service Major. J. Employ. Career 2020, 10, 55–77. [Google Scholar]
  50. Micu, M.; Carstairs, C. From Improving Egos to Perfecting Smiles: Orthodontics and Psychology, 1945–2000. Can. Bull. Med. Hist. 2018, 35, 309–336. [Google Scholar] [CrossRef]
  51. Yang, X. The estimation on LGBT population size: The international experiences and China’s challenges. Chin. J. Hum. Sex. 2020, 29, 148–152. [Google Scholar]
  52. Min, Z.; Chen, Y.; Wang, X. An Empirical Study on the Influencing Mechanism of Undergraduate Graduation Planning and Its Trends: Based on a Ten-year Survey Data. Chin. J. Sociol. 2018, 38, 32. [Google Scholar]
  53. Gao, Y.; Zhang, D. Research on College Students’ Social Entrepreneurship from the Perspective of “Mass Entrepreneurship and Innovation”. Mod. Educ. Manag. 2017, 7, 119–123. [Google Scholar]
  54. Liu, L.; Zhao, X.; Feng, Q.; Liu, Y. Colleges and Universities Innovative Experiment Educational Practice Guided by Mass Entrepreneurship and Innovation. Res. Explor. Lab. 2019, 38, 5. [Google Scholar]
  55. Qiao, H. A Study on Emotion Experience of Female College Students Who Refused to Heterosexual Love Confession. Ph.D. Thesis, Hebei Normal University, Shijiazhuang, China, 2012. [Google Scholar]
  56. Xiong, M. Qualitative research on psychological problems of colllege students based on psychological counseling. J. Hebei Univ. Eng. 2019, 36, 90–94. [Google Scholar]
  57. Sivrikova, N.V.; Zherebkina, V.F.; Postnikova, M.I. The association between manifestations of intrapersonal conflict and the style of media consumption among students. Russ. Psychol. J. 2017, 14, 70–87. [Google Scholar] [CrossRef] [Green Version]
  58. Aird, R.E. From impostership to mastersness: Experiences of a postgraduate student’s transition to higher education reflected through poetry. J. Res. Nurs. 2017, 22, 522–532. [Google Scholar] [CrossRef]
  59. Wang, B.; Duan, Y.; Wang, Y.; Yan, R.; Chen, X. Exploration and Practice of Intelligent Manufacturing Talents Cultivation Facing on Dual Capability Integration of “Made in China 2025”. Res. Explor. Lab. 2021, 40, 140–144. [Google Scholar]
  60. Metlaine, A.; Sauvet, F.; Gomez-Merino, D.; Elbaz, M.; Delafosse, J.Y.; Leger, D.; Chennaoui, M. Association between insomnia symptoms, job strain and burnout syndrome: A cross-sectional survey of 1300 financial workers. BMJ Open 2017, 7, e012816. [Google Scholar] [CrossRef] [Green Version]
  61. Chen, C.; Yue, J.; Jianmin, L.I. Research about the sleep disorder and influencing factors of the aged among 22 provinces. J. North China Coal Med. Coll. 2006, 6, 749–751. [Google Scholar]
  62. Kalmbach, D.A.; Anderson, J.R.; Drake, C.L. The impact of stress on sleep: Pathogenic sleep reactivity as a vulnerability to insomnia and circadian disorders. J. Sleep Res. 2018, 27, 12710. [Google Scholar] [CrossRef] [Green Version]
  63. Kakalou, C.; Lazarus, J.V.; Koutkias, V. Mining Social Media for Perceptions and Trends on HIV Pre-Exposure Prophylaxis. Stud. Health Technol. Inform. 2019, 264, 959–963. [Google Scholar] [CrossRef]
  64. David, R.; Trandafira, M. “I want to fly”—Initiating a program of psychological counseling in order to mitigate the inferiority complex of teenagers in disadvantaged families. Procedia Soc. Behav. Sci. 2012, 33, 533–537. [Google Scholar] [CrossRef]
  65. Doikou-Avlidou, M. The educational, social and emotional experiences of students with dyslexia: The perspective of postsecondary education students. Int. J. Spec. Educ. 2015, 30, 132–145. [Google Scholar]
Figure 1. Distribution of total inferiority posts of cities in China. (Note: Natural breaks were used to classify posts from Weibo).
Applsci 12 11735 g001
Figure 2. The movement trajectory of the inferiority gravity center over time in 2012–2017.
Applsci 12 11735 g002
Figure 3. PCA correlation coefficient matrix. (All of the variables are the number of people from different groups, specifically, N_SRTSP: Science and technology personnel; N_AP: Agriculture practitioner; N_MP: Manufacturing practitioner; N_CoP: Construction practitioner; N_CaP: Catering practitioner; NS_RIHE: Students in regular institutions of higher education; NS_VSS: Students in vocational secondary schools; NS_RSS: Students in regular secondary schools).
Applsci 12 11735 g003
Figure 4. Relative importance of evaluation variables. (All of the variables are the number of people from different groups, specifically, N_SRTSP: Science and technology personnel; N_AP: Agriculture practitioner; N_MP: Manufacturing practitioner; N_CoP: Construction practitioner; N_CaP: Catering practitioner; NS_RIHE: Students in regular institutions of higher education; NS_VSS: Students in vocational secondary schools; NS_RSS: Students in regular secondary schools).
Applsci 12 11735 g004
Figure 5. The spatial coefficient distribution for science and technology personnel from 2012 to 2017 based on the GWR model. (Note: A positive coefficient means a positive association between an increasing proportion of science and technology personnel (N_SNTP) and more inferiority, while the negative coefficient is the opposite).
Applsci 12 11735 g005
Figure 6. The spatial coefficient distribution for students in regular institutions of higher education from 2012 to 2017 based on the GWR model. (Note: A positive coefficient means a positive association between an increasing proportion of students in regular institutions of higher education (NS_RIHE) and more inferiority, while the negative coefficient is the opposite).
Applsci 12 11735 g006
Figure 7. The spatial coefficient distribution for manufacturing practitioners from 2012 to 2017 based on the GWR model. (Note: A positive coefficient indicates a positive association between an increasing proportion of manufacturing practitioners (N_MP) and more inferiority, while a negative coefficient indicates the opposite).
Applsci 12 11735 g007
Table 1. Evaluation variable of inferiority. Unit: Number of persons.
Evaluation VariablesAbbreviations
Science and technology personnelN_SRTSP
Agriculture practitionerN_AP
Manufacturing practitionerN_MP
Construction practitionerN_CoP
Catering practitionerN_CaP
Students in regular institutions of higher educationNS_RIHE
Students in vocational secondary schoolsNS_VSS
Students in regular secondary schoolsNS_RSS
Table 2. The estimation results of the GWR model.
ParameterYear
201220132014
MinimumMedianMaximumMinimumMedianMaximumMinimumMedianMaximum
NS_RIHE−0.05340.05900.2996−0.33130.10860.7619−0.47900.28911.0804
NS_VSS−0.08650.01750.4143−0.14510.18911.4468−1.59320.34422.2972
NS_RSS−0.06910.00000.0381−0.6934−0.03460.0773−0.3086−0.03580.3547
N_AP−1.4327−0.16260.3027−1.48290.05540.7481−15.3789−0.23684.1427
N_MP−0.21180.04860.0982−0.71450.06540.2823−0.54020.10130.9138
N_CoP−0.2213−0.07480.1868−0.5973−0.12810.4169−2.6522−0.18020.9690
N_CaP−0.36380.38361.8698−0.45180.45689.4290−6.65301.054022.7483
N_SRTSP−1.59380.35430.7444−2.00923.82085.6299−3.81754.671712.0225
R20.9461 0.9889 0.9922
Adjusted R20.9445 0.9886 0.9912
ParameterYear
201520162017
MinimumMedianMaximumMinimumMedianMaximumMinimumMedianMaximum
NS_RIHE−0.31520.54451.26360.08961.90323.88360.30032.52614.1655
NS_VSS−1.25170.59692.5239−2.90091.418112.5000−2.5437−0.23033.4246
NS_RSS−0.45500.00890.3407−0.74870.13930.8024−0.57260.18045.3610
N_AP−4.5503−0.19294.1819−8.53900.20467.3217−12.1192−3.56995.7562
N_MP−0.76070.21950.4717−1.75391.05332.5894−0.61212.46345.5698
N_CoP−0.8515−0.00581.5422−3.3341−0.56014.6947−1.4113−0.73623.3315
N_CaP−1.73430.092110.5292−5.4290−1.175016.8510−27.7872−5.113017.1259
N_SRTSP−0.00054.82709.8378−21.07368.352427.5158−11.162111.218226.1573
R20.9644 0.9551 0.7548
Adjusted R20.9634 0.9538 0.7478
Publisher’s Note: MDPI stays neutral with regard to jurisdictional claims in published maps and institutional affiliations.