
Research on the Spatiotemporal Evolution of the Patterns of Expressed Inferiority in Different Groups of Occupations and Education Stages

Abstract
:1. Introduction
2. Data
2.1. Explanatory Variables
2.2. Evaluation Variable
3. Study Area
4. Methods and Models
4.1. Gravity Model
4.2. LMG
4.3. GWR
5. Results
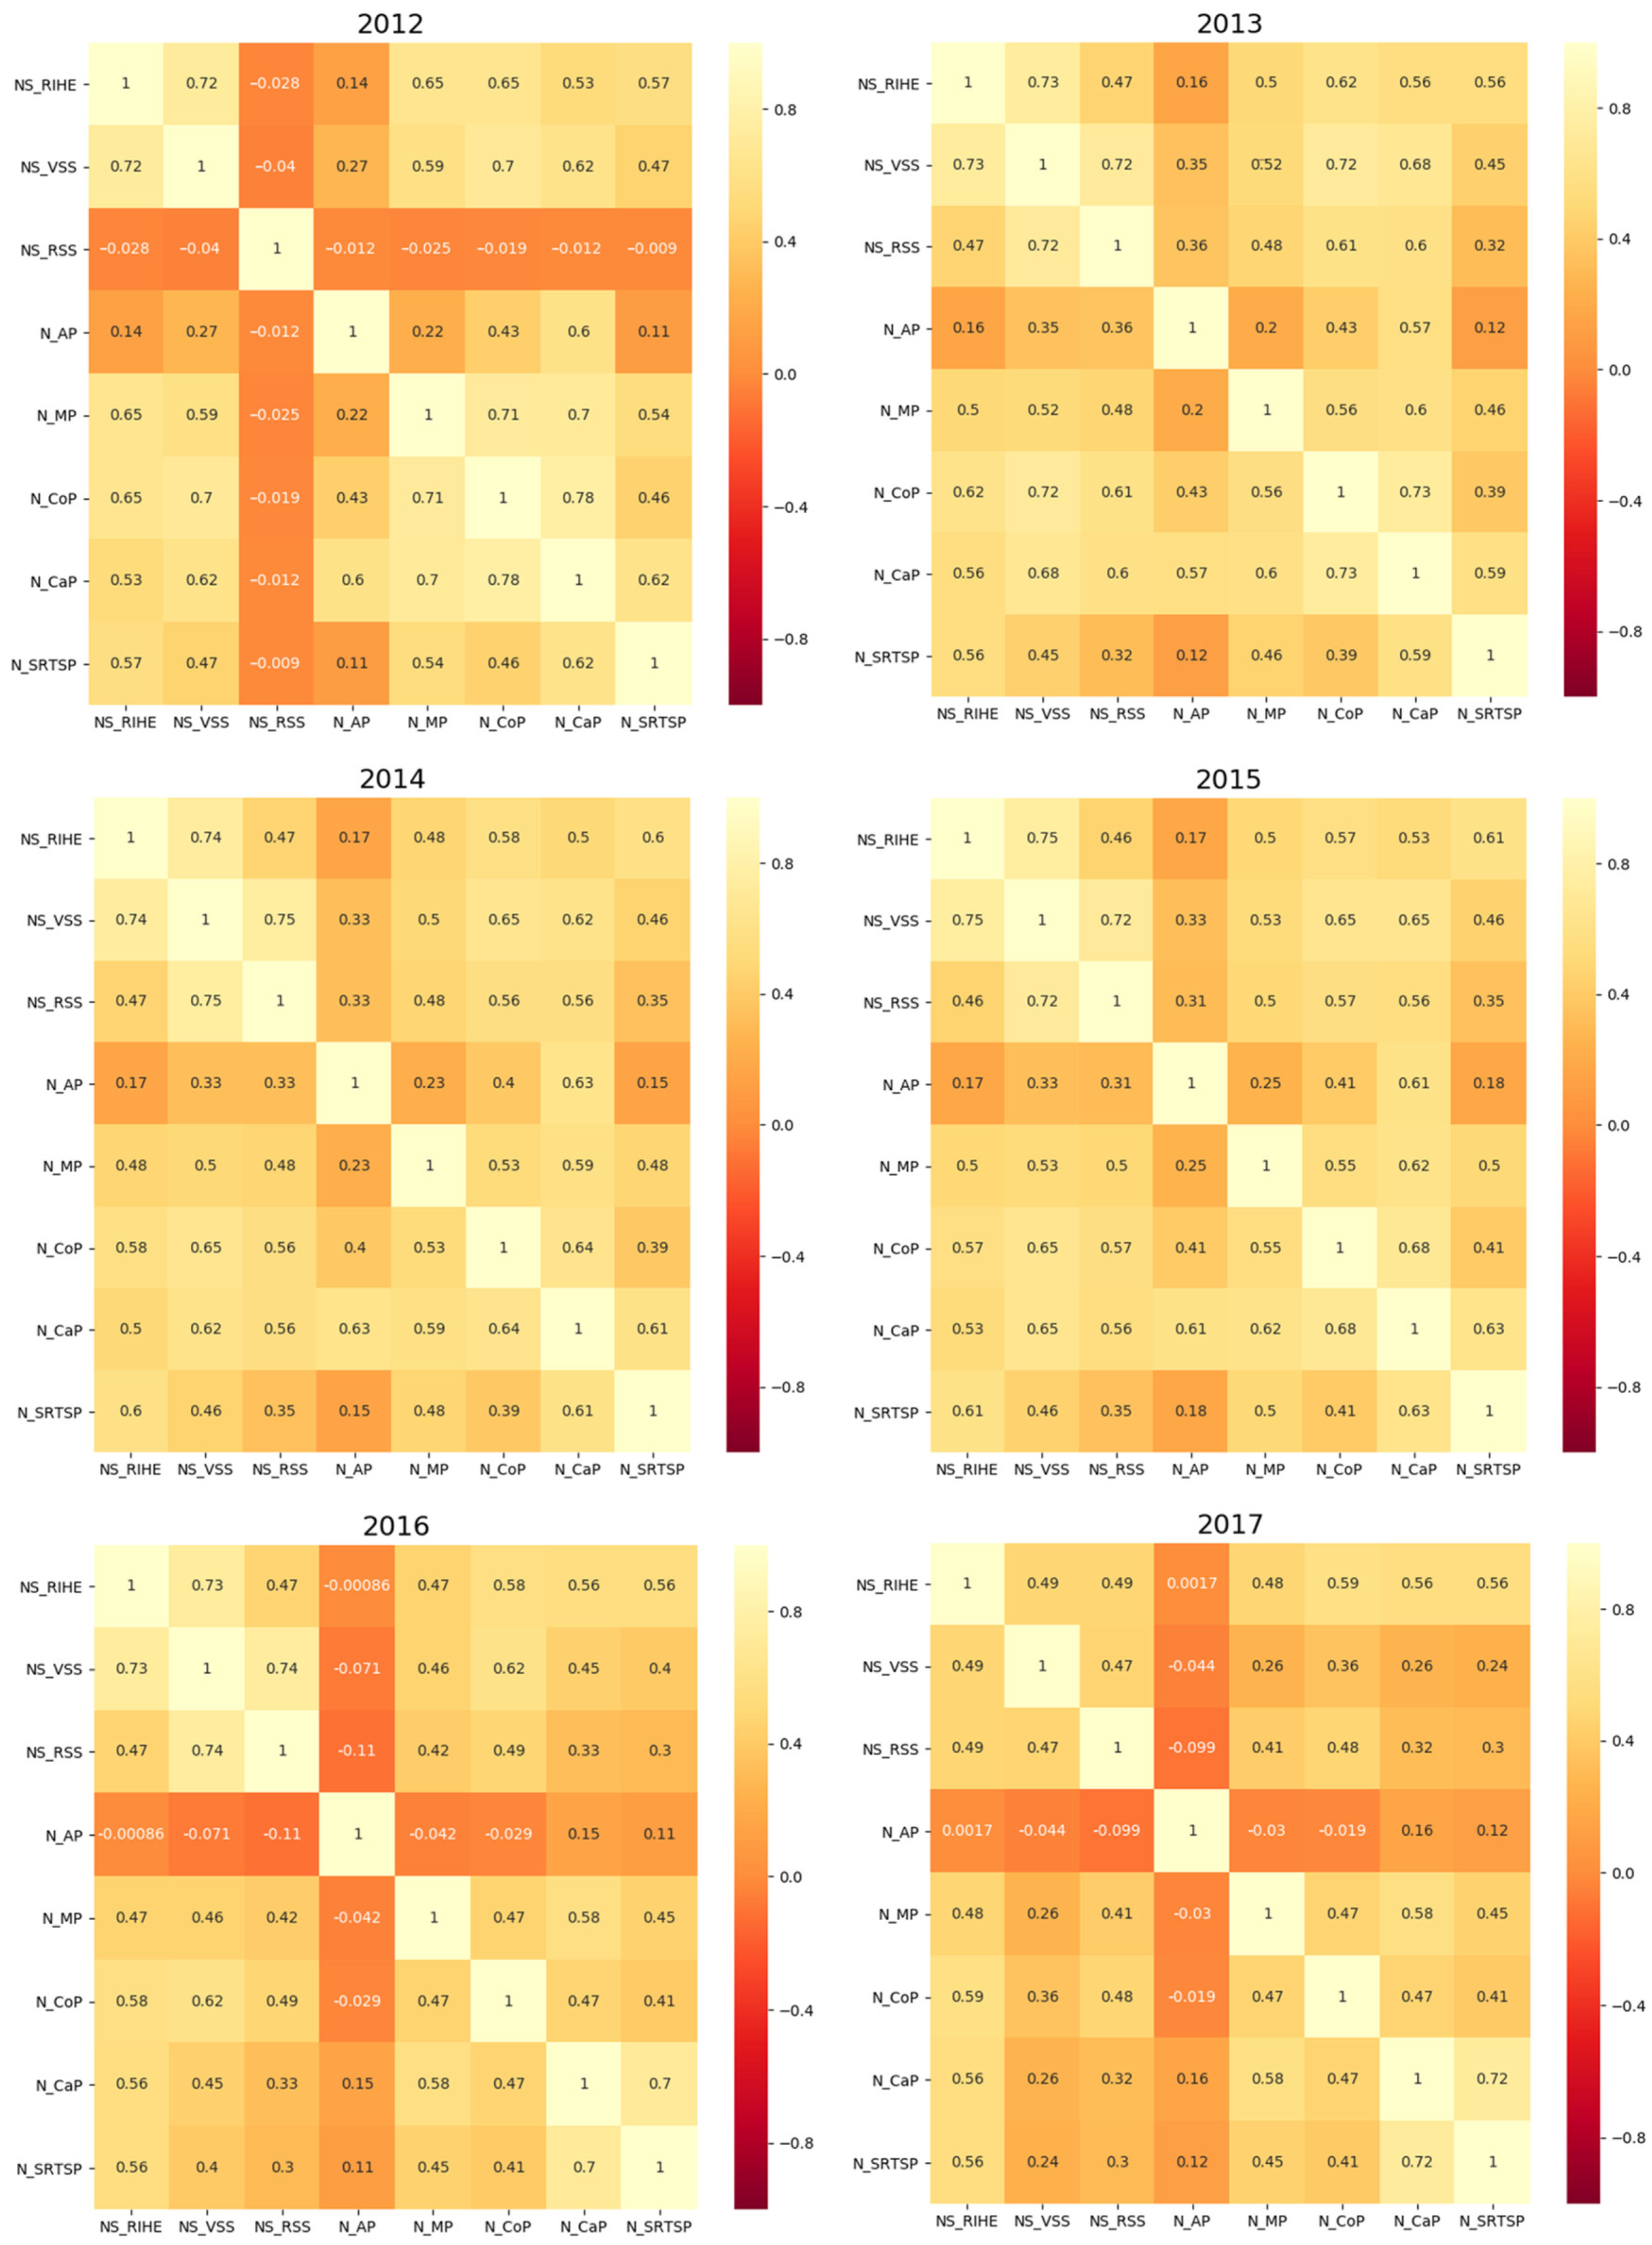
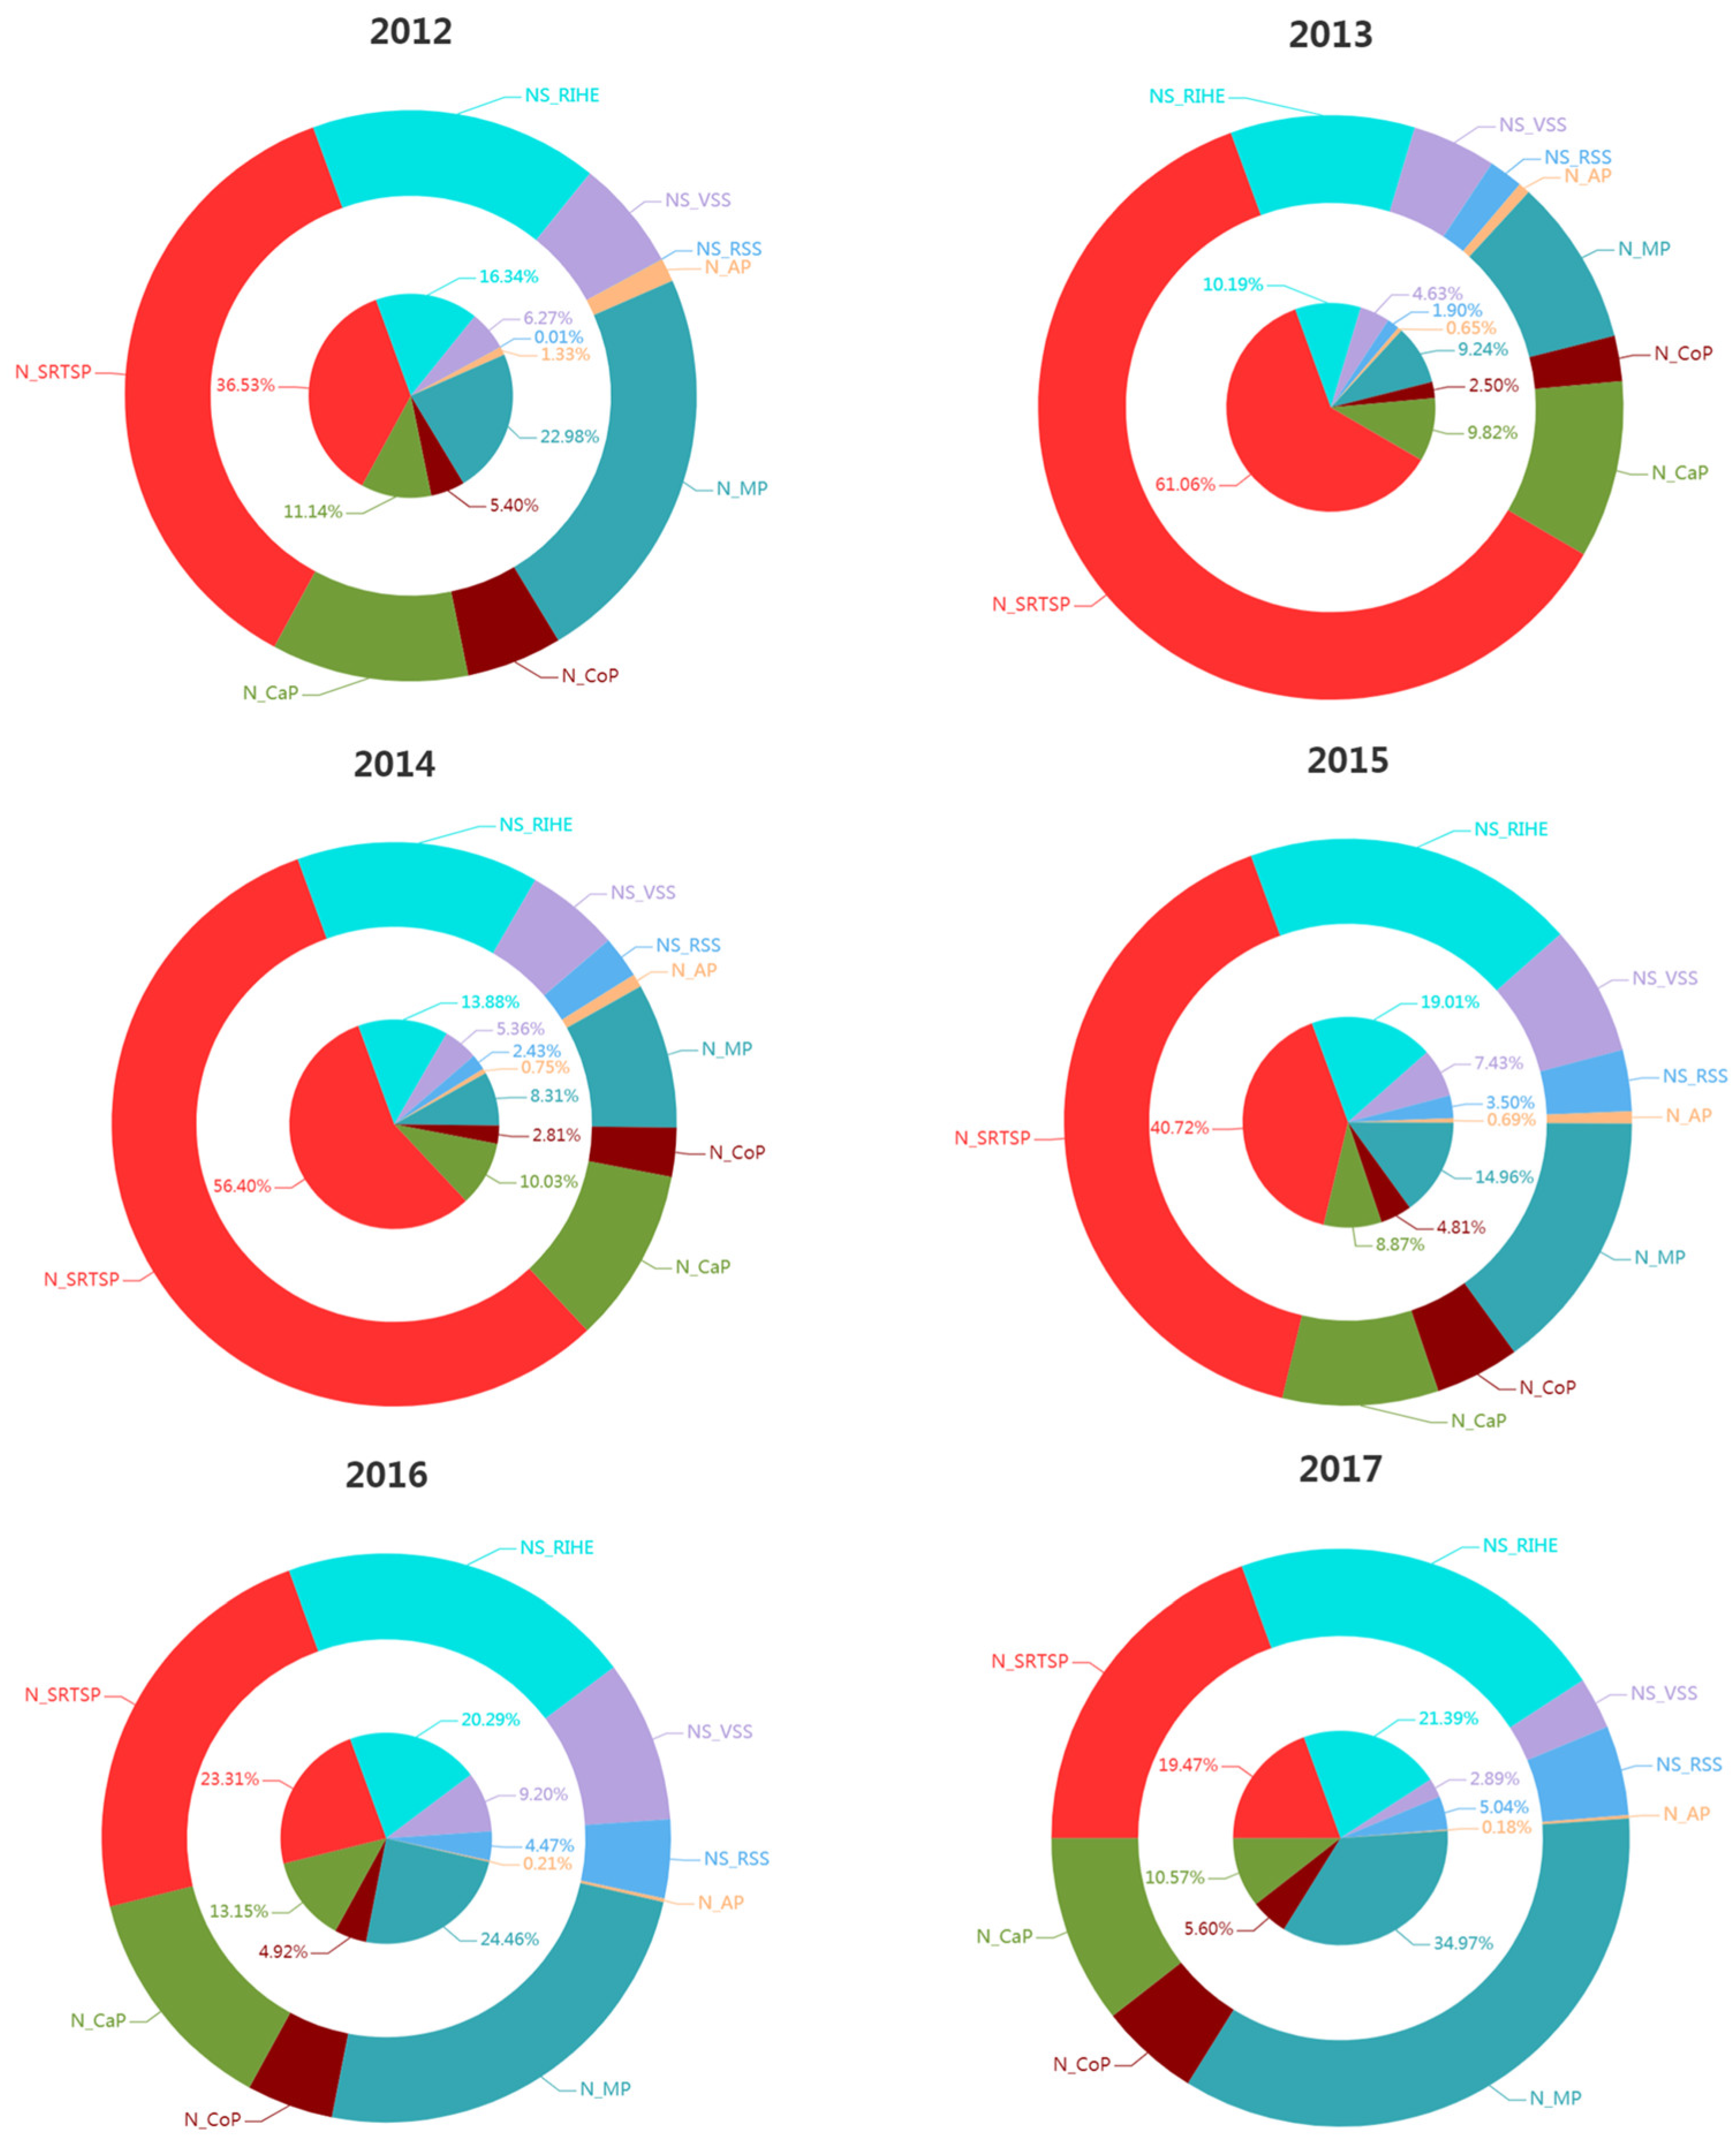
5.1. Gravity Model
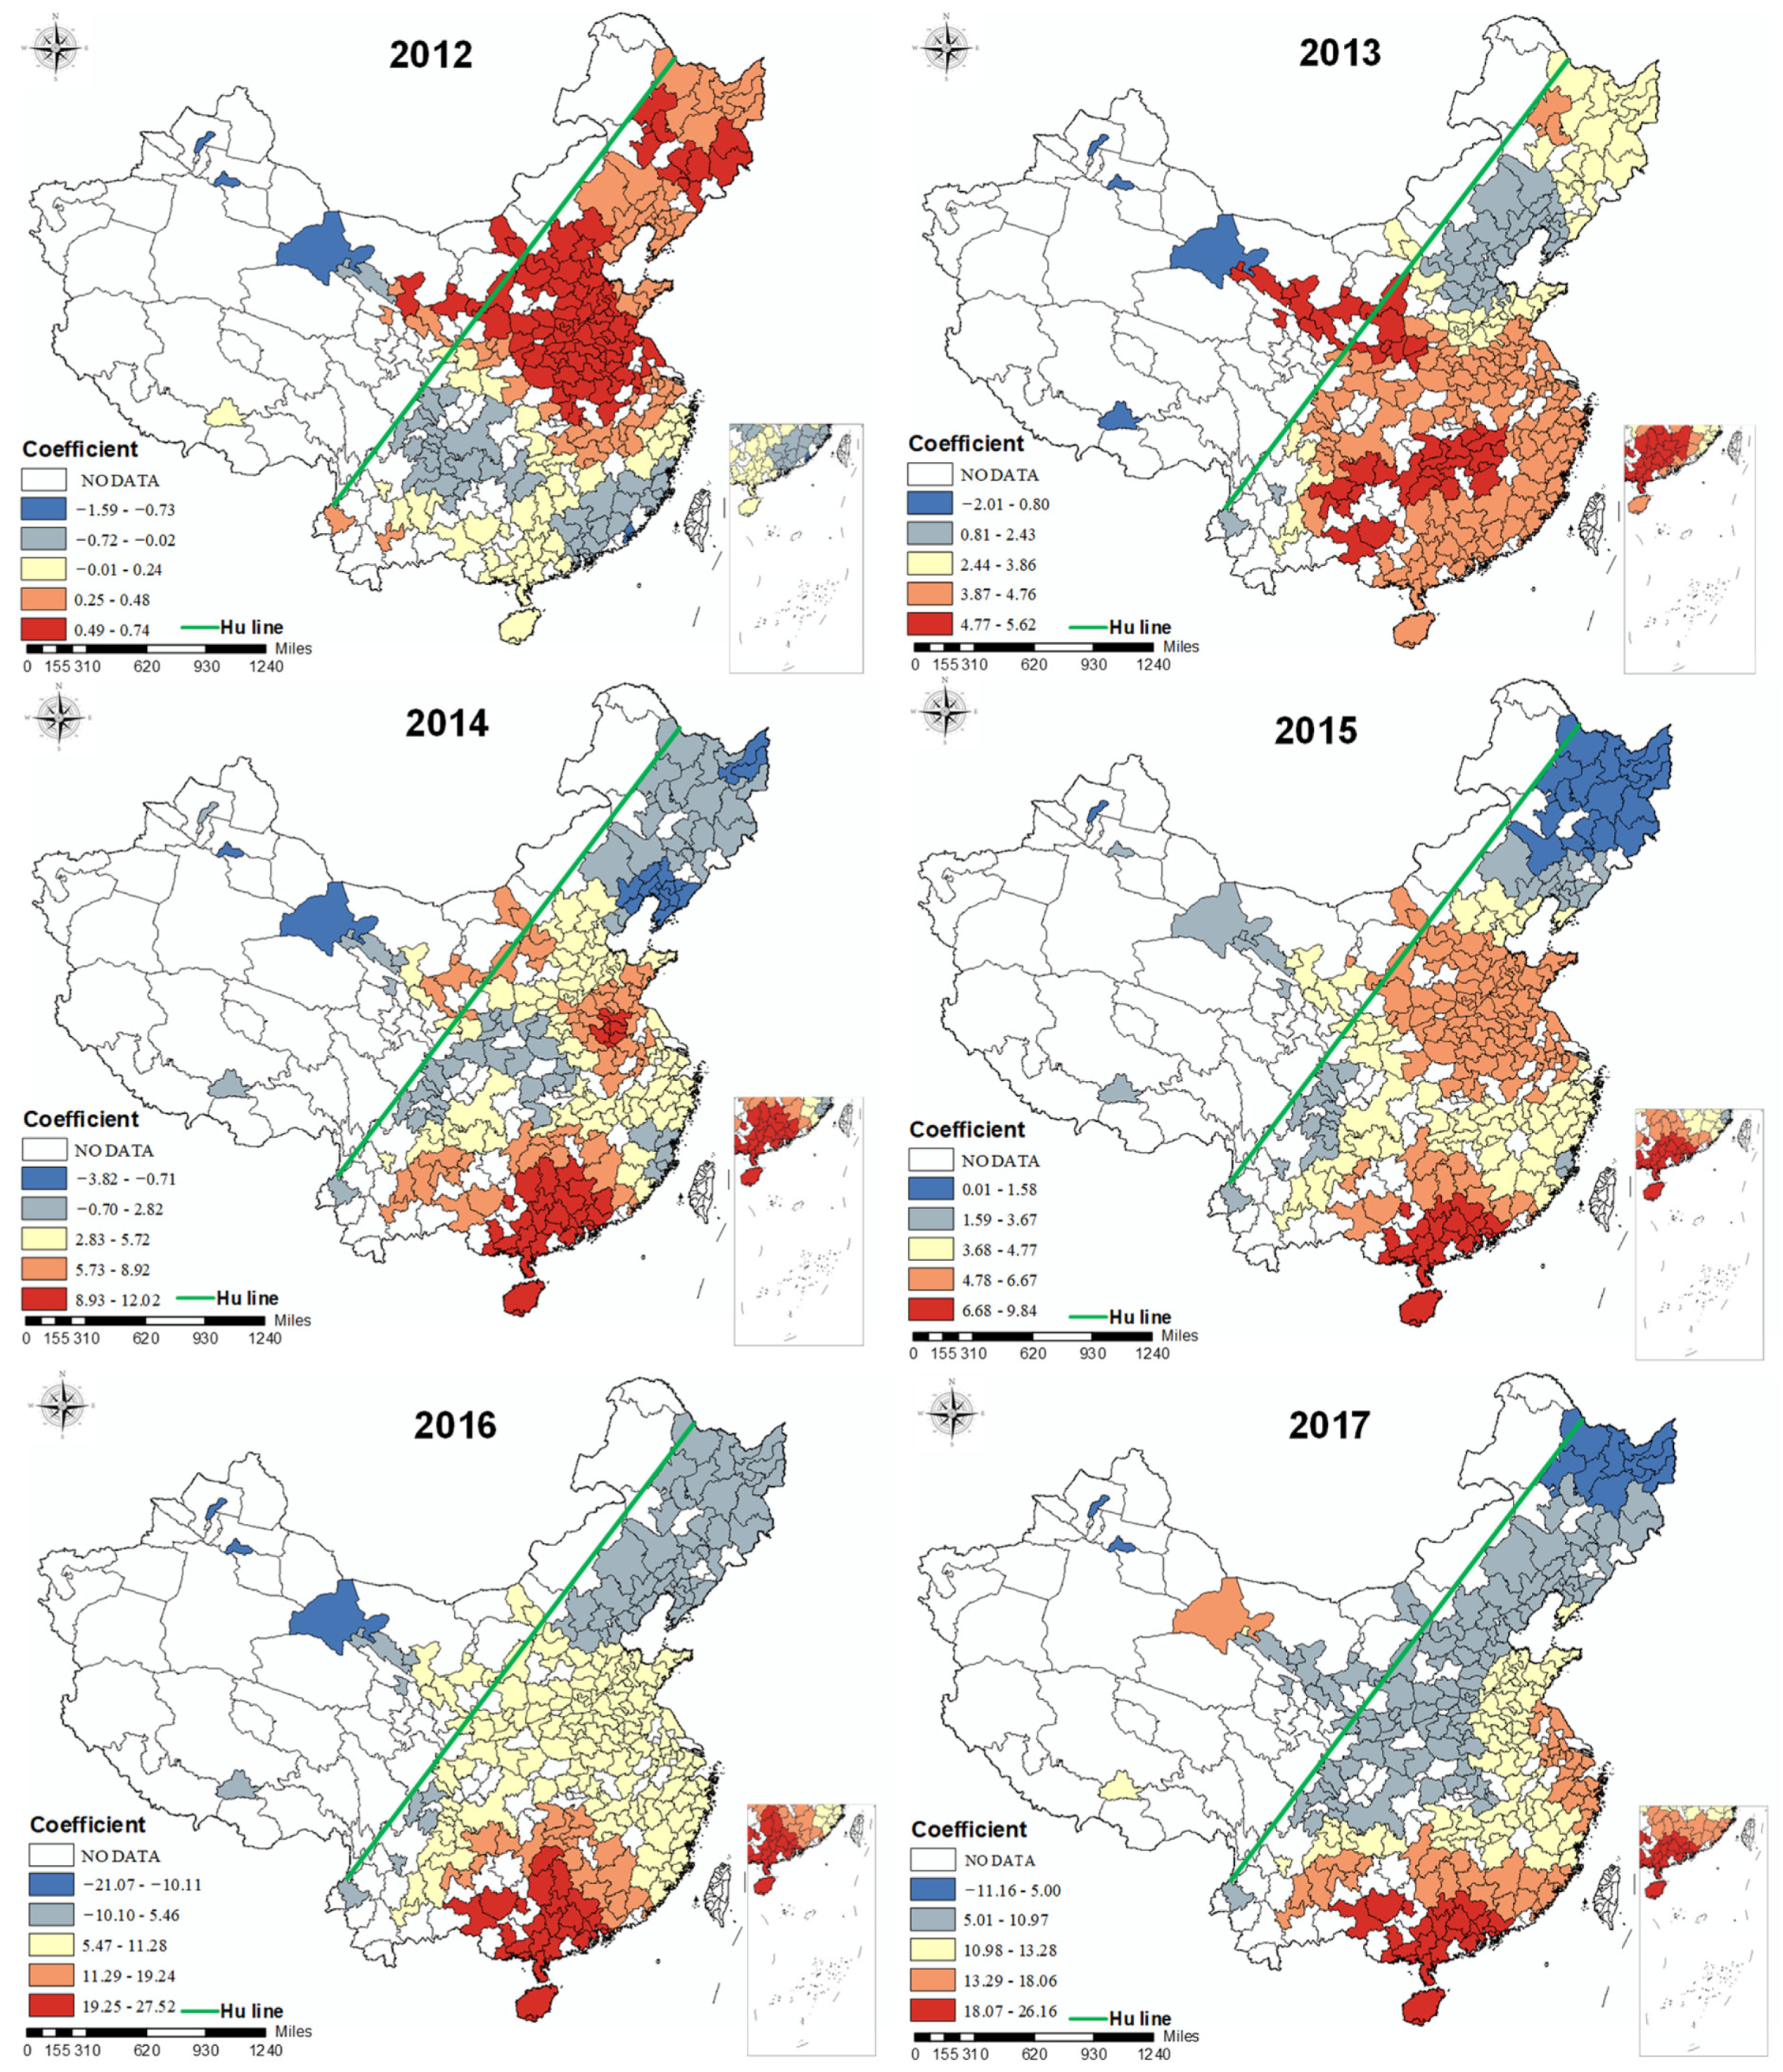
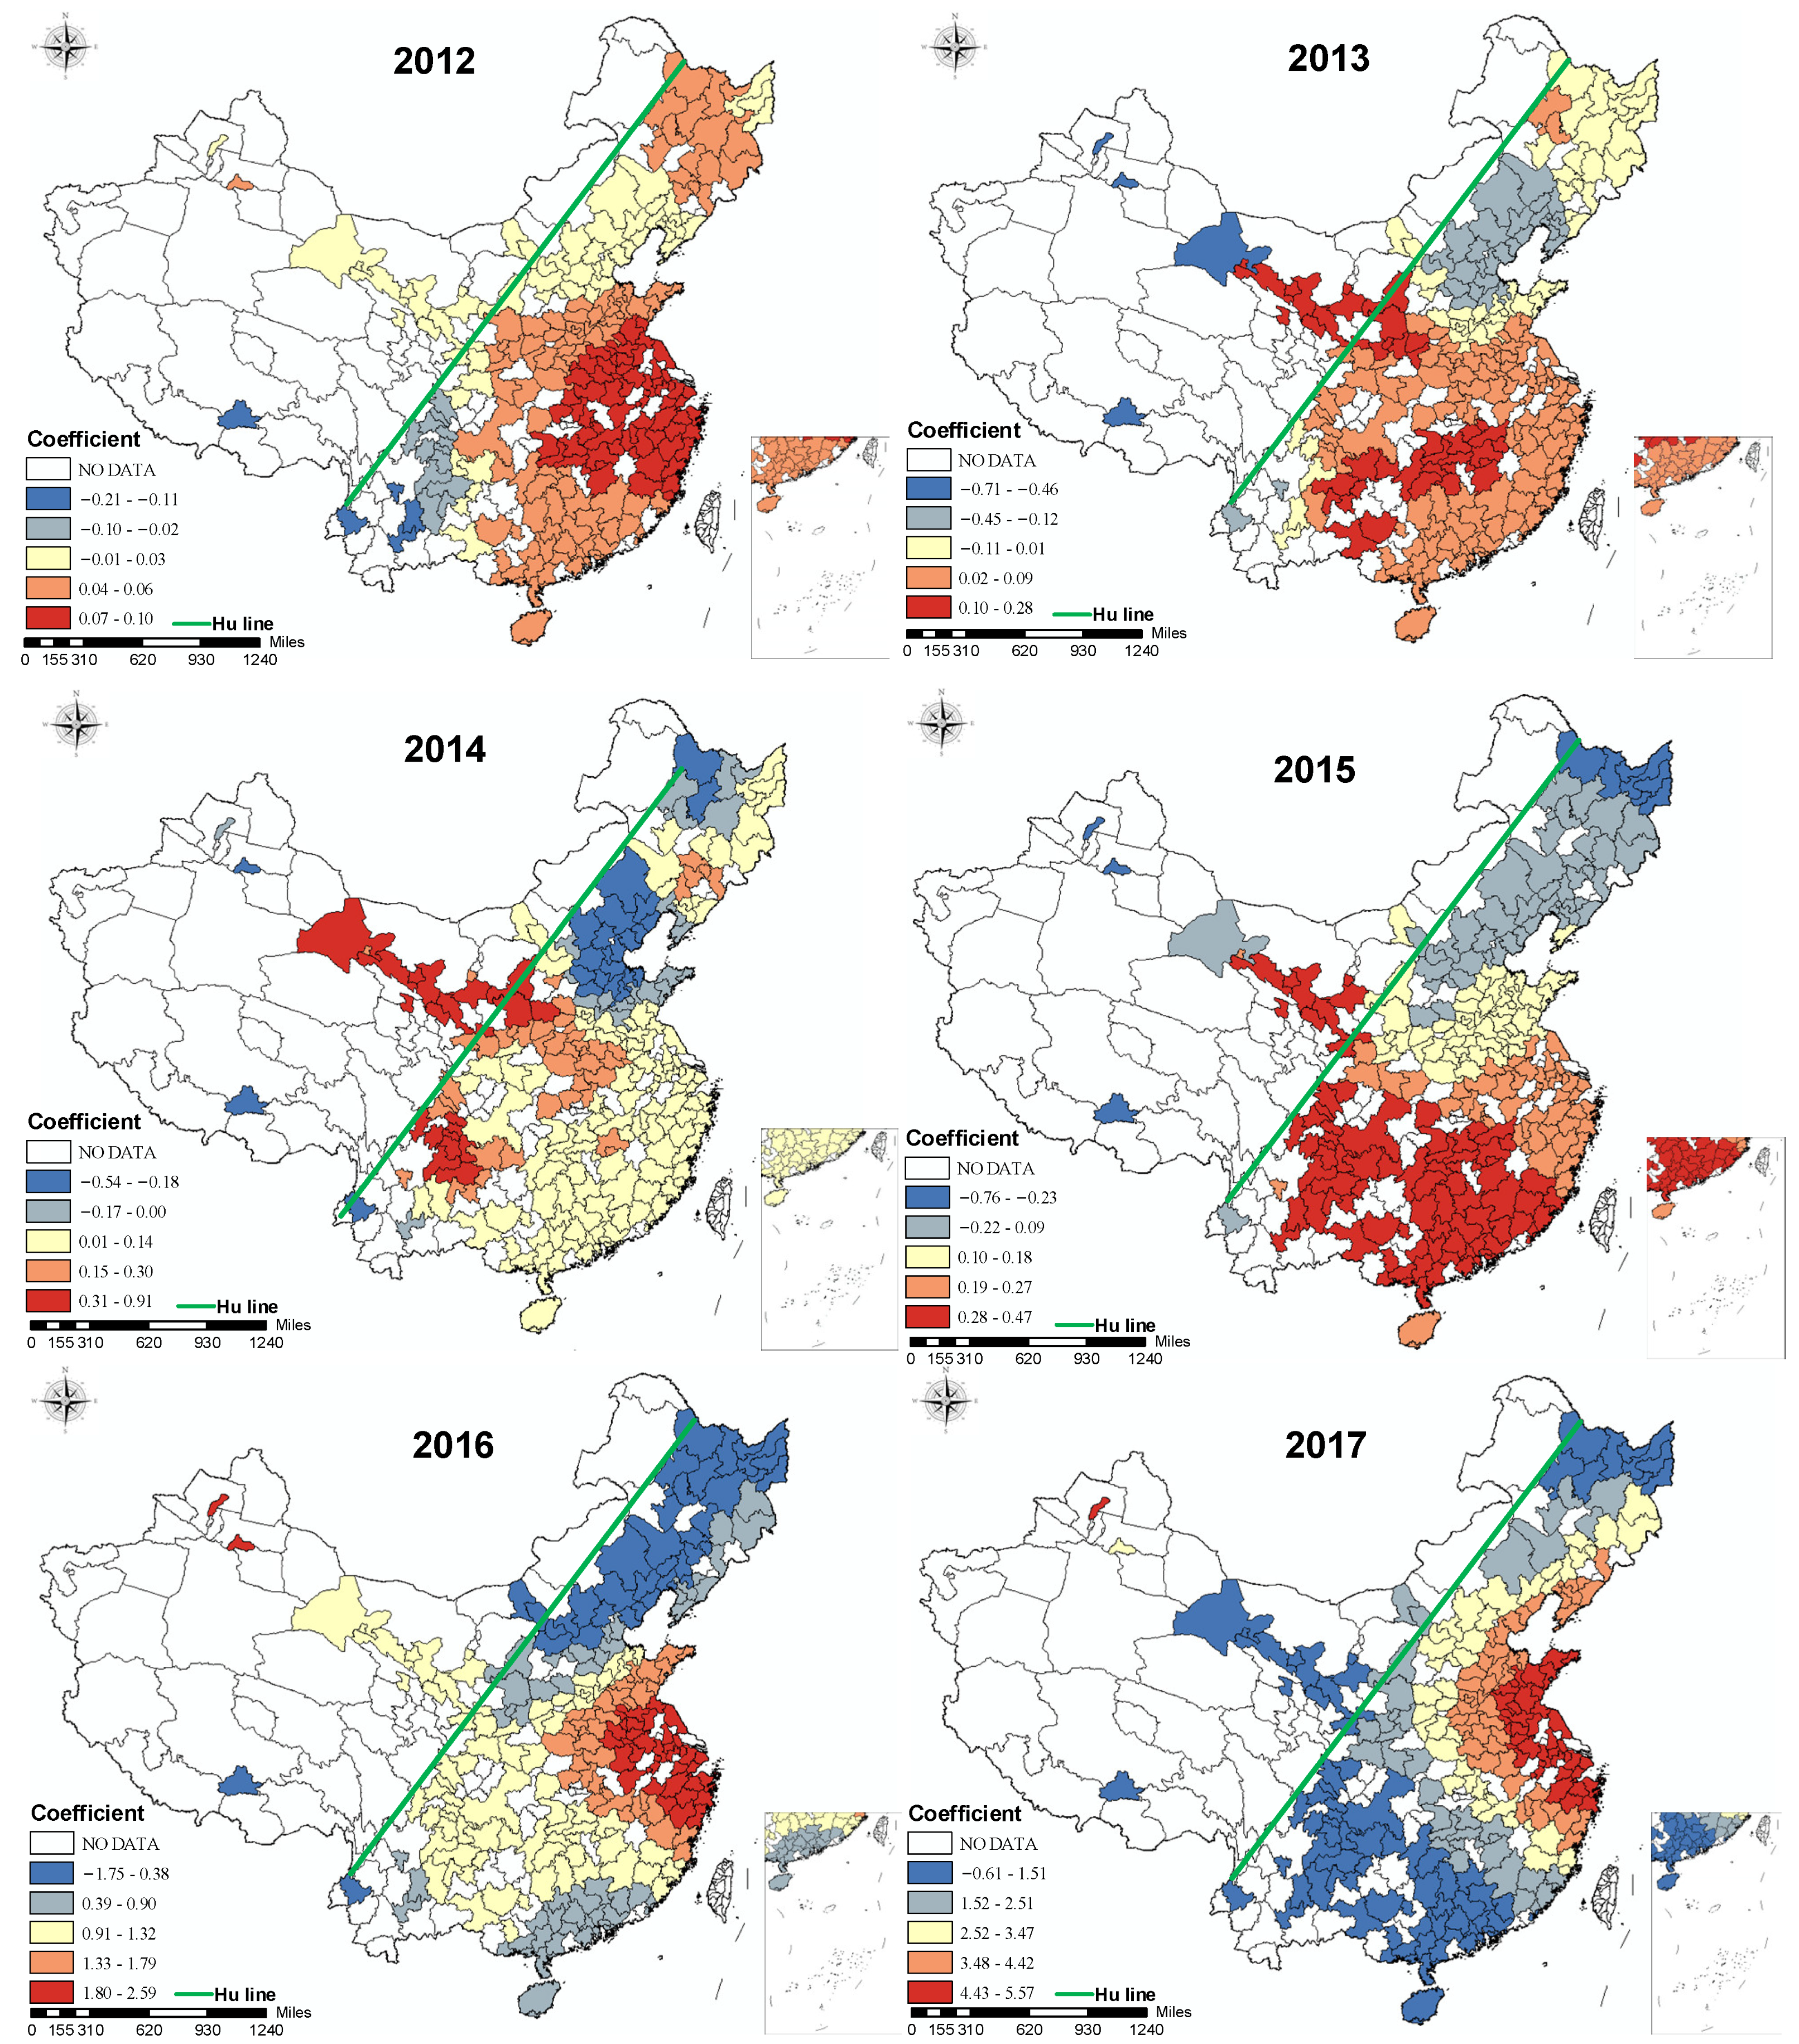
5.2. GWR
5.3. LMG
6. Discussion and Limitations
6.1. Discussion
6.1.1. Number of Science and Technology Personnel (N_SRTSP)
6.1.2. Number of Students in Regular Institutions of Higher Education (NS_RIHE)
6.1.3. Number of Manufacturing Practitioners (N_MP)
6.2. Limitations
7. Conclusions
Author Contributions
Funding
Institutional Review Board Statement
Informed Consent Statement
Data Availability Statement
Conflicts of Interest
References
- Smith, M.E. A study of the causes of feelings of inferiority. J. Psychol. 1938, 5, 315–332. [Google Scholar] [CrossRef]
- Peeters, M.C.W.; Buunk, B.P.; Schaufeli, W.B. Social interactions and feelings of inferiority among correctional officers—A daily event-recording approach. J. Appl. Soc. Psychol. 1995, 25, 1073–1089. [Google Scholar] [CrossRef] [Green Version]
- Bagherian, F.; Asgari, A. Reliability, Validity and Standardization the Comparative Feeling of Inferiority Index. 2017. Available online: https://www.sid.ir/paper/151837/en (accessed on 24 October 2022).
- Meng, J. On Inferiority Mental of College Students; Southwest University: Chongqing, China, 2005. [Google Scholar]
- Zhang, X.C.; Sun, Y.R.; Zheng, A.Y.; Wang, Y. A New Approach to Refining Land Use Types: Predicting Point-of-Interest Categories Using Weibo Check-in Data. ISPRS Int. J. Geo-Inf. 2020, 9, 124. [Google Scholar] [CrossRef] [Green Version]
- Han, P. Inferiority Feelings of College Student: A Research Based on Social Comparison. Master’s Thesis, Guangxi Normal University, Guangxi, China, 2006. [Google Scholar]
- Tian, X.; Yu, G.; He, F. An analysis of sleep complaints on Sina Weibo. Comput. Hum. Behav. 2016, 62, 230–235. [Google Scholar] [CrossRef]
- Akdoğan, R.; Çimşir, E. Linking inferiority feelings to subjective happiness: Self-concealment and loneliness as serial mediators. Pers. Individ. Differ. 2019, 149, 14–20. [Google Scholar] [CrossRef]
- Yu, J. Inferiority Complex Formation Factors from the Family Environment. Guide Sci. Educ. 2012, 8, 230–231. [Google Scholar]
- Kabir, S.; Rashid, U.K. Interpersonal Values, Inferiority Complex, and Psychological Well-being of Teenage Students. Tagannath Univ. J. Life Earth Sci. 2017, 3, 127–135. [Google Scholar]
- Toyama, T.; Nakasuga, T.; Sugiyama, Y. Inferiority complex seen as a like or dislike and adaptation to physical education classes in junior high school students. Int. J. Sport Exerc. Psychol. 2021, 19, S446–S447. [Google Scholar]
- Wilkinson, R.G. Health, hierarchy, and social anxiety. Ann. N. Y. Acad. Sci. 1999, 896, 48–63. [Google Scholar] [CrossRef]
- Kepalaitė, A. Peculiarities of teachers’ inferiority feeling and experienced stress. Soc. Welf. Interdiscip. Approach 2015, 5, 54–62. [Google Scholar] [CrossRef]
- Li, S.; Chen, S. Analysis of influencing factors and countermeasures of college students’ physical health level. Basic Clin. Pharmacol. Toxicol. 2019, 125, 58. [Google Scholar]
- Simons, A.M.; Koster, A.; Groffen, D.A.; Bosma, H. Perceived classism and its relation with socioeconomic status, health, health behaviours and perceived inferiority: The Dutch Longitudinal Internet Studies for the Social Sciences (LISS) panel. Int. J. Public Health 2017, 62, 433–440. [Google Scholar] [CrossRef] [Green Version]
- Yang, J. A Research on Middle School Students Inferiority Feelings and Its Relationship with Social Comparison and Achievement Motivation; Chongqing Normal University: Chongqing, China, 2013. [Google Scholar]
- Tian, X.; He, F.; Batterham, P.; Wang, Z.; Yu, G. An Analysis of Anxiety-Related Postings on Sina Weibo. Int. J. Environ. Res. Public Health 2017, 14, 775. [Google Scholar] [CrossRef] [Green Version]
- Li, A.; Jiao, D.; Zhu, T. Detecting depression stigma on social media: A linguistic analysis. J. Affect. Disord. 2018, 232, S0165032717321845. [Google Scholar] [CrossRef]
- Huang, W.D.; Qian, C.; Cui, Y. Study on multimedia network Weibo situational awareness model and emotional algorithm. Multimed. Tools Appl. 2020, 79, 10383–10403. [Google Scholar] [CrossRef]
- Liu, Y.; Luo, Q.; Shen, H.; Zhuang, S.; Deng, H. Social Media Big Data-Based Research on the Influencing Factors of Insomnia and Spatiotemporal Evolution. IEEE Access 2020, 8, 41516–41529. [Google Scholar] [CrossRef]
- Roszkowska, N.; Lazarus, E.; Bannon, J.A.; Dowshen, N.; Stevens, R. From bots to jokes: Is there a place for hiv prevention on twitter? J. Adolesc. Health 2020, 66, S1–S2. [Google Scholar] [CrossRef]
- Lin, L.; Lei, Y.; Zhu, H.; Dai, R.; Torres, C.O.C. Explorative Analysis of Wuhan Intra-Urban Human Mobility Using Social Media Check-In Data. PLoS ONE 2015, 10, e0135286. [Google Scholar]
- Zhou, Y. Research on the Impact of Manufacturing Upgrade on Employment. Master’s Thesis, Lanzhou University of Finance and Economics, Lanzhou, China, 2020. [Google Scholar]
- Zhou, J.; Ye, S.L.; Lan, W.; Jiang, Y.W. The effect of social media on corporate violations: Evidence from Weibo posts in China. Int. Rev. Finance 2021, 21, 966–988. [Google Scholar] [CrossRef]
- Li, X. The Plight of the Legalization of Gay Organizations and Their Thinking. Ph.D. Thesis, Southwest University of Political Science & Law, Chongqing, China, 2015. [Google Scholar]
- Song, C.; Guo, C.Y.; Hunt, K.; Zhuang, J. An Analysis of Public Opinions Regarding Take-Away Food Safety: A 2015–2018 Case Study on Sina Weibo. Foods 2020, 9, 511. [Google Scholar] [CrossRef] [Green Version]
- Su, X.; Spierings, B.; Hooimeijer, P.; Scheider, S. Where day trippers and tourists go: Comparing the spatio-temporal distribution of Mainland Chinese visitors in Hong Kong using Weibo data. Asia Pac. J. Tour. Res. 2020, 25, 505–523. [Google Scholar] [CrossRef]
- Zhou, L.; Zhou, C.; Yang, F.; Wang, B.; Sun, D. Spatio-temporal evolution and the influencing factors of PM2.5 in China between 2000 and 2015. J. Geogr. Sci. 2019, 29, 253–270. [Google Scholar] [CrossRef] [Green Version]
- Gao, J.; Li, C.N. Version 2.0 of Building World-Class Universities in China: Initial Outcomes and Problems of the Double World-Class Project. High. Educ. Policy 2020, 35, 397–413. [Google Scholar] [CrossRef]
- Wang, M.; Ye, C. Evaluation of City Green Manufacturing Level Based on Optimal Combination Weight and GRA: Taking “Made in China 2025” Demonstration Cities as an Example. Ecol. Econ. 2022, 38, 8. [Google Scholar]
- Liu, G. Research on Psychological Health Education of Graduate Employment under the Employment Plight; Results of 2016 International Conference on Education Innovation and Practice (Education Innovation and Practice Volume II); China Scientific Research Publishing: Wuhan, China, 2016; pp. 153–158. [Google Scholar]
- Soo, K.K.; Choi, T.; Han, N.; Hwan, S.Y.; Cha, H.; Nam, Y.-S. A Comparison of Factors Affecting Perspective on Body Type, Appearance Satisfaction, and Subjective Health Status Level of Diet Behavior of Korean and Japanese Female College Students. Korean J. Sport Stud. 2019, 58, 329–343. [Google Scholar]
- Zhou, X. Comparing the Effectiveness of Acceptance and Commitment Therapy and Rational-Emotional-Behavior Therapy on University Students’ Inferiority Feelings. Ph.D. Thesis, Northeast Normal University, Changchun, China, 2019. [Google Scholar]
- Benson, E.D.; Hansen, J.L.; Schwartz, A.L.; Smersh, G.T. Pricing Residential Amenities: The Value of a View. J. Real Estate Finance Econ. 1998, 16, 55–73. [Google Scholar] [CrossRef]
- Brunsdon, C.; Fotheringham, A.S.; Charlton, M.E. Geographically weighted regression: A method for exploring spatial nonstationarity. Geogr. Anal. 1996, 28, 281–298. [Google Scholar] [CrossRef]
- Zhao, Y. The Relationship of Psychological Stress, Type a Personality, Psychological Capital and Psychological Stress Response in College Student. Ph.D. Thesis, Fujian Normal University, Fujian, China, 2017. [Google Scholar]
- Zhang, C.; Xu, W.; Lu, H. Longitudinal relationship between inferiority and aggression in Chinese college students: The moderation of left-behind experience. Pers. Individ. Differ. 2020, 156, 109791. [Google Scholar] [CrossRef]
- Sun, W.F.; Yang, W.B.; Sun, G.H.; Yang, X. Inferiority complex of higher vocational students based on improved random sampling. J. Comput. Methods Sci. Eng. 2021, 21, 1739–1746. [Google Scholar] [CrossRef]
- Wei, Y. Research on Psychological Problems of Single Mother Case Work—Taking the City of Anshan X Community as the Example. Master’s Thesis, Liaoning University, Liaoning, China, 2016. [Google Scholar]
- Rao, W.; Tian, Y.; Jing, Y. The status quo of research on inferiority of university students. Chin. Nurs. Res. 2009, 23, 3011–3013. [Google Scholar]
- Li, J.; Huang, F.; Zhang, X. An Analysis of Doctoral Students’ “Difficulties in Graduation” and Its Countermeasures. J. Jimei Univ. 2017, 18, 50–57. [Google Scholar]
- Fotheringham, A.S.; Oshan, T.M. Geographically weighted regression and multicollinearity: Dispelling the myth. J. Geogr. Syst. 2016, 18, 303–329. [Google Scholar] [CrossRef]
- Fotheringham, A.S.; Yang, W.B.; Kang, W. Multiscale Geographically Weighted Regression (MGWR). Ann. Am. Assoc. Geogr. 2017, 107, 1247–1265. [Google Scholar] [CrossRef]
- Xu, H.; Caramanis, C.; Sanghavi, S. Robust PCA via Outlier Pursuit. IEEE Trans. Inf. Theory 2012, 58, 3047–3064. [Google Scholar] [CrossRef] [Green Version]
- Granato, D.; Santos, J.S.; Escher, G.B.; Ferreira, B.L.; Maggio, R.M. Use of principal component analysis (PCA) and hierarchical cluster analysis (HCA) for multivariate association between bioactive compounds and functional properties in foods: A critical perspective. Trends Food Sci. Technol. 2018, 72, 83–90. [Google Scholar] [CrossRef]
- Zhao, K.; You, Z. Isomorphism, Diversification, and Strategic Ambiguity: Goal Setting of Chinese Higher Education Institutions in the Double World-Class Project. High. Educ. Policy 2021, 34, 841–860. [Google Scholar] [CrossRef]
- Luo, F.; Huang, R. Research on Early Warning and Precontrol Management of Brain Drain Based on Work Pressure. Wuhan Univ. Technol. 2010, 23, 4. [Google Scholar]
- Guo, B.; Lu, S. The Characteristics of the Talent Recruitment Policies of Higher-learning Institutions and the Related Problems and the Counter Measures: Based on the analysis from six Normal Universities Affiliated to the Ministry of Education. J. Grad. Educ. 2020, 5, 70–82. [Google Scholar]
- Myung, S.S. A Study on the Effects of College Students’ vocational Image on Major Satisfaction and Career Identity Formation -Focused on the college students with Aviation Service Major. J. Employ. Career 2020, 10, 55–77. [Google Scholar]
- Micu, M.; Carstairs, C. From Improving Egos to Perfecting Smiles: Orthodontics and Psychology, 1945–2000. Can. Bull. Med. Hist. 2018, 35, 309–336. [Google Scholar] [CrossRef]
- Yang, X. The estimation on LGBT population size: The international experiences and China’s challenges. Chin. J. Hum. Sex. 2020, 29, 148–152. [Google Scholar]
- Min, Z.; Chen, Y.; Wang, X. An Empirical Study on the Influencing Mechanism of Undergraduate Graduation Planning and Its Trends: Based on a Ten-year Survey Data. Chin. J. Sociol. 2018, 38, 32. [Google Scholar]
- Gao, Y.; Zhang, D. Research on College Students’ Social Entrepreneurship from the Perspective of “Mass Entrepreneurship and Innovation”. Mod. Educ. Manag. 2017, 7, 119–123. [Google Scholar]
- Liu, L.; Zhao, X.; Feng, Q.; Liu, Y. Colleges and Universities Innovative Experiment Educational Practice Guided by Mass Entrepreneurship and Innovation. Res. Explor. Lab. 2019, 38, 5. [Google Scholar]
- Qiao, H. A Study on Emotion Experience of Female College Students Who Refused to Heterosexual Love Confession. Ph.D. Thesis, Hebei Normal University, Shijiazhuang, China, 2012. [Google Scholar]
- Xiong, M. Qualitative research on psychological problems of colllege students based on psychological counseling. J. Hebei Univ. Eng. 2019, 36, 90–94. [Google Scholar]
- Sivrikova, N.V.; Zherebkina, V.F.; Postnikova, M.I. The association between manifestations of intrapersonal conflict and the style of media consumption among students. Russ. Psychol. J. 2017, 14, 70–87. [Google Scholar] [CrossRef] [Green Version]
- Aird, R.E. From impostership to mastersness: Experiences of a postgraduate student’s transition to higher education reflected through poetry. J. Res. Nurs. 2017, 22, 522–532. [Google Scholar] [CrossRef]
- Wang, B.; Duan, Y.; Wang, Y.; Yan, R.; Chen, X. Exploration and Practice of Intelligent Manufacturing Talents Cultivation Facing on Dual Capability Integration of “Made in China 2025”. Res. Explor. Lab. 2021, 40, 140–144. [Google Scholar]
- Metlaine, A.; Sauvet, F.; Gomez-Merino, D.; Elbaz, M.; Delafosse, J.Y.; Leger, D.; Chennaoui, M. Association between insomnia symptoms, job strain and burnout syndrome: A cross-sectional survey of 1300 financial workers. BMJ Open 2017, 7, e012816. [Google Scholar] [CrossRef] [Green Version]
- Chen, C.; Yue, J.; Jianmin, L.I. Research about the sleep disorder and influencing factors of the aged among 22 provinces. J. North China Coal Med. Coll. 2006, 6, 749–751. [Google Scholar]
- Kalmbach, D.A.; Anderson, J.R.; Drake, C.L. The impact of stress on sleep: Pathogenic sleep reactivity as a vulnerability to insomnia and circadian disorders. J. Sleep Res. 2018, 27, 12710. [Google Scholar] [CrossRef] [Green Version]
- Kakalou, C.; Lazarus, J.V.; Koutkias, V. Mining Social Media for Perceptions and Trends on HIV Pre-Exposure Prophylaxis. Stud. Health Technol. Inform. 2019, 264, 959–963. [Google Scholar] [CrossRef]
- David, R.; Trandafira, M. “I want to fly”—Initiating a program of psychological counseling in order to mitigate the inferiority complex of teenagers in disadvantaged families. Procedia Soc. Behav. Sci. 2012, 33, 533–537. [Google Scholar] [CrossRef]
- Doikou-Avlidou, M. The educational, social and emotional experiences of students with dyslexia: The perspective of postsecondary education students. Int. J. Spec. Educ. 2015, 30, 132–145. [Google Scholar]


| Evaluation Variables | Abbreviations |
|---|---|
| Science and technology personnel | N_SRTSP |
| Agriculture practitioner | N_AP |
| Manufacturing practitioner | N_MP |
| Construction practitioner | N_CoP |
| Catering practitioner | N_CaP |
| Students in regular institutions of higher education | NS_RIHE |
| Students in vocational secondary schools | NS_VSS |
| Students in regular secondary schools | NS_RSS |
| Parameter | Year | ||||||||
|---|---|---|---|---|---|---|---|---|---|
| 2012 | 2013 | 2014 | |||||||
| Minimum | Median | Maximum | Minimum | Median | Maximum | Minimum | Median | Maximum | |
| NS_RIHE | −0.0534 | 0.0590 | 0.2996 | −0.3313 | 0.1086 | 0.7619 | −0.4790 | 0.2891 | 1.0804 |
| NS_VSS | −0.0865 | 0.0175 | 0.4143 | −0.1451 | 0.1891 | 1.4468 | −1.5932 | 0.3442 | 2.2972 |
| NS_RSS | −0.0691 | 0.0000 | 0.0381 | −0.6934 | −0.0346 | 0.0773 | −0.3086 | −0.0358 | 0.3547 |
| N_AP | −1.4327 | −0.1626 | 0.3027 | −1.4829 | 0.0554 | 0.7481 | −15.3789 | −0.2368 | 4.1427 |
| N_MP | −0.2118 | 0.0486 | 0.0982 | −0.7145 | 0.0654 | 0.2823 | −0.5402 | 0.1013 | 0.9138 |
| N_CoP | −0.2213 | −0.0748 | 0.1868 | −0.5973 | −0.1281 | 0.4169 | −2.6522 | −0.1802 | 0.9690 |
| N_CaP | −0.3638 | 0.3836 | 1.8698 | −0.4518 | 0.4568 | 9.4290 | −6.6530 | 1.0540 | 22.7483 |
| N_SRTSP | −1.5938 | 0.3543 | 0.7444 | −2.0092 | 3.8208 | 5.6299 | −3.8175 | 4.6717 | 12.0225 |
| R2 | 0.9461 | 0.9889 | 0.9922 | ||||||
| Adjusted R2 | 0.9445 | 0.9886 | 0.9912 | ||||||
| Parameter | Year | ||||||||
| 2015 | 2016 | 2017 | |||||||
| Minimum | Median | Maximum | Minimum | Median | Maximum | Minimum | Median | Maximum | |
| NS_RIHE | −0.3152 | 0.5445 | 1.2636 | 0.0896 | 1.9032 | 3.8836 | 0.3003 | 2.5261 | 4.1655 |
| NS_VSS | −1.2517 | 0.5969 | 2.5239 | −2.9009 | 1.4181 | 12.5000 | −2.5437 | −0.2303 | 3.4246 |
| NS_RSS | −0.4550 | 0.0089 | 0.3407 | −0.7487 | 0.1393 | 0.8024 | −0.5726 | 0.1804 | 5.3610 |
| N_AP | −4.5503 | −0.1929 | 4.1819 | −8.5390 | 0.2046 | 7.3217 | −12.1192 | −3.5699 | 5.7562 |
| N_MP | −0.7607 | 0.2195 | 0.4717 | −1.7539 | 1.0533 | 2.5894 | −0.6121 | 2.4634 | 5.5698 |
| N_CoP | −0.8515 | −0.0058 | 1.5422 | −3.3341 | −0.5601 | 4.6947 | −1.4113 | −0.7362 | 3.3315 |
| N_CaP | −1.7343 | 0.0921 | 10.5292 | −5.4290 | −1.1750 | 16.8510 | −27.7872 | −5.1130 | 17.1259 |
| N_SRTSP | −0.0005 | 4.8270 | 9.8378 | −21.0736 | 8.3524 | 27.5158 | −11.1621 | 11.2182 | 26.1573 |
| R2 | 0.9644 | 0.9551 | 0.7548 | ||||||
| Adjusted R2 | 0.9634 | 0.9538 | 0.7478 | ||||||
Publisher’s Note: MDPI stays neutral with regard to jurisdictional claims in published maps and institutional affiliations. |
© 2022 by the authors. Licensee MDPI, Basel, Switzerland. This article is an open access article distributed under the terms and conditions of the Creative Commons Attribution (CC BY) license (https://creativecommons.org/licenses/by/4.0/).
Share and Cite
Kuai, X.; Li, L.; Liu, Y. Research on the Spatiotemporal Evolution of the Patterns of Expressed Inferiority in Different Groups of Occupations and Education Stages. Appl. Sci. 2022, 12, 11735. https://doi.org/10.3390/app122211735
Kuai X, Li L, Liu Y. Research on the Spatiotemporal Evolution of the Patterns of Expressed Inferiority in Different Groups of Occupations and Education Stages. Applied Sciences. 2022; 12(22):11735. https://doi.org/10.3390/app122211735
Chicago/Turabian StyleKuai, Xi, Lin Li, and Yu Liu. 2022. "Research on the Spatiotemporal Evolution of the Patterns of Expressed Inferiority in Different Groups of Occupations and Education Stages" Applied Sciences 12, no. 22: 11735. https://doi.org/10.3390/app122211735