
Quality Tests of Hybrid Joint–Clinching and Adhesive—Case Study

 , , ,
, , ,
Abstract
:1. Introduction
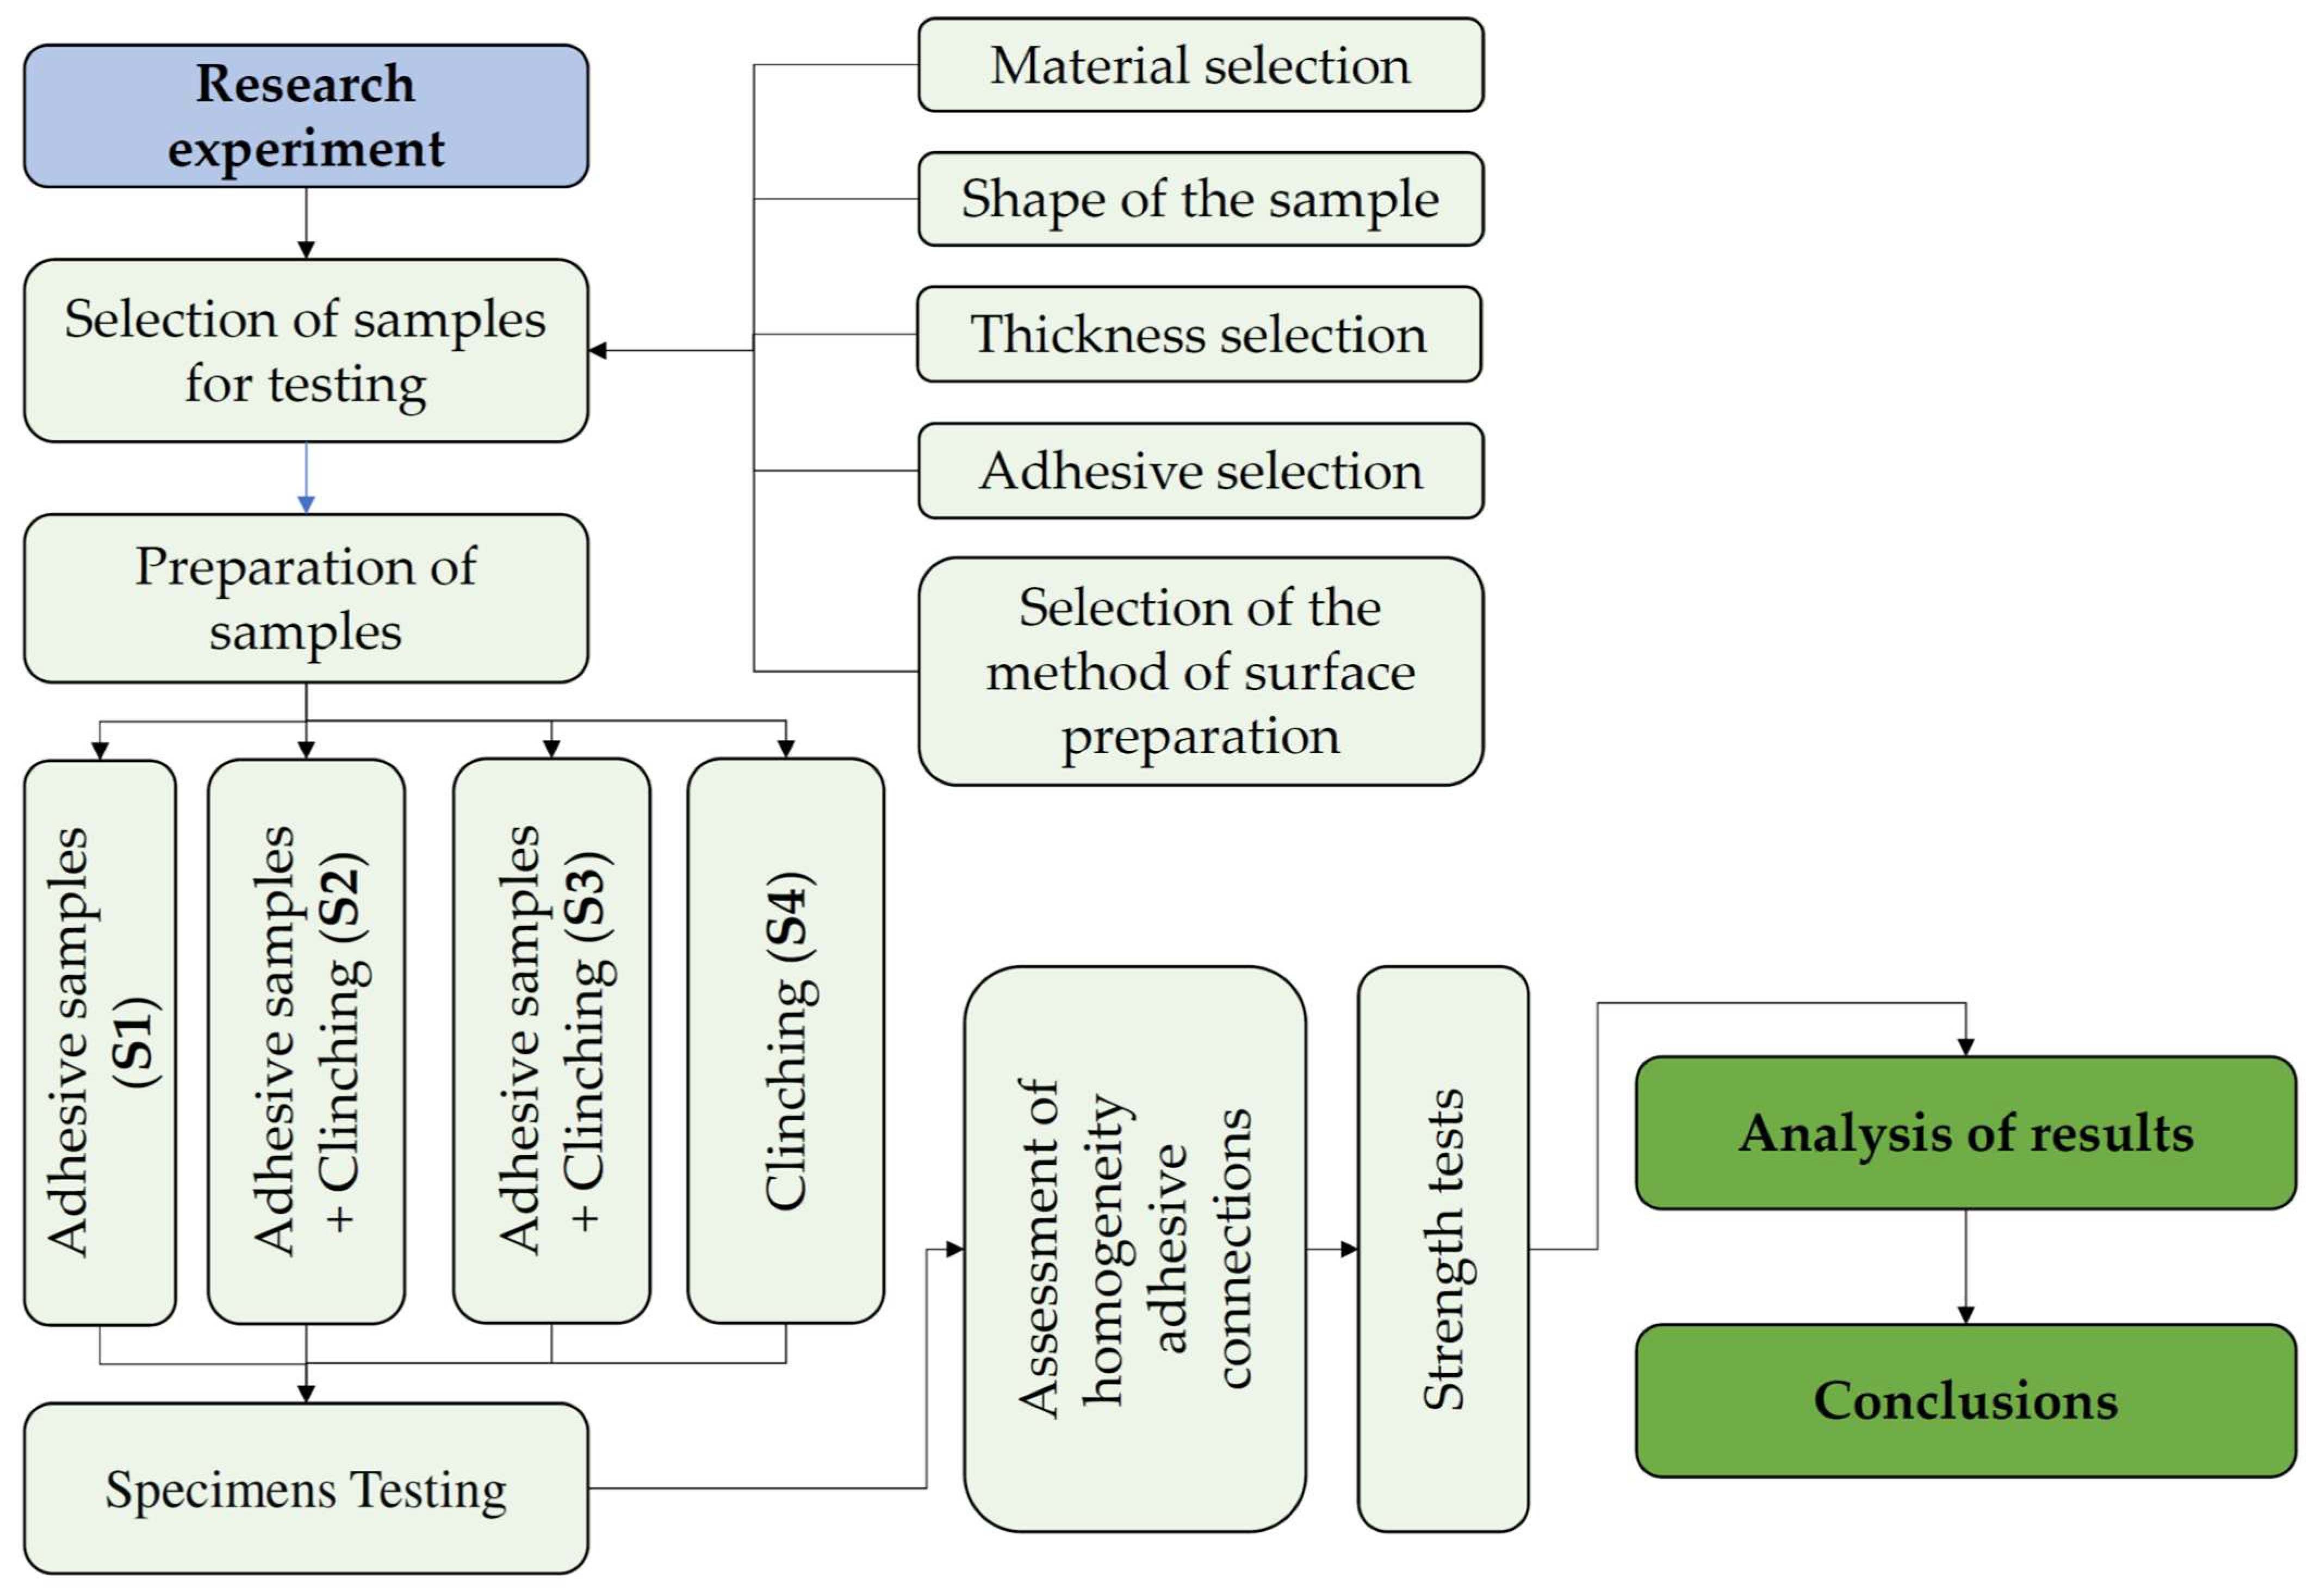
2. Materials and Methods
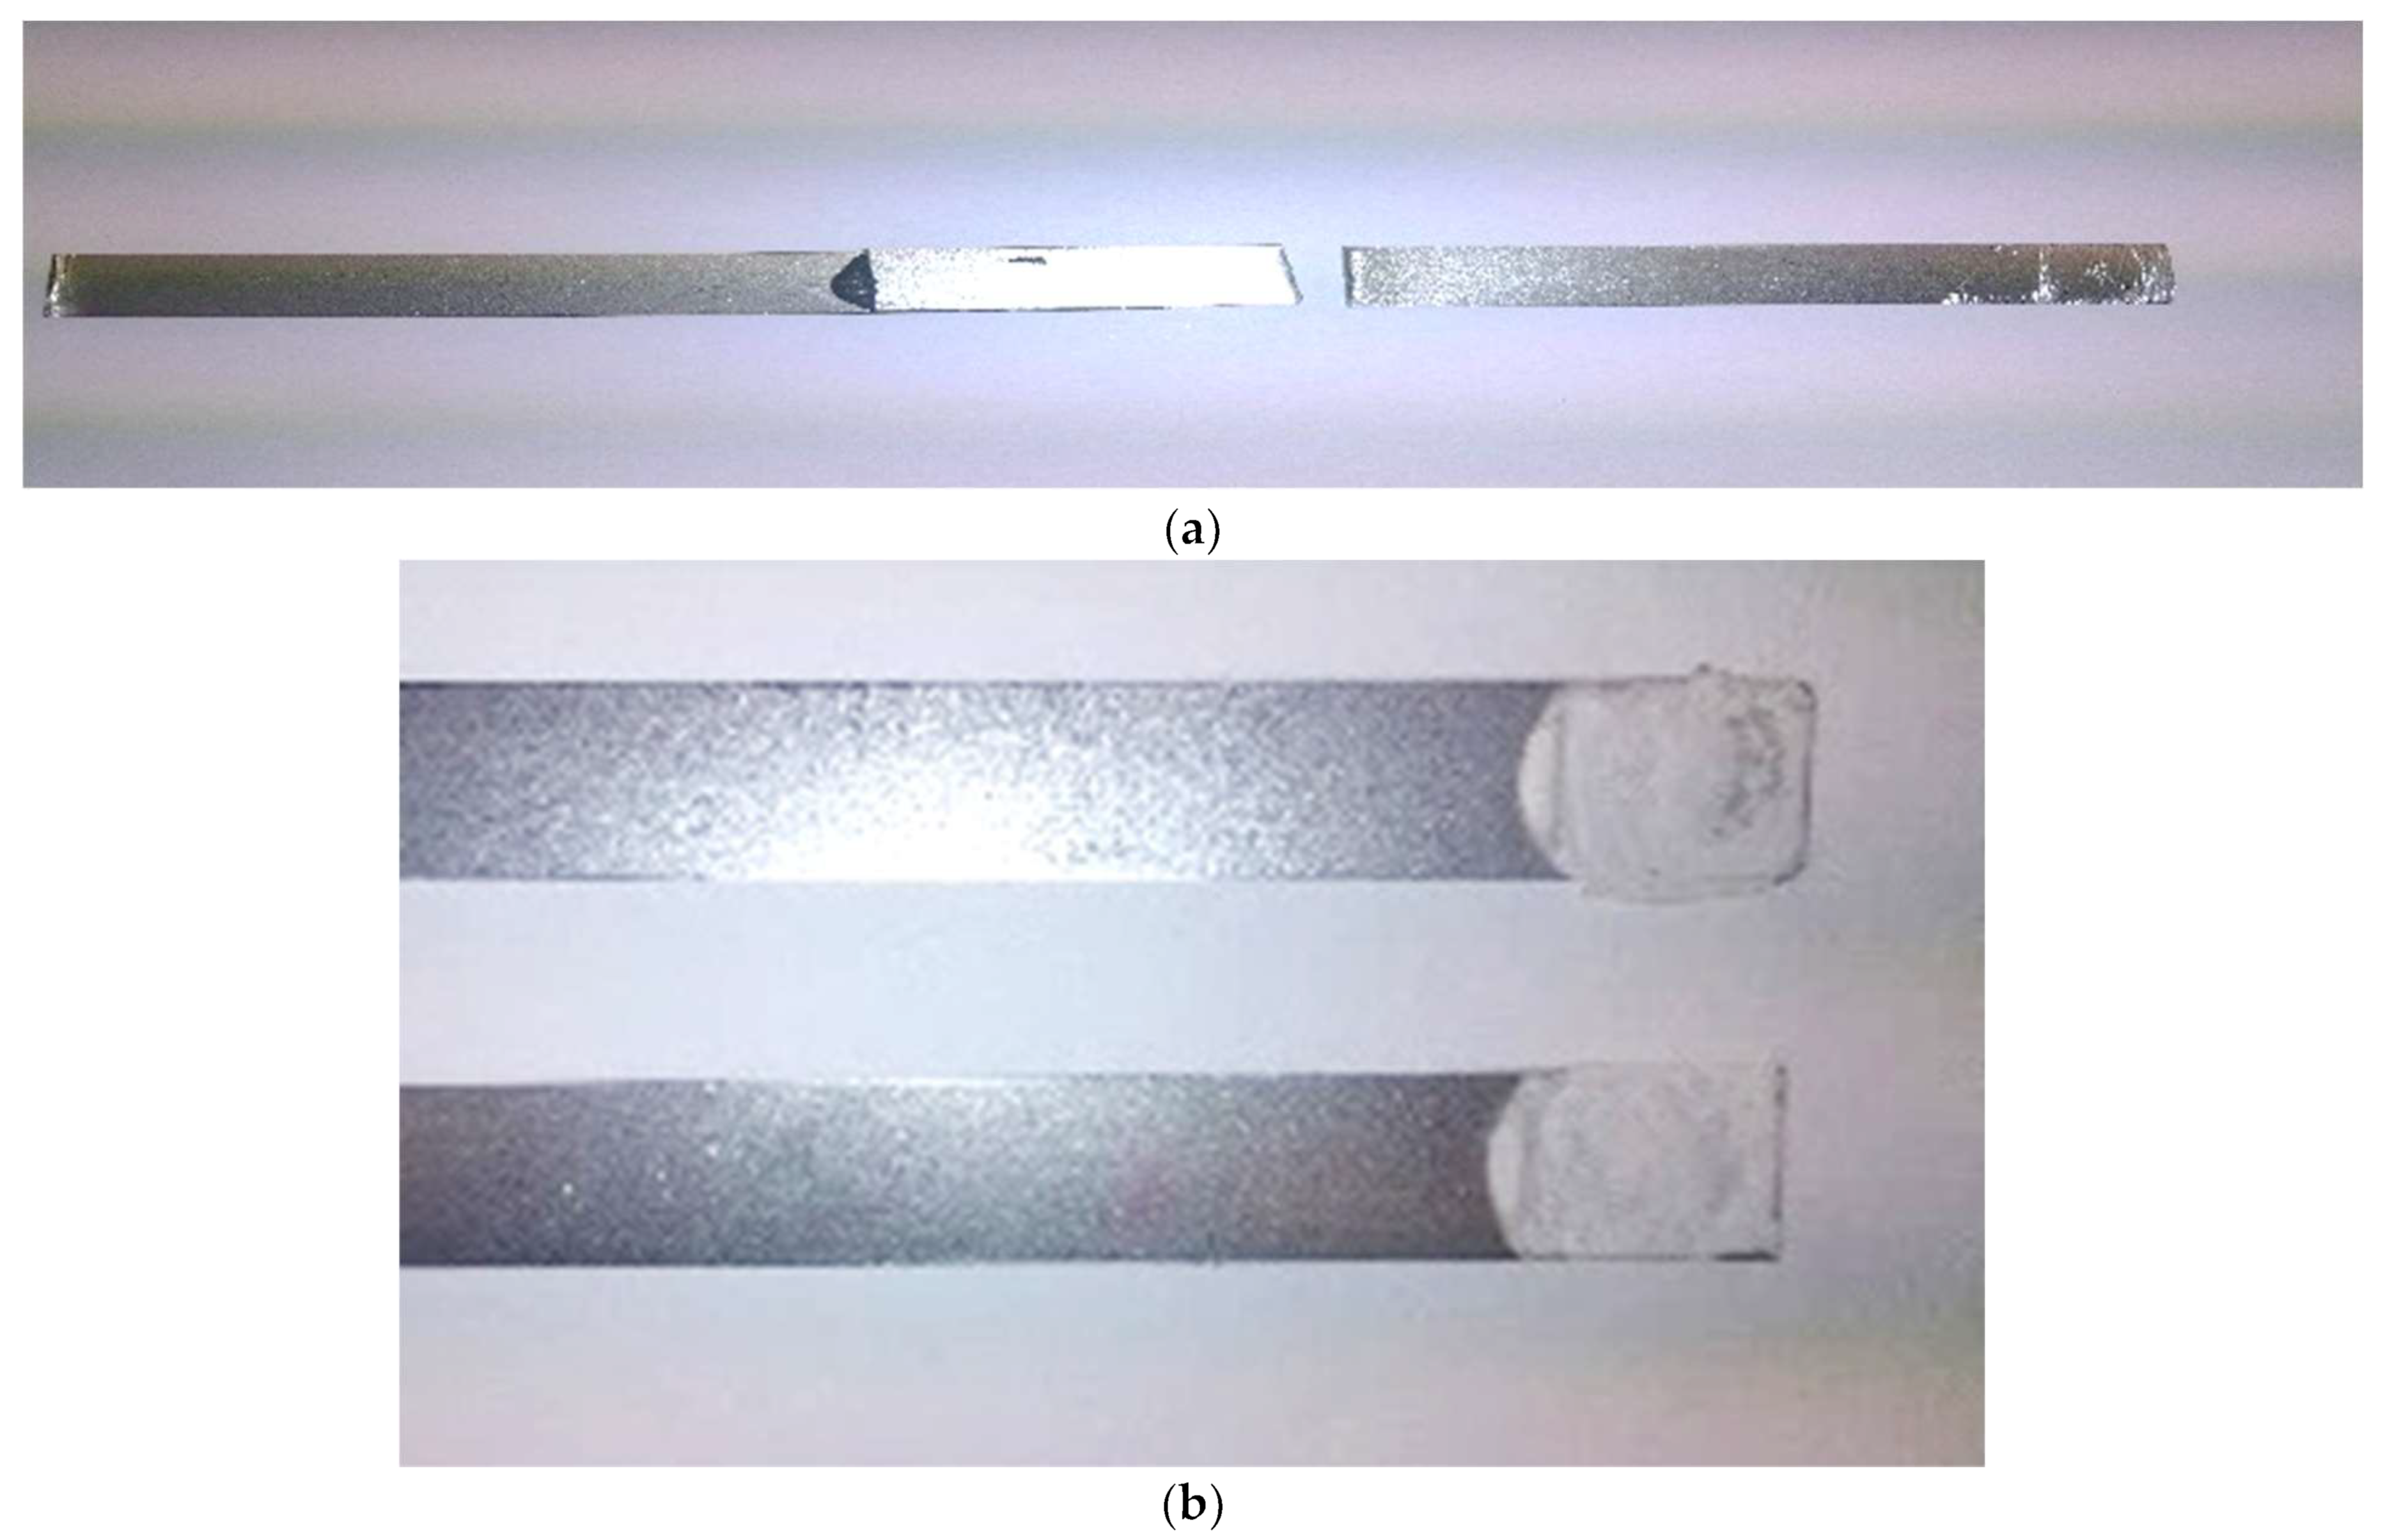
2.1. Samples
2.2. Research Plan
2.3. Sample Preparation
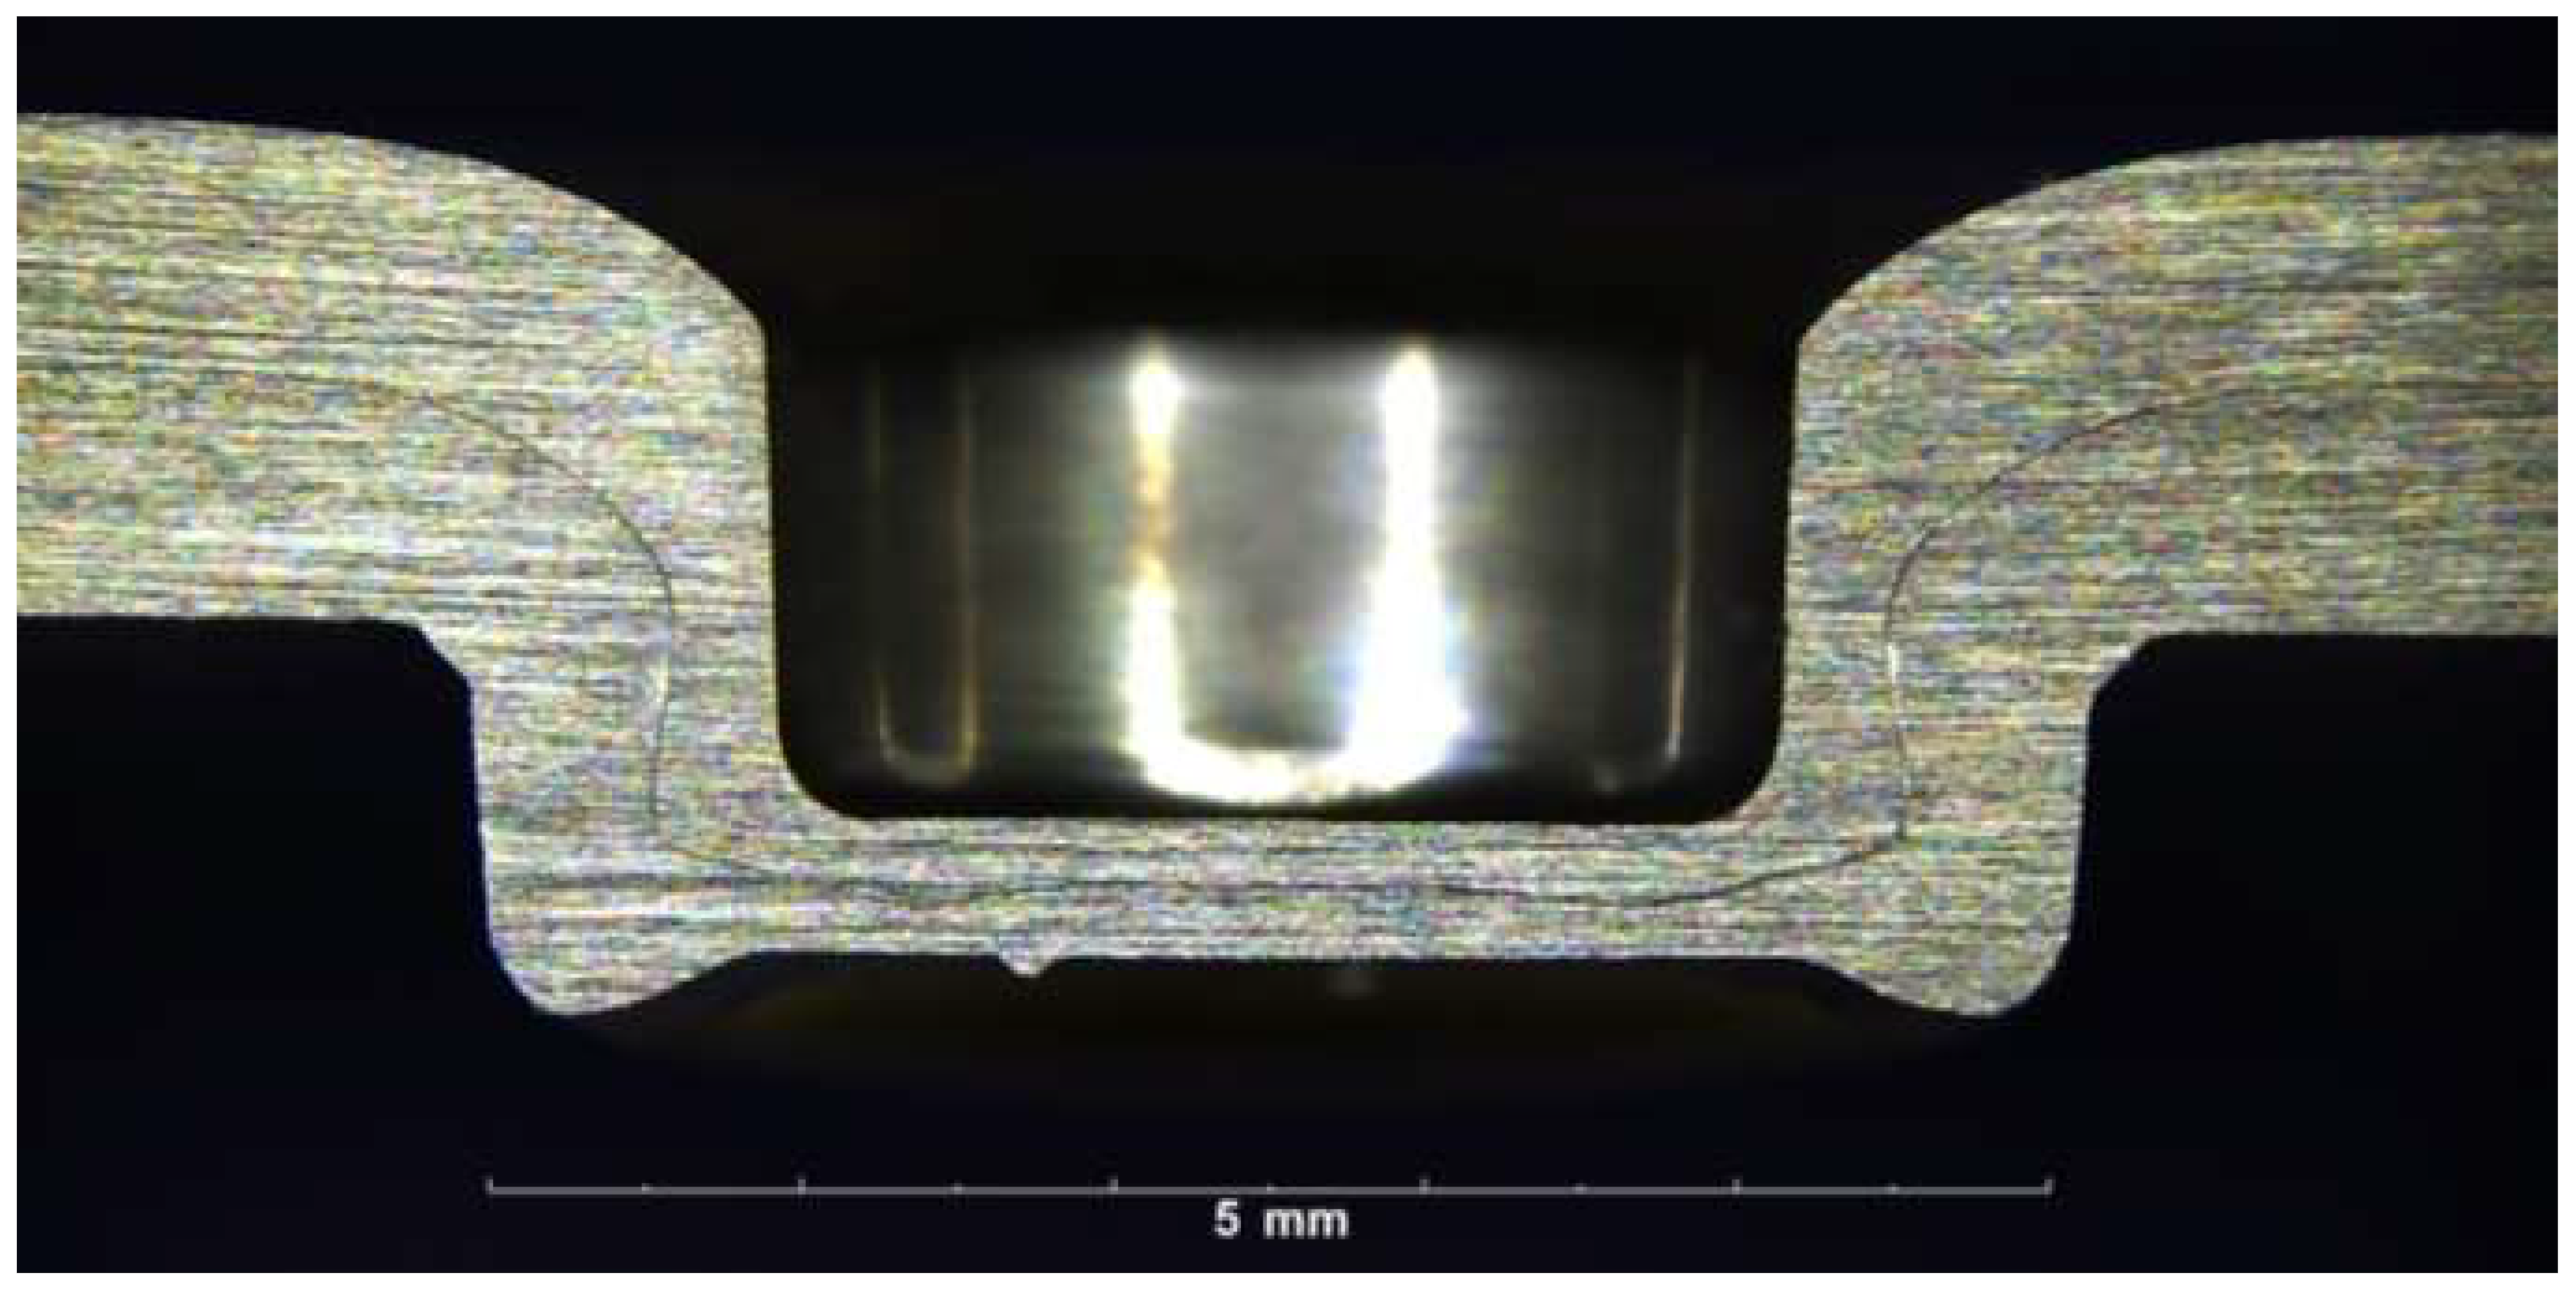
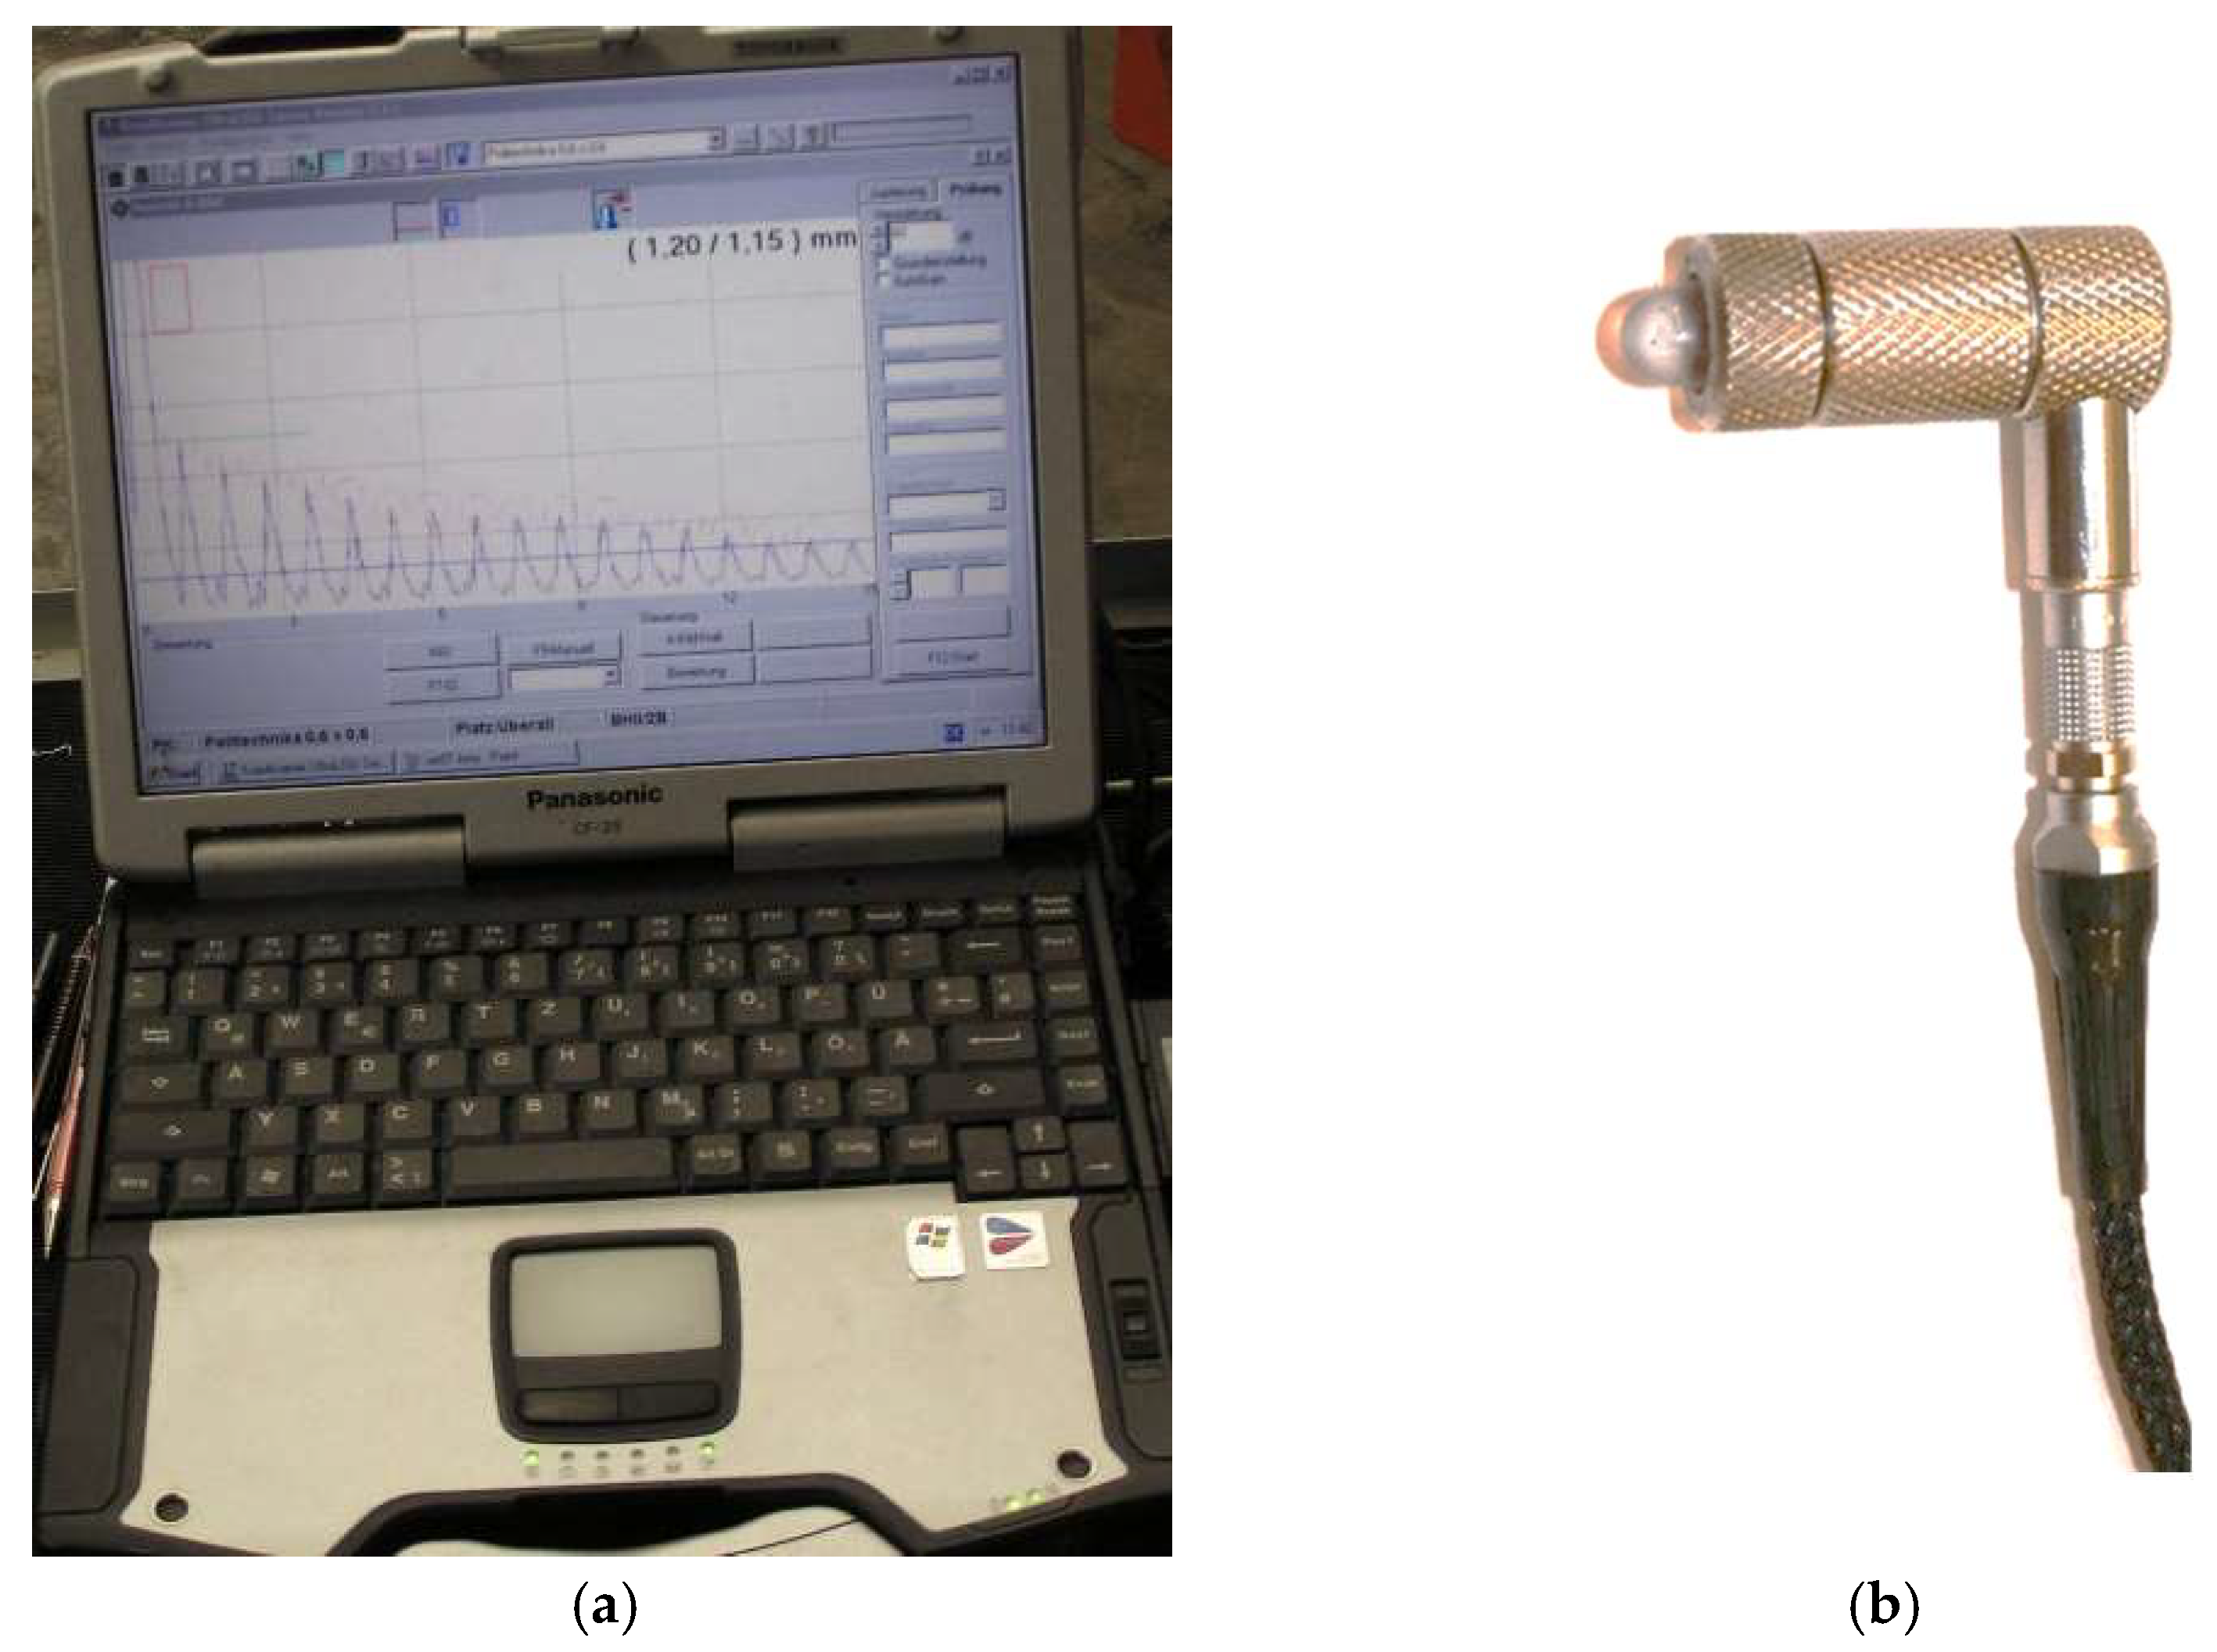
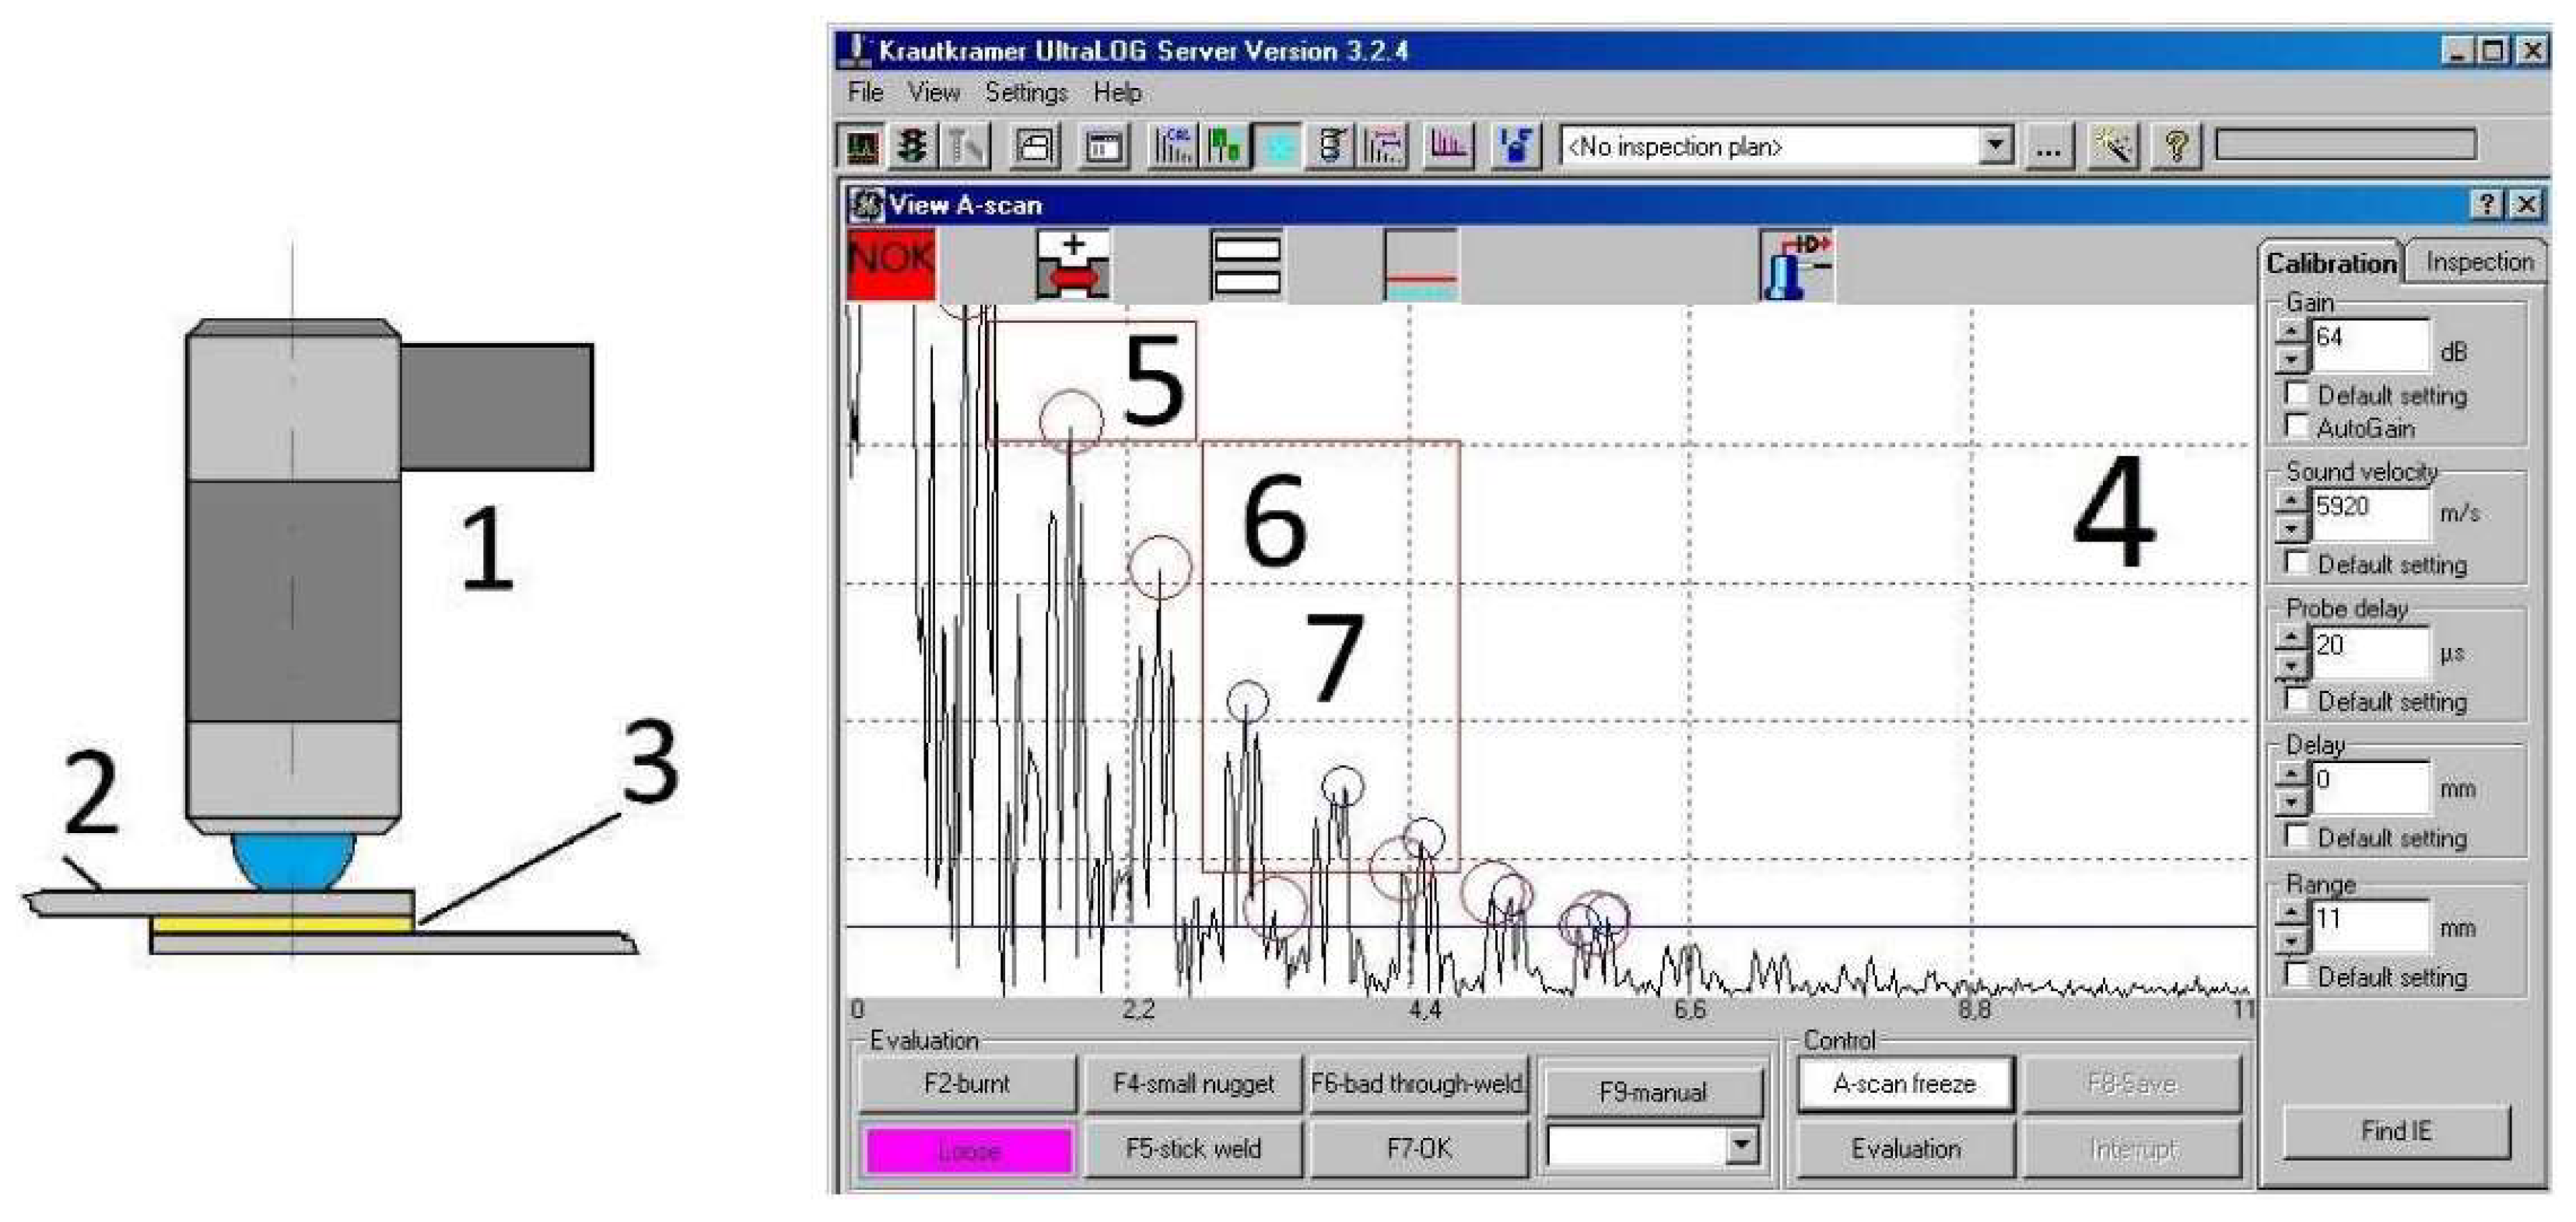
2.4. Ultrasonic Tests
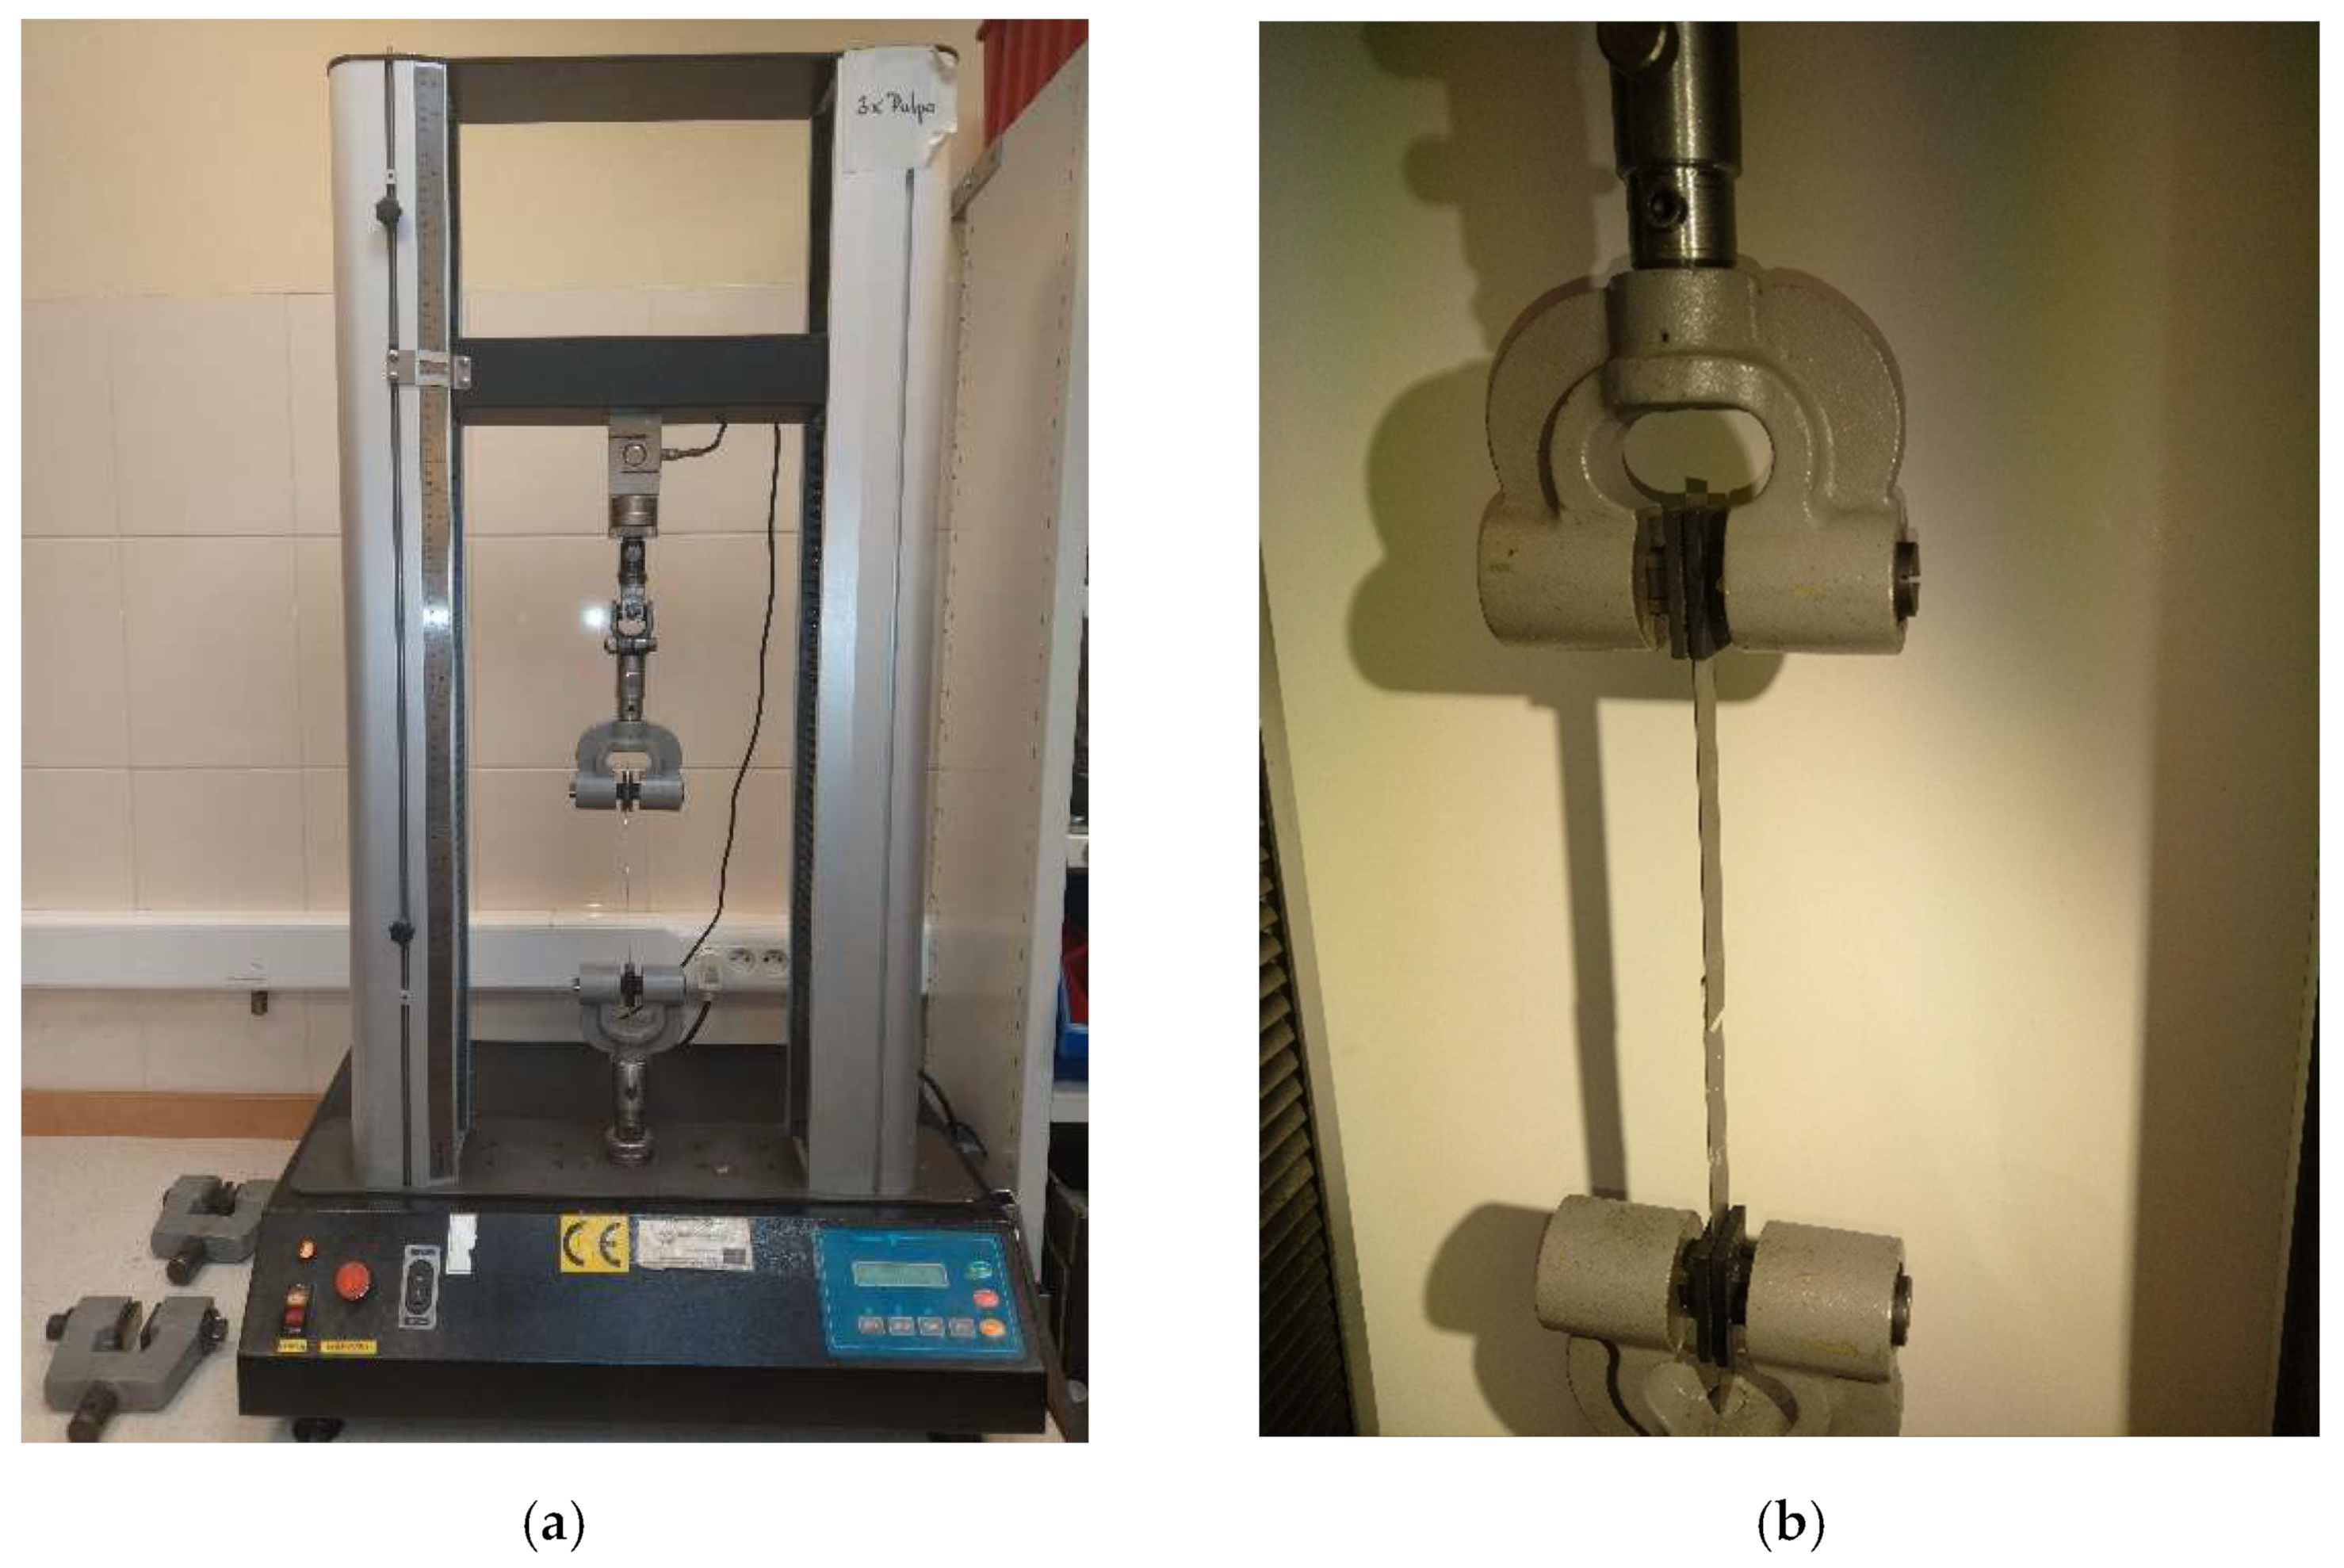
2.5. Strength Tests
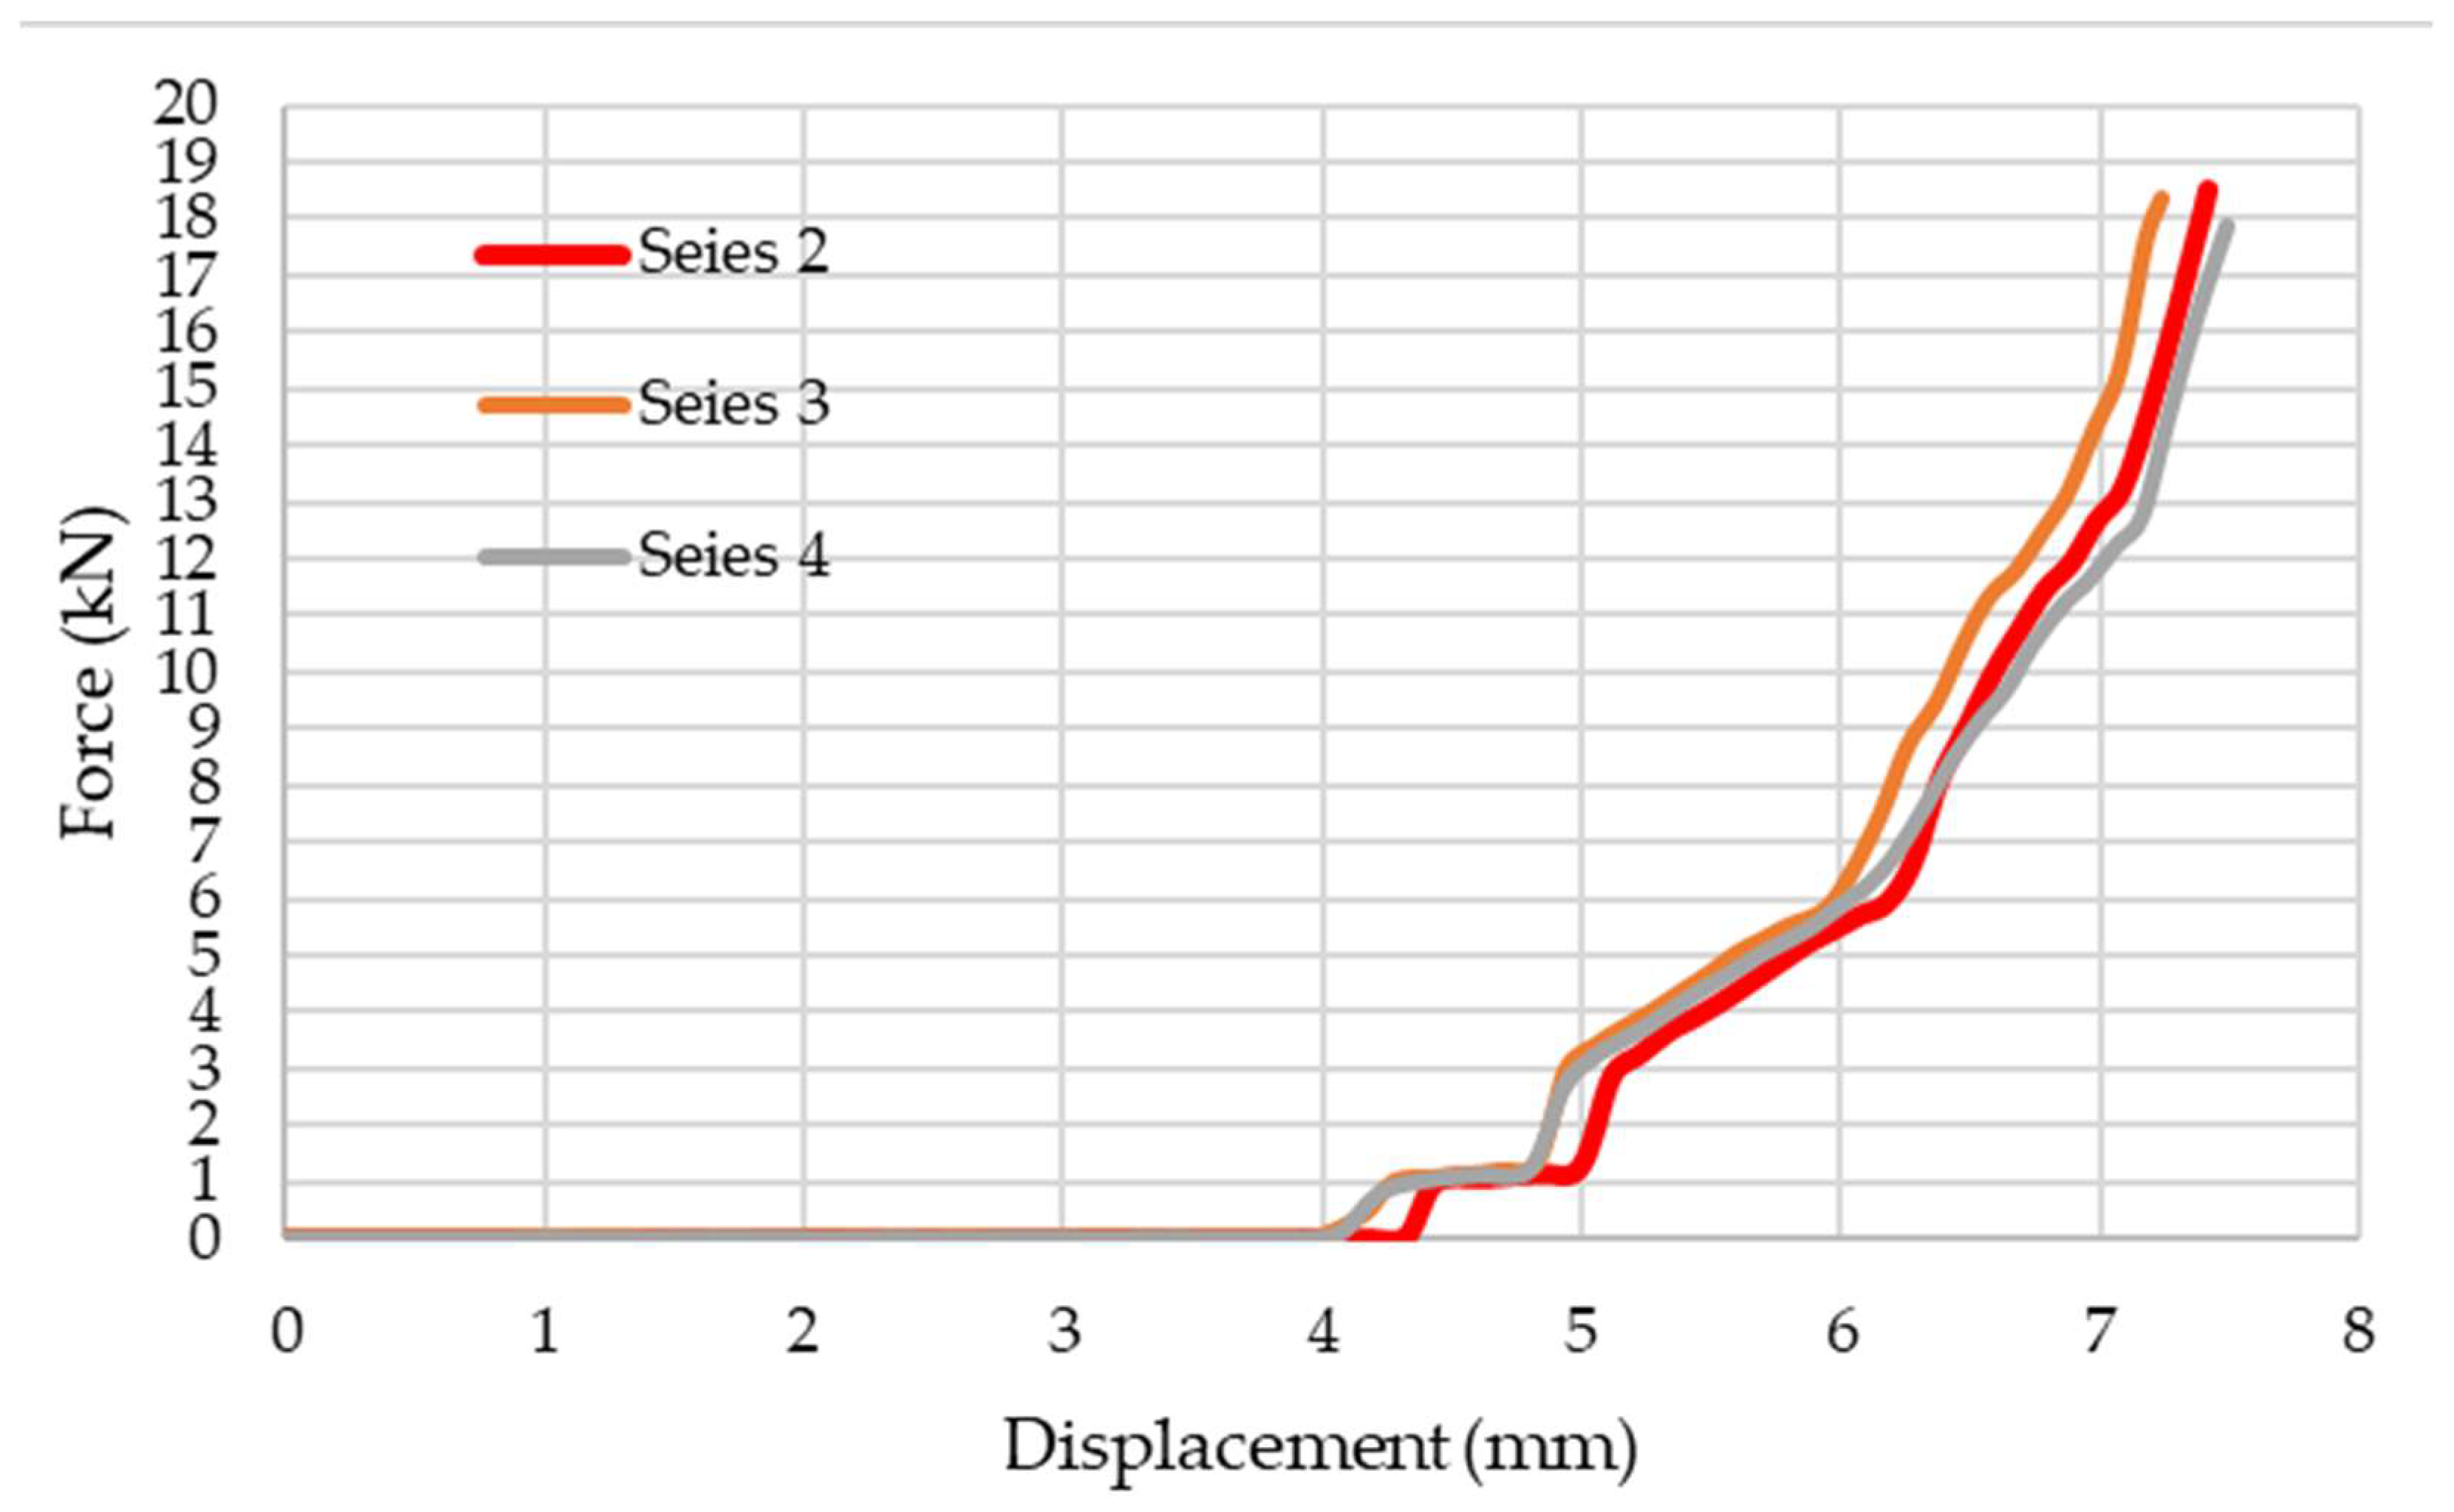
3. Results
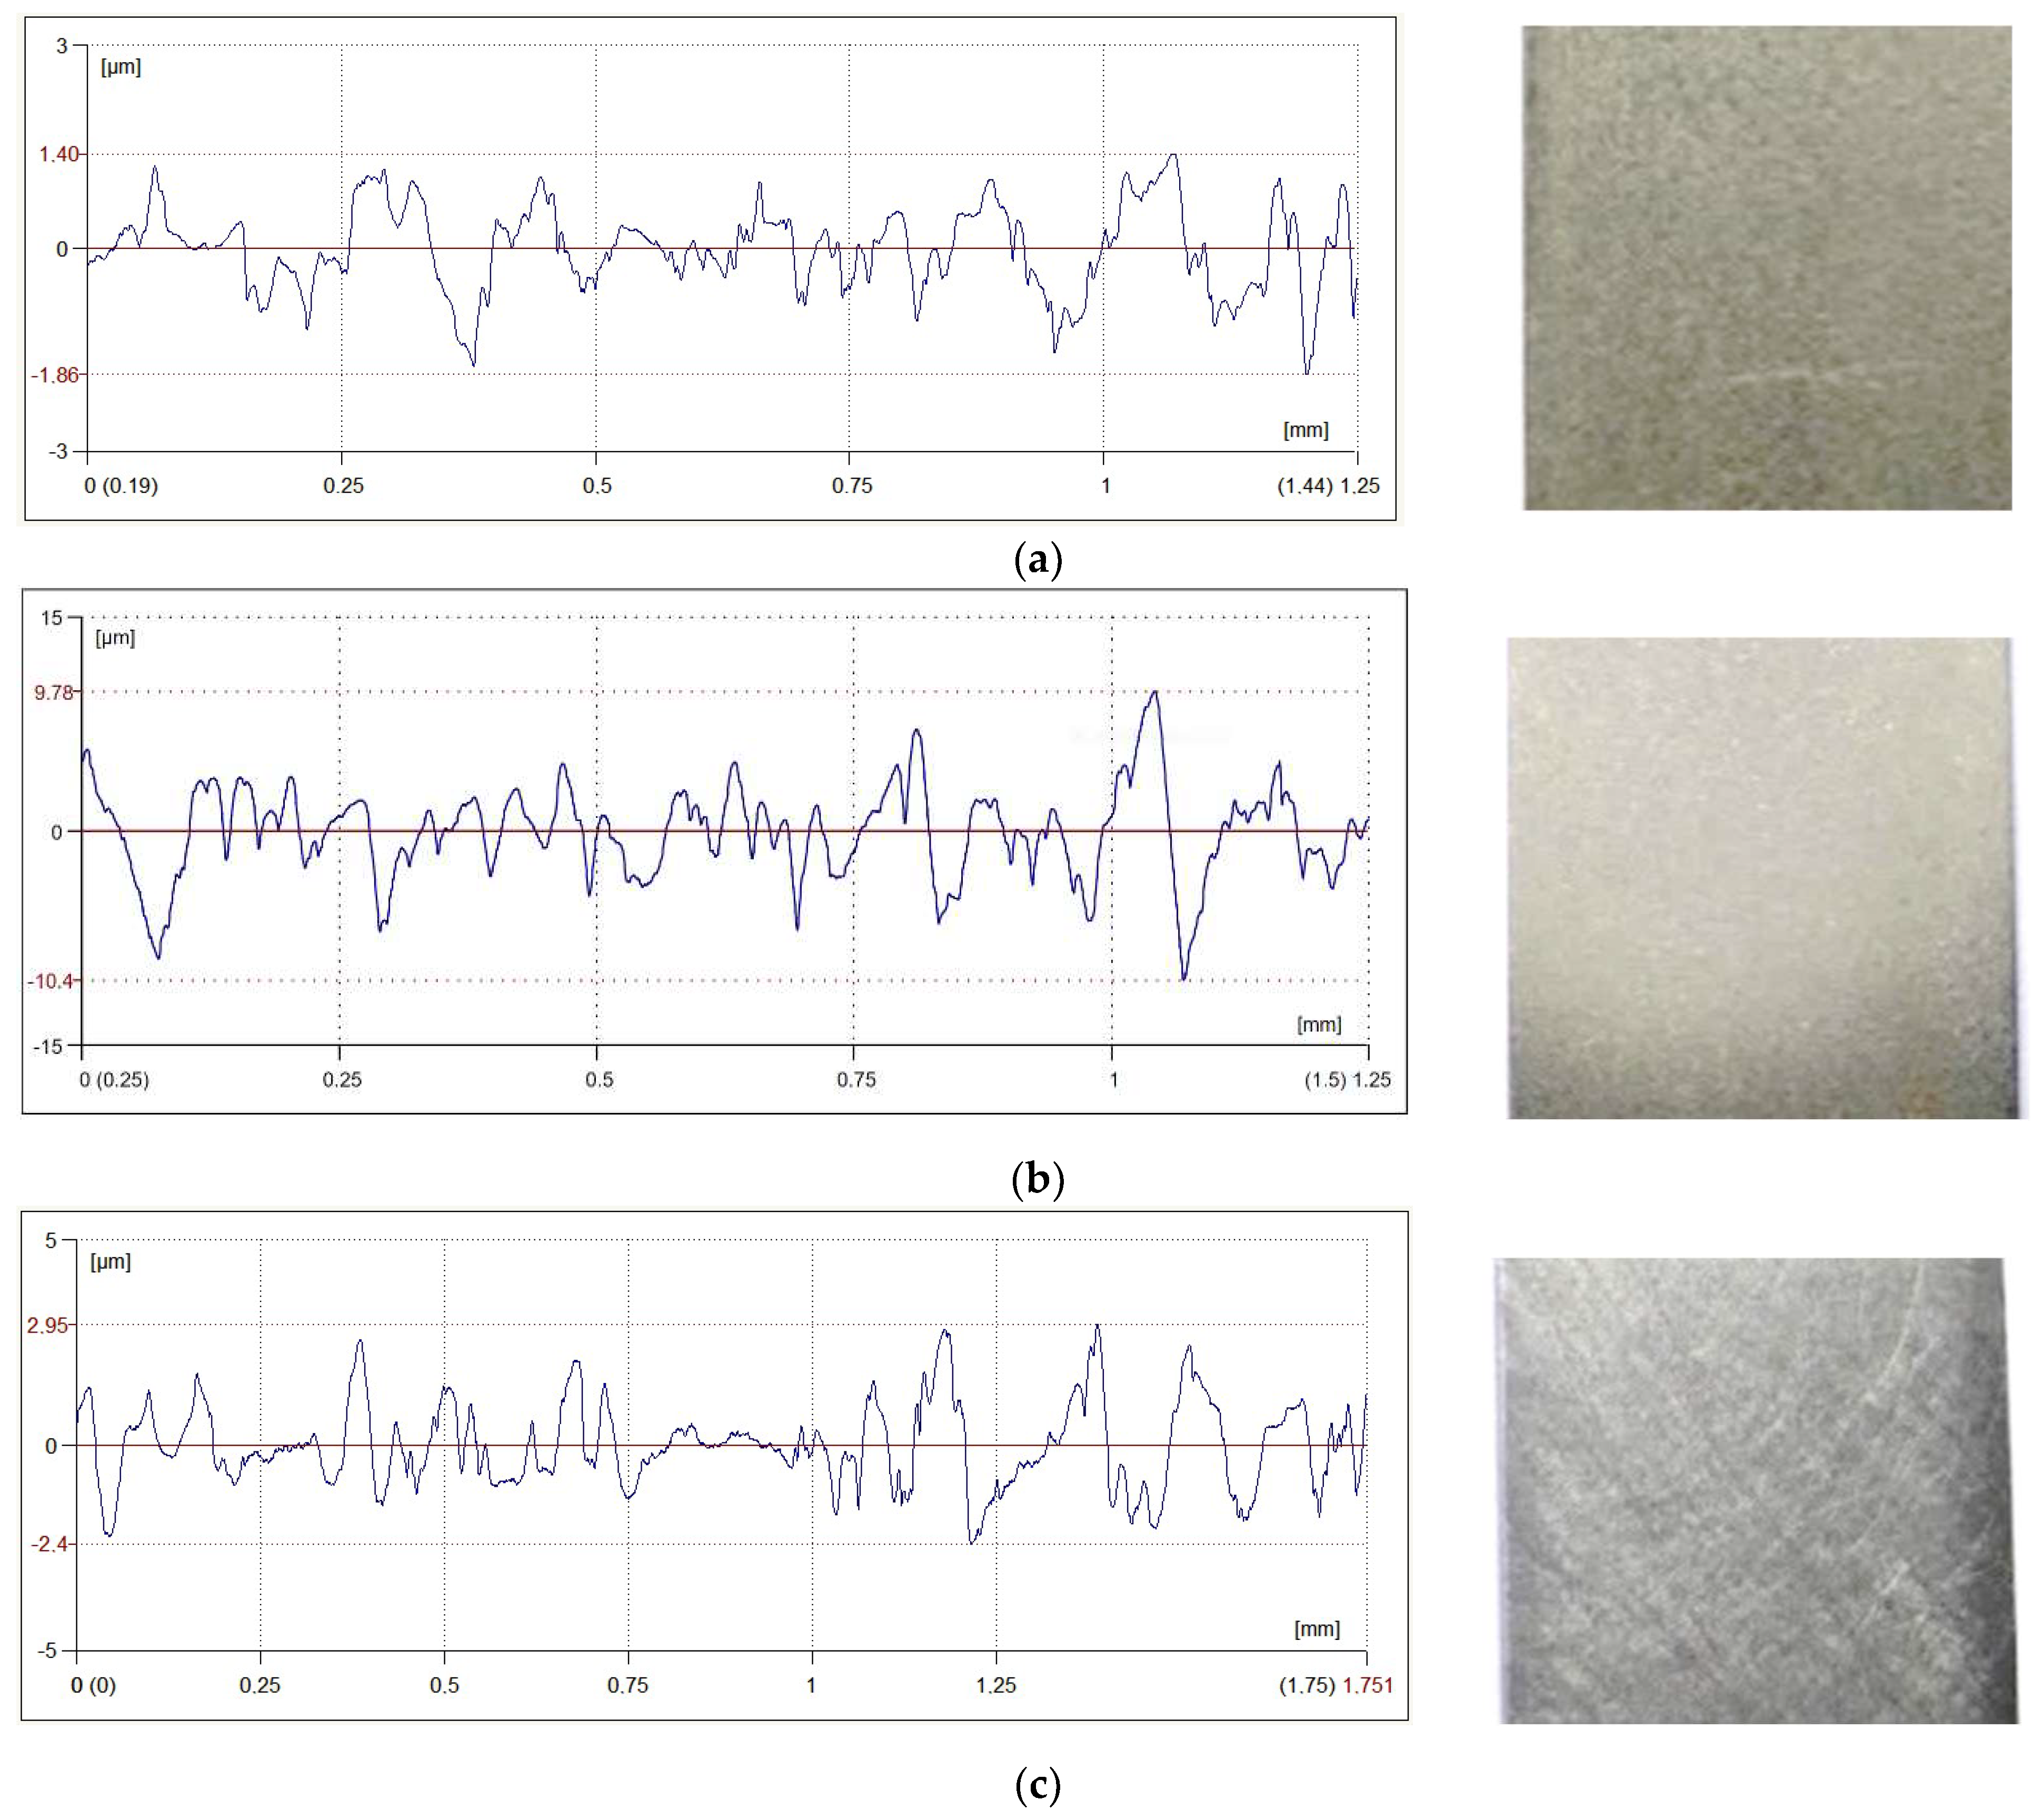
3.1. Selection of Surface Preparation
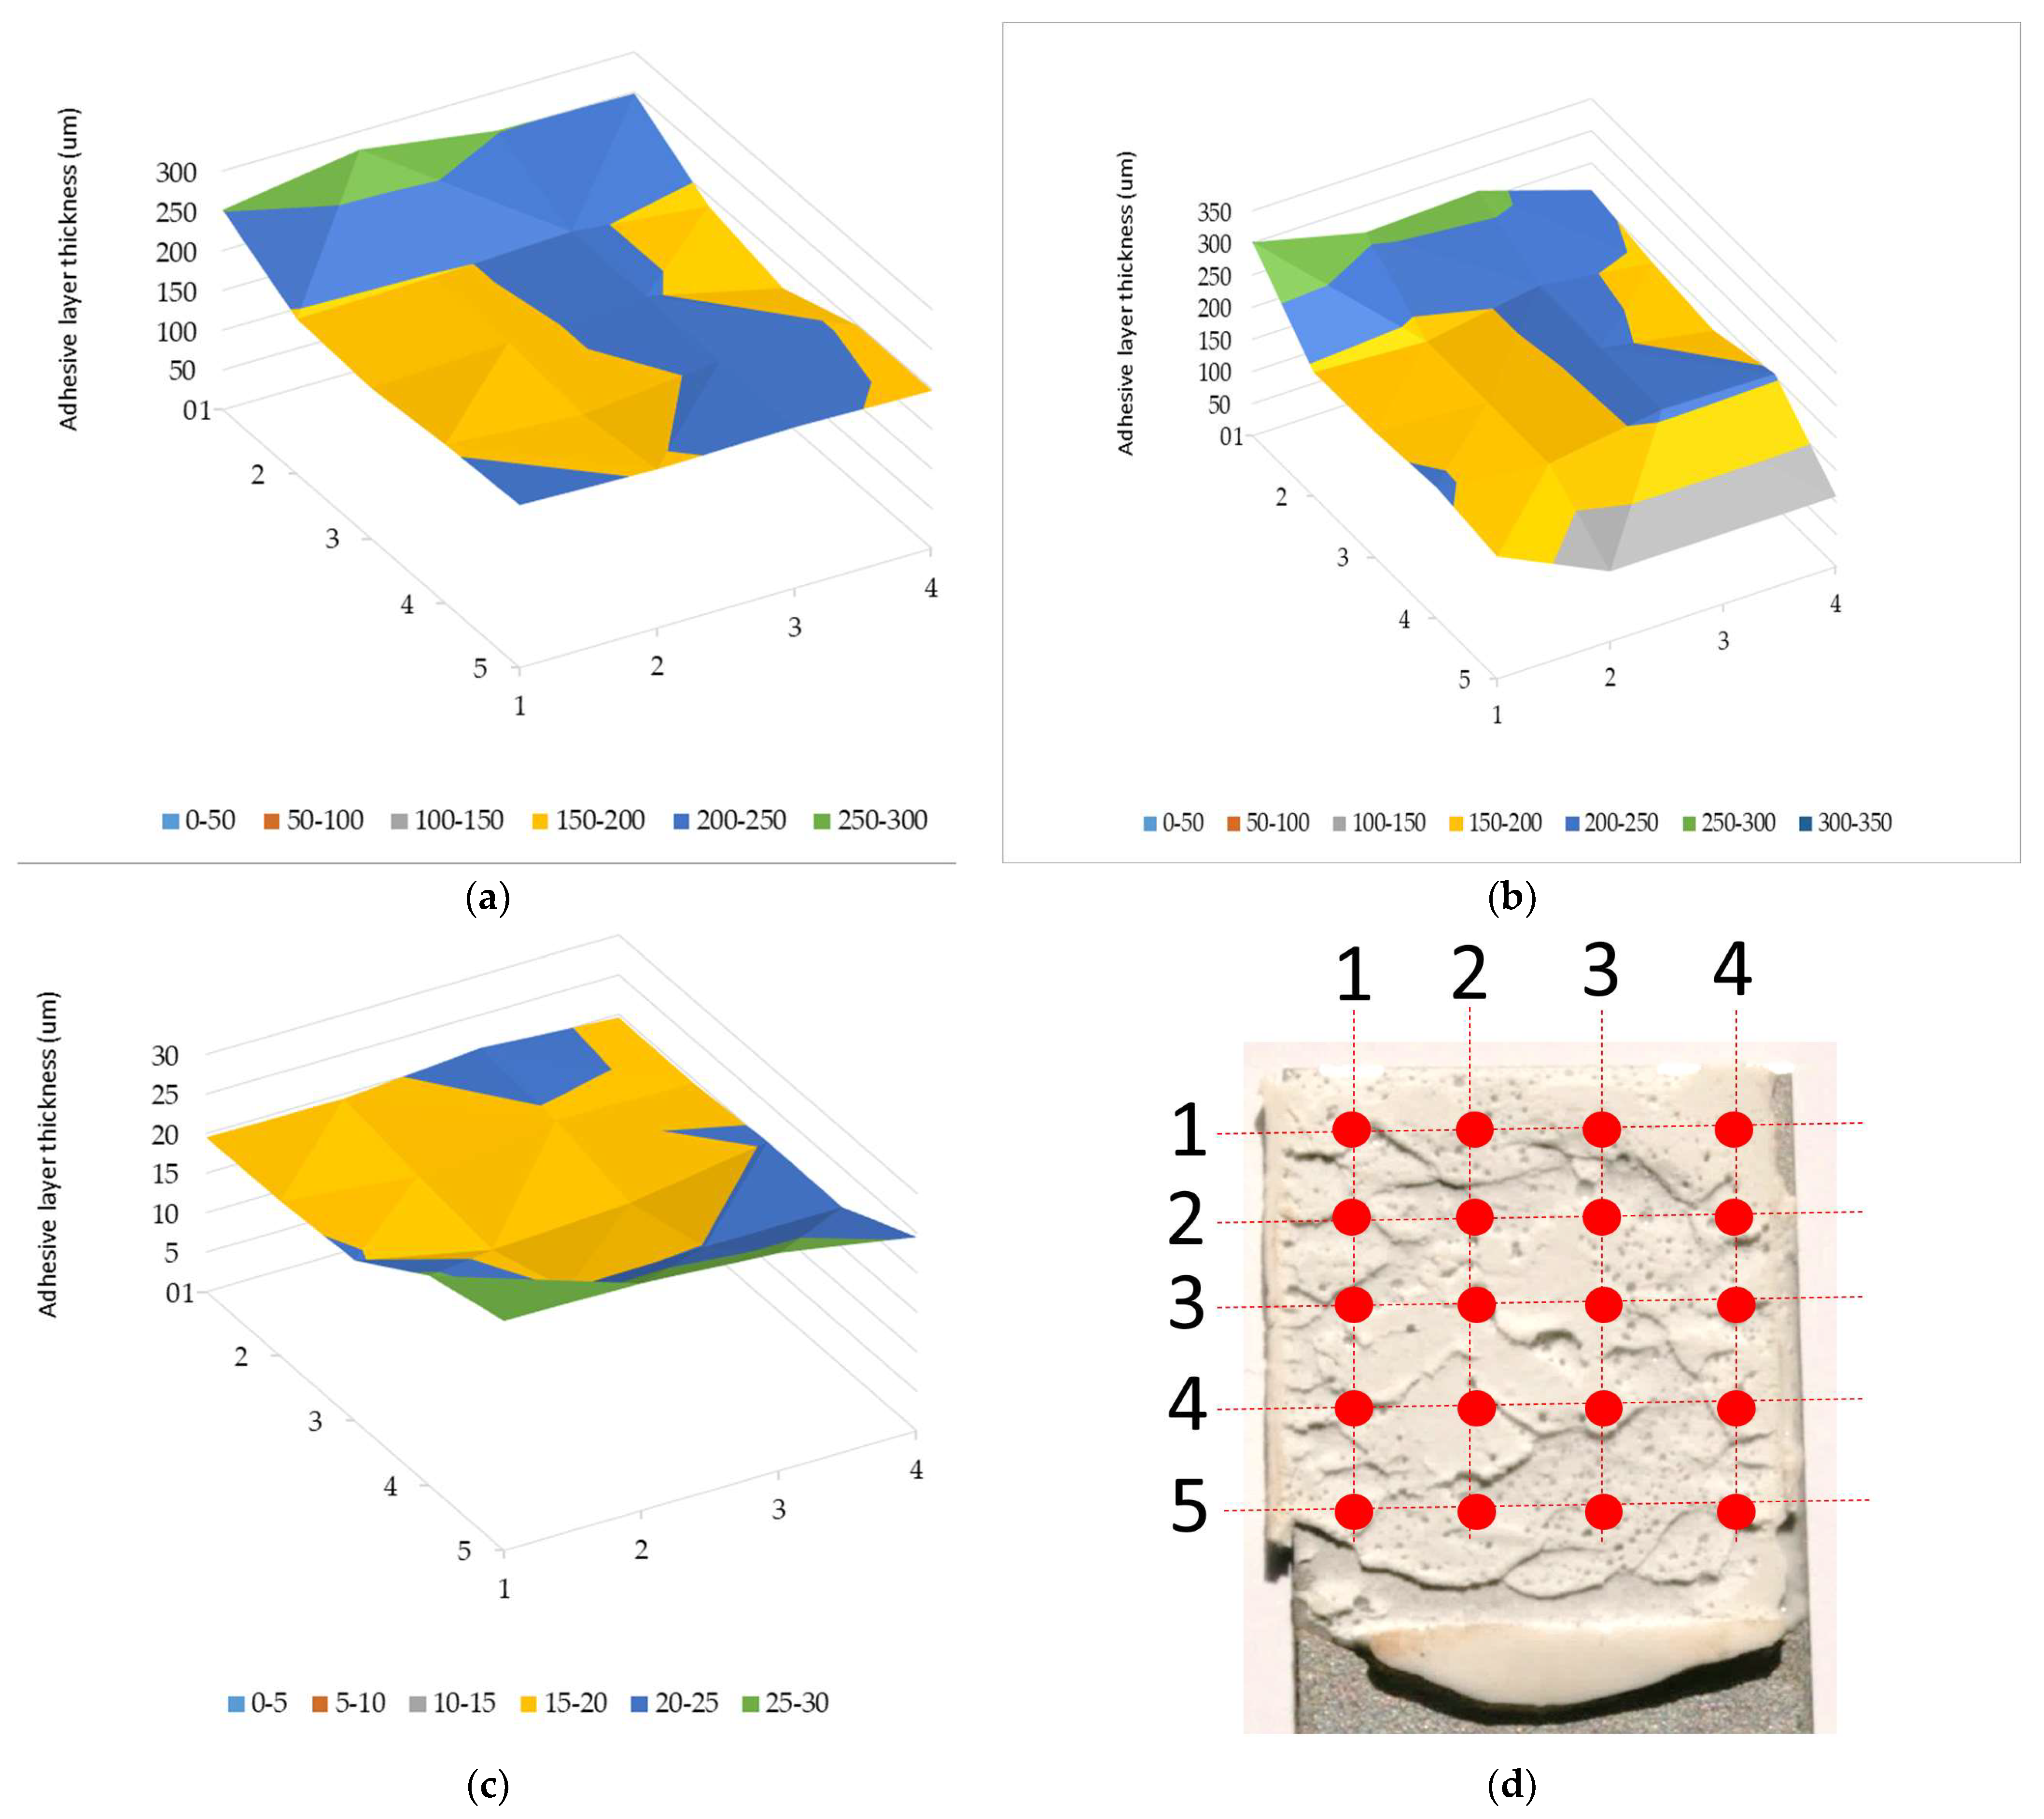
3.2. Results of Ultrasonic Tests
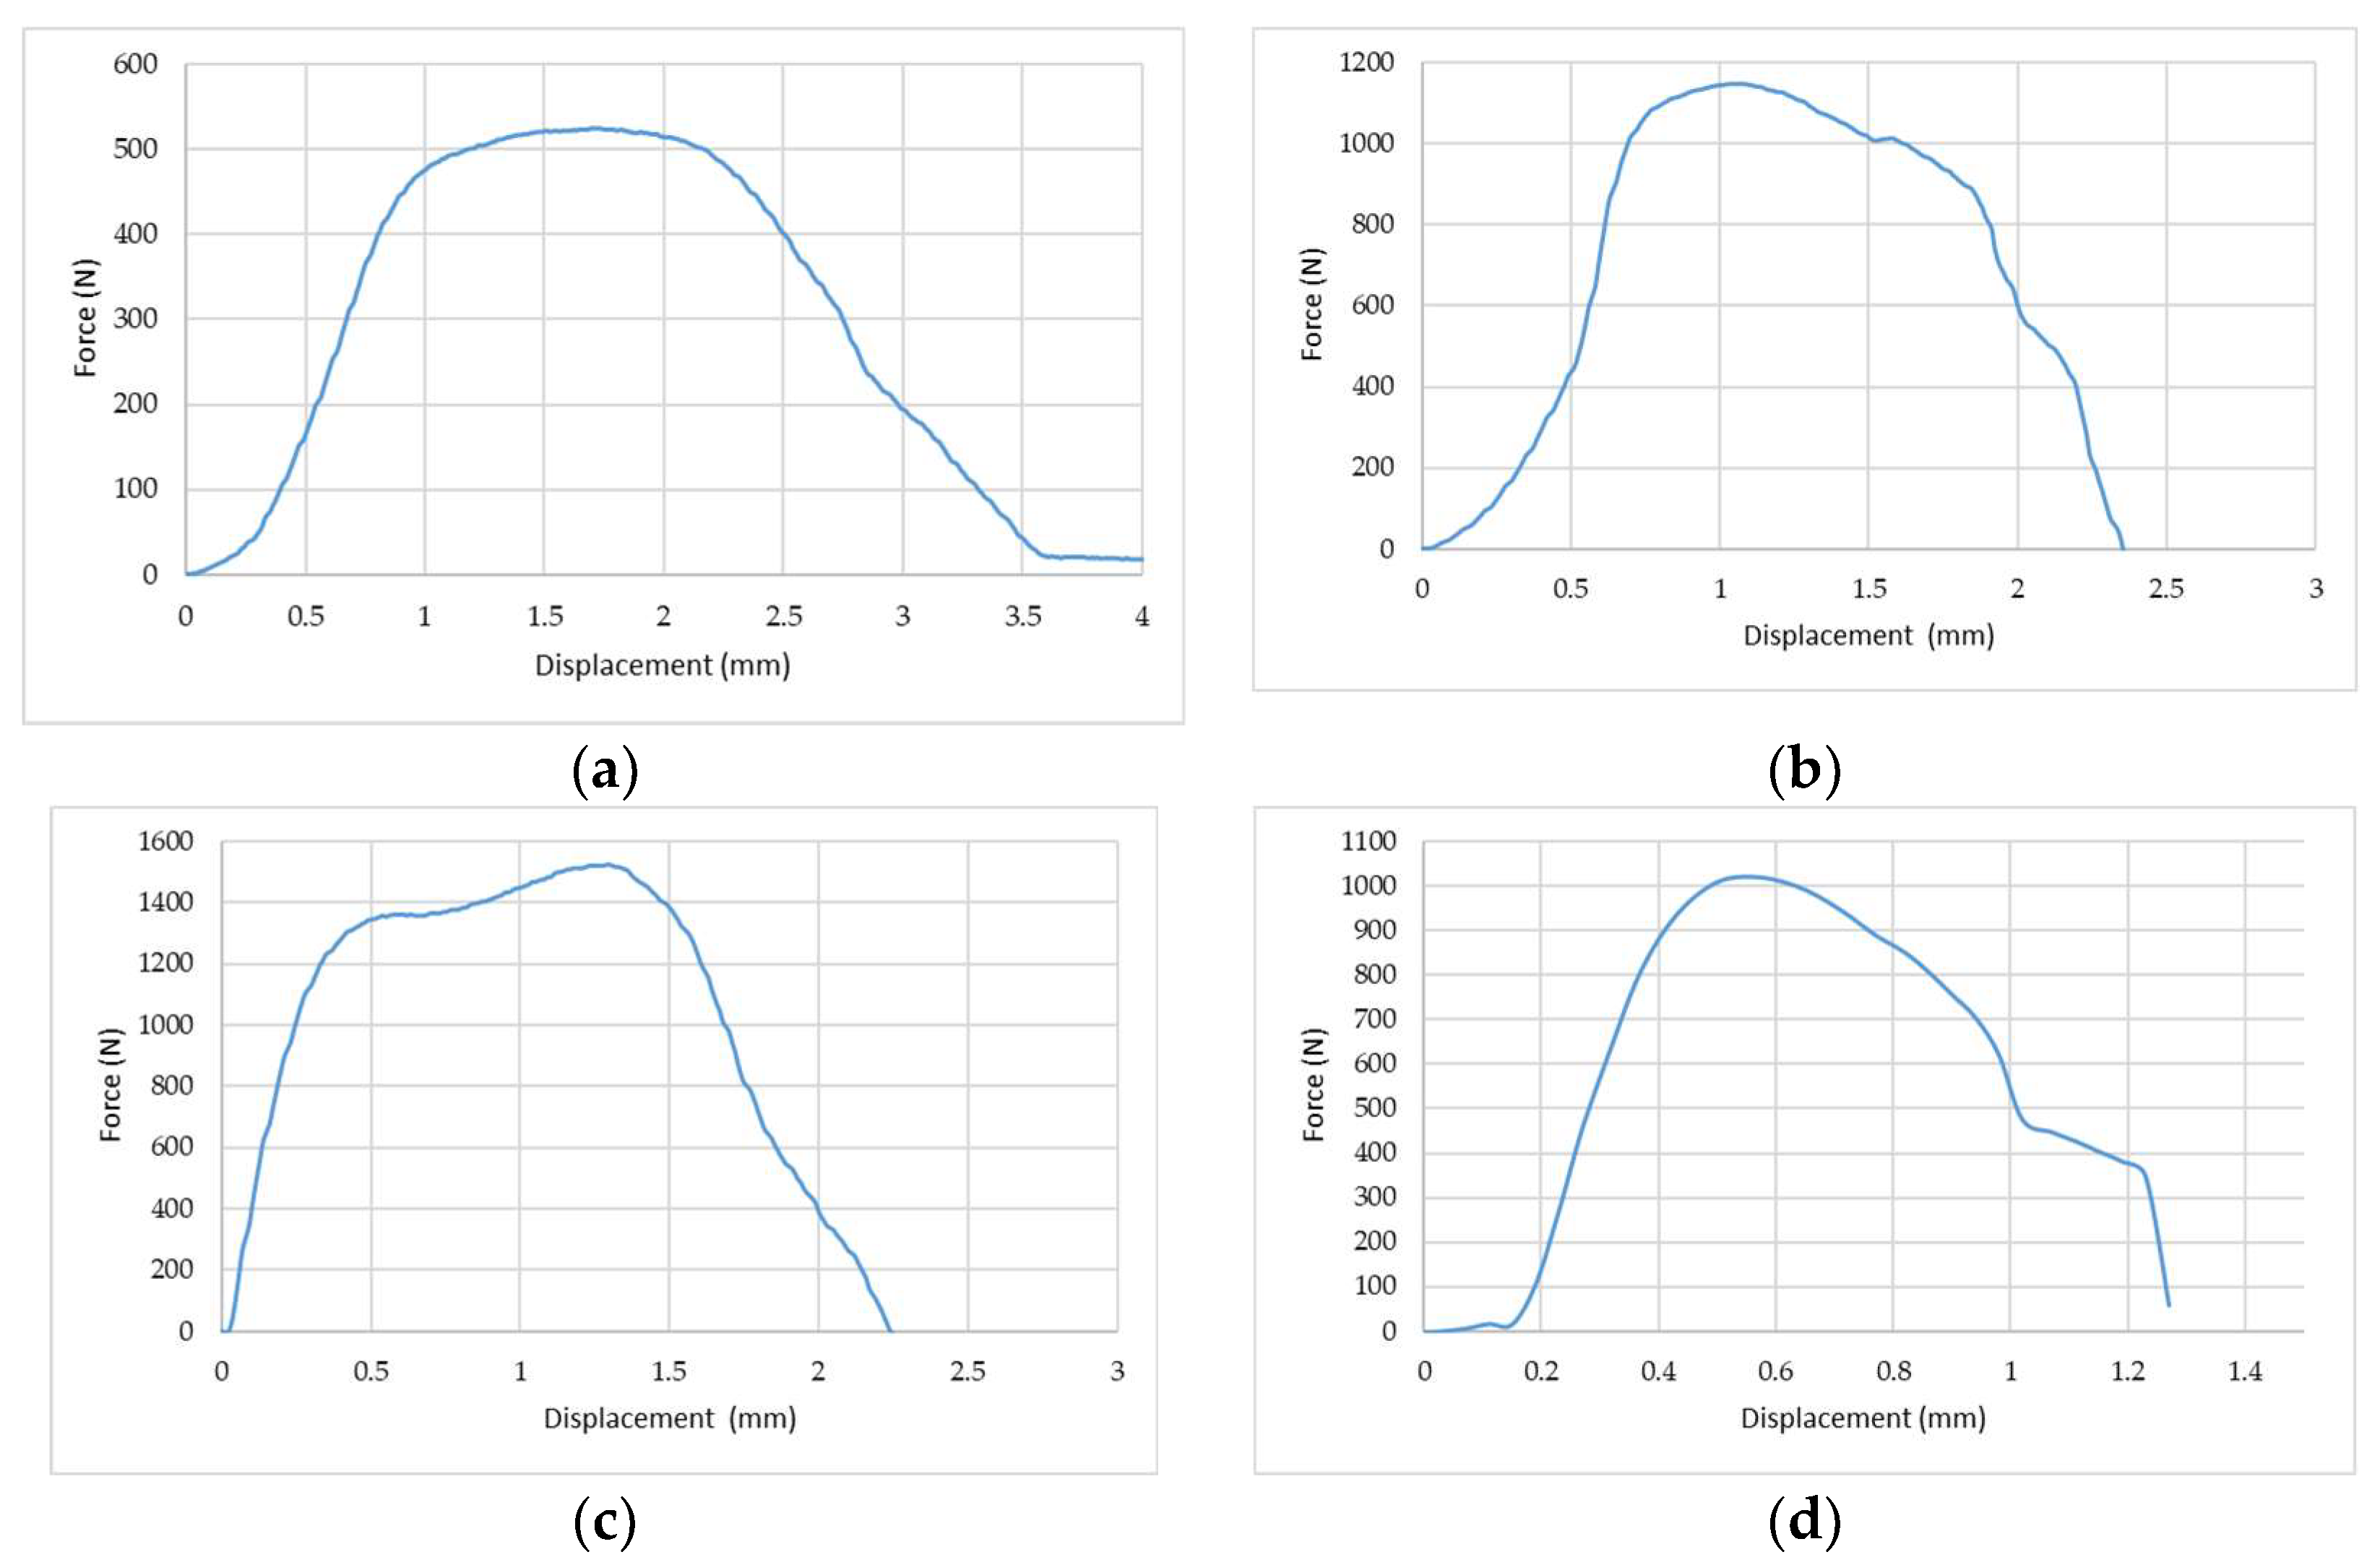
3.3. Results of Bonding Strength
4. Conclusions
Author Contributions
Funding
Institutional Review Board Statement
Informed Consent Statement
Data Availability Statement
Conflicts of Interest
Appendix A

| HI (%) | HII (%) | HIII (%) | HIV (%) | HV (%) |
|---|---|---|---|---|
| 80 | 70 | 62 | 51 | 43 |
| 80 | 71 | 61 | 49 | 39 |
| 80 | 72 | 55 | 51 | 44 |
| 80 | 70 | 57 | 49 | 39 |
| 80 | 72 | 62 | 51 | 44 |
| 80 | 68 | 58 | 50 | 42 |
| 80 | 69 | 61 | 49 | 40 |
| 80 | 69 | 58 | 51 | 39 |
| 80 | 70 | 57 | 50 | 42 |
| 80 | 69 | 60 | 49 | 39 |
| 80 | 71 | 59 | 51 | 40 |
| 80 | 69 | 60 | 50 | 43 |
| 80 | 70 | 60 | 50 | 44 |
| 80 | 70 | 57 | 50 | 40 |
| 80 | 70 | 60 | 49 | 44 |
| 80 | 69 | 60 | 54 | 38 |
| 80 | 68 | 60 | 49 | 40 |
| 80 | 68 | 58 | 49 | 42 |
| 80 | 69 | 60 | 50 | 39 |
| 80 | 70 | 59 | 49 | 42 |
| 80 | 69 | 60 | 51 | 43 |
| 80 | 69 | 55 | 49 | 43 |
| 80 | 71 | 57 | 50 | 43 |
| 80 | 69 | 55 | 50 | 44 |
| 80 | 68 | 56 | 50 | 43 |
| 80 | 70 | 60 | 49 | 43 |
| 80 | 70 | 60 | 50 | 44 |
| 80 | 71 | 60 | 50 | 43 |
| 80 | 70 | 62 | 50 | 43 |
| 80 | 69 | 57 | 50 | 40 |
| HI (%) | HII (%) | HIII (%) | HIV (%) | HV (%) |
|---|---|---|---|---|
| 80 | 64 | 50 | 39 | 30 |
| 80 | 70 | 54 | 42 | 33 |
| 80 | 63 | 47 | 37 | 20 |
| 80 | 58 | 46 | 34 | 27 |
| 80 | 65 | 55 | 43 | 31 |
| 80 | 59 | 49 | 39 | 28 |
| 80 | 65 | 54 | 43 | 31 |
| 80 | 65 | 54 | 43 | 31 |
| 80 | 70 | 56 | 42 | 33 |
| 80 | 59 | 49 | 39 | 28 |
| 80 | 69 | 54 | 41 | 31 |
| 80 | 70 | 54 | 41 | 33 |
| 80 | 63 | 48 | 37 | 28 |
| 80 | 65 | 54 | 43 | 31 |
| 80 | 69 | 54 | 41 | 31 |
| 80 | 63 | 49 | 37 | 28 |
| 80 | 57 | 43 | 33 | 25 |
| 80 | 71 | 56 | 43 | 33 |
| 80 | 58 | 45 | 35 | 27 |
| 80 | 57 | 42 | 33 | 18 |
| 80 | 57 | 43 | 33 | 25 |
| 80 | 58 | 45 | 34 | 26 |
| 80 | 64 | 49 | 38 | 30 |
| 80 | 70 | 53 | 40 | 31 |
| 80 | 70 | 52 | 41 | 23 |
| 80 | 64 | 51 | 38 | 30 |
| 80 | 56 | 47 | 37 | 30 |
| 80 | 55 | 46 | 36 | 25 |
| 80 | 70 | 55 | 43 | 33 |
| 80 | 56 | 43 | 34 | 25 |
| Series 1 | Series 2 | Series 3 | |
|---|---|---|---|
| 1 | 1.788 | 2.095 | 2.300 |
| 2 | 2.440 | 1.882 | 2.471 |
| 3 | 3.098 | 2.708 | 2.408 |
| 4 | 2.552 | 3.362 | 2.534 |
| 5 | 2.642 | 2.923 | 2.368 |
| 6 | 2.499 | 3.206 | 2.636 |
| 7 | 3.161 | 2.781 | 2.796 |
| 8 | 3.121 | 3.152 | 2.432 |
| 9 | 1.784 | 3.284 | 2.532 |
| 10 | 2.741 | 2.392 | 2.810 |
| 11 | 1.938 | 2.448 | 2.667 |
| 12 | 2.607 | 2.890 | 2.876 |
| 13 | 2.167 | 2.923 | 3.198 |
| 14 | 3.178 | 1.998 | 2.588 |
| 15 | 2.392 | 1.843 | 2.525 |
| 16 | 2.602 | 2.144 | 2.255 |
| 17 | 2.956 | 3.335 | 2.792 |
| 18 | 3.171 | 3.368 | 2.172 |
| 19 | 2.732 | 3.383 | 2.283 |
| 20 | 2.246 | 3.152 | 1.872 |
| 21 | 2.952 | 2.653 | 2.486 |
| 22 | 2.899 | 2.330 | 1.950 |
| 23 | 2.499 | 2.201 | 3.070 |
| 24 | 3.152 | 2.868 | 2.032 |
| 25 | 2.362 | 2.199 | 2.201 |
| 26 | 3.307 | 2.095 | 3.207 |
| 27 | 1.938 | 3.118 | 2.010 |
| 28 | 2.612 | 2.322 | 2.969 |
| 29 | 2.694 | 2.289 | 1.994 |
| 30 | 3.013 | 2.671 | 1.802 |
| 31 | 3.098 | 2.082 | 3.016 |
| 32 | 2.036 | 3.115 | 2.523 |
| 33 | 1.994 | 2.384 | 1.955 |
| 34 | 3.208 | 2.197 | 2.468 |
| 35 | 2.724 | 2.138 | 2.242 |
| 36 | 2.416 | 3.313 | 3.212 |
| 37 | 2.713 | 3.098 | 2.274 |
| 38 | 1.911 | 3.167 | 2.193 |
| 39 | 2.838 | 3.343 | 2.960 |
| 40 | 2.138 | 2.499 | 3.015 |
| 41 | 2.753 | 2.392 | 2.792 |
| 42 | 2.751 | 2.901 | 1.948 |
| 43 | 1.855 | 2.308 | 2.414 |
| 44 | 3.174 | 2.267 | 1.899 |
| 45 | 2.167 | 3.121 | 2.249 |
| 46 | 2.267 | 2.342 | 2.975 |
| 47 | 2.684 | 3.076 | 2.742 |
| 48 | 2.107 | 2.227 | 3.032 |
| 49 | 2.121 | 2.265 | 2.885 |
| 50 | 2.425 | 2.461 | 2.599 |
| Series 1 | Series 2 | Series 3 | Series 4 | |
|---|---|---|---|---|
| 1 | 514 | 1238 | 1624 | 1018 |
| 2 | 564 | 1161 | 1551 | 1032 |
| 3 | 622 | 1231 | 1486 | 974 |
| 4 | 560 | 1110 | 1652 | 1042 |
| 5 | 621 | 1160 | 1529 | 987 |
| 6 | 486 | 1123 | 1544 | 1063 |
| 7 | 500 | 1189 | 1528 | 1027 |
| 8 | 476 | 1094 | 1678 | 984 |
| 9 | 516 | 1100 | 1638 | 1008 |
| 10 | 600 | 1174 | 1706 | 1058 |
| 11 | 494 | 1145 | 1488 | 1082 |
| 12 | 596 | 1243 | 1629 | 969 |
| 13 | 554 | 1198 | 1562 | 1044 |
| 14 | 595 | 1215 | 1574 | 1037 |
| 15 | 478 | 1160 | 1545 | 1062 |
| 16 | 553 | 1154 | 1707 | 1005 |
| 17 | 586 | 1099 | 1707 | 985 |
| 18 | 585 | 1176 | 1673 | 1018 |
| 19 | 547 | 1202 | 1713 | 973 |
| 20 | 517 | 1195 | 1695 | 993 |
| 21 | 583 | 1152 | 1564 | 1028 |
| 22 | 568 | 1146 | 1720 | 1002 |
| 23 | 585 | 1097 | 1487 | 1024 |
| 24 | 523 | 1134 | 1652 | 1062 |
| 25 | 488 | 1127 | 1536 | 965 |
| 26 | 495 | 1233 | 1572 | 979 |
| 27 | 566 | 1236 | 1558 | 987 |
| 28 | 588 | 1200 | 1723 | 992 |
| 29 | 526 | 1247 | 1569 | 1014 |
| 30 | 602 | 1175 | 1517 | 1074 |
| 31 | 549 | 1185 | 1503 | 1044 |
| 32 | 604 | 1180 | 1673 | 972 |
| 33 | 486 | 1155 | 1642 | 970 |
| 34 | 573 | 1203 | 1660 | 1068 |
| 35 | 495 | 1107 | 1535 | 993 |
| 36 | 490 | 1135 | 1520 | 968 |
| 37 | 610 | 1142 | 1731 | 977 |
| 38 | 620 | 1181 | 1722 | 1059 |
| 39 | 488 | 1202 | 1517 | 977 |
| 40 | 595 | 1120 | 1632 | 1007 |
| 41 | 584 | 1164 | 1554 | 980 |
| 42 | 592 | 1237 | 1694 | 1082 |
| 43 | 507 | 1120 | 1687 | 1023 |
| 44 | 494 | 1208 | 1710 | 1040 |
| 45 | 591 | 1216 | 1749 | 981 |
| 46 | 586 | 1137 | 1610 | 994 |
| 47 | 554 | 1139 | 1634 | 984 |
| 48 | 547 | 1152 | 1651 | 990 |
| 49 | 562 | 1161 | 1737 | 1065 |
| 50 | 567 | 1085 | 1567 | 992 |
References
- Kowalczyk, J.; Ulbrich, D.; Sędłak, K.; Nowak, M. Adhesive Joints of Additively Manufactured Adherends: Ultrasonic Eval-uation of Adhesion Strength. Materials 2022, 15, 3290. [Google Scholar] [CrossRef] [PubMed]
- Ulbrich, D.; Kowalczyk, J.; Jósko, M.; Selech, J. The analysis of spot welding joints of steel sheets with closed profile by ul-trasonic method. Case Stud. Nondestruct. Test. Eval. 2015, 4, 8–14. [Google Scholar] [CrossRef] [Green Version]
- Ulbrich, D.; Kańczurzewska, M. Correlation Tests of Ultrasonic Wave and Mechanical Parameters of Spot-Welded Joints. Materials 2022, 15, 1701. [Google Scholar] [CrossRef] [PubMed]
- Ma, Y.; Abe, Y.; Geng, P.; Akita, R.; Ma, N.; Mori, K. Adhesive dynamic behavior in the clinch-bonding process of aluminum alloy A5052-H34 and advanced high-strength steel JSC780. J. Mater. Process. Technol. 2022, 305, 117602. [Google Scholar] [CrossRef]
- Bayraktar, M.; Cerkez, V. Experimental and numerical investigation of clinched joint and implementation of the results to design of a tumble dryer. J. Brazil. Soc. Mech. Sci. Eng. 2020, 42, 567. [Google Scholar] [CrossRef]
- Gibmeier, J.; Rode, N.; Peng, R.L.; Oden, M.; Scholtes, B. Residual stress in clinched joints of metals. Appl. Phys. A 2002, 74, s1440–s1442. [Google Scholar] [CrossRef]
- Szymanik, B.; Psuj, G.; Lopato, P.; Maciusowicz, M.; Herbko, M. Multimodal fatigue progress monitoring of construction steel elements. In Proceedings of the 2016 International Conference on Quantitative InfraRed Thermography, Gdansk, Poland, 4–8 July 2016. [Google Scholar]
- Lopato, P.; Psuj, G.; Szymanik, B. Nondestructive Inspection of Thin Basalt Fiber Reinforced Composites Using Combined Terahertz Imaging and Infrared Thermography. Adv. Mater. Sci. Eng. 2016, 2016, 625. [Google Scholar] [CrossRef] [Green Version]
- Tighe, R.; Dulieu-Barton, J.; Quinn, S. Infrared Techniques for Practical Defect Identification in Bonded Joints in Liquefied Natural Gas Carriers. Exp. Tech. 2018, 42, 121–128. [Google Scholar] [CrossRef] [Green Version]
- Grosso, M.; Lopez, J.E.C.; Silva, V.M.A.; Soares, S.D.; Rebello, J.M.A.; Pereira, G.R. Pulsed thermography inspection of adhesive composite joints: Computational simulation model and experimental validation. Compos. Part B Eng. 2016, 106, 1–9. [Google Scholar] [CrossRef]
- Jansen, C.; Wietzke, S.; Wang, H.; Koch, M.; Zhao, G. Terahertz spectroscopy on adhesive bonds. Polym. Test. 2011, 30, 150–154. [Google Scholar] [CrossRef]
- Sarr, C.A.T.; Chataigner, S.; Gaillet, L.; Godin, N. Nondestructive evaluation of FRP-reinforced structures bonded joints using acousto-ultrasonic: Towards diagnostic of damage state. Constr. Build. Mater. 2021, 313, 125499. [Google Scholar] [CrossRef]
- Allen, J.C.P.; Ng, C.T. Debonding detection at adhesive joints using nonlinear Lamb waves mixing. NDTE Int. 2022, 125, 102552. [Google Scholar] [CrossRef]
- Dillingham, G.; Oakley, B.; Voast, P.J.V.; Shelley, P.H.; Blakley, R.L.; Smith, C.B. Quantitative detection of peel ply derived contaminants via wettability measurements. J. Adhes. Sci. Technol. 2012, 26, 1563–1571. [Google Scholar] [CrossRef]
- Zhao, D.; Wang, Y.; Zhang, P.; Liang, D. Modeling and Experimental Research on Resistance Spot Welded Joints for Dual-Phase Steel. Materials 2019, 12, 1108. [Google Scholar] [CrossRef] [Green Version]
- Trembach, B.; Grin, A.; Turchanin, M.; Makarenko, N.; Markov, O.; Trembach, I. Application of Taguchi method and ANOVA analysis for optimization of process parameters and exothermic addition (CuO-Al) introduction in the core filler during self-shielded flux-cored arc welding. Int. J. Adv. Manuf. Technol. 2021, 114, 1099–1118. [Google Scholar] [CrossRef]
- Rudawska, A.; Zaleski, K.; Miturska, I.; Skoczylas, A. Effect of the Application of Different Surface Treatment Methods on the Strength of Titanium Alloy Sheet Adhesive Lap Joints. Materials 2019, 12, 4173. [Google Scholar] [CrossRef] [Green Version]
- Da Silva, L.F.M.; Ferreira, N.M.A.J.; Richter-Trummer, V.; Marques, E.A.S. Effect of grooves on the strength of adhesively bonded joints. Int. J. Adhes. Adhes. 2010, 30, 735–743. [Google Scholar] [CrossRef]
- Da Silva, L.F.M.; João, C.Q.; Lopes, M. Joint strength optimization by the mixed-adhesive technique. Int. J. Adhes. Adhes. 2009, 29, 509–514. [Google Scholar] [CrossRef]
- Ewenz, L.; Kuczyk, M.; Zimmermann, M. Effect of the tool geometry on microstructure and geometrical features of clinched aluminum. J. Adv. Join. Process. 2022, 5, 100091. [Google Scholar] [CrossRef]
- Spaka, B.; Schlicht, M.; Nowak, K.; Kästner, M.; Froitzheim, P.; Flügge, W.; Fiedler, M. Estimation of fatigue life for clinched joints with the Local Strain Approach. Procedia Struct. Integr. 2022, 38, 572–580. [Google Scholar] [CrossRef]
- Chen Ch Zhang, H.; Xu, Y.; Wu, J. Investigation of the flat-clinching process for joining three-layer sheets on thin-walled structures. Thin-Walled Struct. 2020, 157, 107034. [Google Scholar] [CrossRef]
- Chen, C.; Zhao, S.; Han, X.; Zhao, X.; Ishida, T. Experimental investigation on the joining of aluminum alloy sheets using im-proved clinching process. Materials 2017, 10, 887. [Google Scholar] [CrossRef] [PubMed] [Green Version]
- Lambiase, F.; Di Ilio, A. Joining aluminum with titanium alloy sheets by mechanical clinching. J. Manuf. Process 2018, 35, 457–465. [Google Scholar] [CrossRef]
- Abe, Y.; Maeda, T.; Yoshioka, D.; Mori, K.I. Mechanical clinching and self-pierce riveting of thin three sheets of 5000 series aluminum alloy and 980 MPa grade cold rolled ultra-high strength steel. Materials 2020, 13, 4741. [Google Scholar] [CrossRef] [PubMed]
- Abe, Y.; Mori, K.I. Mechanical clinching and self-pierce riveting for sheet combination of 780-MPa high-strength steel and aluminum alloy A5052 sheets and durability on salt spray test of joints. Int. J. Adv. Manuf. Technol. 2011, 113, 59–72. [Google Scholar] [CrossRef]
- Maggiore, S.; Banea, M.D.; Stagnaro, P.; Luciano, G. A Review of Structural Adhesive Joints in Hybrid Joining Processes. Polymers 2021, 13, 3961. [Google Scholar] [CrossRef]
- Braga, D.F.O.; Maciel, R.; Bergmann, L.; Silva, L.F.M.; Infante, V.; Santos, J.F.; Moreira, P.M.G.P. Fatigue performance of hybrid overlap friction stir welding and adhesive bonding of an Al-Mg-Cu alloy. Fatigue Fract. Eng. Mater. Struct. 2019, 42, 1262–1270. [Google Scholar] [CrossRef]
- Barbalić, J.; Rajčić, V.; Bedon, C.; Budzik, M.K. Short-Term Analysis of Adhesive Types and Bonding Mistakes on Bond-ed-in-Rod (BiR) Connections for Timber Structures. Appl. Sci. 2021, 11, 2665. [Google Scholar] [CrossRef]
- Romano, M.G.; Guida, M.; Marulo, F.; Giugliano Auricchio, M.; Russo, S. Characterization of Adhesives Bonding in Aircraft Structures. Materials 2020, 13, 4816. [Google Scholar] [CrossRef]
- Rośkowicz, M.; Godzimirski, J.; Komorek, A.; Jasztal, M. The Effect of Adhesive Layer Thickness on Joint Static Strength. Materials 2021, 14, 1499. [Google Scholar] [CrossRef]
- Kałuża, M.; Hulimka, J.; Bula, A. FEM Analysis as a Tool to Study the Behavior of Methacrylate Adhesive in a Full-Scale Steel-Steel Shear Joint. Materials 2022, 15, 330. [Google Scholar] [CrossRef]
- Carbas, R.J.C.; Dantas, M.A.; Marques, E.A.S.; Da Silva, L.F.M. Effect of the adhesive thickness on butt adhesive joints under torsional loads. J. Adv. Join. Process. 2021, 3, 100061. [Google Scholar] [CrossRef]
- Wargula, L.; Kukla, M.; Lijewski, P.; Dobrzynski, M.; Markiewicz, F. Influence of Innovative Woodchipper Speed Control Systems on Exhaust Gas Emissions and Fuel Consumption in Urban Areas. Energies 2020, 13, 3330. [Google Scholar] [CrossRef]
- Rymaniak, Ł.; Lijewski, P.; Kaminska, M.; Fuc, P.; Kurc, B.; Siedlecki, M.; Kalocinski, T.; Jagielski, A. The role of real power output from farm tractor engines in determining their environmental performance in actual operating conditions. Comput. Electron. Agric. 2020, 173, 105405. [Google Scholar] [CrossRef]


| Designation | Numerical Classification | C [%] | Mn [%]. | P [%] | S [%] | Si | Ti | Al | Nb |
|---|---|---|---|---|---|---|---|---|---|
| DC01 | 1.033 | ≤0.12 | ≤0.6 | ≤0.045 | ≤0.045 | - | - | - | - |
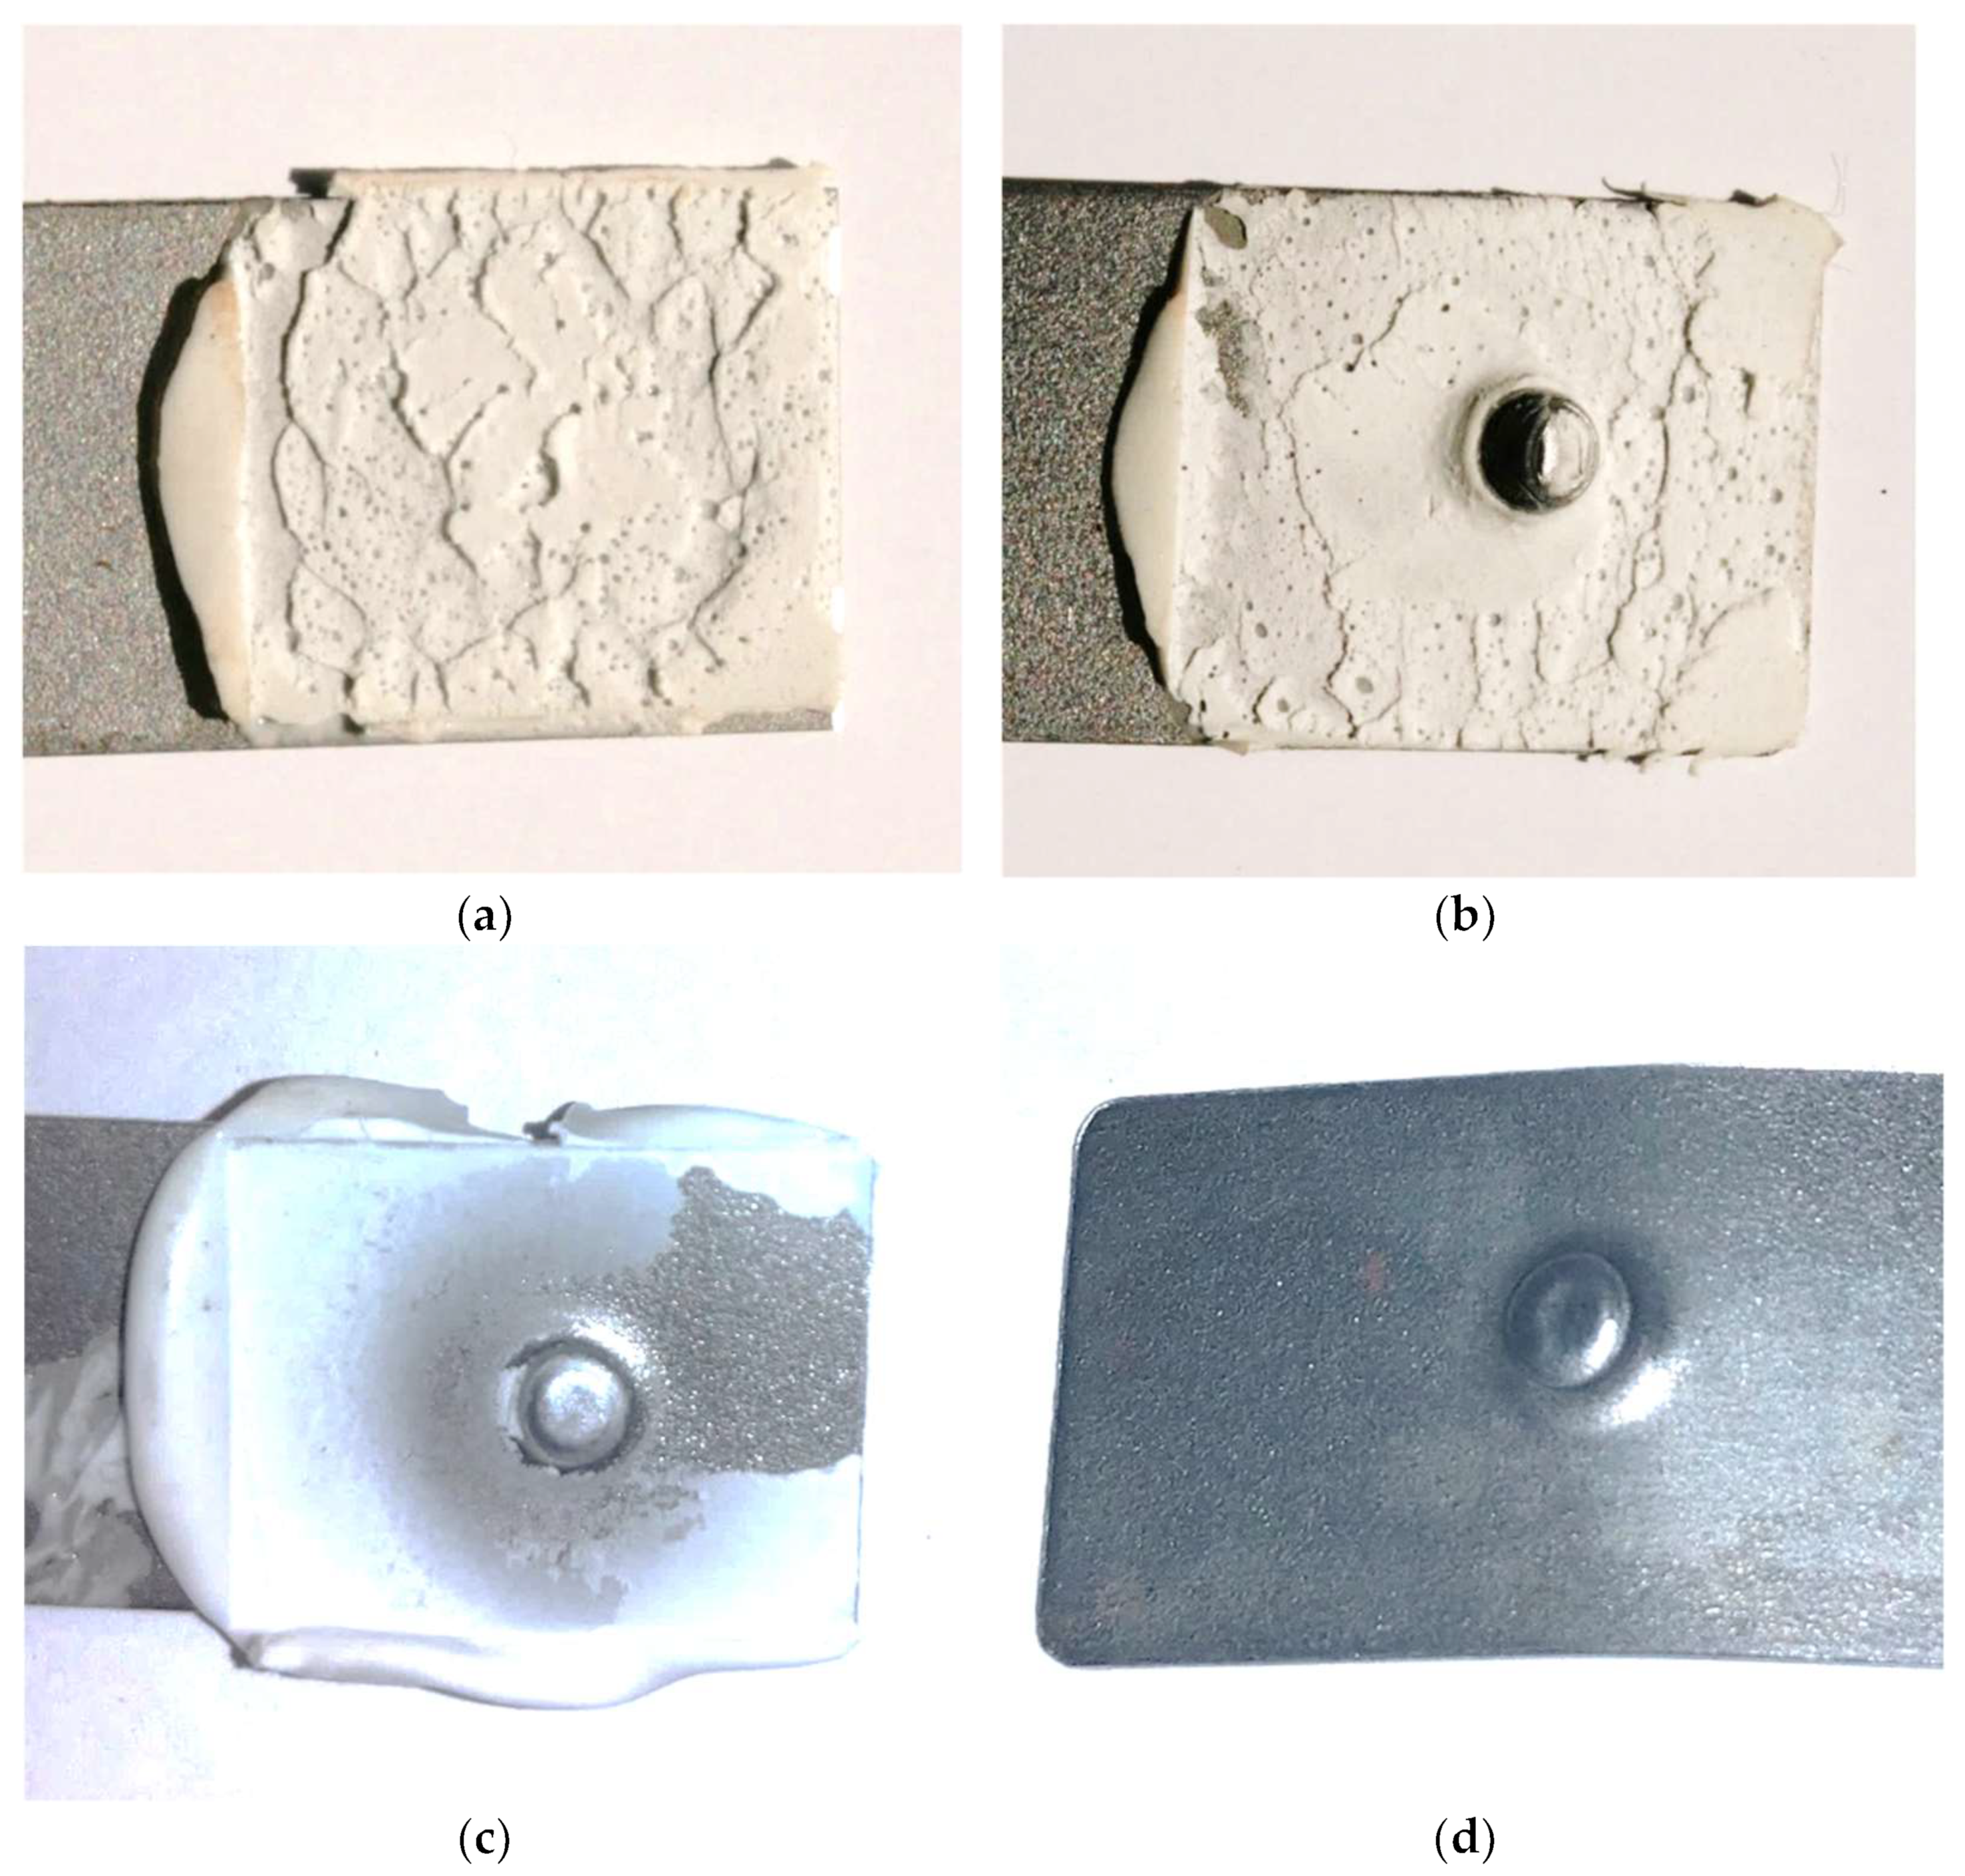
| Designation of the Test Series | Type of Metal Sheet | Type of Adhesive | Clinching | Sample View |
|---|---|---|---|---|
| Series 1 | DC01 | Hybrid adhesive | Without Clinching |  |
| Series 2 | DC01 | Hybrid Type of sheet metal | Clinching after the adhesive has cured |  |
| Series 3 | DC01 | Hybrid adhesive | Clinching immediately after the application of the adhesive | 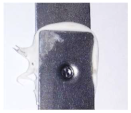 |
| Series 4 | DC01 | Without adhesive | Only Clinching | 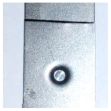 |
| Parameter | ||
|---|---|---|
| frequency | 20 | MHz |
| diameter of the transducer | 3.15 | mm |
| effective diameter | 3.05 | mm |
| wave speed of tested material | 6325 | m/s |
| wavelength | 0.31 | mm |
| near field | 7.3 | mm |
| the coefficient of decreased decibels K | 0.87 | - |
| sin the angle of divergence of the beam | 0.09 | - |
| divergence angle degrees | 5.17 | O |
| distance from the transducer | 17 | mm |
| beam width | 3.1 | mm |
| Sandblasting (N) | Sanding (N) | Degreasing (N) | |
|---|---|---|---|
| Min | 432 | 432 | 438 |
| Max | 519 | 515 | 521 |
| Average | 477.05 | 480.25 | 486.4 |
| Deviation | 30.11 | 26.28 | 21.39 |
| Confidence interval L0.1 | 52.06 | 45.44 | 36.99 |
| HII (%) | HIII (%) | HIV (%) | HV (%) | |
|---|---|---|---|---|
| Average | 69.8 | 58.8 | 50.0 | 41.6 |
| Deviation | 1.03 | 2.08 | 0.98 | 1.97 |
| T-student coefficient 10% | 1.66 | 1.67 | 1.67 | 1.67 |
| Confidence interval L0,1 | 1.72 | 3.47 | 1.64 | 3.29 |
| HII (%) | HIII (%) | HIV (%) | HV (%) | |
|---|---|---|---|---|
| Average | 63.4 | 49.9 | 38.7 | 28.6 |
| Deviation | 5.27 | 4.30 | 3.31 | 3.67 |
| T-student coefficient 10% | 1.67 | 1.67 | 1.67 | 1.67 |
| Confidence interval L0,1 | 8.78 | 7.18 | 5.53 | 6.11 |
| Series 1 | Series 2 | Series 3 | |
|---|---|---|---|
| Min | 1.784 | 1.843 | 1.802 |
| Max | 3.307 | 3.383 | 3.212 |
| Average | 2.572 | 2.654 | 2.513 |
| Standard deviation | 0.432 | 0.466 | 0.389 |
| Series 1 (N) | Series 2 (N) | Series 3 (N) | Series 4 (N) | |
|---|---|---|---|---|
| Min | 476 | 1085 | 1486 | 965 |
| Max | 622 | 1247 | 1749 | 1082 |
| Average | 551.64 | 1166.86 | 1617.1 | 1013.08 |
| Standard deviation | 44.41 | 44.00 | 79.09 | 34.91 |
Publisher’s Note: MDPI stays neutral with regard to jurisdictional claims in published maps and institutional affiliations. |
© 2022 by the authors. Licensee MDPI, Basel, Switzerland. This article is an open access article distributed under the terms and conditions of the Creative Commons Attribution (CC BY) license (https://creativecommons.org/licenses/by/4.0/).
Share and Cite
Kowalczyk, J.; Matysiak, W.; Sawczuk, W.; Wieczorek, D.; Sędłak, K.; Nowak, M. Quality Tests of Hybrid Joint–Clinching and Adhesive—Case Study. Appl. Sci. 2022, 12, 11782. https://doi.org/10.3390/app122211782
Kowalczyk J, Matysiak W, Sawczuk W, Wieczorek D, Sędłak K, Nowak M. Quality Tests of Hybrid Joint–Clinching and Adhesive—Case Study. Applied Sciences. 2022; 12(22):11782. https://doi.org/10.3390/app122211782
Chicago/Turabian StyleKowalczyk, Jakub, Waldemar Matysiak, Wojciech Sawczuk, Daniel Wieczorek, Kamil Sędłak, and Michał Nowak. 2022. "Quality Tests of Hybrid Joint–Clinching and Adhesive—Case Study" Applied Sciences 12, no. 22: 11782. https://doi.org/10.3390/app122211782