Article

A Prototype Passive Solar Drying System: Exploitation of the Solar Chimney Effect for the Drying of Potato and Banana

by
Vasileios K. Firfiris
1,*,
Zoi D. Kaffe
1,
Sotirios D. Kalamaras
1,
Antonios A. Lithourgidis
1,
Anastasia G. Martzopoulou
2 and
Thomas A. Kotsopoulos
1,*
1
Department of Hydraulics, Soil Science and Agricultural Engineering, School of Agriculture, Aristotle University of Thessaloniki, GR-54124 Thessaloniki, Greece
2
School of Architecture, Faculty of Engineering, Aristotle University of Thessaloniki, GR-54124 Thessaloniki, Greece
*
Authors to whom correspondence should be addressed.
Appl. Sci. 2022, 12(22), 11784; https://doi.org/10.3390/app122211784
Submission received: 14 October 2022 / Revised: 11 November 2022 / Accepted: 17 November 2022 / Published: 19 November 2022
(This article belongs to the Special Issue Applied Agri-Technologies 2)

Abstract

:
Agricultural product drying is of great importance as it is a reliable method for fruit and vegetable preservation. Tackling the high energy consumption of the process will reduce the final product cost and mitigate greenhouse gas emissions. In this work, a passive drying method was experimentally evaluated. The method was based on the principle of the stack effect taking place in the solar chimney structure. Different types of solar chimneys in terms of dimensions and materials were evaluated for the drying of banana and potato slices. The results of the experiments showed that the drying rate was close to solar drying systems. Parameters such as height and material characteristics of drying tubes, as also weather conditions, influenced the drying rate. It was found that the banana and potato slices were dried at a satisfactory rate for almost 48 h during the summer period in Greece. From the parameters of the drying tubes that were varied, it was found that both the height and material played a major role, as did the air flow rate. With the increase in the drying tube by 1 m and with the choice of proper manufacturing material, an increase in the flow rate between 40% and 100% can be achieved. When only the color of two 3 m-high tubes changed, the flow rate varied between 4% and 15%. The proposed method has almost zero energy consumption, and it could be used as a standalone or as a part of a hybrid drying system. It can also be adjusted in existing greenhouse-type agricultural structures as a parallel operation system.

1. Introduction

Food preservation by the drying method is a very old technique that is still relevant today. Dehydrated food is resistant to bacteria, yeasts, and fungi growth, as water is essential for their propagation. Dried agricultural products have many advantages over fresh ones. Long shelf life is one of these advantages because nutrients from off-season agricultural products can be provided throughout the entire year [1]. Moreover, the fact that they are more easily handled, packaged, and stored than fresh food makes them ideal for transportation from the region of production to even long distant markets [1].
During the drying or dehydration process a percentage of the water content is removed by fruits or vegetables until the desired water level is reached. The removal of water can be performed by various physical (e.g., solar drying) or artificial process, such as evaporation and reverse osmosis [2].
Drying agricultural products is a fully developed process with commercial applications, and it is energy demanding. Important parameters during the drying process are the air temperature of the space where the drying occurs and the air relative humidity level [3]. An effective technique to retain the relative humidity at a low level is air recirculation [4]. So, energy is required mainly for heating, dehumidification, and air circulation in conventional applications to achieve suitable conditions for the food drying process. It has been reported that the final cost of the drying process is strongly dependent on the initial capital, labor, energy, and handling costs [5]. In an examined case study, among these costs, energy occupies 30% of the drying cost when the price for propane is almost at 0.18 €/L, and the electricity cost is about 0.06 €/kWh, while 46% of the total investment cost belongs to the initial capital [5]. Therefore, energy has a crucial role in the price formation of the final product.
Previous research has focused on reducing the energy needed for drying to make it cost efficient and environmentally friendly [6,7,8,9]. One approach is the utilization of renewable energy sources, such as solar drying or natural ventilation systems, where the drying energy cost is lower than the use of conventional energy sources (i.e., electricity). The effect of solar drying on the qualitative characteristics of the final product was previously studied by many authors [10,11]. Solar drying systems are divided into two types: direct and indirect, based on the application method of solar energy [12]. In direct solar drying systems, thermal efficiency has been found to be higher than the indirect systems [13]. In fact, the thermal efficiency of direct solar drying systems has been found almost between 15% and 40% over the years [12,14,15]. This rate is not constant, and it is strongly dependent on the region, type of solar dryer, and the product to be dried. On the other side, indirect systems have the advantage of a better-quality final product, as vitamins and color are better protected since they are not exposed to direct solar radiation [12].
Even in these cases, the periodical characteristics of solar radiation affect the process. According to an experimental and numerical heat transfer analysis on an indirect solar drying system, the heat transfer coefficient of the product varies during the day [16]. This is due to the dependence of the process on the solar radiation intensity, which affects the solar collector efficiency and, therefore, the drying rate [16]. Other factors that might affect the performance of indirect systems with solar collectors are the inclination of the collector [17], which has been proven to affect the drying time in an experimental drying system for bananas [17]. Hybrid systems are also mentioned in the literature. In these cases, solar drying is enhanced using other systems that can also be renewable energy sources (biomass), conventional systems (electrical heaters), low energy consumption systems (heat pumps), or thermal storage systems [13,18]. Modifications of the typical solar drying application have also been investigated, such as the insulation of the north wall in a greenhouse-type solar dryer along with the installation of a solar collector on the floor of the structure [19]. A combined operation of solar collectors and greenhouse structures has also been investigated in Tunisia, with the difference that the collector was installed outside the structure [20]. The performance of solar drying systems has been investigated extensively for various types of agricultural products and has been proven to be at satisfactory levels [8,10,21,22,23,24].
Solar drying systems have achieved a sufficient energy reduction by contributing mostly to increase the temperature in the dryer area without artificial means. However, there are some parameters that also need to be improved to further optimize the drying process, such as the reduction in relative humidity and ongoing air movement. These operation parameters are controlled by ventilation and air circulation. In the artificial drying process air movement and air exhaust is performed by fans that consume electricity for their operation [25]. Despite the energy source or the approach of the drying process, the air flow is usually performed by the assistance of a fan or blower [25]. In constant air velocity the increase in temperature leads to a lower energy consumption as drying time is reduced [26] It has been found that when the drying is performed in lower temperatures the energy consumed for air circulation is increased, while the increase in the air speed leads to a higher energy consumption [27]. The energy consumption when the air speed is increased from 1.0 m/s to 1.5 m/s and 2.5 m/s leads to an almost proportional increase in the energy consumption when the air-drying temperature remains at a constant level [28]. The energy that is consumed when a fan is operating in higher rotating speed is not the only reason for higher energy consumption of a drying process. It has been reported that high air speed is leading to higher energy consumption due to the cooling effect observed on the product to be dried. In this case the drying time and energy consumption are substantially increased [28]. Fans are often used in solar dryers, to enhance the drying process [29]. It has been found that by increasing the air flow inside a tunnel greenhouse-type dryer by a certain rate, the drying rate can be increased almost by 12–13% [29]. Increasing the flow rate above a certain rate does not have a positive effect on the drying process though [20,29]. Different drying methods lead to different energy consumption amounts per product weight. Microwave driers present the lowest energy consumption, which is almost 70% lower compared to other drying methods [30], but the initial capital cost for these drying systems is significant higher.
In this experimental work, a new drying system was created that exploits the proven advantages of indirect solar dryers without the use of conventional energy sources. The aim of this work was to examine whether the proposed systems can be proven as an efficient solution for drying, by studying the weight loss achieved by the constant air movement around the food product. Beyond the drying process, the aim of this work was to investigate whether the area of a greenhouse could be utilized for multiple uses and applications to enhance the depreciation of the total investment. This drying method could be proven vital in rural areas without access to the energy grid. It also promotes a different application for greenhouses located in regions with hot summers, where it is not economical to use them during these periods of high temperatures.
More specifically, the object of the study was to evaluate the drying performance of the system and connect parameters such as the weather conditions and the air flow rate with the drying performance in different types of specially designed drying tubes. Since the system was evaluated in prototype scale, different variations of the drying tubes will be examined as the optimum design was sought for the proposed application.
The novelty points of the examined system are:
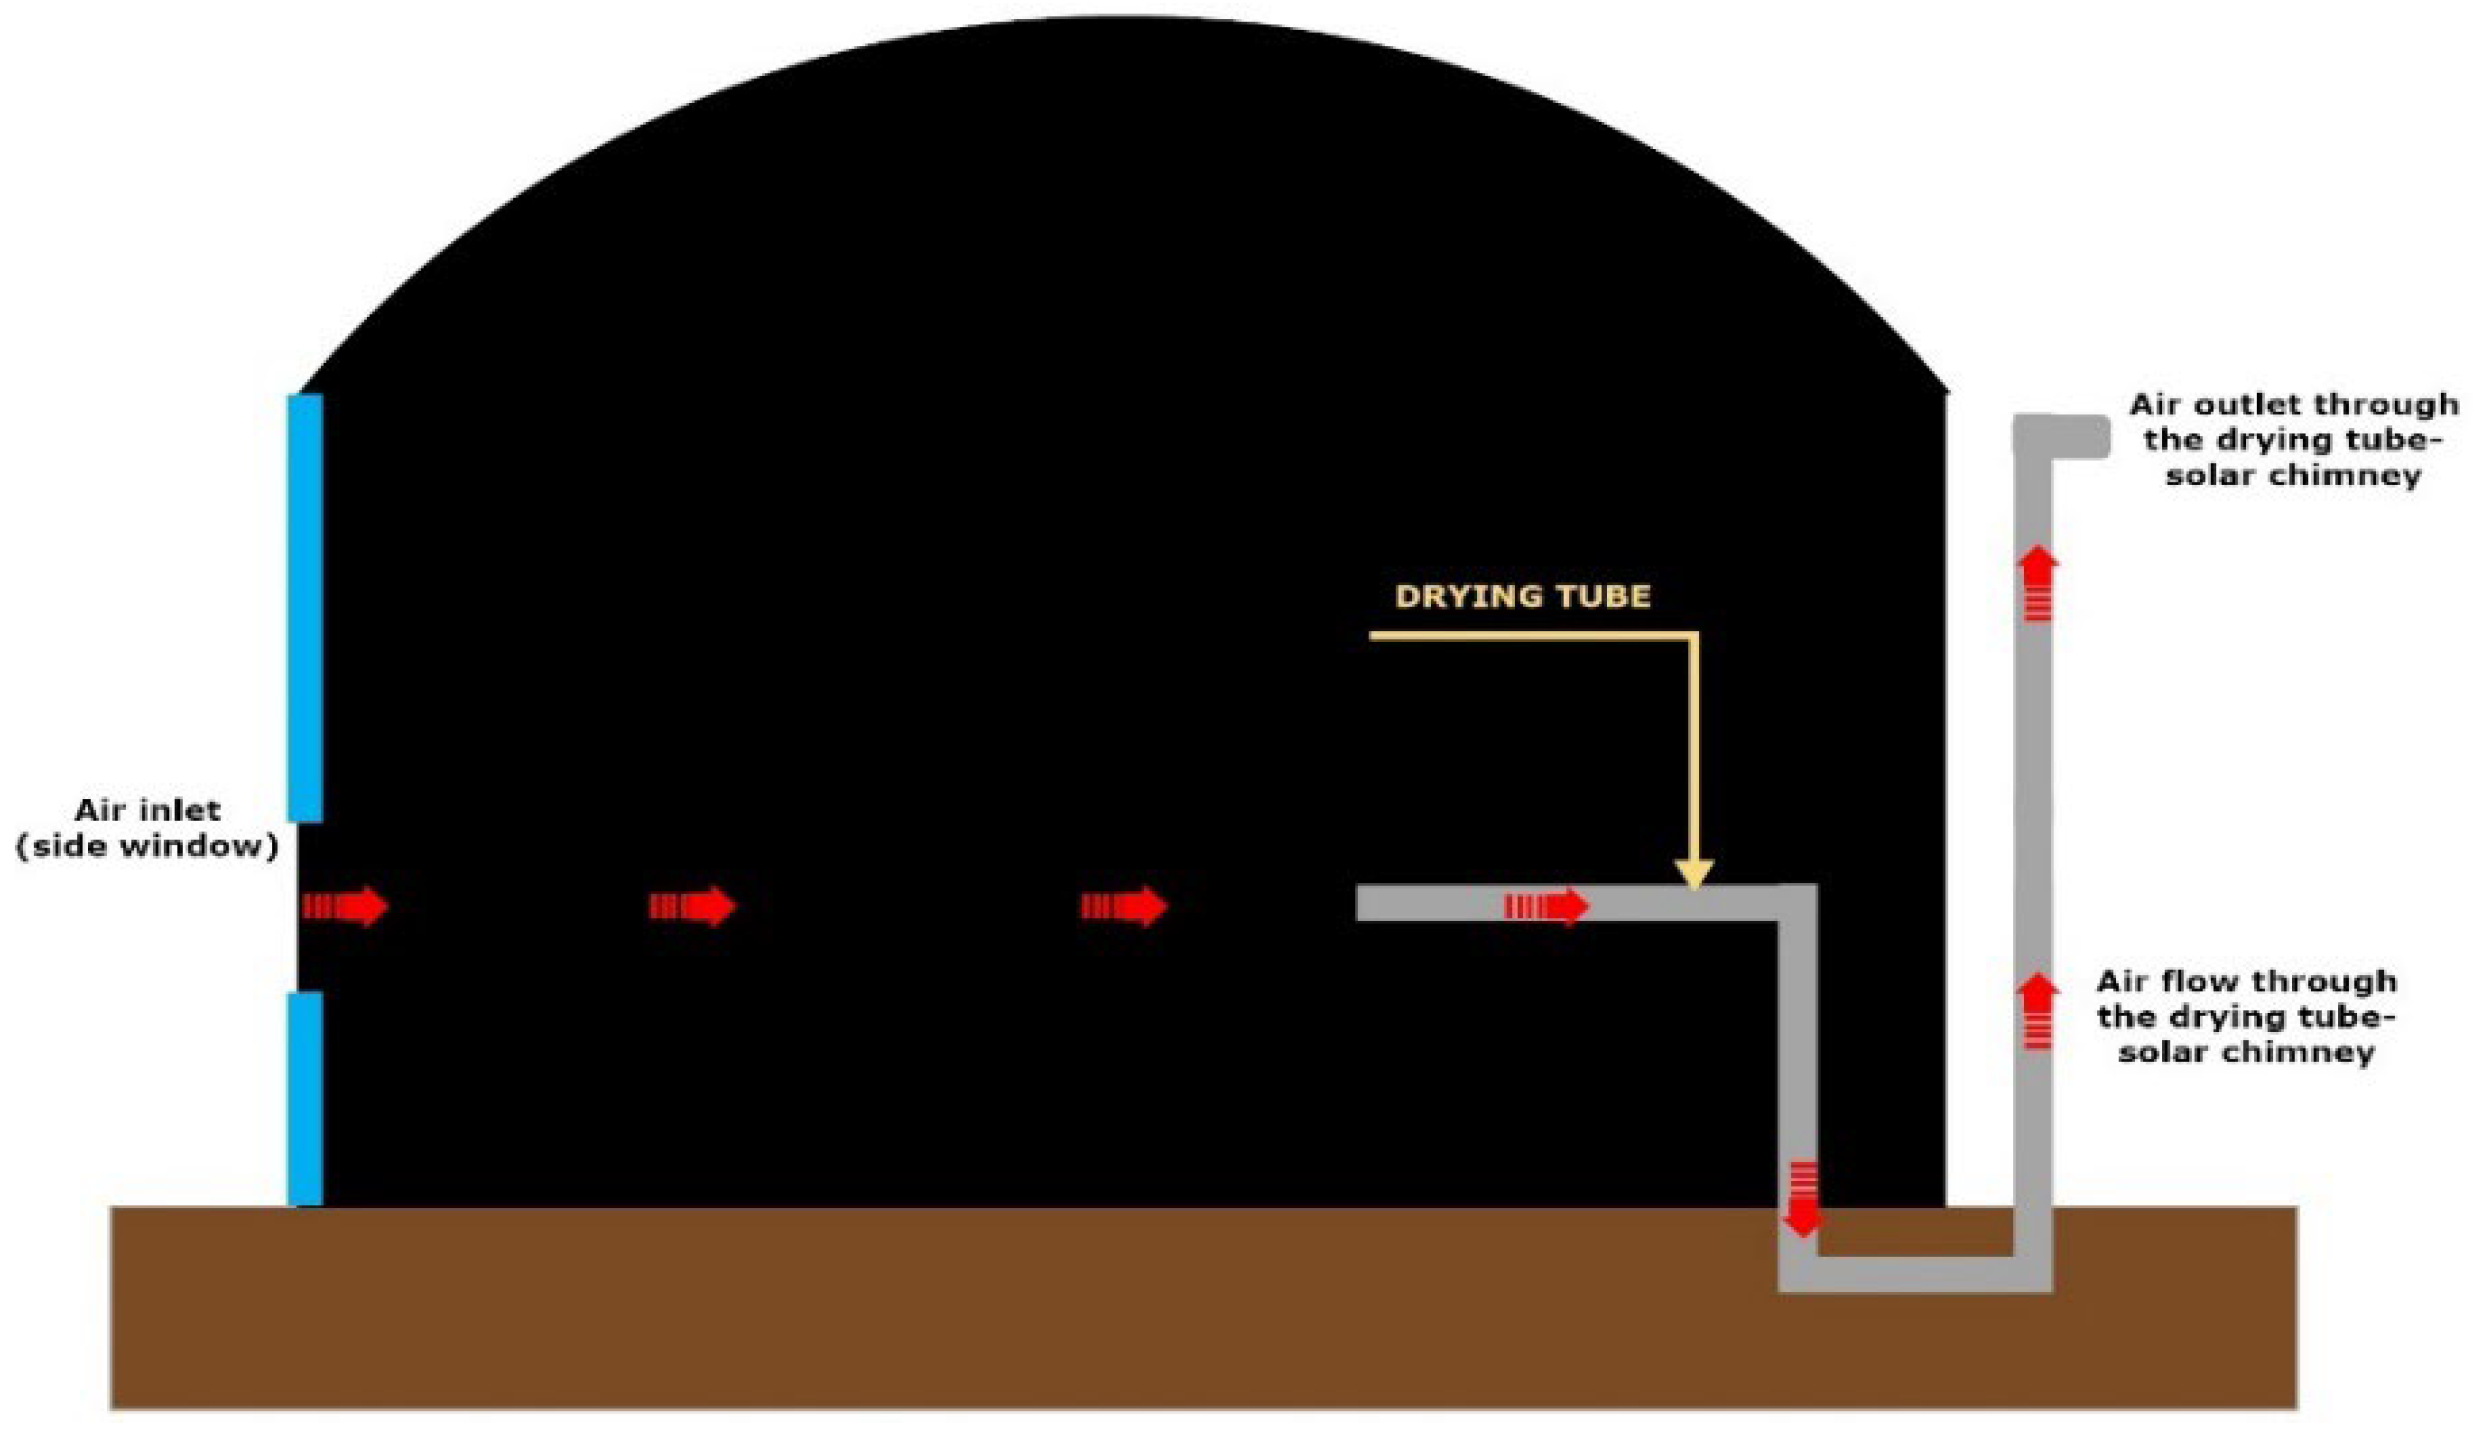
  • The proposed passive solar drying process, which succeeds in drying without the use of forced ventilation;
  • The operation of a drying system as an indirect solar system in an already installed greenhouse structure is potentially used for different applications (non-horticulture);
  • The drying tubes arrangement as an additional part of any greenhouse-type structure;
  • The modification of simple tubes to efficient drying tubes for drying agricultural products.

2. Materials and Methods

For the scope of the study, a non-heated greenhouse structure equipped with a white plastic cover impermeable to sunlight was used for drying of fresh potatoes and banana slices. The greenhouse structure was not equipped with electrical fans or blowers, but it exploited the natural ventilation due to temperature gradient as it takes place inside a solar chimney construction.

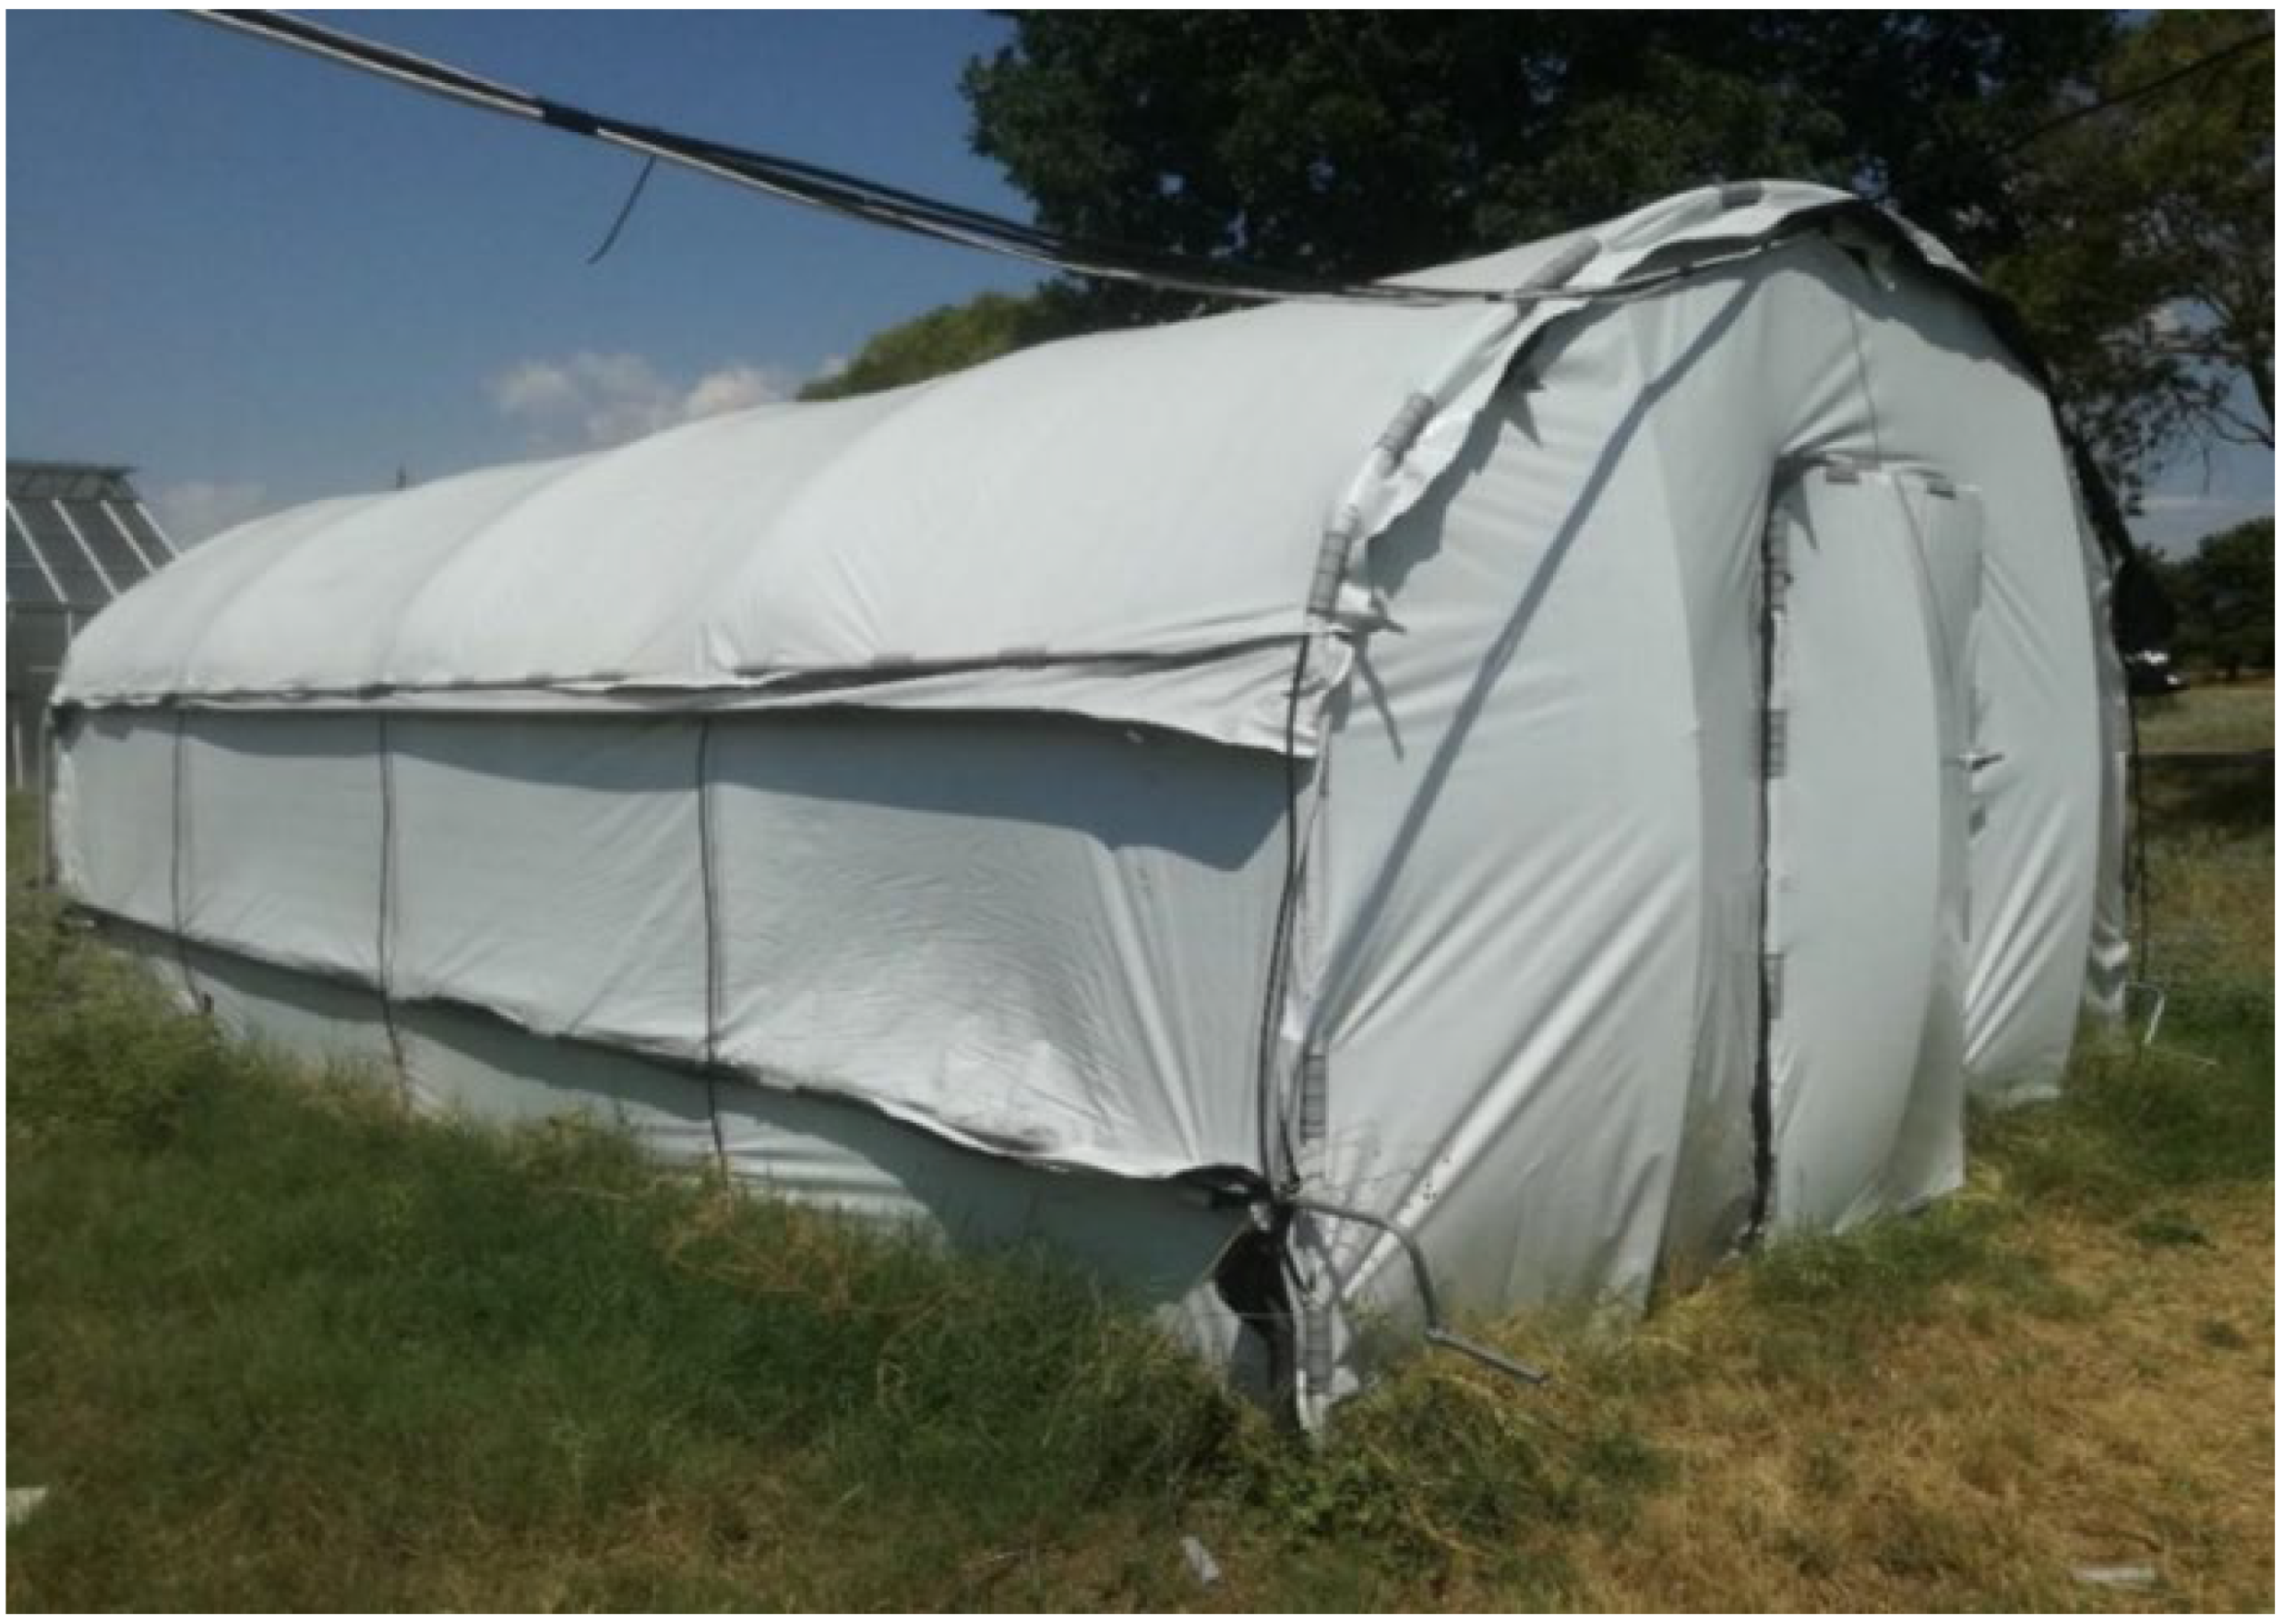
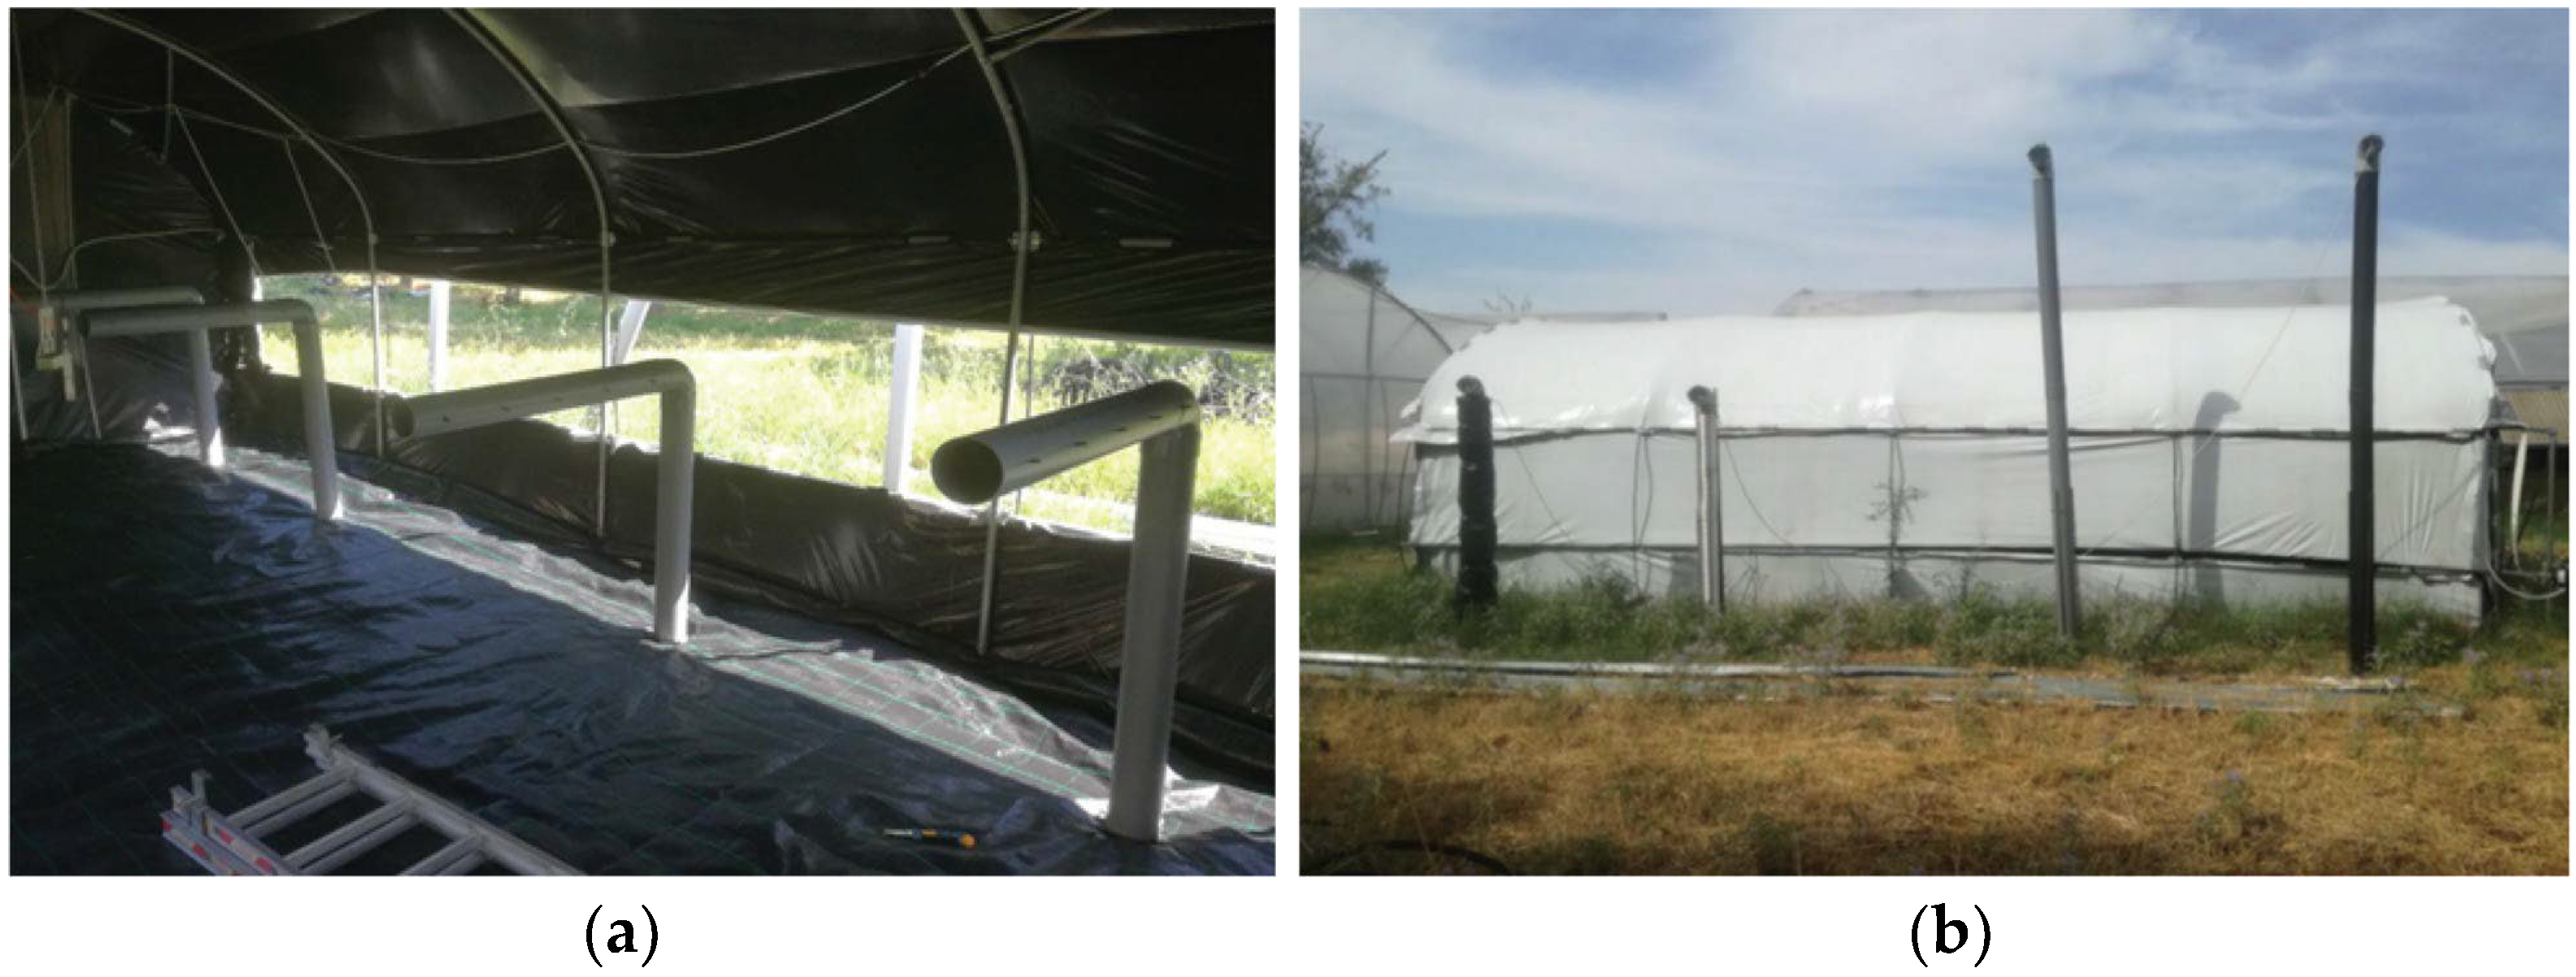
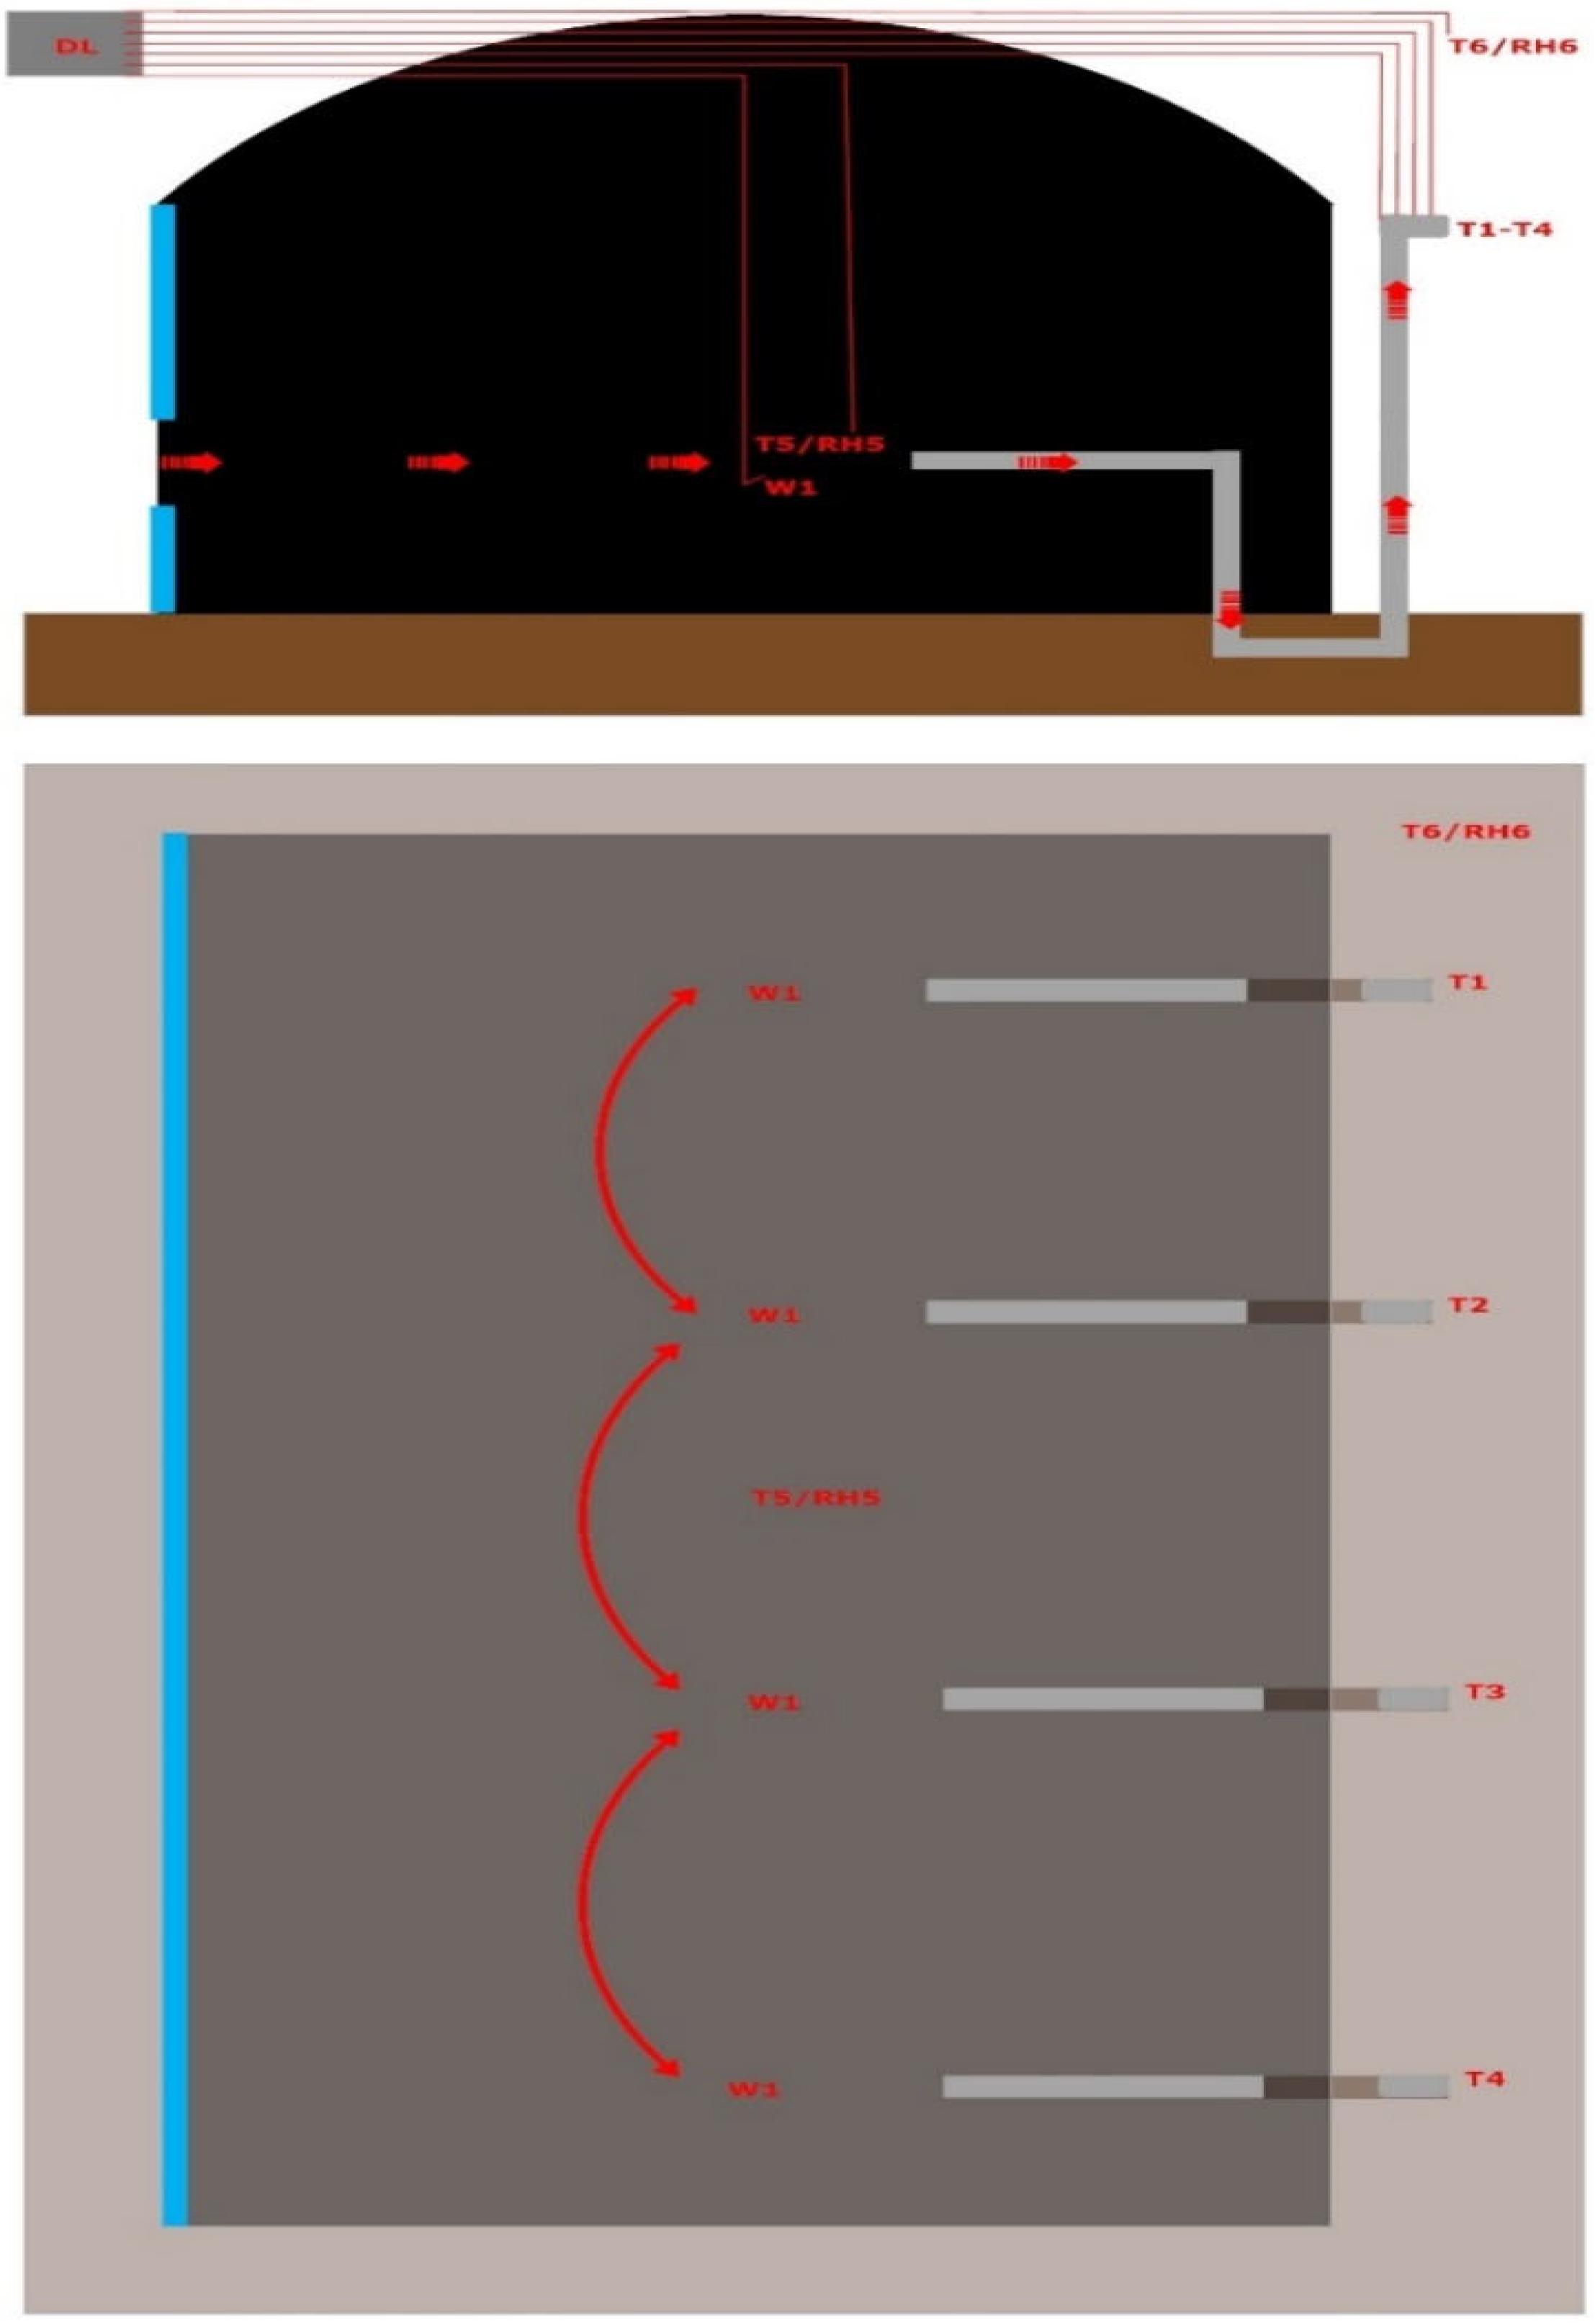
2.1. Experimental Greenhouse

The experimental greenhouse was constructed at the Farm of Aristotle University of Thessaloniki, Greece. The dimensions and covering materials of the structure are described in Table 1, while the structure is shown in Figure 1.
The greenhouse side windows were equipped with electrical motors, which could operate both manually and automatically by individual controllers at an electrical board. Automated mode for opening and closing of the side windows was governed by a temperature and relative humidity industrial controller (POLA HP35 Psychrometer hygrostat controller, Italy), equipped with a psychrometric kit (POLA WT1, Italy).

2.2. Experimental Design

The drying of vegetables and fruits was designed to be performed inside PVC tubes with a diameter of 125 mm. The overall shape of the tubes was designed to simulate the operation of a solar chimney (Figure 2) to utilize the circulation of air that occurs due to the stack effect. Specifically, the drying part of the tube (length of 1.0 m) was parallel to the ground at a height of 1.3 m, and the underground part was also parallel to the ground with a length of 0.5 m. Both the drying and the underground part of the tubes, as well as the connections (right angles, etc.) between them, were PVC (Figure 3a). The solar part of the tubes (Figure 3b) that reached vertically above the ground was different in length, material, or type of insulation (Table 2). The tubes were chosen to have different heights in order to evaluate different parameters that affect the solar chimney effect and, as a result, the drying process.
Continuous air movement inside the drying tube was ensured by retaining open the side window directly opposite the entrance of the drying tubes. This window was automatically closed only if the relative humidity inside the greenhouse reached above the level of 90%. The air movement pattern through the greenhouse and the tubes is shown in Figure 2.
Inside the drying part of the tube, a wire net was installed to place the fruit and vegetables. The wire net was horizontally positioned and supported by iron spiles, which were installed by perforating the tubes. The horizontal position of the wire net allowed the air to move both above and below the fruit or vegetable to be dried.
The different setups of the solar chimney drying method that was performed in this experiment was compared with the drying rate of positioning the fruit and vegetables inside the greenhouse on a perforated bench. For this reason, a drying box was constructed and placed in the centre of the greenhouse without interfering with the air movement inside the drying tubes (Figure 4). The drying box consisted of a wire net like the one used in the drying tubes.

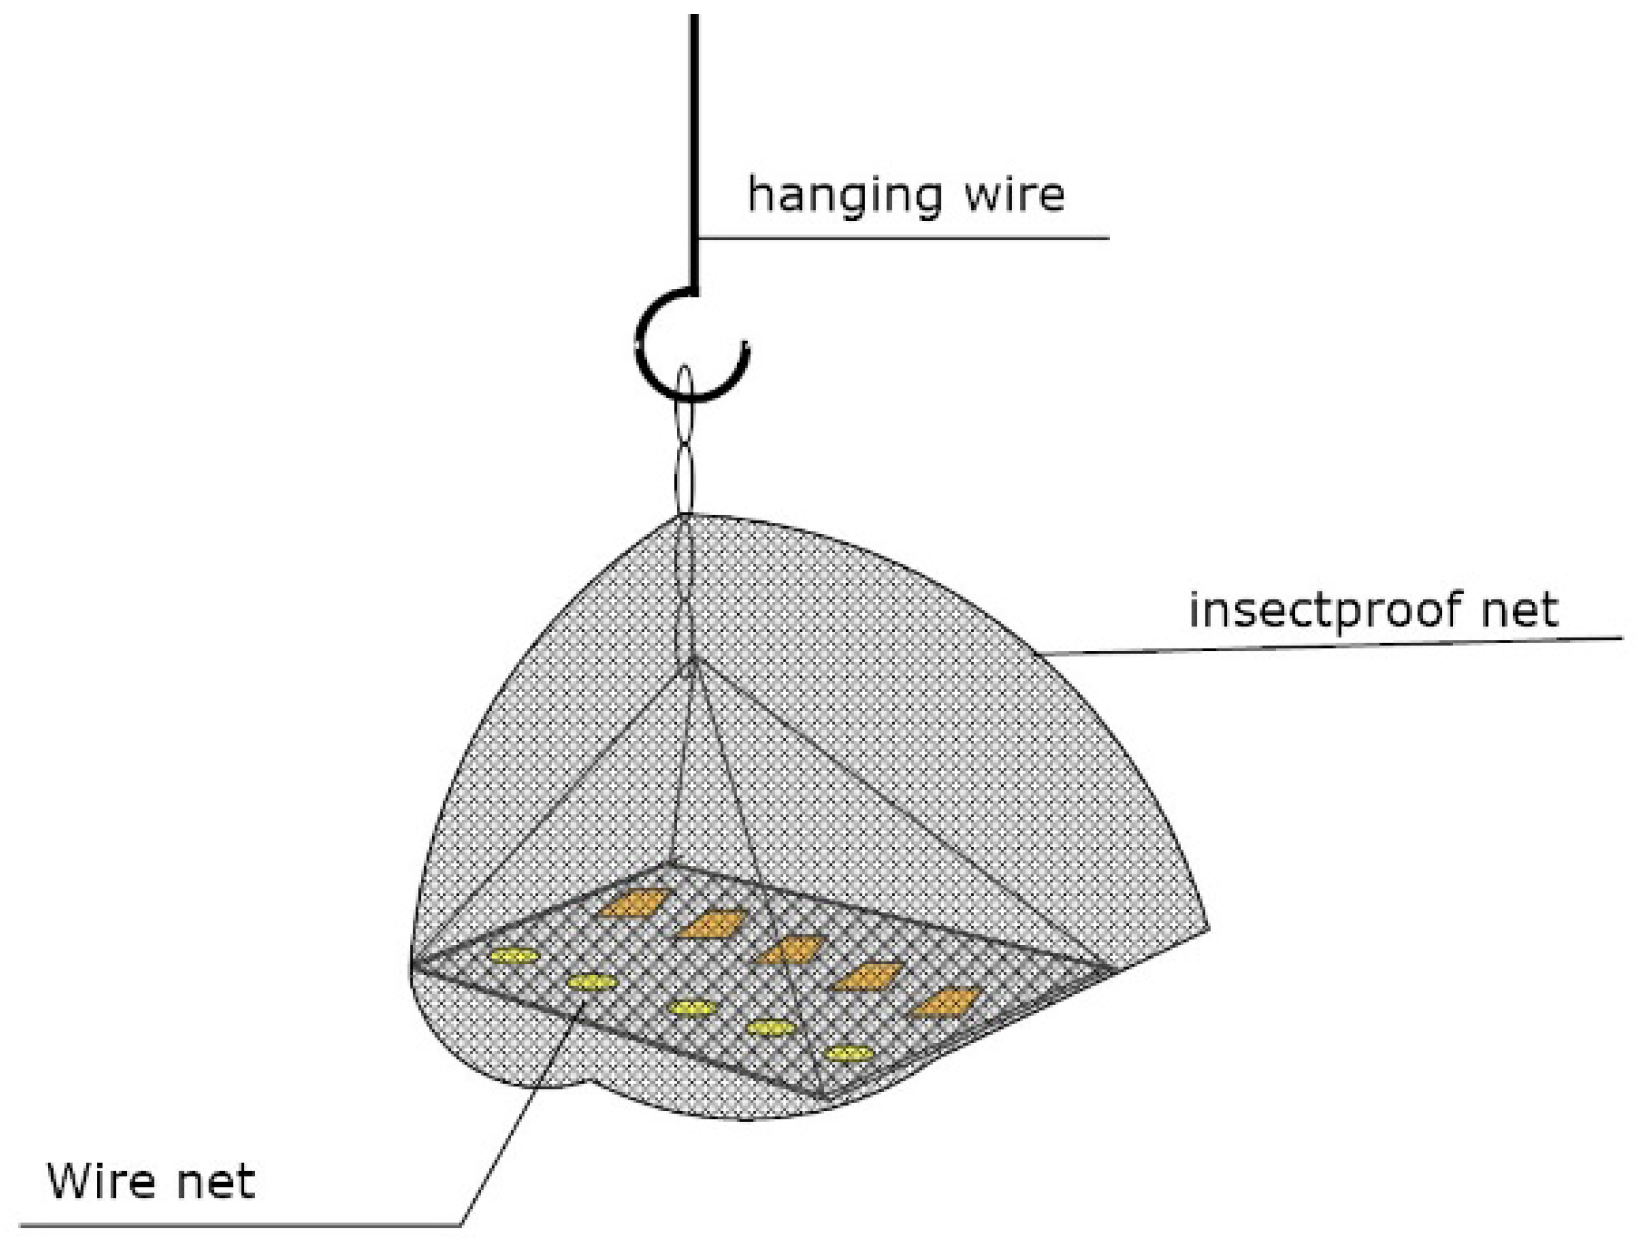
2.3. Samples for the Drying Process

For the scope of the experiment, bananas and potatoes were chosen to be dried. The dimensions and placement of the samples were performed in the same way for all the drying trials. In total, 24 samples of potatoes and 24 of bananas with similar dimensions were used in each test. Each tube had 5 samples, positioned 20 cm from each other, and the control drying box had 4 samples, with a distance between them equal to 5 cm. In the case of the potato, the samples were cut into thin slices 1 cm thick and 3 cm * 2.5 cm (length * width). The banana samples also had a thickness of about 1 cm and a 2.8 cm diameter. After slicing, the weight of each sample was taken before, during, and after the completion of the drying. According to the literature, a banana is considered in a dried condition when the moisture content is about 15% [31], while in the case of a potato, the accepted percentage is between 5% and 12% [32].

2.4. Data Logging and Sensors

Temperature sensors (T1-T4)/(PT-100) were positioned at the outlet of each tube. A temperature and relative humidity sensor was positioned in the greenhouse (T5, RH5)/(Delat Ohm, HD9009TRR, Padova- Italy). The temperature that was measured by this sensor was considered the drying tube inlet air temperature. The ambient outdoor temperature and relative humidity were measured using a combined temperature and relative humidity sensor (T6, RH6)/(HD9009TRR). The air velocity in each tube was measured periodically by an ultrasonic anemometer (W1)/(Windsonic Ultrasonic Wind meter- Gill Instruments, Lymington, Hampshire, UK), which can measure low air velocities to validate the calculated values. The wind speed (9 m above ground) outside the greenhouse was measured with an identical ultrasonic anemometer used for the tube’s air velocity. All the up mentioned parameters were measured, and they were stored by a data logger instrument (Delta T, GP2, Cambridge UK). Measurements from all sensors were taken every 15 min and stored by the data logger when the experiment was running. All the sensor positions inside and outside the greenhouse, except for the ambient wind speed, are presented in Figure 5. All the sensors as the data logger were brand new, and they were used for the first time in ambient and experimental conditions, so no calibration was required as they were already factory calibrated. The experimental measurements occurred from 19 June to 6 July 2021. The drying process was repeated 4 times during this period.

2.5. Analytical Methods

The moisture content of the bananas and potatoes was measured by completely drying one of the sliced pieces of each specimen in a furnace (Fisher Scientific furnaces, model 1250, with a maximum temperature of 180 °C and LAC, model LE05/11) from 100 °C to 105 °C for 24 h. The potatoes and bananas were cut to specific dimensions (the same dimensions were used also in the experiment) and placed on a weighting dish. The weighing of samples was performed via an electronic weighing instrument (SHIMADZU, TX2202L, Kyoto Japan) that has a sensitivity of 0.01 g.

2.6. Theoretical Calculations Model and Equations

2.6.1. Drying Process

The drying rate of agricultural products is evaluated by the percentage of moisture content that is retained in the product compared to its initial value. Moisture content is defined as the quantity of water contained in an agricultural product. Moisture content is a ratio ranging from values near zero (in this case, the product is completely dry) to the initial value of the product’s moisture. The moisture content is expressed as a percentage of moisture on the total weight (wet basis) or dry matter (dry basis). The wet basis value of moisture content is used to determine the initial value of moisture in an agricultural product, while the dry matter can be used to measure the moisture content in a product that is in its dried condition. The moisture content is calculated as shown in Equations (1) and (2). where M is moisture content on a percent basis, Wt is the total weight, and Wd is the weight of dry matter [33].
Mt = Wt Wd Wt × 100 %
Mt = Wt Wd Wd × 100 %
The variation on the weight of the product when it is dried is due to moisture removal. So, any weight loss is dedicated to the dried process.

2.6.2. Air Movement

The air flow is a result of the temperature difference occurred between the start and end of the tube. The air has the property of moving from the points of higher pressure to points of lower pressure. The stack effect is described in Equation (3) [34]. The mass flow equation is described in Equation (4) [34].
V ˙ = 2 × A × g × Δ h × Ti To Ti 1 2
  • V ˙ : air flow (m3 × h−1)
  • A: opening surface (m2)
  • g: gravity acceleration
  • Δh: height difference between inlet and outlet (m)
  • Ti: internal temperature (°C)
  • To: environmental temperature (°C)
    m ˙ = ρ × A c × u
  • m ˙ : air flow (kg/s)
  • ρ: air density (kg/m3)
  • Ac: cross-sectional area of drying tube (m2)
  • u: air velocity (m/s)

2.6.3. Economic Analysis

Even if the system is a prototype, it will be valuable to perform a primary evaluation of the economic viability of its operation. The method that will be used is the payback period analysis, which has also been used in similar applications [22,23]. There will be two payback period scenarios: one for the examined prototype system and one for the case that it was installed on a larger commercial scale. The payback period is given by Equation (5) [23].
P b = C i P net
  • Pb: payback period (years)
  • Ci: capital investment cost (€)
  • Pnet: annual net profit value (€)
The Pnet value is defined by the difference in income minus the cost of the system’s operation. In the examined case, the cost values that will be included are
  • The cost of fresh fruits or vegetables (C.f);
  • The energy cost (C.e).
While the income values will be taken are:
  • The income by selling drying products (I.d).
All values will be assumed from current data of the Greek market. The income parameters that will be excluded are potential subsidies, or income by parallel activities in the greenhouse structure. On the other hand, tax, insurance, or costs that relate to parallel activities in the greenhouse will be excluded.

3. Results

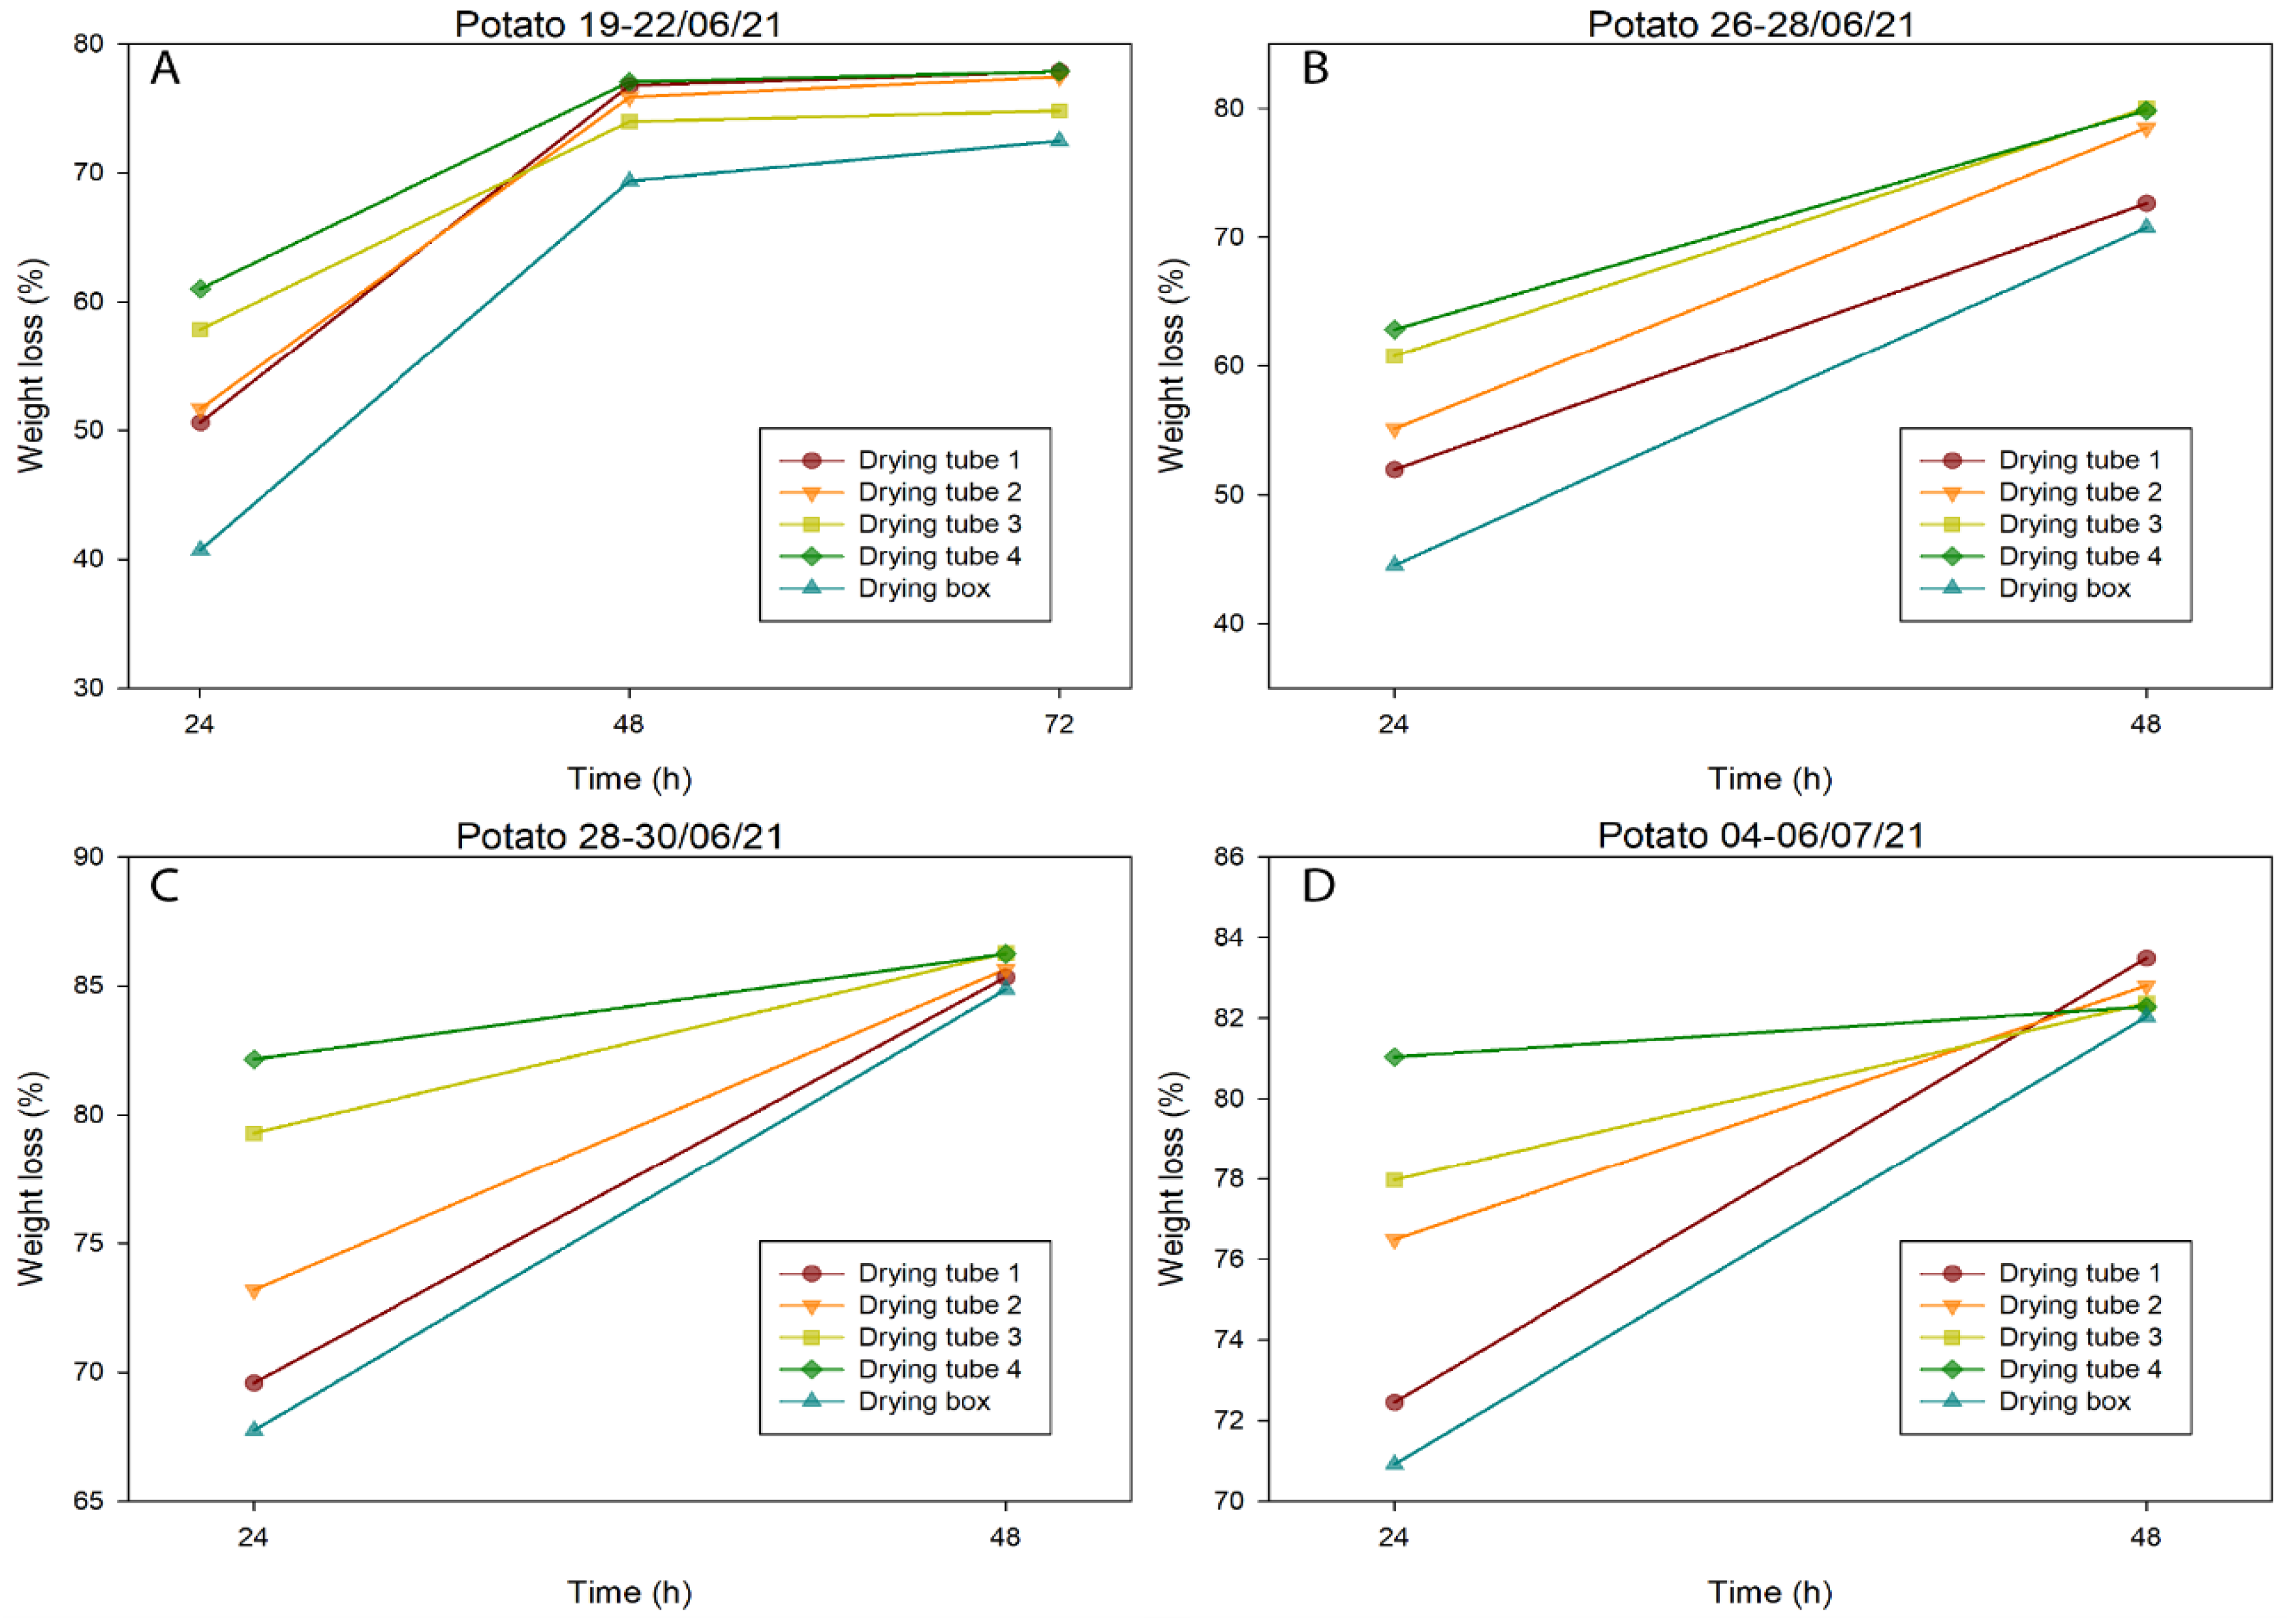
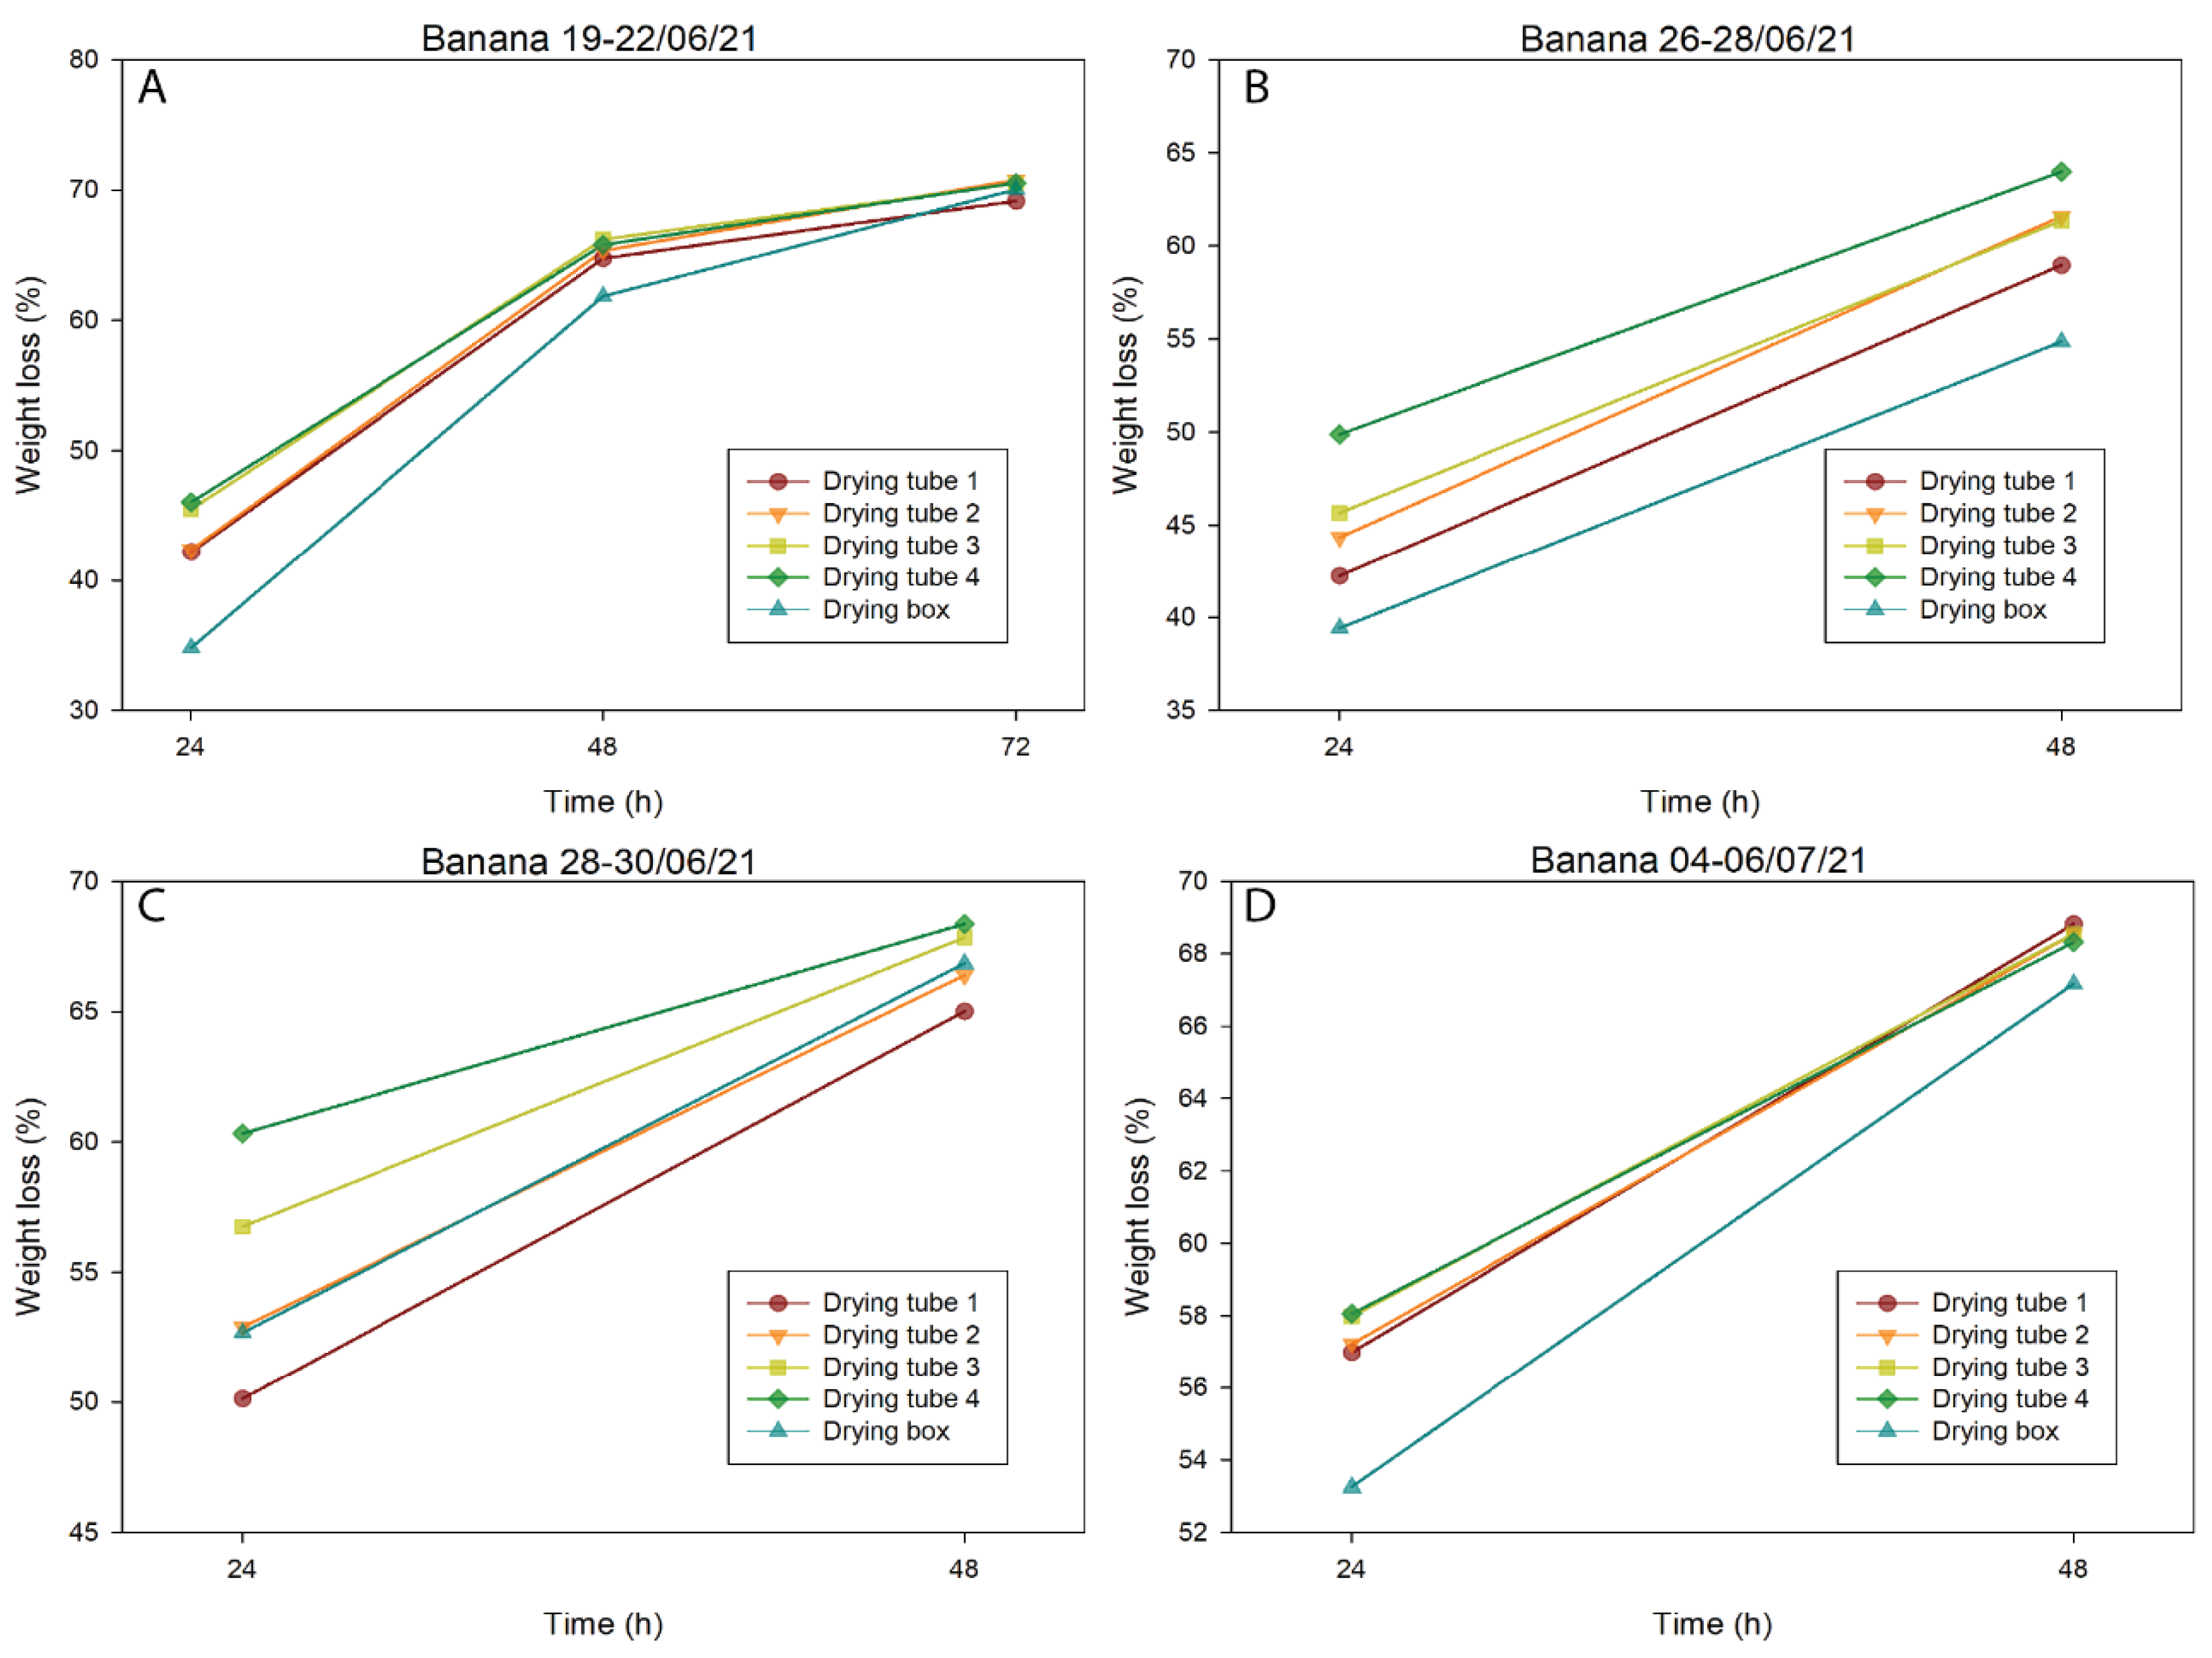
3.1. Drying Rate and Products Characteristics

The drying process was repeated four times for 28 days. In each test, the five samples were placed in each drying tube and four in the control drying box. The exact periods of each test, the numbering of the samples placed in each tube, as well as the initial moisture content of each banana or potato used in the experiments are presented in Table 3.
As aforementioned, weather conditions were measured every 15 min, and the calculated daily average temperature, relative humidity, and wind speed during the different drying periods are presented in Table 4.

Potato and Banana Drying

In Figure 6, the potato’s drying rates in terms of average weight loss as a percentage of the initial fresh weight are presented for the experimental replications 1–4. In Figure 7, the banana’s drying rates in terms of average weight loss (% of initial fresh weight) are also presented for the same replications. Weights of each sample were taken at the same time on each day of the drying process for each period. The average weight loss was calculated by the weight loss of each sample placed in each tube and the drying box accordingly. The first replication was only 72 h long as the results show a minimal increase in the weight loss of each sample. For the latter three replications, the drying period was set at 48 h as the average weight loss in the last 24 h of the first replication was less than 1.6% and 5.4% for potato and banana, respectively. The average moisture content of the potato and banana samples after the drying process for all replications was between 16.1–18.3% (weight based) and 12.2–14.7% (wb), respectively.

3.2. Drying Tube Performance

To evaluate the performance of each drying tube, Equation (1) will be considered, as well as the experimental measurements of the inlet and outlet temperatures. Considering the temperature measurements in Tubes 1–4 during the experimental periods and the geometrical characteristics of the tubes, the average air flow rates for each period are presented in Table 5.
The air flow in each tube is proving the difference in the drying rate as the more intense the air movement the more efficient the drying process. The percentage difference between the air flow in Tube 4, which has the higher air flow rate compared to all other tubes is highlighted in Table 6.
To validate the upper calculations, the air velocity was measured periodically in each tube by placing the wind meter at the inlet of each tube. Using Equation (4), it was possible to transform the velocity values to air flow rates, also considering the air density and cross-sectional area of the tubes.

4. Discussion

4.1. Drying Performance

Time is an important factor for the efficiency and the economic viability of the drying industry, so results from the first 24 h of the drying procedure are mainly discussed and analysed below. All the tubes had a better drying efficiency in comparison with the drying box for the potato samples. Tube 4 had the greater drying efficiency in the first 24 h of potato drying in terms of weight loss for all replications. Tube 3 was second in potato drying efficiency, and together with Tube 4, they were made from the same material and had the same dimensions, with the only difference being that Tube 4 was painted black. Being black and exposed to direct sunlight, Tube 4 had achieved higher temperatures than the other three tubes, which most likely increased the air flow rate inside the tube by the solar chimney effect. However, statistical analysis (Supplementary Material) showed for all replications that there was no statistical significance between the drying efficiency of Tubes 3 and 4 after 24 h of potato drying. Furthermore, Tube 1 and 2 had almost the same efficiency, with Tube 2 being slightly better at drying the potato samples. Probably, the low vertical height of the tube above the ground was not enough to create a strong solar chimney effect, which was verified by low air velocities inside Tubes 1 and 2 (see Section 4.2).
Similar results were observed for the banana samples in terms of tube drying efficiency, with Tube 4 having the best results. For all the tubes at the first 24 h of drying, the best results were obtained during Replication 4. The statistical analysis (supplementary material) showed that there was not a significant difference in the percentages of weight loss of the banana samples in all tubes of Replication 4. However, the efficiency of the drying box was statistically significantly lower in comparison with the tube’s efficiency in the same replication. Moreover, Tubes 3 and 4 had a better efficiency in drying the banana and the potato samples (first 24 h) as in all replications. There was a statistically significant difference with the lower efficiency of the drying box.
At the end of the drying process, all the tubes drying efficiency were closed for the same replication. The best results for potato drying were obtained at the end of Replication 3 and for banana drying from Replication 1. The only difference between these replications, except the environmental conditions, was the duration of each replication. Specifically, Replication 1 was the only one that had a duration of 3 days in contrast with the other replications, which their duration was 2 days. This drying duration (2–3 d) is comparable to other alternative drying methods, such as solar drying, where the drying duration varies between 1 and 3 days depending on the type of solar drier [35].
Weather conditions and especially relative humidity indicated a significant role in the drying performance. During the first 24 h of Replication 4, the daily average relative humidity was between 48.32% and 55.47% (Table 4), which was the lowest among all replications. The low relative humidity of the environment affected the drying efficiency of all tubes that reached an average weight loss for potatoes between 72.45% and 81.05% and for the bananas between 56.98% and 58.05% in the first 24 h of drying for Replication 4. Moreover, the wind speed outside the greenhouse construction probably affected the drying efficiency in combination with relative humidity. Specifically, in Replication 4, which had the higher efficiency of the first 24 h of drying, the average daily wind speed was recorded at its lowest values (0.21–1.97 km/h). During Replications 1 to 3, the average wind speed was between 4.76 and 5.15 km/h (first 24 h). The ambient average temperature was almost 3 °C higher in Replication 2 (Table 4), but drying efficiency was not higher in comparison with Replication 4 for both potatoes and bananas. The lower drying efficiency (first 24 h) of the first three replications was probably due to the high relative humidity of the environment during the drying process.
After drying, both potatoes and bananas changed drastically in color from light yellow to dark yellow and dark brown. In addition, in the potato, we had a slight shrinkage of the shape of the cube, with the middle of its surfaces receding toward their interior, forming slight curves.
The proposed system can be compared with similar methods tested in solar dryers. For banana drying, there are similar cases in the literature that the drying is performed in a direct solar system (greenhouse-type drier) with forced ventilation in Thailand (cases study 1: C.S.1) [22] and in an indirect system (solar collector) also with forced ventilation in Egypt (case study 2: C.S.2) [17]. In C.S.1, the moisture content reduced from 70% to 40% of the total weight in the first 24 h. In C.S.2, this percentage reduction depends on the inclination of the solar drier. In the most favourable position, the moisture content reduced from 85% to almost 20–25% in the first 24 h. Based on Figure 7, in the examined case, the weight loss reduction is about 40–50% in the first 24 h for each tube type, while when the conditions are favourable, this percentage can vary from 50% to 60%. This percentage is mostly moisture, so it seems that the proposed drying method efficiency is comparable to other solar drying methods. However, the disadvantage was that the efficiency was dependent on climatic conditions (temperature and prevailing winds), so the drying rate was not constant. Moreover, it was observed that even if the concentrated air flow inside the tubes leads to a high drying rate, in C.S.1 and C.S.2 systems, larger amounts of banana slices could be dried as the available surface was larger. On the other hand, this drying rate variation and less available space in the examined system is encountered with zero energy consumption. In any case, there are many factors that also need to be considered, such as the weather conditions, initial product characteristics, etc. Beyond the drying process, the initial weight and thickness of the samples should be taken into consideration. In C.S.2 samples, the thickness was between 0.5 and 1 cm, while in the examined system, it was 1 cm of thickness in all cases. The size of the samples is almost the same, so any difference occurs due to the different operations of the compared systems.
Similar findings were also observed for potato drying. The system will be compared with the case of an indirect solar dryer in the region of Algeria (Case study 3: C.S.3), where the drying was performed in a cabinet that air heats up in a collector that was forced to move by the assistance of an artificial ventilation system [21]. A similar system studied in the region of India comprised a specially designed triple-pass solar dryer utilizing the techniques of thermal storage and collector insulation to enhance its efficiency (Case study 4: C.S.4 [23]). In C.S.3, the potato slices reached the desired moisture content (13% wet basis) in almost 3 h, while in C.S.4, the same result was reached in 4.5 h. In the examined system, the potato drying took almost 40–48 h in the most favourable case. However, it should be noticed that the potato samples in this study had a thickness of 1 cm, while in C.S.3 and C.S.4 was 2 mm and 3 mm, respectively. Furthermore, in these case studies, the potato samples were initially blanched, which strongly enhanced the drying process.

4.2. Flow Rate

As can be seen in Figure 6 and Figure 7, the weight loss of the samples observed in Tube 4 is greater compared to all other tubes. In Table 5, where the air flow through the tubes was highlighted, it can be observed that the average air flow through Tube 4 was always higher compared to all other treatments. The height of the tube had a major role in the air flow rate. Tubes 4 and 3 have similar values of flow rate, and the slightly increased flow rate was due to the black color of Tube 4, which led to a higher solar radiation absorption factor. In fact, the dark blue to black color has an absorption factor between 80% and 90%, while the grey to dark grey color has between 40% and 50% [36]. Considering this difference in the absorption factor, it seems that height plays a more crucial role in the flow rate as this percentage difference in the absorption factor is transposed in only 10–15% in the overall temperature difference and, as a result, in the air flow rate. Tubes 1 and 2, which have a lower height, result in a much lower air flow rate compared to Tube 3 and Tube 4. Tube 1, which was covered with a black plastic polyethylene sheet and a 10 cm polyurethane layer, had the poorest performance. Even though the absorption factor of the black color (80–90%) is much higher than the absorption factor of the aluminum (15–30%) [36], the much lower thermal resistance of the aluminum tube compared to the insulated PVC tube [37] led to an increased air flow in Tube 2 since the temperature rise was higher. It seems that the insulation played a negative role in Tube 1. The initial rationale was to apply the insulation to minimize the variation of the temperature inside the tube and achieve a more stable drying process for more time throughout the day. This was achieved in general, with temperature differences being higher than expected during the less warm hours but not as high as expected during the warmer hours. The insulation applied in Tube 1 did not have a positive impact on the temperature rise phenomena. On the contrary, it did not allow the temperature to rise inside Tube 1 at the level that was observed for the rest of the tubes. It was proven that it blocked in a higher grade the heat flux from the environment to Tube 1 compared to the other tubes.
According to Table 6, the difference in the air flow rate presents a more standard variation between Tube 4 and Tube 3 (4–14%) and between Tube 4 and Tube 2 (43–48%) compared to the difference between Tube 4 and Tube 1 where the difference was about 80–100%. The wider difference occurs during the period of 04–06/07. This difference had to do with the fact that Tube 2 was insulated, so it presented a less intense temperature fluctuation compared to the other tubes, so during warmer days, when the flow in the rest of the tubes was sufficiently increased, that did not happen in the case of Tube 1. The differences between Tube 4 and 3 are lower than the absorption percentage of black and gray colors. That means that height plays a more crucial role in the phenomenon and not the color. When comparing the difference between Tubes 2 and 4, the difference was close to 50%. This difference was slightly lower than one of the absorption factors, which means that the high thermal conductivity of the aluminum plays a role in increasing the temperature difference between the inlet and outlet.
When comparing the measured air flow with the calculated, a decreased value of air flow occurs. This was due to losses that might occur inside the tubes and flow phenomena at the area of the tube’s inlet. It seems that in Tubes 1 and 2, where the height is 2.0 m, the differences between the actual values of the flow and the calculated ones were not as wide and the average difference for the examined days and hours ranges between 0.7% and 1.2% for Tube 1 and Tube 2. In the case of the higher tubes, the difference between the calculated and actual flow was between 1.0% and 1.7%. That means that the losses were higher in these tubes because of friction phenomena and flow losses. However, the differences are not significant enough to negate the results that occurred by the calculations.
The air flow achieved in the examined system reached the value of 120 m3/h when choosing the option of the 3 m black drying tube. This value was close to the maximum air flow of C.S.1, which was 116 m3/h. The great advantage of the examined system was that the air flow was achieved without energy consumption as an electrical fan was not present. On the other hand, this air flow rate is strongly dependent on weather conditions. For the other last period of the experiment, the air flow falls below 100 m3/h. This variation affects the drying rate but not significantly, as can be seen in Figure 6 and Figure 7. In C.S 4, where potatoes were dried, the necessary air flow that the system operated on was 0.062 kg/s or almost 185 m3/h. This air flow is higher than the one achieved, so if the examined system was necessary to reach this flow rate level, an additional flow rate of 65 m3/h will be needed. Again, in this case, the advantage is that the air flow is achieved with zero energy consumption, which strongly affects the cost of the final product.

4.3. Economic Analysis

To evaluate the P.B period for the examined system and of an industrial-scale system, the data in Table 7 will be used.
The data described in Table 7 are referred to a 2-day period, so for a total year, the same case is repeated 182 times. So, the P.B period for the prototype as it operated occurs for the banana case is 7.5 years.
For the case of the potato, the necessary data are described in Table 8.
The data described in Table 8 are referred to a 2-day period, so for a total year, the same case is repeated 182 times. So, the P.B period for the prototype as it operated occurs for the potato case is 1.67 years.
It seems that for the case of the potato, the prices of fresh and dried products lead to a more reasonable P.B period even for the prototype. It should be noted that the scope of the examined system was to evaluate the parameters that affect the drying process and not to evaluate if this prototype is economically viable.
If it is assumed that this application is expanded on a commercial scale, the payback period will be reduced. Even if the same tubes are used, the pieces of fresh fruits that can be applied are almost 40 on the available surface. That means that the net profit value per tube and year in the case of bananas will be 2.932 €. So, in this case, the P.B period falls to 0.95 years.
Following the same rationale, the potato net profit value per tube and year will be 104.2 €. In this case, the P.P period is 0.2 years.
On a commercial scale, other costs, such as labor, insurance, tax, etc., should be included so the upper values might be decreased. However, the diameter of the tube could be larger than the one examined in the prototype case. So, more surfaces could be used as drying surfaces. However, this detailed analysis is beyond the scope of this study.
Comparing the upper values with similar case studies such as C.S.1 and C.S.4, it seems that the banana case is far from the payback period of similar small-scale solar dryers (7.5 years to 1.1 years in C.S.1), while for the potato case it seems that the payback period (1.67 years) is close to the one calculated in C.S.4 (2.4 years). In C.S 4, more cost parameters were included, so the P.B period of the examined case study would be probably increased and be closer to the values of C.S.4. In general, the P.B period analysis of the examined system as calculated is indicative in order to have an orientation of the economic viability of the system.

5. Conclusions

In this work, a passive method for agricultural products drying was evaluated. The method was based on the solar chimney effect. Experimental results revealed that the highest the drying tube, the most effective the drying was as the air flow was enhanced. Other factors, such as the material and color of the tube, also had a major role but were not as crucial as the tube’s height. The drying performance of each tube seems to be also influenced by weather conditions. As occurs by the results, during days with low wind velocities, the difference between the drying rate of Tube 4 compared to the rest of the tubes was higher. The advantage of the method was that the drying time was similar to some solar drying methods, with the advantage of products not being exposed directly to solar radiation, which in some cases affects the quality of the final product. The proposed method can be proven as a reliable solution for drying agricultural products in off-grid regions as the energy consumption for its operation is limited or close to zero. It can also be used as an energy conservation method as part of a hybrid drying system, which operates with artificial ventilation when the weather conditions are favorable.
The efficiency of the examined system, in terms of drying rate, seems to be close to solar drying applications (direct or indirect systems). However, the fact that the operation of the system (temperature and air flow) depends on weather conditions makes its operation less stable compared to other solar drying applications where the air flow is performed via artificial systems. In terms of economic viability, a long P.B period is required in the case of bananas, while in the case of potatoes is closer to other applications regarding small-scale applications. The prices of fresh and dried products have a strong effect on the P.B period. Commercial-scale systems have a shorter P.B period than small-scale systems, but a more detailed analysis is required. In the current work, the basic parameters of the system were investigated, such as the air flow inside the drying tubes and the moisture removal of the samples. The performance of the proposed system as a fully developed drying system can be further investigated by examining extensively the characteristics of the drying products. In addition, to check the possibility of extending such an installation on a commercial scale, the use of tubes with larger diameters should be examined (larger drying surface), and the operation using a sophisticated automatic systems that will control the operation of the system (windows opening) when the weather conditions are leading the highest drying rates.

Supplementary Materials

The following supporting information can be downloaded at https://www.mdpi.com/article/10.3390/app122211784/s1, Figure S1: Mean weight loss of the potato samples for the first 24 h of drying for the Drying Tubes (DT) and Drying Box (DB); Figure S2: Mean weight loss of the banana samples for the first 24 h of drying for the Drying Tubes (DT) and Drying Box (DB).

Author Contributions

Conceptualization, V.K.F., Z.D.K. and T.A.K.; methodology, V.K.F., A.A.L. and S.D.K.; investigation, V.K.F., A.A.L. and Z.D.K.; data curation, V.K.F., Z.D.K., A.A.L. and S.D.K.; writing—original draft preparation, V.K.F. and S.D.K.; writing—review and editing, V.K.F., S.D.K. and A.G.M.; visualization, V.K.F. and S.D.K.; supervision, T.A.K. All authors have read and agreed to the published version of the manuscript.

Funding

This research has been co-financed by the European Regional Development Fund of the European Union and Greek national funds through the Operational Program Competitiveness, Entrepreneurship and Innovation, under the call RESEARCH–CREATE–INNOVATE (project code: T1EDK-00100).

Institutional Review Board Statement

Not applicable.

Informed Consent Statement

Not applicable.

Conflicts of Interest

The authors declare no conflict of interest.

Abbreviations

AOpening surface (m2)
AcCross-sectional area of drying tube (m2)
C.eEnergy cost (€)
C.fCost of fresh fruits or vegetables (€)
CiCapital investment cost (€)
C.llabor cost (€)
C.S.1Case study 1
C.S.1Case study 2
gGravity acceleration (m/s2)
I.dIncome by selling drying products (€)
m ˙ Air flow (kg/s)
MtMoisture content (%)
PbPayback period (years)
PEPolyethylene
PnetAnnual net profit value (€)
PVCPolyvinylchloride
TiInternal temperature (°C)
ToEnvironmental temperature (°C)
V ˙ Air flow (m3 × h−1)
uAir velocity (m/s)
WtTotal weight (kg)
WdDry matter weight (kg)
ΔhHeight difference between inlet and outlet (m)
ρAir density (kg/m3)

References

  1. Technical Centre for Agricultural and Rural Co-operation (CTA). Drying Agricultural Produce, Rural Radio Resource Pack; CTA: Wageningen, The Netherlands, 2008. [Google Scholar]
  2. Berk, Z. Chapter 22: Dehydration, In Food Process Engineering and Technology (Third Edition), 3rd ed.; Food Science and Technology, Academic Press: Cambridge, MA, USA, 2018; pp. 513–566. [Google Scholar]
  3. Sagar, V.R.; Suresh Kumar, P. Recent advances in drying and dehydration of fruits and vegetables: A review. J. Food Sci. Technol. 2010, 47, 15–26. [Google Scholar] [CrossRef] [PubMed] [Green Version]
  4. Zlatanović, I.; Komatina, M.; Antonijević, D. Experimental Investigation of the Efficiency of Heat Pump Drying System with Full Air Recirculation. J. Food Process Eng. 2017, 40, e12386. [Google Scholar] [CrossRef]
  5. Hevvelang, K.J.; Reff, T. Calculating Grain Drying Cost; North Dakota State University, AE927: Fargo, ND, USA, 1987. [Google Scholar]
  6. Delgado-Plaza, E.; Peralta-Jaramillo, J.; Quilambaqui, M.; Gonzalez, O.; Reinoso-Tigre, J.; Arevalo, A.; Arancibia, M.; Paucar, M.; Velázquez-Martí, B. Thermal Evaluation of a Hybrid Dryer with Solar and Geothermal Energy for Agroindustry Application. Appl. Sci. 2019, 9, 4079. [Google Scholar] [CrossRef] [Green Version]
  7. Philip, N.; Duraipandi, S.; Sreekumar, A. Techno-economic analysis of greenhouse solar dryer for drying agricultural produce. Renew. Energy 2022, 199, 613–627. [Google Scholar] [CrossRef]
  8. Azouma, Y.O.; Drigalski, L.; Jegla, Z.; Reppich, M.; Turek, V.; Weiß, M. Indirect Convective Solar Drying Process of Pineapples as Part of Circular Economy Strategy. Energies 2019, 12, 2841. [Google Scholar] [CrossRef] [Green Version]
  9. Thanompongchart, P.; Pintana, P.; Tippayawong, N. Thermal performance enhancement in hot air and solar drying of pineapple slices with ultrasonic vibration. Case Stud. Therm. Eng. 2022, 37, 102296. [Google Scholar] [CrossRef]
  10. Al Maiman, S.A.; Albadr, N.A.; Almusallam, I.A.; Al-Saád, M.J.; Alsuliam, S.; Osman, M.A.; Hassan, A.B. The Potential of Exploiting Economical Solar Dryer in Food Preservation: Storability, Physicochemical Properties, and Antioxidant Capacity of Solar-Dried Tomato (Solanum lycopersicum) Fruits. Foods 2021, 10, 734. [Google Scholar] [CrossRef]
  11. Abrol, G.S.; Vaidya, D.; Sharma, A.; Sharma, S. Effect of Solar Drying on Physico-chemical and Antioxidant Properties of Mango, Banana and Papaya. Natl. Acad. Sci. Lett. 2014, 37, 51–57. [Google Scholar] [CrossRef]
  12. Kumar, M.; Sansaniwal, S.K.; Khatak, P. Progress in solar dryers for drying various commodities. Renew. Sustain. Energy Rev. 2016, 55, 346–360. [Google Scholar] [CrossRef]
  13. Gorjian, S.; Hosseingholilou, B.; Jathar, L.D.; Samadi, H.; Samanta, S.; Sagade, A.A.; Kant, K.; Sathyamurthy, R. Recent Advancements in Technical Design and Thermal Performance Enhancement of Solar Greenhouse Dryers. Sustainability 2021, 13, 7025. [Google Scholar] [CrossRef]
  14. Subramani, S.; Sivakumar, D.; Thirumalai, N.; George, M.; Dana, S.S.; Natesan, V.T.; Mary, L.L.G. Energy and Exergy analysis of greenhouse drying of ivy gourd and turkey berry. Therm. Sci. 2000, 24, 645–656. [Google Scholar] [CrossRef] [Green Version]
  15. Altobelli, F.; Condorí, M.; Duran, G.; Martinez, C. Solar dryer efficiency considering the total drying potential. Application of this potential as a resource indicator in north-western Argentina. Sol. Energy 2014, 105, 742–759. [Google Scholar] [CrossRef]
  16. Daş, M.; Alıç, E.; Akpinar, E.K. Numerical and experimental analysis of heat and mass transfer in the drying process of the solar drying system. Eng. Sci. Technol. Int. J. 2021, 24, 236–246. [Google Scholar] [CrossRef]
  17. Hassanain, A.A. Simple Solar Drying System for Banana Fruit. World J. Agric. Sci. 2009, 5, 446–455. [Google Scholar]
  18. Kamarulzaman, A.; Hasanuzzaman, M.; Rahim, N.A. Global advancement of solar drying technologies and its future prospects: A review. Sol. Energy 2021, 221, 559–582. [Google Scholar] [CrossRef]
  19. Chauhan, P.S.; Kumar, A. Heat transfer analysis of north wall insulated greenhouse dryer under natural convection mode. Energy 2017, 118, 1264–1274. [Google Scholar] [CrossRef]
  20. Azaizia, Z.; Kooli, S.; Elkhadraoui, A.; Hamdi, I.; Guizani, A. Investigation of a new solar greenhouse drying system for peppers. Int. J. Hydrog. Energy 2017, 42, 8818–8826. [Google Scholar] [CrossRef]
  21. Chouicha, S.; Boubekri, A.; Mennouche, D.; Berrbeuh, M.H. Solar Drying of Sliced Potatoes. An Experimental Investigation. Energy Procedia 2013, 36, 1276–1285. [Google Scholar] [CrossRef] [Green Version]
  22. Nabnean, S.; Nimnuan, P. Experimental performance of direct forced convection household solar dryer for drying banana. Case Stud. Therm. Eng. 2020, 22, 100787. [Google Scholar] [CrossRef]
  23. Kesavan, S.; Arjunan, T.V.; Vijayan, S. Thermodynamic analysis of a triple-pass solar dryer for drying potato slices. J. Therm. Anal. Calorim. 2019, 136, 159–171. [Google Scholar] [CrossRef]
  24. Camas-Nafate, M.P.; Alvarez-Gutiérrez, P.; Valenzuela-Mondaca, E.; Castillo-Palomera, R.; Perez-Luna, Y.d.C. Improved Agricultural Products Drying Through a Novel Double Collector Solar Device. Sustainability 2019, 11, 2920. [Google Scholar] [CrossRef]
  25. Khalifa, A.J.N.; Al-Dabagh, A.M.; Al-Mehemdi, W.M. An Experimental Study of Vegetable Solar Drying Systems with and without Auxiliary Heat. Int. Sch. Res. Netw. ISRN Renew. Energy 2012, 2012, 789324. [Google Scholar] [CrossRef] [Green Version]
  26. Motevali, A.; Minaei, S.; Khoshtagaza, M.H. Evaluation of energy consumption in different drying methods. Energy Convers. Manag. 2011, 52, 1192–1199. [Google Scholar] [CrossRef]
  27. Ye, L.; El-Mesery, H.S.; Ashfaq, M.M.; Shi, Y.; Zicheng, H.; Alshaer, W. Analysis of energy and specific energy requirements in various drying process of mint leaves. Case Stud. Therm. Eng. 2021, 26, 101113. [Google Scholar] [CrossRef]
  28. Kaveh, M.; Abbaspour-Gilandeh, Y.; Nowacka, M. Comparison of different drying techniques and their carbon emissions in green peas. Chem. Eng. Process.-Process Intensif. 2021, 160, 108274. [Google Scholar] [CrossRef]
  29. Morad, M.; El-Shazly, M.; Wasfy, K.; El-Maghawry, H.A. Thermal analysis and performance evaluation of a solar tunnel greenhouse dryer for drying peppermint plants. Renew Energy 2017, 101, 992–1004. [Google Scholar] [CrossRef]
  30. Nwakuba, N.R.; Asoegwu, S.N.; Nwaigwe, K.N. Energy consumption of agricultural dryers: An overview. Agric. Eng. Int. CIGR J. 2016, 18, 119. [Google Scholar]
  31. Mircea Enachescu Dauthy. FAO Agricultural Services Bulletin No.119; Food and Agriculture Organization of the United Nations: Rome, Italy, 1995. [Google Scholar]
  32. Shyam, S.S.; Arun, S. Mujumdar, Drying of Potato, Ch.27: Sweet Potato and Other Roots, Handbook of Industrial Drying, 3rd ed.; Arun, S.M., Ed.; Taylor and Francis Group, CRC Press: Boca Raton, FL, USA, 2006. [Google Scholar]
  33. Ekechukwu, O.V. Review of solar-energy drying systems I: An overview ofdrying principles and theory. Energy Convers. Manag. 1999, 40, 593–613. [Google Scholar] [CrossRef]
  34. Albright, L.D. Environment Control for Animals and Plants; ASAE: St. Joseph, MI, USA, 1990. [Google Scholar]
  35. Norton, B. Characteristics of different systems for the solar drying of crops. In Solar Drying Technology; Prakash, O., Kumar, A., Eds.; Springer: Berlin/Heidelberg, Germany, 2017. [Google Scholar] [CrossRef]
  36. The Engineering Toolbox Official Website, Absorbed Solar Radiation. Available online: https://www.engineeringtoolbox.com/solar-radiation-absorbed-materials-d_1568.html (accessed on 30 August 2022).
  37. Material Properties Organization Official Website. Thermal Conductivity of Materials. Available online: https://material-properties.org/thermal-conductivity-of-materials/ (accessed on 31 August 2022).
  38. Hellenic Public Power Corporation S.A. Electricity Supply Product Exclusively for Agricultural Activities. Available online: https://www.dei.gr/en/business/electricity/special-categories/agricultural/ (accessed on 29 October 2022).
Figure 1. Greenhouse structure.
Applsci 12 11784 g001
Figure 2. Drying system operation rationale.
Applsci 12 11784 g002
Figure 3. Drying tubes, (a) internal view and (b) external view.
Applsci 12 11784 g003
Figure 4. Drying box schematic view.
Applsci 12 11784 g004
Figure 5. Sensors’ overview and positions.
Applsci 12 11784 g005
Figure 6. Potato’s daily average weight loss (% of initial fresh weight for each drying tube and the drying box for the period of (A) 19/06–22/06/2021, (B) 26/06–28/06/2021, (C) 28/06–30/06/2021, and (D) 04/07–06/07/2021.
Applsci 12 11784 g006
Figure 7. Banana’s daily average weight loss (% of initial fresh weight) for each drying tube and the drying box for the period of (A) 19/06–22/06/2021, (B) 26/06–28/06/2021, (C) 28/06–30/06/2021, and (D) 04/07–06/07/2021.
Applsci 12 11784 g007
Table 1. Greenhouse structure description.
Greenhouse Dimensions
Width4 m
Length8 m
Side height2 m
Ridge height2.4 m
Greenhouse surface32 m2
Greenhouse volume69 m3
Greenhouse materials
Covering materialBlack and white PE covering sheet
Insulation materialPolyurethane layer
Ground coveringBlack PE
Table 2. Description of drying tubes.
Drying TubeMaterialDimensions
1PVC pipe covered with
insulating material and black
polyethylene sheet
Height: 2 m
Diameter: 125 mm
Cross-sectional area: 0.0122 m2
2Aluminium pipeHeight: 2 m
Diameter: 125 mm
Cross-sectional area: 0.0122 m2
3PVC pipeHeight: 3 m
Diameter: 125 mm
Cross-sectional area: 0.0122 m2
4PVC pipe painted black Height: 3 m
Diameter: 125 mm
Cross-sectional area: 0.0122 m2
Table 3. Brief description of the experimental period and sample characteristics.
Drying
Replications
Experimental PeriodInitial Moisture Content of SamplesSamples Initial Weight (g)
119/06/2021–22/06/2021Potato72.60% ± 2.23% *7.80 ± 0.56 *
Banana76.62% ± 0.40%7.61 ± 0.59
226/06/2021–28/06/2021Potato79.99% ± 1.84%10.93 ± 1.32
Banana76.62% ± 0.40%7.21 ± 0.86
328/06/2021–30/06/2021Potato83.96% ± 1.44%6.39 ± 0.58
Banana74.70% ± 0.33%6.19 ± 0.82
404/07/2021–06/07/2021Potato85.27% ± 1.70%7.09 ± 0.57
Banana75.32% ± 0.79%6.25 ± 0.40
*: standard deviation.
Table 4. Daily average of the temperature, relative humidity, and wind speed (9 m above the ground) of the environment outside of the greenhouse during the experimental period.
Drying
Replication
DateAverage
Temperature (°C)
Average Relative Humidity (%)Average Wind Speed (km/h)
119/06/2126.565.105.12
20/06/2125.772.124.85
21/06/2125.375.423.05
22/06/2126.874.574.53
226/06/2130.261.235.15
27/06/2129.266.155.08
28/06/2129.469.484.89
328/06/2129.568.964.76
29/06/2129.169.575.15
30/06/2128.870.055.28
404/07/2127.448.321.94
05/07/2127.055.470.21
06/07/2129.653.010.20
Table 5. Air flow rate in m3/h for each tube and each experimental period.
PeriodTube 1Tube 2Tube 3Tube 4
19/06/2021–22/06/202153.5775.0197.61106.93
26/06/2021–28/06/202163.6083.00106.65120.64
28/06/2021–30/06/202162.9978.41109.87114.21
04/07/2021–06/07/202150.1565.6584.6797.37
Table 6. Air flow rate percentage difference between Tube 4 and each of the rest of the tubes.
PeriodTube 1Tube 2Tube 3
19/06/2021–22/06/2021100%43%10%
26/06/2021–28/06/202199%45%13%
28/06/2021–30/06/202181%46%4%
04/07/2021–06/07/202194%48%15%
Table 7. Parameters for the P.B period of banana drying for the prototype examined case study.
Cost/Income ParameterValueDetails
C.i3.00 €/m main tube
1.60 €/90° tees
(These prices are chosen from suppliers in the Greek market)
The total length of the tube is 5 m, so the total cost is 15.00 €. Three 90° tees of 1.60 € each cost 4.80 €. So, the total cost of the tube is 19.80 €. Black coating and labor cost leads to almost a final cost of 21.80 € per tube
C.f1.40 €/kg
(These prices are chosen from suppliers in the Greek market)
The tube includes 5 pieces of banana of almost 7.5 g. So, the total weight is 37.5 g. The cost is 0.0525 €
C.e0.15 €/kWh -price for agricultural electricity supply [38]The only energy consumption is for opening the side window during the early morning hours. This process lasts seconds, so the energy consumption is almost zero
I.d14.0 €/kg
(These prices are chosen from suppliers in the Greek market)
The tube includes 5 pieces of banana of almost 7.5 g- so the weight of the drying product is 0.975 g per piece. The final weight is 5 × 0.975 = 4.875 g. So, the income is 0.06825 €
Table 8. Caption. Parameters for the P.B period of potato drying for the prototype examined case study.
Cost/Income ParameterValueDetails
C.i3.50 €/m main tube
1.60 €/90° tees
(These prices are chosen from suppliers in the Greek market)
The total length of the tube is 5 m, so the total cost is 15.00 €. Three 90° tees of 1.60 € each cost 4.80 €. So, the total cost of the tube is 19.80 €. Black coating and labor cost leads to almost a final cost of 21.80 € per tube
C.f1.09 €/kg
(These prices are chosen from suppliers in the Greek market)
The tube includes 5 pieces of potato of almost 8.0 g. So, the total weight is 40 g. The cost is 0.0436 €
C.e0.15 €/kWh -price for agricultural electricity supply [38]The only energy consumption is for opening the side window during the early morning hours. This process lasts seconds, so the energy consumption is almost zero
I.d17.0 €/kg
(These prices are chosen from suppliers in the Greek market)
The tube includes 5 pieces of potato of almost 8.0 g- so the weight of the drying product is 1.36 g per piece. The final weight is 5 × 1.36 = 6.8 g. So, the income is 0.1156 €
Publisher’s Note: MDPI stays neutral with regard to jurisdictional claims in published maps and institutional affiliations.

