Article

Stability of MSW Landfill Slopes Reinforced with Geogrids

Department of Civil Engineering, Dicle University, 21280 Diyarbakir, Turkey
*
Author to whom correspondence should be addressed.
Appl. Sci. 2022, 12(22), 11866; https://doi.org/10.3390/app122211866
Submission received: 31 October 2022 / Revised: 13 November 2022 / Accepted: 14 November 2022 / Published: 21 November 2022

Abstract

:
Slope stability is one of the main problems encountered in MSW (municipality solid waste) landfill designs. Slope stability calculations become difficult due to the heterogeneous structure of MSW landfills and leachate, and therefore, slope geometries are formed by choosing low slope angles for safe designs. This causes less waste to be stored on site. This study presents slope stability analyses of MSW landfills. Numerical analyses were performed using finite element and limit equilibrium methods. The stability behavior of landfill slopes was analyzed for both unreinforced and geogrid-reinforced conditions in order to investigate the effects of shear strength parameters, the unit weight of soil waste, and material model parameters. It has been seen that the stability of landfill slopes can be increased significantly using geogrid materials. When the optimum geogrid parameters obtained from the numerical analysis results are used, it has been observed that the safety factor of the slope can be increased by up to approximately two times. Slopes in landfills reinforced with geogrid reinforcements can be formed steeper, allowing more solid waste to be stored. Considering the high initial investment cost of MSW landfills, it has been concluded that storing more solid waste with the use of geogrids will provide significant economic gains. Based on the results, the optimum values of geogrid parameters were determined and suggested for maximum reinforcing effects in MSW landfill slopes.

1. Introduction

Today, rapid population growth, urbanization, industrialization, and technological developments have revealed the problem of pollution. Solid waste, which constitutes a large part of the pollution problem, is a situation that needs to be managed and improved in all countries of the world. Solid wastes have polluted and continue to pollute ground and underground waters. After the damage caused by ground and groundwater pollution became visible, the importance of this type of pollution was understood, and laws and regulations were prepared to eliminate the pollution that had occurred. If waste is not stored in a way that causes minimum damage to the environment, it is inevitable that negative effects will occur in the future. Since it is not possible to completely destroy waste, the main objective should be to reduce its mass, that is, to reduce its volume and to store it regularly in a way that will allow for reuse with technological developments that may occur in the following years.
Slope stability analyses in MSW landfills are very important both to know how high it can be filled without any movement on the slopes, and to determine the angle of the slopes that will be reconstructed if old or abandoned MSW sites are reused as construction sites.
In general, stability problems on slopes in landfills are similar to movements seen on normal slopes. Due to the non-homogeneous materials and non-uniform distribution in a landfill, movement can be observed on the slopes ranging from surface ruptures to large landslides. Similar to all natural or artificial slopes, the stability of slopes in MSW landfills against slipping and collapse under various loads is analyzed by the limit equilibrium method (LEM). In this method, the equilibrium between resisting and sliding forces is investigated on a known or accepted critical slip surface. In slope stability analyses, a certain factor of safety (FS) is determined, and necessary analyses are made. The FS calculated as a result of these analyses reveals whether the slope is stable against failure or the degree of stability.
With the finite element method (FEM), which is another method for slope stability analysis, slopes can be analyzed under different soil conditions and load combinations. By designing the slopes in two or three dimensions and using the appropriate soil model, realistic stress and displacement values can be obtained. In addition, necessary analyses can be made in cases where the slope is strengthened with different materials. Two approaches are generally used when performing slope stability analyses with FEM. In the first approach, the gravity increase method, the gravitational acceleration is increased until slope failure. In the second approach, the strength reduction method, cohesion and internal friction angles are reduced until slope failure.
There are numerous studies in the literature on the stability of slopes in MSW landfills [1,2,3,4,5,6,7,8]. In these studies, the slope stability analyses were carried out using both conventional LEM and FEM.
Seed et al. [1] analyzed the causes of slope failure at a landfill in California. According to the results obtained from the analyses performed in the study, the FS was determined to be between 0.85 and 1.25 at the failure time.
Eid et al. [2] investigated the stability of MSW landfill slopes. According to the results obtained from laboratory tests, field experiments, and back-calculations, it has been shown that the shear strength parameters for landfills can be considered as 35° and 0–50 kpa for the internal friction angle and cohesion, respectively.
In the study carried out by Koerner and Soong [3], ten landfill failures were discussed. According to the results obtained, numerical analyses for stability calculations depend more on shear strength than other parameters.
Gharabaghi et al. [4] carried out slope stability analyses at two existing solid waste landfills in Brazil. As a result of the study, it was stated that the determination of suitable shear strength parameters and the solid waste composition, grain diameter, degree of deterioration, and moisture content in the field are very important in the analysis.
Chang [5] carried out three-dimensional numerical analyses to model the slope failure occurring in the Kettleman Hills Landfill. It was shown that the internal friction angle and cohesion values obtained as a result of the back-analysis carried out for the post-failure slope and the values obtained by the laboratory experiments were compatible.
Stark et al. [6] investigated the shear strength of MSW landfills by back-analysis of failed waste slopes using laboratory tests and field experiments. Using the results obtained from the study, suggestions were made for modeling the shear strength of landfills in analyses.
Hossain and Haque [7] analyzed the stability of landfill slopes as a function of time and decomposition. In the study, numerical analyses were carried out using FEM and LEM. At the end of the study, they compared the obtained results from the numerical analyses.
In the study carried out by Huvaj-Sarihan and Stark [8], the shear strength parameters of waste landfills were investigated using back-analysis of failed waste slopes. They presented the back analyses of the failed waste slopes in four landfills. Each of the landfill slope failures was reviewed, and the results of the back-analyses were presented. At the end of the study, the obtained and recommended parameters were compared with other studies.
Because the tensile strength of the soils is low, the slopes can be made more stable with materials such as metal reinforcements, geotextiles, or geogrids placed inside the slope. High-strength elements are used in these structures, which are defined as reinforced slopes. While metal strips or reinforcements were used in the first applications, today such materials have been replaced by geosynthetic materials. In slopes that are reinforced to increase stability, a solution is realized by including the geogrid forces in the limit equilibrium or finite element analysis as known forces. Geogrids are high-strength, polymer-structured, geosynthetic materials with sufficient space and different grid structures to ensure interlocking with the soil. In its chemical structure, polyethylene-, polyester-, or polypropylene-type polymers are available. Geogrids have an important role in the reinforcement of soils with their high tensile strength and are often used to reinforce slopes.
Although there are many studies in the literature on the stability of slopes in landfills, investigations on the stability behavior of reinforced landfill slopes are limited. Today, increasing the stability of slopes using geogrid materials has become a routine and standard practice. However, their use for the reinforcement of landfill slopes is rare. The few studies that have been carried out on reinforcing solid waste slopes using geogrids usually include field applications.
Zornberg and Kavazanjian [9] investigated the integrity of geogrid-reinforced landfill slopes subjected to differential settlements and seismic loadings experimentally and numerically. According to the results obtained from the study, it showed that the critical reinforced region corresponding to different loading mechanisms occurred at different elevations within the reinforced soil structure.
Jiang et al. [10] performed finite element analysis to investigate the failure mechanism and FS values of a geotextile-reinforced extended berm in a MSW landfill slope of 45°.
Ke Han et al. [11] performed a one-year field monitoring of a MSW landfill slope reinforced by geogrids. Using the results obtained, suggestions were made for future studies on the subject.
While the reinforcement of MSW landfill slopes using geogrids is available at existing landfills, the interactions between the solid waste material and geogrids have not yet been clearly demonstrated. In particular, studies on field observations of the results obtained by numerical and theoretical studies are quite limited. Subjects such as the long-term behavior of geogrids, the effect of mechanical creep, and the friction between geogrids and MSWs still need to be investigated. Friction characteristics between synthetic materials and geotechnical materials also have an important impact on slope stability. Interface shear behavior of synthetic and geotechnical materials has been studied recently due to slope failures in landfills.
Bergado et al. [12] investigated the properties of different interfaces in landfills using laboratory experiments.
In the study by Kim and Frost [13], the geotextile/geomembrane interfacial shear behavior was investigated experimentally and generalized interfacial shear mechanisms were proposed based on the results obtained.
Cen et al. [14] performed a study on the cyclic interface shear between geomembranes and sandy gravel. At the end of the study, a new empirical correlation was suggested.
In the experimental study carried out by Shi et al. [15], shear tests were performed at the geomembrane/geotextile and geomembrane/geocomposite/sand liner interfaces where the normal stress changes at different shear stages. According to the results obtained from the study, it was stated that the effects of normal stress changes on the lining interface strength should be considered in the slope stability analysis of MSW landfills.
A study was carried out experimentally investigating the interface creep behavior between geomembranes and geotextiles in the lining system by Lu et al. [16]. Conventional direct shear tests were conducted using different combinations of geomembranes and geotextiles. It was recommended to conduct longer-term geomembrane–geotextile interface creep tests in order to understand the interface creep mechanism in depth.
This study presents the slope stability analysis of MSW landfills carried out using finite element and limit equilibrium methods. Finite element analyses were performed using PLAXIS [17], and limit equilibrium analyses were performed using the SLOPE/W [18] computer programs. The stability behavior of the landfill slopes was analyzed for both unreinforced and geogrid-reinforced conditions. A landfill slope model was selected for the analysis, and model parameters were obtained from the studies available in the literature. In this study, the optimum value of the vertical distance between the geogrid reinforcements and the number of reinforcements, which increase the FS of the MSW slope, are obtained, and the necessary recommendations for practical applications are presented.

2. Materials and Methods

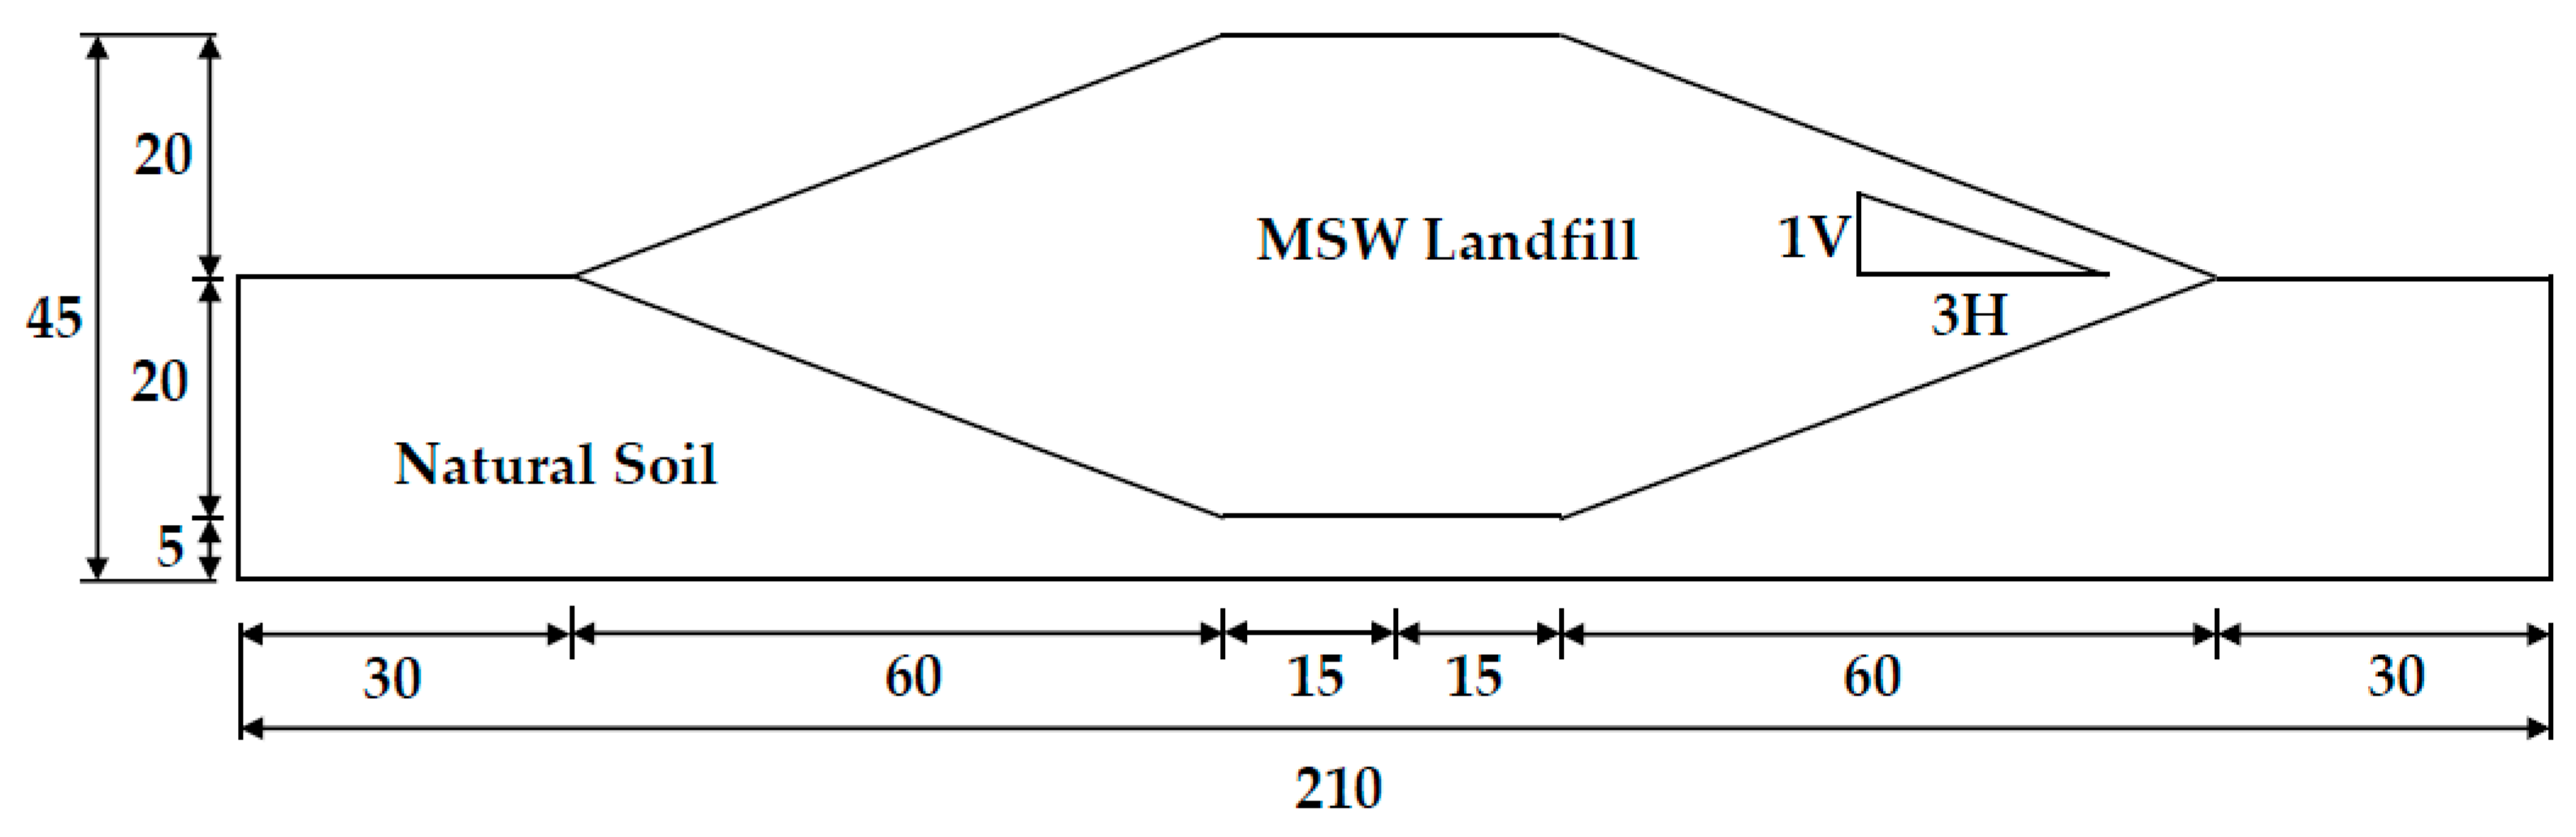
For the slope stability analyses in landfills, a model with a width of 210 m and a height of 45 m was created (Figure 1). The geometry was reconstructed for different slope angles in the analyses. The symmetry of the geometric model was used for convenience in the analyses. Slope stability analyses of the model were performed with PLAXIS using FEM, and SLOPE/W using LEM. Unreinforced and reinforced analysis results obtained by both methods were compared.
In the analysis, the waste material and soil were modeled with the Mohr–Coulomb model (MCM). The input parameters were obtained from previous experimental studies. The most important issue in the slope stability analysis of MSW landfills is the realistic estimation of the parameters of the waste material including unit weight, internal friction angle, and cohesion. Due to the natural properties of solid waste materials, such as moisture content, degree of degradation, waste composition, and particle size, it is very difficult to determine these parameters in the laboratory. When the existing studies in the literature are examined, it is seen that the mentioned shear strength parameters and unit weight values are in a wide range.
Many investigations have been performed on the geotechnical properties of landfills to examine the settlement and stability of landfills [19,20,21,22,23,24].
Average in-place unit weights, γ, used by owners and operators for landfill capacity estimates are typically in the range of 8.6 to 10.2 kN/m3. Values in this range have also been used for seismic analyses by [25,26,27]. Fassett et al. [28], in their study, presented a summary of the unit weight values obtained in situ by various researchers for MSW. Accordingly, the unit weight values were between 2.9 kN/m3 to 14.4 kN/m3.
The shear strength values of the MSW landfills presented in the studies carried out on the subject are very variable, with internal friction angles, ϕ, as low as 10 degrees and as high as 53 degrees and cohesion values, c, varying from 0 to 67 kPa [29].
In the study performed by Sharma et al. [30] in an existing MSW landfill, Poisson’s ratio value was obtained as 0.49. Karimpour-Fard and Machado [31] carried out an experimental study to estimate the deformation properties of MSW materials. The results obtained from this study show that Poisson’s ratio value varies between 0.35 and 0.49.
The modulus of elasticity, E, of waste materials is not constant and depends on the average stress [28,32]. Therefore, the modulus of elasticity value is in a wide range.
In the stability analysis, the material parameters presented in Table 1, obtained as a result of the literature study, were used for the modeling of the solid waste material and soil.
The geometric model of the MSW landfill was created in the PLAXIS computer program as two-dimensional. Slope analyses were performed according to plane strain conditions. In the modeling, triangular elements with 15 nodes were chosen to obtain more accurate and sensitive results.
In the analyses, the standard boundary conditions available in the PLAXIS program were selected. Vertical and horizontal displacements at the base of the geometric model (ux = 0, uy = 0) were assumed to be zero, while on the vertical side of the slope, only vertical displacements were taken into account (ux = 0, uy = free).
In the analyses, geogrid elements were used to model the geogrid reinforcement layers. The EA value of 1100 kN/m was entered into the program as the material property of the geogrid reinforcement layers.
While creating the finite element mesh, the most suitable mesh structure that gives the most accurate result in the optimum time where the analysis results do not change much was investigated. For this purpose, the effect of the mesh structure on the FS was investigated by performing analyses for medium, fine, and very fine mesh. As a result of the analyses carried out, no significant change was observed in the results in the case of the fine mesh, and the model was created in a fine mesh structure.
In the unreinforced case, the analyses were carried out using two phases. In the first phase, the initial stresses due to the soil self-weight were created, and in the second stage, the phi-c reduction analysis was performed. In the reinforced case, the geogrid reinforcement was activated, and the analyses were carried out. For the finite element analysis, the slope geometries considered in the reinforced and unreinforced conditions are shown in Figure 2.
In this study, limit equilibrium analyses were performed using the SLOPE/W computer program. With the LEM, the behavior of the soils was modeled based on certain assumptions, and geotechnical problems could be solved according to these assumptions. In this method, assuming that the slip circle was formed on a certain surface, FS values were obtained by comparing the forces sliding along this surface with the forces resisting the slip. With these analysis methods, the static equilibrium equation of the slope was attempted to be obtained using the Mohr–Coulomb stress criteria. There are three main types of limit equilibrium analyses used in slope stability calculations. These are: the slice method, the wedge method, and the infinite slope method. The most widely used method in slope stability analysis is the slice method. The slice methods used in practice are based on dividing the slip surface into sufficient vertical slices. Many approaches have been developed using the slice method, such as those by Bishop [33], Janbu [34], Spencer [35], and Morgenstern and Price [36]. Although there are some differences in practice between these methods, the common feature is the investigation of the slip mass equilibrium on a known or accepted critical slip surface. The slice method was used in the analyses performed in this study. The Bishop and half-sine function methods were selected in the calculations. 
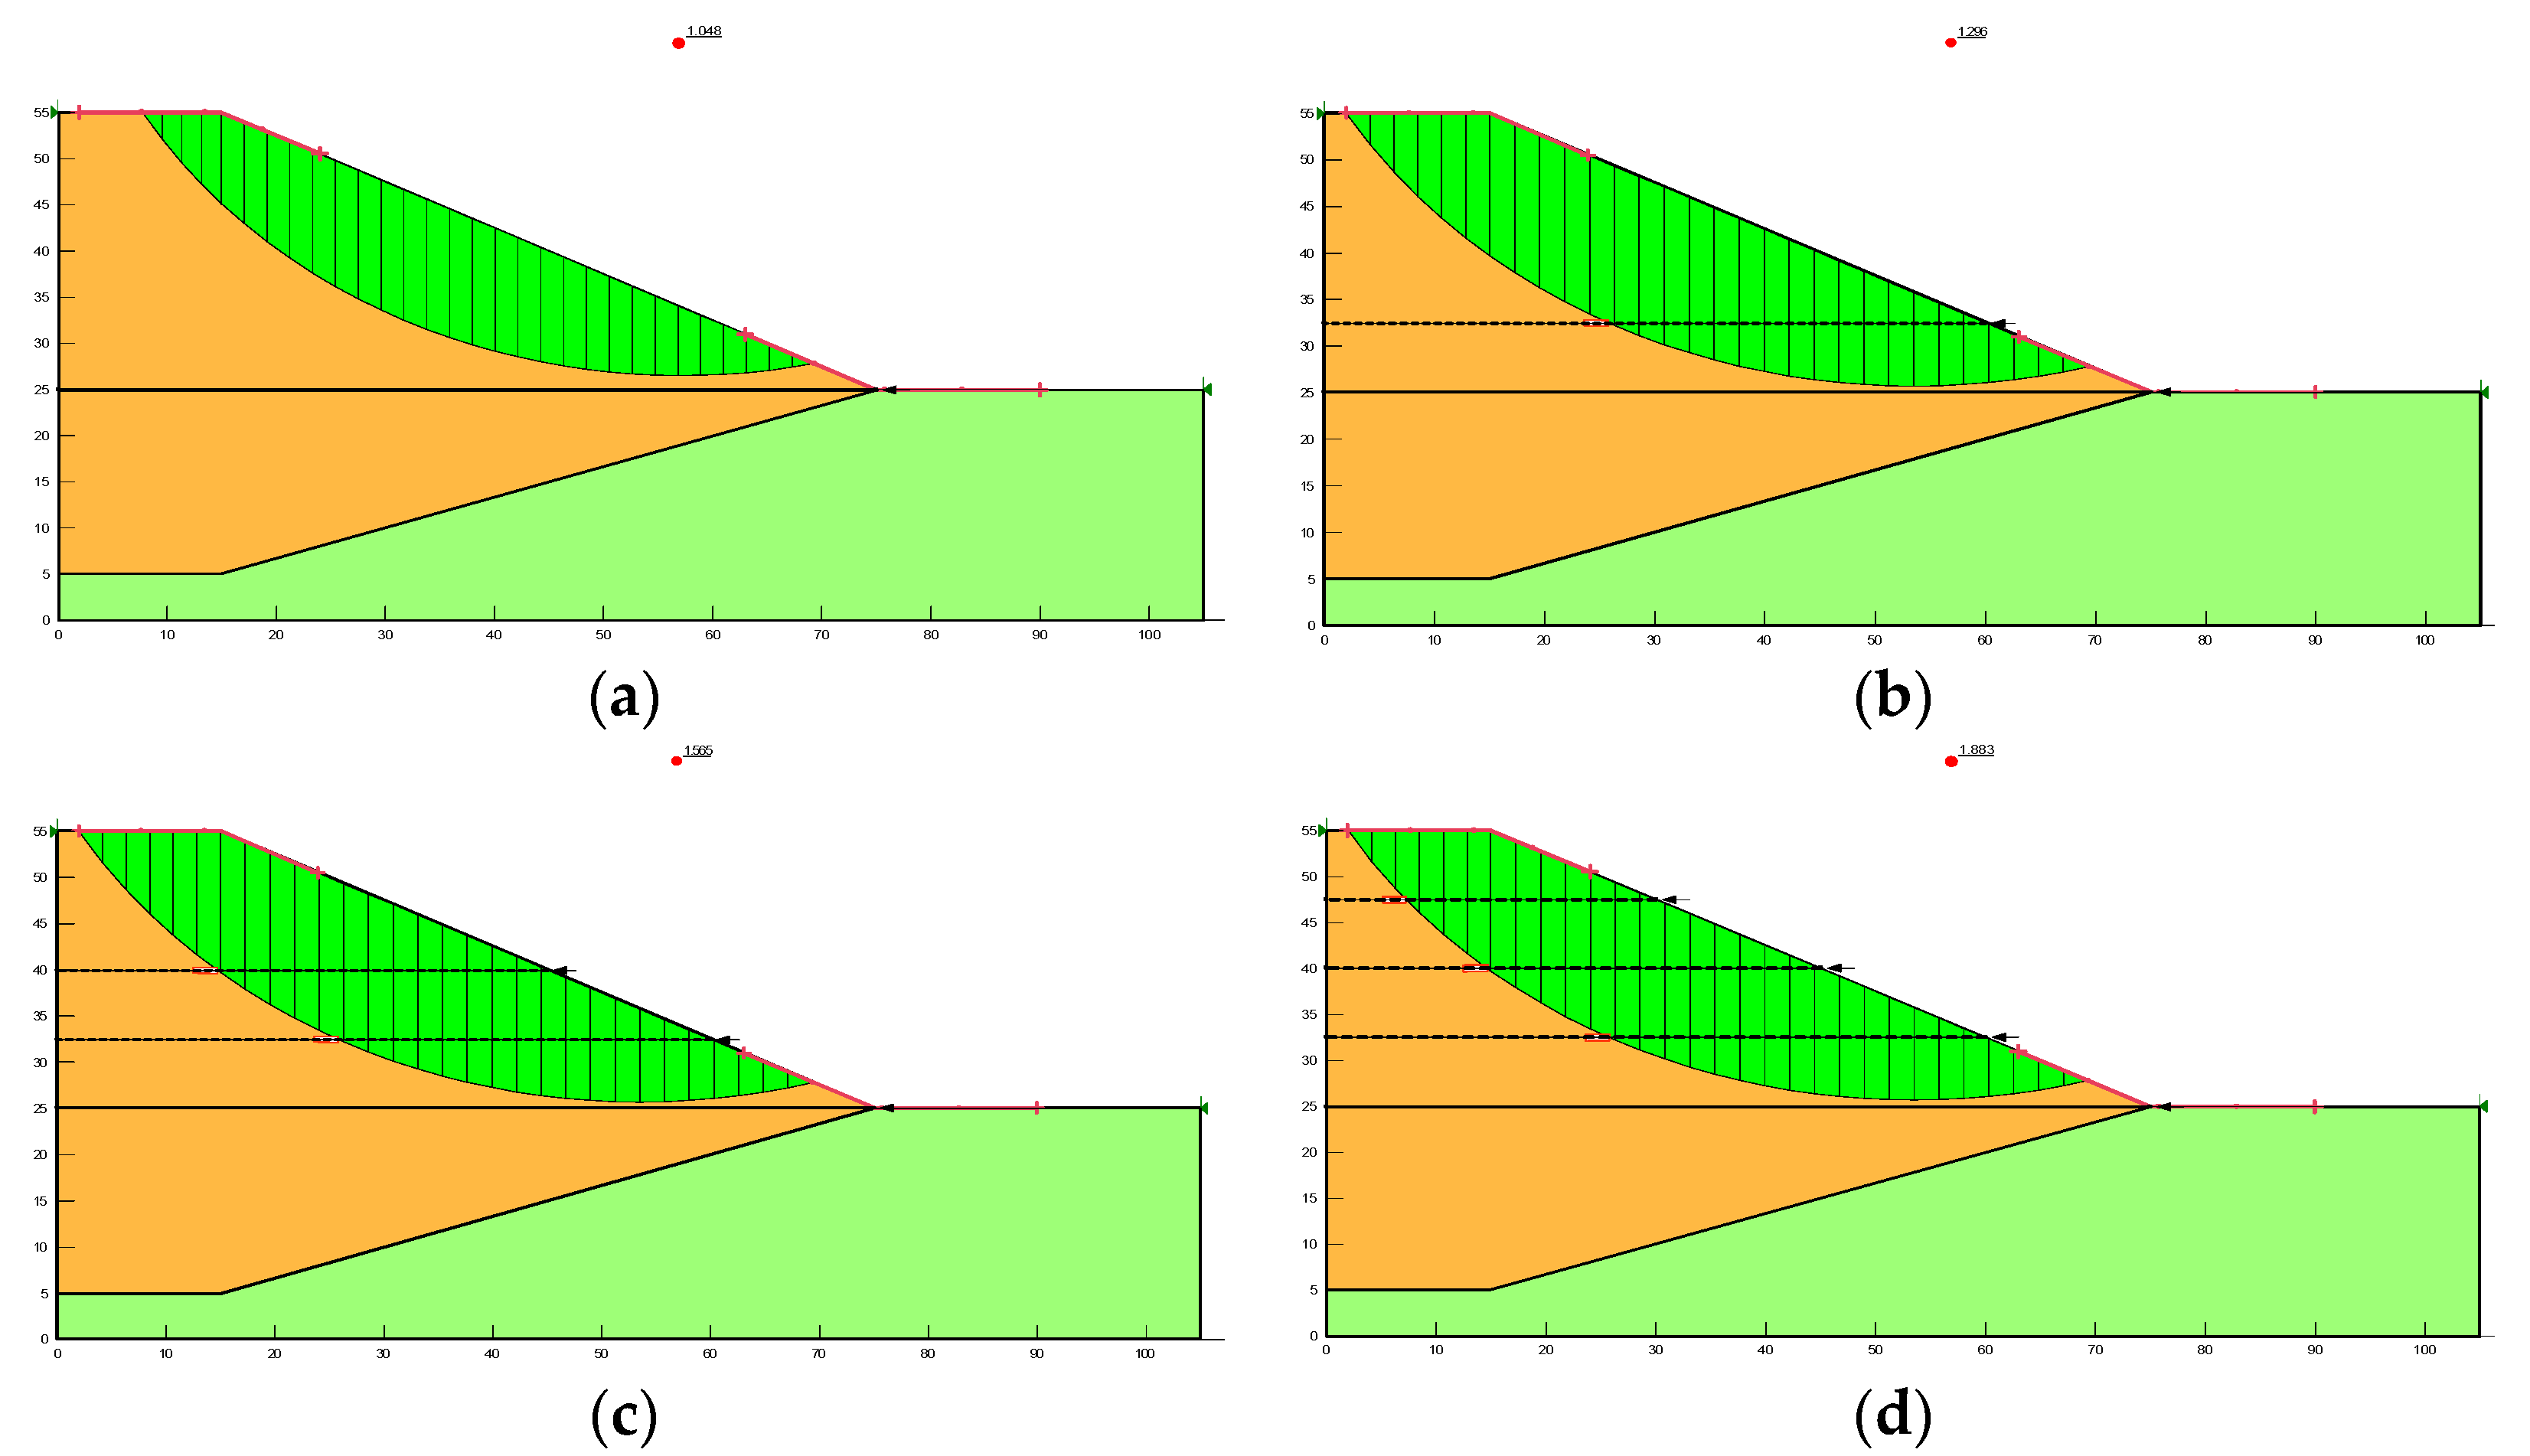
Figure 3 shows the geometry of the unreinforced and reinforced models considered in the limit equilibrium analysis.
The Mohr–Coulomb model (MCM) was used as the material model in the analysis. The values in Table 1 were used for the material parameters required in this model. After the material properties were entered into the program, the slip surface model was defined. There are two types of failures in the SLOPE/W program: circular and block slip. The circular slip surface model was used in the slope analysis. Although there are many methods to determine the circular slip surface, the entry and exit method was used. The reason for using this method was that the boundaries of the slip surface could be determined clearly.

3. Results and Discussion

In this section, the stability analysis results of the unreinforced and reinforced MSW slopes are presented. Analyses were carried out using finite element and limit equilibrium methods. FSs were obtained using the strength reduction method in the FEM analysis and the Bishop method in the LEM analysis.

3.1. Unreinforced Analyses

In the unreinforced analyses, stability calculations were performed for different cohesion, internal friction angle, unit weight, and slope angle values to investigate the effects of these parameters on the stability of the MSW landfill. While the parameter whose effect will be examined in the analyses is variable, all other parameters are taken as constant.

3.1.1. Effect of Cohesion

In order to investigate the effect of cohesion (c) on slope stability, analyses were carried out for different cohesion values of the MSW landfill. In the analyses, the other parameters were chosen as ϕ = 15°; ψ = 0°; E = 6500 kN/m2; ν = 0.45; γ = 9 kN/m3; and β = 18.43° (1V/3H). The FS values for different cohesion values obtained as a result of the FEM and LEM analyses are shown in Table 2 and Figure 4.
From the analyses, it was seen that the FS of the slope increased with increasing c values, as expected. When Figure 4 is examined, it can be said that the FS of the slope increases approximately linearly with the increase in the cohesion value. The increase observed in the FS value is due to the increase in the forces resisting the shear stresses occurring in the MSW landfill due to the increase in the cohesion. In addition, it was observed that the FS values obtained by FEM and LEM are close to each other.

3.1.2. Effect of the Internal Friction Angle

The effect of the internal friction angle (ϕ) on slope stability analyzed for different ϕ values of the MSW landfill. In the analyses, the other parameters were chosen as c = 10 kPa, ψ = 0°, E = 6500 kN/m2, ν = 0.45, γ = 9 kN/m3, and β = 18.43° (1V/3H). The FS values for different internal friction angle values obtained as a result of the FEM and LEM analyses can be seen in Table 3 and Figure 5.
From the analyses, it was observed that the FS of the slope increased with increasing ϕ values, as expected. When Figure 5 is examined, it is clear that the FS of the slope increases approximately linearly with the increase in the ϕ value. Although the reason for the increase in the FS value is similar to the cohesion effect, higher FS values are obtained due to the increase in ϕ. In addition, it is seen that the FS values obtained by LEM are slightly higher than the values obtained by FEM.

3.1.3. Effect of Unit Weight

Analyses were carried out for different unit weight values of the MSW landfill to investigate the effect of unit weight (γ) on slope stability. In the analyses, the other parameters were chosen as c = 10 kPa, ψ = 0°, E = 6500 kN/m2, ν = 0.45, ϕ = 15°, and β = 18.43° (1V/3H). Table 4 and Figure 6 show the FS values for different internal friction angle values obtained as a result of the FEM and LEM analyses.
From the analysis results, it can be seen that with the increase in the γ value, the FS of the slope decreased. It is thought that this linear decrease is due to the increase in the shear stresses in the MSW landfill. In addition, it is seen that the FS values obtained by LEM are higher by about 2% than the values obtained by FEM.

3.1.4. Effect of Slope Angle

Analyses were performed for different slope angle values (β = 45°–26.56°–18.43°–14.04°–11.31°) In the analysis, the other parameters were selected as c = 10 kPa, ψ = 0°, E = 6500 kN/m2, ν = 0.45, ϕ = 15°, and γ = 9 kN/m3. Table 5 and Figure 7 present the FS values for different slope angle values obtained as a result of the FEM and LEM analyses.
As seen from Table 5 and Figure 7, as expected, the FS values decrease with the increasing slope angle. It is clear that the FS values obtained by FEM and LEM are very close to each other.
Slope geometry is one of the major parameters affecting the stability calculations. The FS of the slope decreases depending on the increase in height and slope angle. Increasing the slope angle can trigger movement in the slope mass. The slope may become too steep to balance the shear stress, and as a result, the angle of repose can be exceeded, and mass movement may occur. Landfill designers often choose safe slopes such as 1V/3H and 1V/4H to design the slopes in conventional landfills. In other words, stability problems that may occur in MSW slopes due to the increase in moisture content and decrease in interlocking properties are eliminated by designing low-angle slopes. However, low-angle slopes are not economical because of the reduction in storage capacity [37]. Due to the uncertainties in the prediction of parameters, it is recommended that the FS determined to ensure long-term stability should be between 1.5–3.0 [38].
When the analysis results are examined, it is seen that the necessary FS values cannot be obtained in cases where the slope is 1V/1H and 1V/2H.
When the FS values obtained as a result of the FEM and LEM analyses are compared, it is seen that the FS obtained with LEM are generally higher. There are many studies in the literature that perform slope stability analysis using LEM and FEM and compare the results [39,40,41,42,43,44].
When the results obtained from these studies are examined, it is seen that although the FS values obtained by LEM and FEM analyses are in general agreement, there are differences of up to 10%. According to Rotaru et al. [44], although there are acceptable differences between the FS values obtained from the LEM and FEM analyses, this reveals a fundamental difference in the principles of approach between the analyses. While LEM is based on a static force or moment equilibrium analysis, the formulations used in FEM depend on the stress–strain relationship. Due to the differences in the assumptions and approaches made in the analysis methods, there are differences between the FS values obtained from the LEM and FEM analyses.
The failure planes obtained as a result of the FEM and LEM analyses are shown in Figure 8 and Figure 9, respectively. In FEM analysis, failure planes are shown as shear strain increments. As can be seen from Figure 8 and Figure 9, the failure planes contact the toe of the slopes in the analyses performed without reinforcements at different slope angles.

3.2. Reinforced Analyses

The results of the FEM analysis of the behavior of geogrid-reinforced solid waste landfills are presented. By using the optimum number of geogrids obtained as a result of the FEM analysis, LEM analyses were performed, and the results were compared. In addition, FEM analyses were carried out to obtain the relation of the FS of the MSW landfill slope reinforced with the optimum number of reinforcements depending on the parameters of c, ϕ, γ, and the material model.

3.2.1. Effect of Geogrid Number

In the analyses, the effect of placing geogrid reinforcements at various spacings on the slope stability was investigated by using the PLAXIS computer program. For this purpose, as a result of the analyses carried out previously without reinforcements, a solid waste landfill with a slope angle of β = 26.56° whose safety number is FS = 0.99, that is, 1V/2H slope, H = 30 m high, was considered, and analyses were carried out by placing geogrid reinforcements at different spacings. In the analyses, other the parameters were the internal friction angle, ϕ = 15°; cohesion, c = 10 kN/m2; dilatation angle, ψ = 0°; modulus of elasticity, E = 6500 kN/m2; Poisson’s ratio, ν = 0.45; and the unit volume weight, γ = 9 kN/m3. Geogrid spacings (h) were taken as certain ratios of the slope height (H) and made dimensionless in terms of H/h. In the analyses, an EA value of 1100 kN/m was entered into the program as the material property of the geogrid reinforcement layers.
In the FEM analysis, while determining the initial stresses of the landfill slope, first, the gravitational force was applied since the MSW landfill slope is not horizontal. In the second stage, geogrids were activated, and in the third stage, stability analyses were performed with the phi-c reduction method, and FS values were obtained.
A numerical analysis set was carried out to determine the effects of the geogrid reinforcement on the slope stability. The Analysis was carried out in seven sets. Table 6 summarizes the analysis sets with the constant and variable parameters used.
Figure 10 and Table 7 present the FS values obtained with different geogrid numbers.
When the results obtained from the reinforced analyses are evaluated, it is seen that the stability of the slope can be increased significantly depending on the geogrid reinforcement spacing and the geogrid number values in the case of using geogrid reinforcements. According to Table 7 and Figure 10, as the reinforcement spacing decreases, in other words, as the number of reinforcements increases, higher FS values are obtained. However, since the FS value is generally desired to be higher than 1.50 (FS > 1.50) in slope stability analyses, it has been observed that this criterion cannot be provided if the geogrid reinforcement spacing is 10 m (N = 3) or more. According to the results, the safety factor value (FS = 0.99), which is less than 1.50 in the unreinforced condition, becomes greater than 1.50 (FS = 1.84) when N = 4 geogrid reinforcements are placed in the MSW landfill slope. Although the FS > 1.50 criterion is provided for other reinforcement spacings (H/h = 30, H/h = 15, H/h = 10, H/h = 6 and H/h = 5), it is seen that the H/h = 4 combination is more suitable for an economical solution in the model considered.
Analyses were performed to investigate the effect of the weight of the geogrids on the FS of the MSW landfill slope. In the analyses, factory values were used for the geogrid weight, and the weight was applied to the slope as a surcharge load. As a result of the analyses, no change was observed in the FS of the slope in the case of the N = 4 geogrid, while a decrease of approximately 2% in the FS of the slope was observed in the analyses performed for the N = 30 geogrid.
The failure plane occurring in the MSW landfill slope can be obtained by plotting the shear strain increment. In the unreinforced condition, the failure plane is quite distinct and extends to the toe region of the slope (Figure 11a). The failure plane moved away from the toe region due to the increase in the number of geogrids placed in the slope (Figure 11b–e). This is due to the high tensile strength of the geogrid reinforcements [45]. As the number of geogrids placed in the slope increases, in other words, as the vertical distance between the geogrids decreases, the slip circle is formed in a thinner region.
When the studies on the reinforcement of the MSW landfill slope using geogrids were examined, it was seen that a similar behavior was obtained. In the study carried out by Hettiarachchi and Ge [37], it was stated that the FS of the slope could be increased by 1.63 times if five geogrids were placed in the 25 m high 1V/3H MSW landfill slope.
Table 8 and Figure 12 present the FS changes depending on the number of geogrids in the case of the N = 4 geogrid in the MSW landfill with a 1V/2H slope.
Table 8 and Figure 12 show that the FS value can be increased up to FS = 1.84 by placing the geogrid reinforcements in the MSW landfill slope with h = 7.5 m spacings. In this case, the FS value increases by approximately 1.86 times compared to the unreinforced condition.
By using the optimum number of geogrids (N = 4) obtained by the finite element method, limit equilibrium analyses were carried out with the SLOPE/W program. In the analyses, other parameters were ϕ = 15°; c = 10 kN/m2; ψ = 0°; E = 6500 kN/m2; ν = 0.45; γ =9 kN/m3; and β = 26.56°.
In the case where the geogrid reinforcement layers are placed in the MSW landfill slope as h = 7.5 m, the FS values obtained for N = 4 geogrids are shown in Table 9, and the geogrid number (N)–safety number (FS) relationship is shown in Figure 13.
From Table 9 and Figure 13, it is seen that the FS value can be increased up to FS = 1.89 by placing geogrid reinforcements at 7.5 m spacings in the MSW landfill slope. In this case, the FS value increases by approximately 1.85 times compared to the unreinforced condition (FS = 1.02). Figure 14 presents the slip surfaces obtained from the LEM analysis.
Figure 15 presents the factor of safety–number of geogrids relationship obtained as a result of the FEM and LEM analyses for N = 4 geogrids. It can be seen from Figure 15 that for geogrid-reinforced MSW landfill slopes, the FS values obtained by LEM are greater than those obtained by FEM. It is thought that the reason for this is due to some limitations in some local stresses occurring at the top and toe of the slope in limit equilibrium methods. In this study, the FS values obtained by LEM are on average 2% greater for the unreinforced case and 8% for the reinforced case than those obtained by FEM.

3.2.2. Effect of Cohesion on the Reinforced Slope

In order to investigate the effect of cohesion (c) on the optimum reinforced slope stability, FE analyses were carried out for different cohesion values of the MSW landfill. In the analyses, the other parameters were chosen as ϕ = 15°; ψ = 0°; E = 6500 kN/m2; ν = 0.45; γ = 9 kN/m3; β = 26.56° (1V/2H); and N = 4. The FS values for different cohesion values obtained as a result of the FEM analyses are shown in Table 10 and Figure 16.
From the analyses performed to determine the effect of cohesion (c) on the reinforced slope stability, it can be seen that the FS of the slope increases linearly with an increasing cohesion value.

3.2.3. Effect of Internal Friction Angle on the Reinforced Slope

FEM analyses were carried out for different ϕ values of the MSW landfill to investigate the effect of ϕ on slope stability. In the analyses, the other parameters were chosen as c = 10 kPa, ψ = 0°, E = 6500 kN/m2, ν = 0.45, γ = 9 kN/m3, β = 26.56° (1V/2H), and N = 4.
Table 11 and Figure 17 show the FS values for different internal friction angle values obtained from the FEM analyses.
From the analyses performed for investigating the effect of ϕ on the reinforced slope stability, it is clear that the FS of the reinforced slope increases approximately linearly with the increase in the ϕ value, similar to the cohesion effect.
Depending on the increase in the ϕ and c values of the MSW landfill, the shear stresses, displacement, and strain values occurring in the slope decrease, and the FS of the slope increases. In addition, with the increase in the shear strength parameters, the interaction between the geogrid reinforcements and the MSW landfill material increases, which allows for higher FS values.

3.2.4. Effect of Unit Weight on the Reinforced Slope

Table 12 and Figure 18 show the variation in FS values with γ of the MSW landfill. In the analyses, the other parameters were chosen as c = 10 kPa, ψ = 0°, E = 6500 kN/m2, ν = 0.45, ϕ = 15°, β = 26.56° (1V/2H), and N = 4.
As seen in Table 12 and Figure 18, the unit weight of solid waste significantly affects the stability of the MSW landfill in reinforced conditions. A wide range of γ values can be obtained depending on the waste type, the degree of degradation and compaction, and the depth at which the sample was taken. As a result, the FS decreases depending on the increase in the γ value.

3.2.5. Effect of Material Model on the Reinforced Slope

In this study, the Mohr–Coulomb material model (MCM) was used to analyze the slope stability of the MSW landfill. MCM has been used by many researchers in the analysis of MSW landfill slopes because it gives acceptable results and the parameters required for modeling can be obtained more easily than other advanced material models [7,46,47,48]. The creep deformation and humidity distribution of MSW plays a key role in the stability of MSW landfill slopes [49,50]. Given this, the Mohr–Coulomb model cannot accurately represent the macroscopic response without considering the mechanical creep. Finite element analyses were performed using the soft soil creep model (SSCM) in the PLAXIS program for investigating the mechanical creep effect on the stability behavior of the MSW landfill slope.
The SSCM is used to model the time-dependent behavior of soft soils. Cohesion, c; internal friction angle, ϕ; dilatation angle, ψ; modified compression index, λ*; modified swelling index, κ*; and the modified creep index, μ*, are entered as input parameters in the model. The modified compression index, λ*; the modified swelling index, κ*; and the modified creep index, μ*, can be obtained both from an isotropic compression test and an oedometer test [17]. These parameters can be calculated from Equations (1)–(3).
λ * = C c 2.3 1 + e
κ *   2 2.3 C r 1 + e
μ *   C α 2.3 1 + e
where Cc is the compression index, Cr is the recompression index, Cα is the secondary compression index, and e is the initial void ratio. The parameters used in the analyses were obtained from the studies available in the literature. Gabr and Valero [20] conducted compressibility tests and reported that the Cc value is between 0.4–0.9, Cα ranges from 0.03 to 0.009, and the initial void ratio, e, ranges between 1.0 and 3.0. Kavazanjian et al. [51] presented the results of one-dimensional compression tests on MSWs with varying degrees of degradation and found that values of the recompression index, Cr, varied from 0.003 to 0.017. In the analyses performed using the SSCM, mean values were taken and the input parameters, the modified compression index, λ*; the modified swelling index, κ*; and the modified creep index, μ*, were obtained using Cc = 0.65, Cα = 0.0195, Cr = 0.01, and e = 2.
When Table 13 and Figure 19 are examined, it is seen that the FS values obtained using the SSCM in both the unreinforced and reinforced conditions are lower than the values obtained using MCM. While the difference between the FS values is 2% in the unreinforced case, this difference is around 3.3% in the reinforced case.

4. Conclusions

In this study, stability analyses of MSW landfill slopes in unreinforced and geogrid-reinforced conditions were carried out. Analyses were carried out using FEM and LEM. Based on the analysis results, the following main conclusions can be drawn:
  • According to the results obtained from the unreinforced and reinforced analyses, the FS of the MSW landfill slope changes depending on the internal friction angle, cohesion, unit weight, and material model parameters of the solid waste. Considering that the range given for these parameters in the literature is quite wide, choosing these parameters correctly is very important in the stability calculations of the slope.
  • By using geogrid reinforcements, the FS of MSW landfill slopes can be improved significantly. Reinforced slopes behave similar to a composite material due to the interlocking and frictional resistances that occur between the reinforcements and the waste material. With the use of geogrid reinforcements, the stability of the slopes increases, while the FS increases significantly.
  • According to the results obtained from the reinforced analyses, it has been seen that the FS can be increased by up to 1.86 times by placing four geogrid reinforcements in the 1V/2H MSW landfill slope. In other words, if geogrid reinforcements are placed inside the MSW landfill slope, more solid waste can be stored compared to the traditional 1V/3H slope.
  • The optimum number of geogrids and the vertical spacing required for different heights, slope angles, and different indices and shear strength parameters of the solid waste material can be obtained by numerical modeling of MSW landfill slopes.
  • Since the limit equilibrium and finite element methods use different approximation principles in slope stability analysis, there are differences between the FS values obtained by the two methods.
  • While the boundaries of the slip surface are determined by the user in LEM analyses, the slip surface is automatically created by the program in FEM analyses. In addition, the failure surface mechanism can be revealed by plotting shear strain increases in FEM analyses.
  • Considering the mechanical creep behavior in the analysis of MSW landfill slopes, more realistic solutions can be obtained. In the preliminary analyses carried out using the SSCM within the scope of this study, there is a slight difference in FS values obtained using the MCM. Although the MCM is frequently used in studies on the subject, advanced material models that can take into account mechanical creep and time-dependent behavior should be used.

Author Contributions

Conceptualization, project administration, supervision, writing—review & editing, and writing—original draft: M.S.K.; methodology, data curation, software, validation, and formal analysis: S.K. All authors have read and agreed to the published version of the manuscript.

Funding

This research received no external funding.

Institutional Review Board Statement

Not applicable.

Informed Consent Statement

Not applicable.

Data Availability Statement

Not applicable.

Conflicts of Interest

The authors declare no conflict of interest.

References

  1. Seed, R.B.; Mitchell, J.K.; Seed, H.B. Kettleman Hills waste landfill slope failure. II: Stability analyses. J. Geotech. Engrg. 1990, 116, 669–690. [Google Scholar] [CrossRef]
  2. Eid, H.T.; Stark, T.D.; Evans, W.D.; Sherry, P.E. Municipal solid waste slope failure I: Waste and foundation soil properties. J. Geotech. Geoenviron. Eng. 2000, 126, 397–407. [Google Scholar] [CrossRef]
  3. Koerner, R.M.; Soong, T.Y. Leachate in landfills: The stability issues. Geotext. Geomembr. 2000, 18, 293–309. [Google Scholar] [CrossRef]
  4. Gharabaghi, B.; Singh, M.K.; Inkratas, C.; Fleming, I.R.; McBean, E. Comparison of slope stability in two Brazilian municipal landfills. Waste Manag. 2008, 28, 1509–1517. [Google Scholar] [CrossRef]
  5. Chang, M. Three-dimensional stability analysis of the Kettleman Hills landfill slope failure based on observed sliding-block mechanism. Comput. Geotech. 2005, 32, 587–599. [Google Scholar] [CrossRef]
  6. Stark, T.D.; Eid, H.T.; Evans, W.D.; Sherry, P.E. Municipal solid waste slope failure. II: Stability analyses. J. Geotech. Geoenviron. Eng. 2000, 126, 408–419. [Google Scholar] [CrossRef]
  7. Hossain, M.S.; Haque, M.A. Stability analyses of municipal solid waste landfills with decomposition. Geotech. Geol. Eng. 2009, 27, 659–666. [Google Scholar] [CrossRef]
  8. Huvaj-Sarihan, N.; Stark, T.D. Back analyses of landfill slope failures. In Proceedings of the 6th International Conference on Case Histories in Geotechnical Engineering and Symposium in Honor of Professor James K. Mitchell., Arlington, VA, USA, 11–16 August 2008. [Google Scholar]
  9. Zornberg, J.G.; Kavazanjian, E., Jr. Prediction of the performance of a geogrid-reinforced slope founded on solid waste. Soils Found. 2001, 41, 1–16. [Google Scholar] [CrossRef] [Green Version]
  10. Jiang, H.; Zhou, X.; Xiao, Z. Stability of extended earth berm for high landfill. Appl. Sci. 2020, 10, 6281. [Google Scholar] [CrossRef]
  11. Ke, H.; Ma, P.; Lan, J.; Chen, Y.; He, H. Field behaviors of a geogrid reinforced MSW slope in a high-food-waste-content MSW landfill: A case study. Geotext. Geomembr. 2021, 49, 430–441. [Google Scholar] [CrossRef]
  12. Bergado, D.T.; Ramana, G.V.; Sia, H.I. Evaluation of interface shear strength of composite liner system and stability analysis for a landfill lining system in Thailand. Geotext. Geomembr. 2006, 24, 371–393. [Google Scholar] [CrossRef]
  13. Kim, D.; Frost, J.D. Effect of geotextile constraint on geotextile/geomembrane interface shear behavior. Geosynth. Int. 2011, 18, 104–123. [Google Scholar] [CrossRef]
  14. Cen, W.J.; Bauer, E.; Wen, L.S.; Wang, H.; Sun, Y.J. Experimental investigations and constitutive modeling of cyclic interface shearing between HDPE geomembrane and sandy gravel. Geotext. Geomembr. 2019, 47, 269–279. [Google Scholar] [CrossRef]
  15. Shi, J.; Shu, S.; Qian, X.; Wang, Y. Shear strength of landfill liner interface in the case of varying normal stress. Geotext. Geomembr. 2020, 48, 713–723. [Google Scholar] [CrossRef]
  16. Lu, Y.; Abuel-Naga, H.; Leong, E.C.; Jiao, W.G.; Wang, X. Characterisation of geomembrane and geotextile interface short-term creep behaviour in a dry condition. Geotext. Geomembr. 2022, 50, 312–322. [Google Scholar] [CrossRef]
  17. PLAXIS. User Manual, 2D Version 8; Brinkgreeve, R.J.B., Ed.; Delft University of Technology & PLAXIS b.v.: Delft, The Netherlands, 2002. [Google Scholar]
  18. Geo-Slope İnternational Ltd. SLOPE/W Tutorial; Geo-Slope İnternational Ltd.: Calgary, AB, Canada, 2007. [Google Scholar]
  19. Landva, A.D.; Clarke, J. Geotechnics of Waste fill. In Geotechnics of Waste Fills-Theory and Practice; Landva, A., Knowles, G.D., Eds.; ASTM STP 1070; ASTM: Philadelphia, PA, USA, 1990; pp. 86–103. [Google Scholar]
  20. Gabr, M.A.; Valero, S.N. Geotechnical properties of municipal solid waste. Geotech. Test. J. 1995, 18, 241–251. [Google Scholar]
  21. Kavazanjian, E., Jr. Mechanical properties of municipal solid waste. In Proceedings of the 8th International Waste Management and Landfill Symp, Sardinia 2001, Volume III. Environmental Sanitary Engineering Centre CISA, Univ. of Padua, Padua, Italy, 1–5 October 2001; pp. 415–424. [Google Scholar]
  22. Hossain, M.S. Mechanics of Compressibility and Strength of Solid Waste in Bioreactor Landfills. Ph.D. Dissertation, Department of Civil Engineering, North Carolina State University, Raleigh, NC, USA, 2002. [Google Scholar]
  23. Sharma, H.D.; Reddy, K.R. Geoenvironmental Engineering: Site Remediation, Waste Containment, and Emerging Waste Management Technologies; John Wiley & Sons: Hoboken, NJ, USA, 2004. [Google Scholar]
  24. Zekkos, D.P. Evaluation of Static and Dynamic Properties of Municipal Solid Waste. Ph.D. Dissertation, Department of Civil and Environmental Engineering, Univ. of California, Berkeley, CA, USA, 2005. [Google Scholar]
  25. Singh, S.; Murphy, B.J. Evaluation of the stability of sanitary landfills. ASTM Spec. Tech. Publ. 1990, 1070, 240–258. [Google Scholar]
  26. Sharma, H.D.; Goyal, H.K. Performance of a hazardous waste and sanitary landfill subjected to Loma Prieta earthquake. In Proceedings of the 2nd ICRAGEESD, St. Louis, MI, USA, 10 March 1991; Volume 2, pp. 1717–1725. [Google Scholar]
  27. Bray, J.D.; Augello, A.J.; Leonards, G.A.; Repetto, P.C.; Byrne, R.J. Seismic stability procedures for soil-waste landfills. J. Geotech. Geoenviron. Eng. 1995, 121, 139–151. [Google Scholar] [CrossRef]
  28. Fassett, J.B.; Leonards, G.A.; Repetto, P.C. Geotechnical properties of municipal solid waste and their use in landfill design. In Proceedings of the Waste Tech ’94 Solid Waste Association of North America, Silver Springs, MD, USA; 1994; pp. 1–31. [Google Scholar]
  29. Kavazanjian, E.; Matasovic, N.; Bonaparte, R.; Schmertmann, G.R. Evaluation of MSW properties for seismic analysis. In Proceedings of the Specialty Conference on Geotechnical Practice in Waste Disposal, Part 1, New Orleans, LA, USA, 24 February 1995; pp. 1126–1141. [Google Scholar]
  30. Sharma, H.D.; Dukes, M.T.; Olsen, D.M. Field measurements of dynamic moduli and Poisson’s ratios of refuse and underlying soils at a landfill site. In Proceedings of the Symposium on Geotechnics of Waste Fills—Theory and Practice, Pittsburg, PL, USA, 10–13 September 1990; pp. 57–70. [Google Scholar]
  31. Karimpour-Fard, M.; Machado, S.L. Deformation characteristics of MSW materials. Electron. J. Geotech. 2012, 17, 2009–2024. [Google Scholar]
  32. Dixon, N.; Jones, D.R.V. Engineering properties of municipal solid waste. Geotext. Geomembr. 2005, 23, 205–233. [Google Scholar] [CrossRef]
  33. Bishop, A.W. The use of slip circles in stability analysis of slopes. Geotechnique 1955, 5, 7–17. [Google Scholar] [CrossRef]
  34. Janbu, N. Application of composite slip surfaces for stability analysis. Eur. Conf. Stabil. Earth Slopes 1955, 3, 43–49. [Google Scholar]
  35. Spencer, E. A method of analysis of the stability of embankments assuming parallel inter-slice forces. Geotechnique 1967, 1, 11–26. [Google Scholar] [CrossRef]
  36. Morgenstern, N.R.; Price, V.E. The analysis of the stability of general slip surfaces. Geotechnique 1965, 1, 79–93. [Google Scholar] [CrossRef]
  37. Hettiarachchi, H.; Ge, L. Use of geogrids to enhance stability of slope in bioreactor landfills: A conceptual method. In Proceedings of the International Foundation Congress and Equipment Expo, Orlando, FL, USA, 15–19 March 2009; Volume 1, pp. 520–526A. [Google Scholar]
  38. Bowles, J.E. Foundation Analysis and Design, 5th ed.; McGraw-Hill: Singapore, 1996. [Google Scholar]
  39. Griffiths, D.V.; Lane, P.A. Slope stability analysis by finite elements. Géotechnique 1999, 49, 387–403. [Google Scholar] [CrossRef]
  40. Hammah, R.E.; Curren, J.H.; Corklum, B.; Yacoub, T. Analysis of rock slopes, using the finite element method. In Proceedings of the ISRM Regional Symposium Eurock 2004 and the 53rd Geomechnaics Colloquy, Salzbuurg, Australia, 7–9 October 2004. [Google Scholar]
  41. Khabbaz, H.; Fatahi, B.; Nucifora, C. Finite element methods against limit equilibrium approaches for slope stability analysis. In Proceedings of the Australia New Zealand Conference on Geomechanics, Melbourne, Australia, 15–18 July 2012; pp. 1293–1298. [Google Scholar]
  42. Vinod, B.R.; Shivananda, P.; Swathivarma, R.; Bhaskar, M.B. Some of limit equilibrium method and finite element method based software are used in slope stability analysis. Int. J. Appl. Innov. Eng. Manag. 2017, 6, 6–10. [Google Scholar]
  43. Zein, A.K.M.; Karim, W.A. Stability of slopes on clays of variable strength by limit equilibrium and finite element analysis methods. Int. J. GEOMATE 2017, 13, 157–164. [Google Scholar]
  44. Rotaru, A.; Bejan, F.; Almohamad, D. Sustainable Slope Stability Analysis: A Critical Study on Methods. Sustainability 2022, 14, 8847. [Google Scholar] [CrossRef]
  45. Rai, R.; Khandelwal, M.; Jaiswal, A. Application of geogrids in waste dump stability: A numerical modeling approach. Environ. Earth Sci. 2012, 66, 1459–1465. [Google Scholar] [CrossRef]
  46. Varga, G. Some geotechnical aspects of bioreactor landfills. Period. Polytech. Civ. Eng. 2011, 55, 39–44. [Google Scholar] [CrossRef] [Green Version]
  47. Datta, S.; Sivakumar Babu, G.L. Prediction of the slope stability of municipal solid waste landfills using the reliability analysis. In Proceedings of the Geo-Chicago, Chicago, IL, USA, 14–18 August 2016; pp. 668–677. [Google Scholar]
  48. Lü, X.; Xue, D.; Chen, Q.; Zhai, X.; Huang, M. Centrifuge model test and limit equilibrium analysis of the stability of municipal solid waste slopes. Bull. Eng. Geol. Environ. 2019, 78, 3011–3021. [Google Scholar] [CrossRef]
  49. Ering, P.; Sivakumar Babu, G.L. Slope stability and deformation analysis of Bangalore MSW landfills using constitutive model. Int. J. Geomech. 2016, 16, 04015092. [Google Scholar] [CrossRef]
  50. Yao, Y.; Li, J.; Xiao, Z.; Xiao, H. Soil-Water characteristics and creep deformation of unsaturated expansive subgrade soil: Experimental test and simulation. Front. Earth Sci. 2021, 1141, 783273. [Google Scholar] [CrossRef]
  51. Kavazanjian, E.; Matasovic, N.; Bachus, R.C. Large-diameter static and cyclic laboratory testing of municipal solid waste. In Proceedings of the Sardinia, Cagliari, Italy, 4–8 October 1999; pp. 437–444. [Google Scholar]
Figure 1. Landfill geometry for 1V/3H (dimensions are in meters).
Applsci 12 11866 g001
Figure 2. (a) Unreinforced; (b) reinforced. Slope geometry used in finite element analyses.
Applsci 12 11866 g002
Figure 3. (a) Unreinforced; (b) reinforced. Slope geometry used in limit equilibrium analysis.
Applsci 12 11866 g003
Figure 4. Variation in FS with c.
Applsci 12 11866 g004
Figure 5. Variation in FS with ϕ.
Applsci 12 11866 g005
Figure 6. Variation in FS with γ.
Applsci 12 11866 g006
Figure 7. Variation in FS with β.
Applsci 12 11866 g007
Figure 8. (a) 1V/1H; (b) 1V/2H; (c) 1V/3H; (d) 1V/4H; (e) 1V/5H. Failure planes (FEM).
Applsci 12 11866 g008
Figure 9. (a) 1V/1H; (b) 1V/2H; (c) 1V/3H; (d) 1V/4H; (e) 1V/5H. Failure planes (LEM).
Applsci 12 11866 g009
Figure 10. Variation in FS with N.
Applsci 12 11866 g010
Figure 11. (a) Shear strain increment (without geogrids); (b) shear strain increment with one geogrid; (c) shear strain increment with two geogrids; (d) shear strain increment with three geogrids; (e) shear strain increment with four geogrids. Shear strain increment in FEM analysis.
Applsci 12 11866 g011
Figure 12. Variation in FS with N (1V/2H slope) (FEM).
Applsci 12 11866 g012
Figure 13. Variation in FS with N (1V/2H slope) (LEM).
Applsci 12 11866 g013
Figure 14. (a) N = 1; (b) N = 2; (c) N = 3; (d) N = 4. Slip surfaces of the reinforced slope obtained by LEM analysis.
Applsci 12 11866 g014
Figure 15. Comparison of FEM and LEM results (N = 4).
Applsci 12 11866 g015
Figure 16. Variation in FS with c for the reinforced slope.
Applsci 12 11866 g016
Figure 17. Variation in FS with ϕ for the reinforced slope.
Applsci 12 11866 g017
Figure 18. Variation in FS with γ for the reinforced slope.
Applsci 12 11866 g018
Figure 19. FS values obtained from different material models.
Applsci 12 11866 g019
Table 1. MC model parameters.
ParametersSoilMSW
Unit weight, γ (kN/m3)17.09.0
Elasticity moduli, E (kPa)14,0006500
Poisson’s ratio, ν (-)0.250.45
Internal friction angle, ϕ (°)2515
Cohesion, c (kPa)15.010.0
Dilatation angle, ψ (°)0.00.0
Table 2. Analysis results for different cohesion values.
Cohesion, c (kPa)Factor of Safety (FS)
FEMLEM
51.231.25
101.521.55
151.771.80
201.992.03
252.222.23
302.462.42
352.642.60
402.792.77
452.952.94
503.113.11
Table 3. Analysis results for different internal friction angle values.
Internal Friction Angle, ϕ (°)Factor of Safety (FS)
FEMLEM
50.810.93
101.171.19
151.521.55
201.841.91
252.212.27
302.602.64
353.003.06
403.453.52
453.884.05
504.404.67
Table 4. Analysis results for different unit weight values.
Unit Weight (γ) (kN/m3)Factor of Safety (FS)
FEMLEM
91.521.55
101.461.50
111.421.45
121.371.42
131.341.38
Table 5. Unreinforced analysis results.
Slope Angle (β)Vertical/HorizontalFactor of Safety (FS)
FEMLEM
45°1V/1H0.490.52
26.56°1V/2H0.991.02
18.43°1V/3H1.521.55
14.04°1V/4H2.002.08
11.31°1V/5H2.552.63
Table 6. Reinforced analysis sets.
Analysis NoSlope Height, H (m)Geogrid Spacing, h (m)H/h
1301.030
2302.015
3303.010
4305.06
5306.05
6307.54
73010.03
Table 7. Results of reinforced analysis.
Number of Geogrids, NFactor of Safety, FS
00.99
31.49
41.84
52.08
62.35
103.32
154.68
304.74
Table 8. FEM analysis results for the reinforced slope (1V/2H slope, N = 4).
Number of Geogrids, NFactor of Safety, FS
00.99
11.03
21.12
31.37
41.84
Table 9. LEM analysis results for the reinforced slope (1V/2H slope, N = 4).
Number of Geogrids, NFactor of Safety, FS
01.02
11.05
21.30
31.57
41.89
Table 10. Analysis results for different cohesion values (N = 4).
Cohesion, c (kPa)Factor of Safety (FS)
FEM
51.33
101.84
152.32
202.78
253.22
303.65
354.09
404.53
454.96
505.38
Table 11. Analysis results for different internal friction angle values (N = 4).
Internal Friction Angle, ϕ (°)Factor of Safety (FS)
FEM
51.21
101.54
151.84
202.13
252.46
302.76
353.12
403.47
453.89
504.38
Table 12. Analysis results for different unit weight values (N = 4).
Unit Weight (γ) (kN/m3)Factor of Safety (FS)
FEM
91.84
101.74
111.65
121.58
131.52
Table 13. Analysis results for different material models (N = 4).
Material ModelFactor of Safety
UnreinforcedReinforced (N = 4)
SSCM0.971.78
MCM0.991.84
Publisher’s Note: MDPI stays neutral with regard to jurisdictional claims in published maps and institutional affiliations.

