Abstract
In the process of waterflooding development of heavy oil, W/O emulsion has a strong ability to improve the mobility ratio and block the high-permeability layer, which can effectively improve the sweep coefficient and enhance oil recovery. In this paper, the stability and droplet size distribution of emulsions under different conditions were studied by taking heavy oil and formation water from Jimusar Oilfield in Xinjiang as samples. On this basis, double-pipe core flooding experiments were carried out to study the shut-off ability and oil displacement efficiency of W/O emulsion, and then a numerical simulation was carried out. The results show that oil and water can be completely emulsified when the stirring speed is higher than 4000 r/min. A stable emulsion can be formed when the experimental temperature is lower than 60 °C. A lower water cut results in a more stable emulsion. The emulsion is difficult to stabilize after the salinity exceeds 10,000 mg/L. When the pH value is about 7, the stability of the emulsion is the worst. With the increase in stirring speed, the increase in temperature, and the decrease in water content and salinity, the emulsion droplet size range is relatively concentrated, and the average particle size is smaller. In heterogeneous reservoirs, the permeability of different percolation channels is quite different, such that the displacement fluid only percolates along the high-permeability channel and cannot drive oil effectively. The results of displacement experiments show that the emulsion with a water cut of 60% has high viscosity and obvious sweep ability, but its stability is very poor; the effect is opposite when the water cut is less than 40%. The shut-off ability of W/O emulsion disappears gradually when the permeability contrast is more than 5.92. The research results are of great significance for improving oil recovery in heterogeneous heavy oil reservoirs.
1. Introduction
With the continuous exploitation of conventional crude oil, the efficient development of heavy oil reservoirs will play a more and more important role in solving the problem of energy shortage in the world [1]. Waterflooding is the most economical heavy oil development method under current conditions. However, because the viscosity of heavy oil is usually high and the mobility ratio of waterflooding is much greater than 1, the viscous fingering phenomenon can easily occur in waterflooding [2]. As a result, the sweep efficiency and oil recovery of waterflooding in heavy oil reservoirs are lower than those in conventional reservoirs. Therefore, it is urgent to find an effective method to further improve the recovery of heavy oil reservoirs developed by waterflooding.
Emulsion is a multiphase dispersion system formed by one liquid uniformly dispersed in another immiscible liquid. There are two kinds of common emulsions; one is an O/W emulsion with oil as the dispersion phase and water as the dispersion medium, and the other is a W/O emulsion with water as the dispersion phase and oil as the dispersion medium [3].
In oilfield development, 95% of crude oil is produced in the form of an emulsion [4]. Because oil and water phases are subjected to various shearing actions in the process of production and transportation, these shearing actions can make the active components in crude oil (asphaltene, colloid, etc.) gradually adsorb on the oil–water interface and emulsify oil and water to form emulsions [5]. In the reservoir, moderate emulsification of oil and water can increase the viscosity of the displacement phase and produce the Jamin effect in the narrow pore throat, thus improving the mobility ratio and expanding the sweep volume [6,7]. Therefore, the formation of a crude oil emulsion with proper stability in the process of waterflooding is of great significance to improve the mobility ratio and expand the sweep efficiency.
An important criterion to measure the emulsion is the stability of the emulsion [8]. It is generally believed that, if the emulsion is more stable, the premise is that the interfacial tension between oil and water must be lower, which can be achieved by adding surfactant, whereby the stability of the emulsion is affected by the interfacial tension [9]. However, Li and others also drew another important conclusion. By studying the surfactants (such as colloid and asphaltene) in Beihai crude oil, according to the corresponding relationship between the interfacial pressure of the emulsion formed by this substance and the stability of the emulsion [10], it was concluded that not only do the properties and structure of the emulsifier itself have a significant effect on the stability of the emulsion, but the interfacial pressure is also the most important factor influencing the strength of the interfacial film [11]. The strength of the interfacial film increases with the increase in interfacial pressure; hence, the emulsion becomes more stable. Therefore, the interfacial pressure can be used to indicate the strength of the interfacial film. [12]. Interfacial viscosity and interfacial pressure can be used as two important parameters to measure the structural strength of the interfacial film, and they play an important role in characterizing the rheological properties of the interfacial film. The strength of the interfacial film increases with the decrease in interfacial viscosity, such that the emulsion becomes more stable [13].
The stability of emulsions Is usually improved in the presence of surfactants, polymers, inorganic salts, or their combination [14]. In addition to the composition and properties of the oil phase and water phase, the stability is also greatly affected by the mixing conditions [15,16,17,18]. The current research is mainly focused on the static stability of the emulsion after preparation. Thermodynamically speaking, the emulsion is an unstable system, and the two phases are eventually separated in a stationary state. Generally speaking, the stability of the emulsion decreases with the increase in moisture content [19,20]. The preparation temperature can rapidly reduce the stability of most crude oil emulsions [20,21,22]. However, in some cases, the temperature may increase the formation rate of the interfacial film and enhance the stability of the emulsion [23,24]. Some researchers have pointed out that stronger shear strength can improve the stability of the emulsion [19,23,25]. However, other studies have found that emulsion stability initially increases with the increase in shear strength, but decreases when the shear strength is higher than a certain critical value [26,27].
At present, people usually regard emulsification as one of the oil displacement mechanisms of surfactant flooding or poly/surface binary flooding. Few people have systematically studied the effect of emulsion properties on heavy oil recovery from the perspective of emulsification itself. In this paper, the stability and droplet size distribution of W/O emulsions formed under different stirring speeds, temperatures, water cuts, mineralization degrees, and pH values were studied, on the basis of which double-tube core flooding experiments were carried out to study the shut-off capacity and oil displacement efficiency of W/O emulsions under different permeability contrasts and different water cuts of emulsions. Then, a numerical simulation of heavy oil emulsion flooding was carried out.
2. Experiments
2.1. Emulsification Experiment
2.1.1. Materials and Devices
The main experimental materials were heavy oil samples, formation water, deionized water, dilute hydrochloric acid solution, and sodium bicarbonate solution. Heavy oil samples and formation water were provided by Jimusar Oilfield, Xinjiang, China. Table 1 lists the properties and composition of heavy oil samples. Table 2 lists the composition of formation water as analyzed by an ion chromatograph.

Table 1.
Properties and composition of crude oil.
Table 2.
Ion composition of formation water.
Key experimental equipment included an IKA.T18 digital display disperser, water bath, and ESW-2 microscope. The ESW-2 microscope was made by ZEISS Company in Germany.
2.1.2. Experiment Preparation
In the experiment, crude oil and formation water were mixed in a predetermined proportion (water cut of emulsion), put into a beaker, and then heated to the temperature required by the experiment in a water bath, where the water bath provided a constant container temperature. The IKA.T18 digital display disperser was used to stir the mixture at a constant speed for a certain time to obtain the emulsion sample. The actual reservoir temperature of 60 °C, with a stirring speed of 4000 r/min, is equivalent to the shear force in reservoir formation, whereas, for a stirring time of 60 min with a water cut of 40%, the preparation of the emulsion and the actual reservoir emulsion particle size was similar; hence, these conditions were taken as the basic experimental conditions.
- (1)
- Stirring speed. In order to study the effect of stirring speed on the stability of emulsion, other experimental conditions remained unchanged. The emulsion was prepared at stirring speeds of 200 r/min, 1000 r/min, 2000 r/min, 4000 r/min, 7000 r/min, and 12,500 r/min. The prepared emulsions were then allowed to stand for 40 days under the experimental conditions.
- (2)
- Temperature. In order to study the effect of temperature on the stability of the emulsion, the emulsions were prepared at 40 °C, 50 °C, 60 °C, 70 °C, 80 °C, and 90 °C. The prepared emulsions were then allowed to stand for 40 days under the experimental conditions.
- (3)
- Water cut of emulsion. In order to study the effect of water cut on the emulsion, the water cuts of the emulsions were set to 10%, 20%, 30%, 40%, 50%, 60%, 70%, 80%, and 90%. The prepared emulsions were then allowed to stand for 40 days under the experimental conditions.
- (4)
- Mineralization degree. Under the same experimental conditions, the formation water was made into water with different mineralization degrees using deionized water, i.e., 2000 mg/L, 4000 mg/L, 6000 mg/L, 8000 mg/L, and 10,000 mg/L, and then the emulsion with 40% water cut was prepared to study the effect of mineralization degree on the emulsion. The prepared emulsions were then allowed to stand for 40 days under the experimental conditions.
- (5)
- pH value. Under the condition of constant stirring speed and time, temperature, and water cut of the emulsion, the pH value of the formation water was changed using diluted hydrochloric acid solution and sodium bicarbonate solution. Then, it was used to prepare emulsions to study the effect of pH value on the stability of the emulsion. The prepared emulsions were then allowed to stand for 40 days under the experimental conditions.
2.1.3. Investigation of Emulsion Properties
- (1)
- Emulsion stability
The prepared emulsions were placed in a measuring cylinder, and the volume of water separated from the emulsion was recorded at the temperature required for the experiment. The water bleeding rate was equal to the ratio of the volume of precipitated water to the volume of the emulsion. General experiments indicate that, after 30 days of standing emulsion, if the water bleeding rate is less than 5%, it is considered to be of relatively good stability, whereas, for different emulsions, a smaller water bleeding rate represents better stability.
- (2)
- Emulsion droplets size distribution
After the emulsions were prepared, they were placed on a glass slide and photographed at room temperature under an ESW-2 microscope. The micrographs obtained were analyzed using Image Pro Plus software. The droplet size was measured and classified according to the size interval, and then the average diameter of each emulsion sample was calculated.
2.2. Emulsion Flooding Experiment
2.2.1. Materials
The main experimental materials were heavy oil samples, formation water, and cores from Jimusar Oilfield in Xinjiang, China. Table 3 lists the properties of cores in this experiment.
Table 3.
Table of displacement core parameters.
2.2.2. Experimental Apparatus
Figure 1 shows the double-tube core flooding experimental device, consisting of four parts.
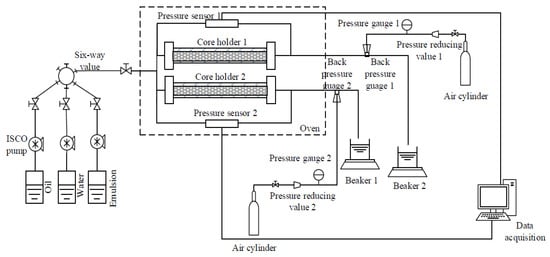
Figure 1.
Experimental device of double-pipe core displacement.
- (1)
- Injection system. The system consisted of three piston containers and ISCO pumps containing heavy oil samples, formation water, and emulsion. The injection rate was stable.
- (2)
- Pipeline and reservoir simulation system. The system was composed of two core holders and an oven. The cores of the studied oil field were selected to simulate the actual reservoir. The oven could simulate the actual reservoir temperature, and the specifications of the core holder were 25 mm × 300 mm.
- (3)
- Product collection and calculation system. The system used beakers to collect the produced liquid and used the weighing method to measure.
- (4)
- Temperature and pressure control system. The system consisted of a gas cylinder, an oven, a back pressure valve, a pressure reducing valve, two pressure sensors, and two pressure gauges.
2.2.3. Experimental Procedures
The main procedures were as follows:
- (1)
- Experimental preparation. The core was dried, and the core quality was weighed. It was checked whether the pipeline leaked step by step; the core was extracted for 4–5 h under the condition of −0.1 MPa pressure, and then the core was removed after absorbing water. The surface water was quickly wiped off with paper, the mass was weighed again, and the core pore volume could be obtained from the increase in mass of the core after absorbing water, while the porosity could be calculated.
- (2)
- Permeability to water. The permeability was measured using water at three injection rates, and the average permeability was calculated. The permeability and porosity measured in eight cores are shown in Table 3, and the results were divided into four groups according to the permeability difference.
- (3)
- Saturated oil. The first step involved saturated water. Then, saturated oil was applied at an appropriate injection rate of 0.05 mL/min, and the outlet end cylinder measured the volume of discharged water until there was no more water. The total volume of discharged water was the volume of saturated oil, and the original oil saturation and irreducible water saturation could be calculated. The core aged for 12 h after being saturated with oil.
- (4)
- Emulsion flooding. An injection speed of 0.5 mL/min needed for the experiment was selected to inject the emulsion of 1 PV.
- (5)
- Water flooding. At the end of the emulsion injection stage, subsequent wate flooding was carried out at the same injection speed.
2.2.4. Investigation of Emulsion Flooding
In the double-pipe core displacement experiment, two types of experiments were carried out, with a total of eight experiments. The first group of experiments considered the effect of the permeability difference on the shut-off ability of the emulsion, and the experiments were carried out under the conditions of permeability contrasts of 2.03, 3.24, 5.92, and 8.34. The second group of experiments considered the effect of water cut of the emulsion on the shut-off ability of the emulsion, and the experiments were carried out under the conditions of water cuts of 30%, 40%, 50%, and 60%. It is worth noting that the crude oil contained in the injected emulsion accounted for the proportion of oil displacement efficiency.
In the first group of experiments, the oven temperature was maintained at 54 °C, the injection rates of emulsion and water was maintained at 0.5 mL/min, and the emulsion with 40% water cut was selected. Four double-tube pipe displacement experiments were carried out according to the above experimental steps. In each experiment, the weight of the liquid produced by the two beakers at multiple timepoints was recorded to analyze the double-pipe fractional flow rate, and then the water in the beaker was dried to obtain the oil recovery and calculate the oil displacement efficiency. Then, the relationship between the fractional flow rate and the number of injected PVs and the relationship between the water cut and the oil displacement efficiency were analyzed.
In the second group of experiments, the oven temperature was maintained at 54 °C, the injection rate of emulsion and water was maintained at 0.5 mL/min, and a group of cores with a permeability contrast of 2.03 was selected. Four double-pipe core displacement experiments were carried out with emulsions with water cuts of 30%, 40%, 50%, and 60%. In each experiment, the weight of the liquid produced by the two beakers at multiple timepoints was recorded to analyze the double-pipe fractional flow rate, and then the water in the beaker was dried to obtain the oil production and calculate the oil displacement efficiency. Then, the relationship between the fractional flow rate and the number of injected PVs and the relationship between the water cut and the oil displacement efficiency were analyzed.
3. Results and Discussion
3.1. Analysis of Emulsion Properties
3.1.1. Emulsion Stability
Figure 2 shows the water precipitation of the prepared emulsion after standing for a period of time.
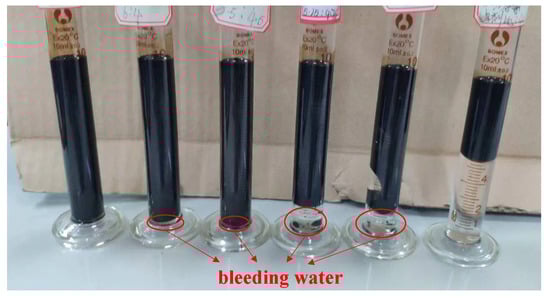
Figure 2.
Experimental photograph of water precipitated from the emulsion after standing for 40 days.
From Figure 2, it can be seen that there was water precipitation at the bottom of the measuring cylinder, and the water bleeding rate was equal to the ratio of the volume of water precipitated from the emulsion to the volume of the emulsion itself. Next, the water bleeding rate of the emulsion at multiple timepoints was recorded, and the relationship curve between the standing time and the water bleeding rate was established to study the influence of five factors on the stability of the emulsion. The size of the water bleeding rate represents the stability of the emulsion, whereby a lower water bleeding rate of the emulsion indicates better stability.
- (1)
- Effect of stirring speed
Figure 3 displays the effect of stirring speed on the stability of the emulsion. Figure 4 shows the effect of stirring speed on the viscosity of the emulsion.
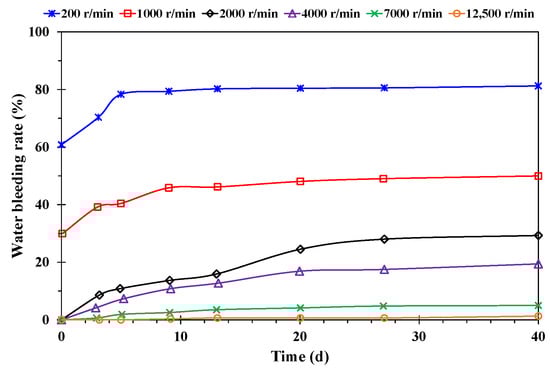
Figure 3.
Effect of stirring speed on emulsion stability.
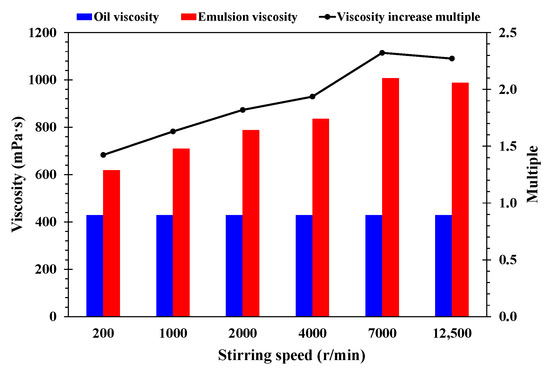
Figure 4.
Influence of stirring speed on emulsion viscosity; the viscosity of oil is provided as a reference.
As shown in Figure 3, with the change in stirring speed, the water bleeding rate in the same time period changed. With the increase in stirring speed, the water bleeding rate of the emulsion decreased gradually, indicating that the stability of the emulsion increased gradually. The water bleeding rate varied greatly with stirring speed when it was less than 7000 r/min. The emulsion was basically stable after 7000 r/min. Because the stirring speed was small and the input energy of the system was small, the dispersion degree of the internal phase was relatively low. With the extension of the standing time, the water bleeding rate increased, but the extent of the increase decreased gradually, due to the gradual sedimentation and coalescence of the incompletely dispersed droplets. With the increase in stirring speed, the dispersed phase droplets were subjected to greater shear, resulting in deformation and rupture, tending to form smaller droplets, and gradually making the droplet size and distribution reach equilibrium. At this time, a further increase in stirring speed did not affect the stability of the emulsion [28].
As shown in Figure 4, with the increase in stirring speed, the viscosity of the emulsion increased gradually, reaching the highest value at 7000 r/min, which was 2.23 times higher than that of crude oil. An emulsion with high viscosity can play a more important role in plugging the high-permeability formation and improving the mobility ratio.
- (2)
- Effect of temperature
Figure 5 displays the effect of temperature on the stability of the emulsion. Figure 6 shows the effect of temperature on the viscosity of the emulsion.
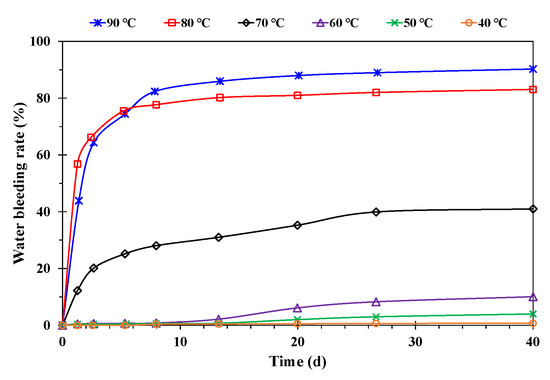
Figure 5.
Effect of temperature on emulsion stability.
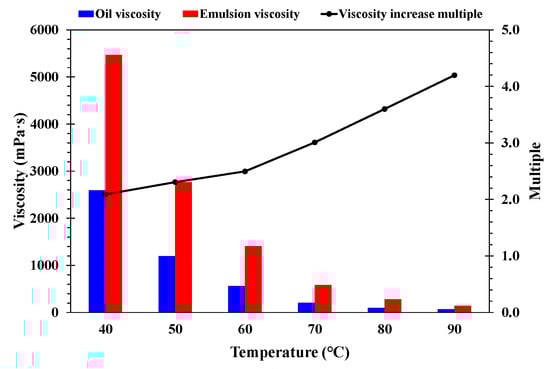
Figure 6.
Influence of temperature on emulsion viscosity; the viscosity of oil is provided as a reference.
As shown in Figure 5, the water bleeding rate of the emulsion basically showed an increasing trend with the increase in temperature. The water bleeding rate was relatively low as a function of residence time extension when the temperature was below 50 °C, indicating that the emulsion was relatively stable. A lower temperature led to a better stability of the emulsion. The increase in temperature increased the solubility of natural emulsifiers such as asphaltene and colloid in crude oil, which, on the one hand, increased the difficulty of emulsification and made the droplets formed by stirring larger; on the other hand, the adsorption amount of emulsifiers on the oil–water interface decreased, and tended to be arranged irregularly, such that the strength of the oil–water interface film decreased, the discharge speed of the interface film increased, and the stability became worse. At the same time, an increase in temperature led to the intense thermal movement of molecules in the emulsion system, and the probability of collision and coalescence of the inner phase water droplets increased, thus accelerating the demulsification of the emulsion [29].
As shown in Figure 6, the viscosity of the emulsion and crude oil decreased with the increase in temperature, and the viscosity ratio of emulsion to crude oil increased with the increase in temperature.
- (3)
- Effect of water cut of emulsion
Figure 7 displays the effect of water cut on the stability of the emulsion. Figure 8 shows the effect of water cut on the viscosity of the emulsion.
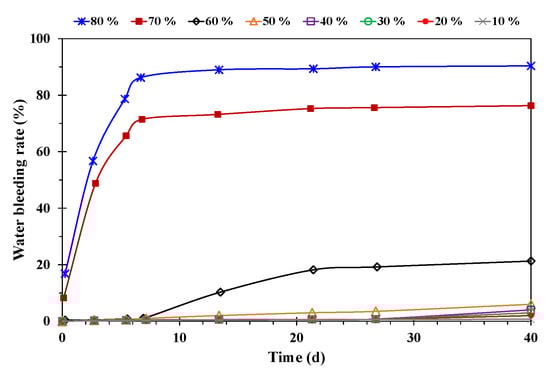
Figure 7.
Effect of water cut of emulsion on stability.
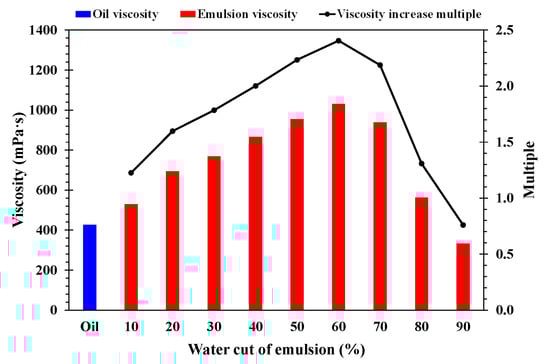
Figure 8.
Influence of water cut on emulsion viscosity; the viscosity of oil is provided as a reference.
As shown in Figure 7, the water bleeding rate of the emulsion increased with the increase in water cut for the same residence time, indicating that a lower water cut led to better stability of the emulsion. When the water cut was less than 50%, there was little change in emulsion stability. An increase in water cut, i.e., an increase in the concentration of the inner phase, increased the total area of the oil–water interface, reduced the amount of emulsifier adsorption per unit area, reduced the strength of the interfacial film, reduced the coalescence resistance of the dispersed droplets, and reduced the stability of the emulsion [30].
As shown in Figure 8, for water cuts of 10% to 60%, the viscosity of the emulsion increased with the increase in water cut, whereas, when the water cut was greater than 60%, the viscosity decreased as the water cut increased. The viscosity ratio of the emulsion with 60% water cut to crude oil could reach 2.4. The viscosity of the emulsion with 90% water cut was lower than that of crude oil. This was due to the increase in water cut and the increase in the viscosity of the emulsion, which made the mutual shear interaction between the dispersed droplets stronger, benefitting the deformation, elongation, and fracture of the droplets and, thus, forming smaller droplets. At the same time, the increase in viscosity weakened the interaction of dispersed phase droplets in the static position, and the settling process of droplets under the action of gravity was also inhibited. At a certain timepoint, the emulsion emulsified rapidly and the viscosity decreased.
- (4)
- Effect of mineralization degree
Figure 9 displays the effect of mineralization degree on the stability of the emulsion. Figure 10 shows the effect of mineralization degree on the viscosity of emulsion.
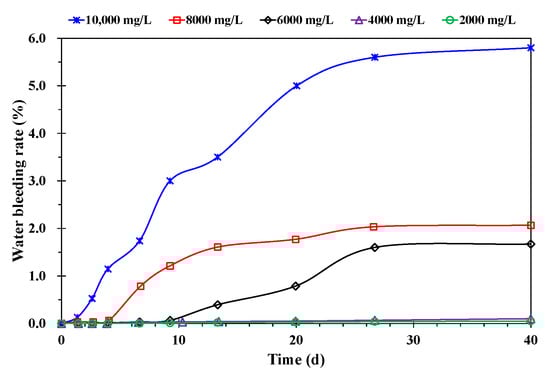
Figure 9.
Effect of mineralization degree on stability.
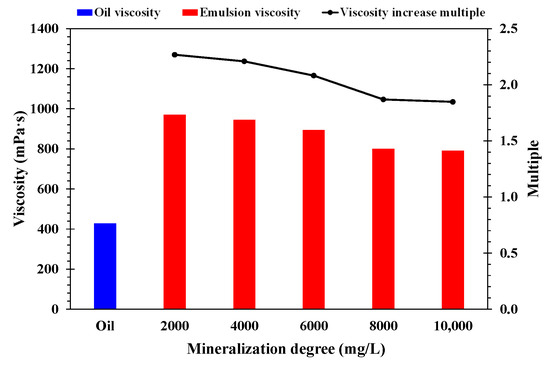
Figure 10.
Influence of mineralization degree on emulsion viscosity; the viscosity of oil is provided as a reference.
As shown in Figure 9, with the increase in mineralization degree, the water bleeding rate of emulsion increased slightly, indicating that a lower mineralization degree leads to a better stability of the emulsion. Due to the existence of an electro-double structure at the oil–water interface, ions with opposite electrical properties of dispersed droplets acted as emulsifiers. For the W/O emulsion, negative ions contributed to demulsification, whereas positive ions mainly deformed the water droplets and promoted the destruction of the emulsion structure, thus making the stability of the emulsion worse.
As shown in Figure 10, the viscosity of the emulsion decreased with the increase in mineralization degree. The viscosity of the emulsion was 1.2–2.3 times that of oil, and a higher mineralization degree led to a lower emulsion viscosity.
- (5)
- Effect of pH value
Figure 11 displays the effect of pH on the stability of the emulsion. Figure 12 shows the effect of pH value on the viscosity of the emulsion.
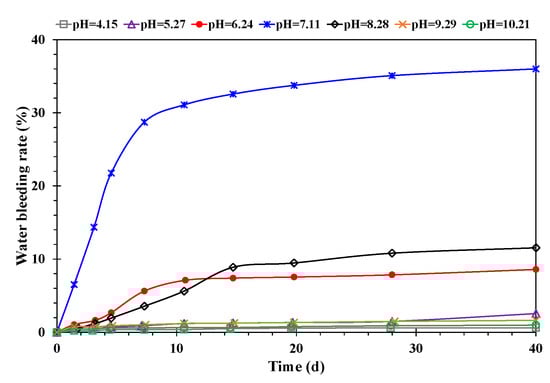
Figure 11.
Effect of pH value on emulsion stability.
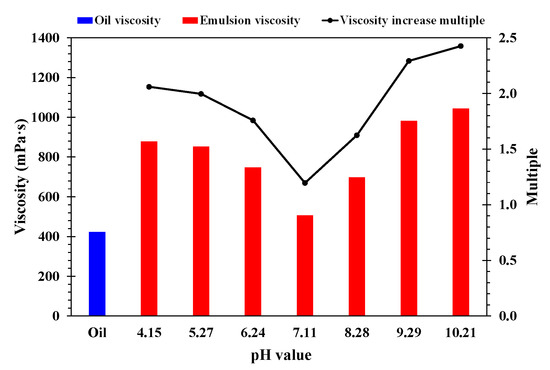
Figure 12.
Influence of pH value on emulsion viscosity; the viscosity of oil is provided as a reference.
As shown in Figure 11, the emulsion had the highest water bleeding rate and the lowest stability at pH 7.11, indicating that the emulsion had good stability. This is because, when the pH value was neutral, the oil–water interface tension was highest, whereas the interfacial tension decreased rapidly with the increase or decrease in pH value. When the pH was too low, it stimulated the charging of natural active substances in the crude oil and increased their activity. This made it easier to adsorb on the oil–water interface, resulting in a decrease in oil–water interfacial tension and an increase in interfacial film strength, thus increasing the stability of the emulsion [31].
As shown in Figure 12, the emulsion had the lowest viscosity at pH 7.11. The viscosity of the emulsion showed an increasing trend, being 1.1–2.4 times that of crude oil when the pH value was less than or greater than 7.
3.1.2. Emulsion Particle Size Distribution
The shut-off capacity of an emulsion in porous media is directly related to the size of droplets. In general, emulsions have better sealing characteristics when the size of the droplet matches the diameter of the pore throat. Therefore, it is of great significance to study the particle size distribution of emulsion droplets. Figure 13 shows microscopic images of the emulsion particle sizes at different microscopic scales. Figure 13 shows that the emulsion constituted different particle sizes.
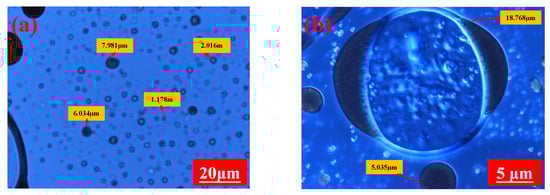
Figure 13.
Photomicrographs of emulsion at different microscopic scales, showing droplets of emulsion of different sizes: (a) 20 μm; (b) 5 μm.
- (1)
- Effect of stirring speed
Figure 14 shows the results of the particle size distribution of emulsion droplets at different stirring speeds.
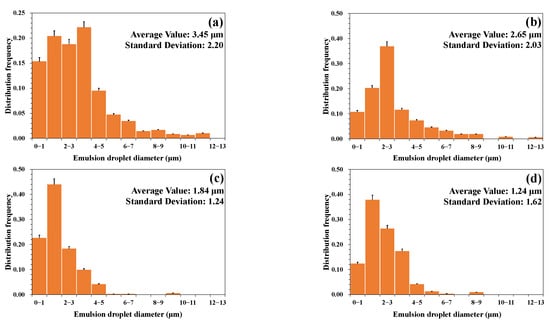
Figure 14.
Effect of stirring speed on particle size distribution: (a) 2000 r/min; (b) 4000 r/min; (c) 7000 r/min; (d) 12,500 r/min.
As shown in Figure 14, the size range of emulsion droplets decreased with the increase in stirring speed, and the average diameter decreased with the increase in stirring speed. With the increase in stirring speed from 2000 r/min to 12,500 r/min, the droplet size decreased from 0.5–11.5 μm to 0.2–5.3 μm, and the average diameter decreased from 3.45 μm to 1.24 μm. A higher stirring speed led to a smaller particle size of the emulsion and a more uniform distribution. Due to the increase in stirring speed, the dispersed phase droplets were subjected to greater shear, resulting in deformation and rupture, tending to form smaller droplets, and gradually making the droplet size and distribution reach equilibrium.
- (2)
- Effect of temperature
Figure 15 shows the results of the particle size distribution of emulsion droplets at different temperatures. As shown in Figure 15, the size range and average diameter of emulsion droplets decreased with the increase in temperature. The size range of emulsion droplets decreased from 0.75–3.65 μm to 0.55–1.73 μm and the average diameter decreased from 2.00 μm to 1.01 μm when the temperature increased from 40 °C to 90 °C. A higher temperature led to a smaller particle size of the emulsion and a more uniform distribution. An increase in temperature led to the intense thermal movement of molecules in the emulsion system, while the probability of collision and coalescence of water droplets in the inner phase increased, such that the droplet size became smaller and the distribution became more uniform.
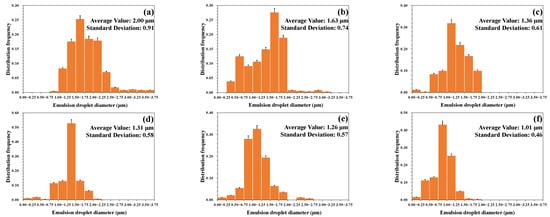
Figure 15.
Effect of temperature on particle size distribution: (a) 40 °C; (b) 50 °C; (c) 60 °C; (d) 70 °C; (e) 80 °C; (f) 90 °C.
- (3)
- Effect of water cut of emulsion
Figure 16 shows the results of the particle size distribution of emulsion droplets under different water cuts. As shown in Figure 16, with the increase in water cut from 30% to 80%, the size range of emulsion droplets increased from 0.2–6.6 μm to 0.7–17.3 μm, and the average diameter increased from 0.92 μm to 4.65 μm. A lower water cut led to a smaller particle size of the emulsion and a more uniform distribution. This behavior is consistent with previous studies on the stability of the emulsion. An emulsion with large droplets has a high aggregation rate, resulting in instability of the emulsion. With the water cut of emulsion increasing, the coalescence resistance of dispersed phase droplets decreased, such that the particle size of emulsion droplets increased with the increase in water cut.
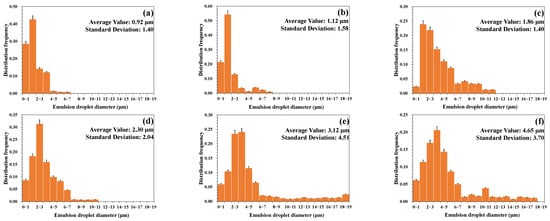
Figure 16.
Effect of water cut of emulsion on particle size distribution: (a) 30%; (b) 40%; (c) 50%; (d) 60%; (e) 70%; (f) 80%.
- (4)
- Effect of mineralization degree
Figure 17 displays the results of the particle size distribution of emulsion droplets under different mineralization degrees.
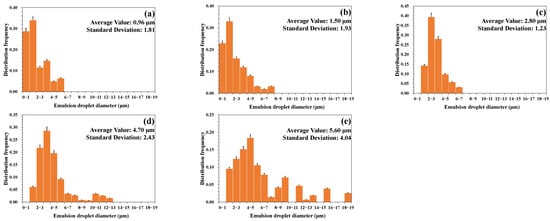
Figure 17.
Effect of mineralization degree on particle size distribution: (a) 2000 mg/L; (b) 4000 mg/L; (c) 6000 mg/L; (d) 8000 mg/L; (e) 10,000 mg/L.
As shown in Figure 17, the emulsion droplet size range increased from 0.32–5.14 μm to 1.5–17.36 μm, and the average diameter increased from 0.96 μm to 5.6 μm when the mineralization degree increased from 2000 mg/L to 10,000 mg/L. A higher mineralization degree led to a larger particle size of the emulsion and a wider distribution range. This behavior is consistent with previous studies on the stability of the emulsion. When the emulsion is less mineralized, the coalescence rate is lower, and the stability is better. In the case of a high mineralization degree, the ion strength adsorbed around the emulsion droplets increased with the increase in ion content, such that the particle size of the emulsion increased with the increase in salinity.
- (5)
- Effect of pH value
Figure 18 shows the results of the particle size distribution of emulsion droplets at different pH values. As shown in Figure 18, emulsion droplets ranged from 0.8 μm to 16.7 μm with an average diameter of 4.31 μm at a pH of 7.11. The emulsion droplet size was smaller and the distribution was smaller when the pH was close to acidic or alkaline.
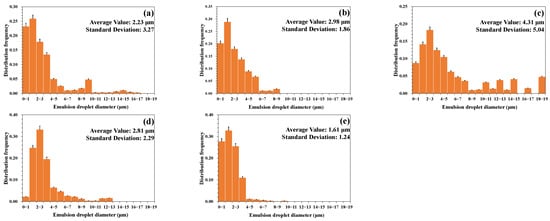
Figure 18.
Effect of pH value on particle size distribution: (a) pH = 5.27; (b) pH = 6.24; (c) pH = 7.11; (d) pH = 8.28; (e) pH = 9.29.
3.2. Analysis of Emulsion Flooding
3.2.1. The Influence of Permeability Contrast
Figure 19 displays the flow distribution of high-permeability and low-permeability pipes under different permeability contrasts.
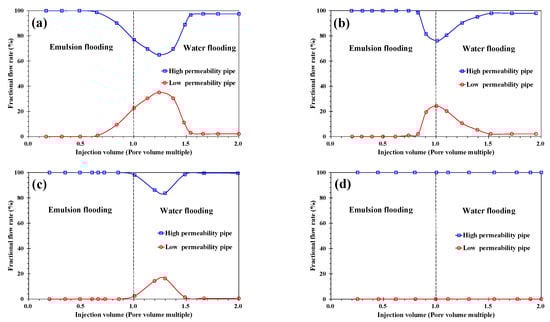
Figure 19.
Influence of permeability contrast on fractional flow: (a) 2.03; (b) 3.24; (c) 5.92; (d) 8.34.
As shown in Figure 19, the ability of the emulsion with 40% water cut to blank off the high permeability tube was demonstrated after the injection of 0.65 PV when the permeability contrast was 2.03, and the low-permeability tube was activated. At 1.54 PV total injection (including emulsion injection of 1 PV), the blocking ability disappeared. The low-permeability pipe was initiated at a permeability contrast of 3.24 after the injection of 0.82 PV. The emulsion shut-off capacity disappeared at a total injection volume of 1.51 PV. The low-permeability pipe was activated when the emulsion was injected with 0.93 PV at a permeability contrast of 5.92, and the emulsion containment capacity disappeared when the total injection was 1.48 PV. At a permeability contrast of 8.34, the emulsion with 40% water cut could not start a low-permeability pipe. With the increase in the permeability contrast, the shut-off capacity of the emulsion with 40% water cut was gradually weakened.
Figure 20 shows the relationship between water cut in the production fluid and the overall oil displacement efficiency under different permeability contrasts.
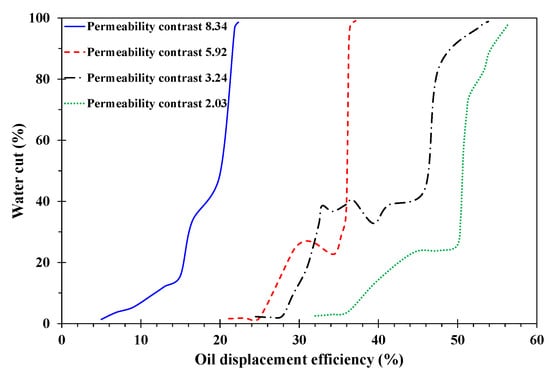
Figure 20.
The relationship between water cut and oil displacement efficiency under different permeability contrasts.
As shown in Figure 20, the oil displacement efficiency with a permeability contrast of 2.03 was the highest, followed by 3.24, 5.94, and 8.34. The water cut in the production was about 40%, and the emulsion could be used to block off at the permeability of 5.92, but not by much. At a permeability contrast of 3.24, the effect of emulsion blocking off was obvious, whereas, at a low water cut, the oil displacement efficiency was obviously lower than the permeability contrast of 2.03.
3.2.2. Effect of Water Cut of Emulsion
Figure 21 displays the flow distribution of high- and low-permeability pipes in the process of emulsion displacement with different water cuts when the permeability contrast was 2.03. As shown in Figure 21, at 30% water cut of the emulsion, the ability of the emulsion to block the high-permeability pipe was demonstrated when the emulsion was injected with 0.9 PV, the low-permeability pipe was activated, and the shut-off capacity of the emulsion disappeared when the total injection was 2.0 PV. At 40% water cut in the emulsion, the low-permeability pipe was activated when the emulsion was injected with 0.65 PV, whereas, at 1.54 PV in total, the emulsion shut-off capacity disappeared. At 50% water cut of emulsion, when injected with 0.6 PV, the emulsion began blocking the high-permeability pipe and started the low-permeability pipe, whereas the emulsion shut-off capacity disappeared when the total injection was 1.16 PV. When the total injection amount was 1.16 PV, the emulsion plugging capacity disappeared to the maximum. At 60% water cut of emulsion, the low-permeability pipe was activated after injection of 0.35 PV of emulsion, and the shut-off capacity of emulsion disappeared after total injection of 0.69 PV. From the fractional flow under the condition of emulsion flooding with different water cuts, it can be seen that, when the water cut of the emulsion increased, the shut-off capacity of the emulsion increased, but the plugging time was shorter. The reverse phenomenon of the fluid entry profile occurred in emulsion flooding with 60% water cut.
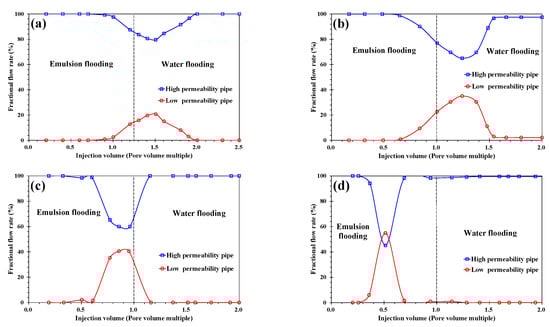
Figure 21.
Influence of water cut of emulsion on fractional flow: (a) 30%; (b) 40%; (c) 50%; (d) 60%.
Figure 22 shows the changes in water cut in the produced liquid and oil displacement efficiency after emulsion flooding plus water flooding under different emulsion water cuts.
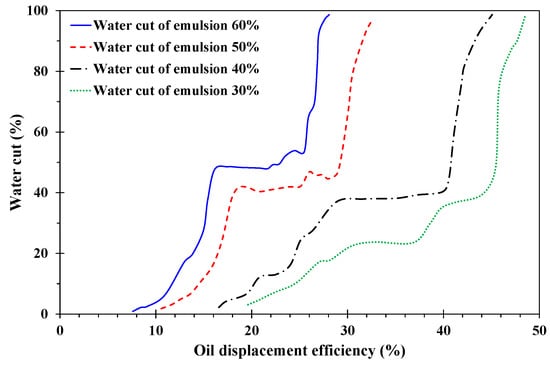
Figure 22.
The relationship between water cut and oil displacement efficiency under different water cuts of emulsion.
As shown in Figure 22, when the water cut of the produced liquid was 40% to 60%, the water cut of the produced liquid increased slowly with the increase in oil displacement efficiency, indicating that the emulsion played a role in plugging the high-permeability layer at this production stage, whereby the emulsion with water cuts of 40% to 60% had the best plugging ability.
4. Numerical Simulation
In order to study the effect of emulsion flooding in heavy oil reservoirs, a numerical simulation was carried out using CMG software. In the process of the simulation, there were certain assumptions to ensure the stability of the emulsion system: (1) the reservoir was at a constant temperature, i.e., percolation occurred under isothermal conditions; (2) there was basically no material transfer between phases; (3) there was only one type of emulsion at any time; (4) there was almost no mass transfer between components.
Table 4 lists the key parameters of the reservoir. As shown in Figure 23, part of the model was taken from the workspace of 48 × 119 × 46 = 262,752 grids. The model used in this paper had 11,250 valid grids. Furthermore, the block sizes of DX, DY, and DZ were 10 m, 10 m, and 2 m, respectively. In addition, Figure 24 displays the relative permeability curves. The development effect of waterflooding and emulsion flooding was compared under the same injection–production parameters and reservoir conditions.
Table 4.
The key parameters of the reservoir.
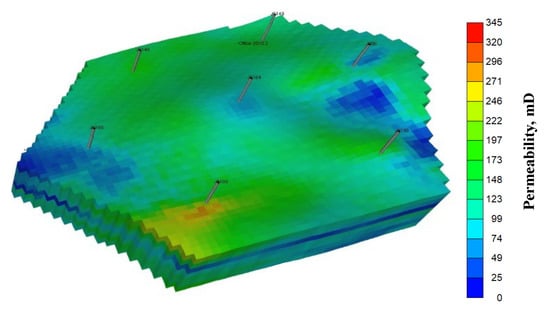
Figure 23.
A 3D diagram of the theoretical model of emulsion flooding.
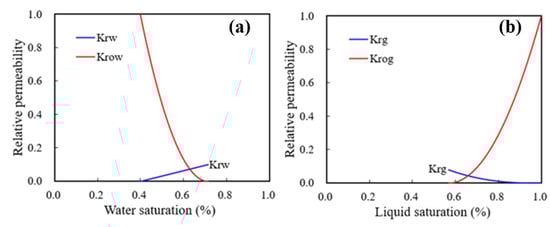
Figure 24.
Relative permeability curves: (a) relative permeability of oil–water phase; (b) relative permeability of gas–liquid phase.
Figure 25a shows the change in water cut of waterflooding and emulsion flooding with time. Figure 25a reveals that the water cut growth rate of emulsion flooding slowed down when the water cut was between 40% and 60%, indicating that the emulsion played a role in plugging the high-permeability channel during this period, as seen in previous experimental results. Figure 25b shows the recovery of water flooding and emulsion flooding, where it can be seen that the oil recovery of emulsion flooding was 13% higher than that of waterflooding.
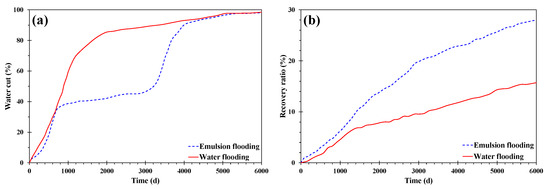
Figure 25.
Water cut curve and recovery curve of water flooding and emulsion flooding: (a) water cut curve; (b) recovery ratio curve.
5. Conclusions
- (1)
- A higher temperature facilitated emulsification, but a stable emulsion could be formed at temperatures below 60 °C. When the water cut was higher than 60%, emulsification was incomplete, and a lower water cut led to a more stable emulsion. A higher mineralization degree hindered emulsification, and emulsions formed beyond 10,000 mg/L were difficult to stabilize. When the pH was about 7, and the stability of the emulsion was poor in contrast to an acid or alkali environment.
- (2)
- A higher temperature led to a smaller particle size of the emulsion and a more uniform distribution. A lower water cut led to a smaller particle size of the emulsion and a more uniform distribution. A higher mineralization degree led to a larger particle size of the emulsion and a wider distribution range. A more neutral pH value led to a larger particle size of the emulsion and a wider distribution range.
- (3)
- In the emulsion flooding of a heterogeneous heavy oil reservoir, after the permeability contrast reached a certain value, the W/O emulsion lost its ability to block the high-permeability channel.
- (4)
- When the water cut was more than 60%, the emulsion had high viscosity and obvious sweep ability, but its stability worsened; when the water cut was less than 40%, the emulsion was stable, but the viscosity was low and the plugging capacity was insufficient. Therefore, in order to prolong the stable production time of emulsions, it was necessary to maintain the water cut at 40% and 60%.
Author Contributions
K.W. designed the experiments and wrote the main manuscript text; B.W. conducted the numerical simulation; J.Z. (Jiu Zhao) and C.W. revised the main manuscript text; J.C. and P.L. (Peng Liu) designed and completed all the experiments; J.Z. (Jipeng Zhang) collated and analyzed all the experimental data and prepared all the figures. As the corresponding author, P.L. (Pengcheng Liu) made substantial contributions to the conceptualization/design of the work and approved the final version to be published. The authors agree to be accountable for all aspects of the work in ensuring that questions related to the accuracy or integrity of any part of the work are investigated. All authors have read and agreed to the published version of the manuscript.
Funding
This research was funded by the National Science Foundation of China (51774256).
Institutional Review Board Statement
Not applicable.
Informed Consent Statement
Not applicable.
Data Availability Statement
The data presented in this study are available from the corresponding author upon reasonable request.
Conflicts of Interest
The authors declare no conflict of interest.
References
- Li, J.N.; Liu, Q. On the Position of Heavy Oil in Energy in the 21st Century. Oil Gas Field Surf. Eng. 2000, 19, 4–6. [Google Scholar]
- Shu, Q.L.; Zheng, W.G.; Zhang, Z.P.; Yang, X.M.; Wu, W.; Wu, G.H.; Zhao, H.Y.; Zheng, X. Chemical Viscosity Reduction Compound Flooding Technology for Low-Efficiency Thermal Recovery/Water Flooding Heavy Oil Reservoirs. Pet. Geol. Recovery Effic. 2021, 28, 12–21. [Google Scholar]
- Wang, J.; Dong, M. Simulation of O/W Emulsion Flow in Alkaline/Surfactant Flood for Heavy Oil Recovery. J. Can. Pet. Technol. 2010, 49, 46–52. [Google Scholar] [CrossRef]
- Rashid, Z.; Wilfred, C.D.; Gnanasundaram, N.; Arunagiri, A.; Murugesan, T. A comprehensive review on the recent advances on the petroleum asphaltene aggregation. J. Pet. Sci. Eng. 2019, 176, 249–268. [Google Scholar] [CrossRef]
- Afra, S.; Nasr, H.A.; Socci, D.; Cui, Z. Green phenolic amphiphile as a viscosity modifier and asphaltenes dispersant for heavy and extra-heavy oil. Fuel 2018, 220, 481–489. [Google Scholar] [CrossRef]
- Daaou, M.; Larbi, A.; Martinez, B.; Rogalski, M. A comparative study of the chemical structure of asphaltenes from algerian petroleum collected at different stages of extraction and processing. J. Pet. Sci. Eng. 2016, 138, 50–56. [Google Scholar] [CrossRef]
- Umar, A.A.; Saaid, I.B.; Sulaimon, A.A.; Pilus, R.B.M. A review of petroleum emulsions and recent progress on water-in-crude oil emulsions stabilized by natural surfactants and solids. J. Pet. Sci. Eng. 2018, 165, 673–690. [Google Scholar] [CrossRef]
- Pu, W.F.; He, W.; Lu, J.Y.; Chan, J.J.; Li, S.Y. Stability Analysis of Emulsions with Different Moisture Content Magnetic Resonance. Oilfield Chem. 2022, 39, 529–535. [Google Scholar]
- Huang, B.; Nan, X.H.; Fu, C.; Zhu, Y.M.; Zhang, L.; Guo, W.; Wang, S.Q. Study on the macroscopic coalescence mechanism of oil droplets and the microscopic interaction between oil film molecules. Spec. Oil Gas Reserv. 2022, 156, 1–10. [Google Scholar]
- Bai, J.M. Study on the Effect of Heavy Oil Composition and Emulsifier on Oil–Water Interface Properties. China Univ. Pet. 2009, 6, 124–148. [Google Scholar]
- Zhao, Y.L.; Kang, W.L.; Yin, X.; Geng, J.; Tang, X.; Yang, L.; Yuan, H. Relationship between Stability of Changqing Water-in-Oil Emulsion and Asphaltene Content. Acta Pet. Sin. 2018, 34, 592–599. [Google Scholar] [CrossRef]
- Xu, M.J.; Li, M.Y.; Peng, B.; Wu, Z.L.; Lin, M.Q.; Guo, J.X. Relationship between interfacial shear viscosity of resins and asphaltenes and emulsion stability in water-in-oil emulsions. Acta Pet. Sin. 2007, 3, 107–110. [Google Scholar]
- Guo, J.X.; Wu, Z.L.; Li, M.Y.; Yin, Y. Effect of interfacial shear viscosity on stability of crude oil emulsion. Fine Chem. 2003, 11, 660–662. [Google Scholar]
- Ismail, I.; Kazemzadeh, Y.; Sharifi, M.; Riazi, M.; Malayeri, M.R.; Cortés, F. Formation and stability of W/O emulsions in presence of asphaltene at reservoir thermodynamic conditions. J. Mol. Liq. 2020, 299, 112125. [Google Scholar] [CrossRef]
- Kumar, K.; Nikolov, A.D.; Wasan, D.T. Mechanisms of stabilization of water-in-crude oil emulsions. Ind. Eng. Chem. Res. 2001, 40, 3009–3014. [Google Scholar] [CrossRef]
- Nour, A.H.; Suliman, A.; Hadow, M.M. Stabilization mechanisms of water-in-crude oil emulsions. Appl. Sci. 2008, 8, 1571–1575. [Google Scholar] [CrossRef]
- Czarnecki, J. Stabilization of water in crude oil emulsions. Fuel 2009, 23, 1253–1257. [Google Scholar] [CrossRef]
- Pal, R. Rheology of simple and multiple emulsions. Curr. Opin. Colloid Interface Sci. 2011, 16, 41–60. [Google Scholar] [CrossRef]
- Abdurahman, N.H.; Rosli, Y.M.; Azhari, N.H.; Hayder, B. Pipeline transportation of viscous crudes as concentrated oil-in-water emulsions. J. Pet. Sci. Eng. 2012, 90, 139–144. [Google Scholar] [CrossRef]
- Binner, E.R.; Robinson, J.P.; Silvester, S.A.; Kingman, S.; Lester, E. Investigation into the mechanisms by which microwave heating enhances separation of water-in-oil emulsions. Fuel 2014, 116, 516–521. [Google Scholar] [CrossRef]
- Hempoonsert, J.; Tansel, B.; Laha, S. Effect of temperature and pH on droplet aggregation and phase separation characteristics of flocs formed in oil-water emulsions after coagulation. Colloids Surf. A Physicochem. Eng. Asp. 2010, 353, 37–42. [Google Scholar] [CrossRef]
- Martinez-Palou, R.; Ceron-Camacho, R.; Chavez, B.; Vallejo, A.A.; Villanueva-Negrete, D.; Castellanos, J.; Karamath, J.; Reyes, J.; Aburto, J. Demulsification of heavy crude oil-in-water emulsions: A comparative study between microwave and thermal heating. Fuel 2013, 113, 407–414. [Google Scholar] [CrossRef]
- Zaki, N.N. Surfactant stabilized crude oil-in-water emulsions for pipeline transportation of viscous crude oils. Colloids Surf. A Physicochem. Eng. Asp. 1997, 125, 19–25. [Google Scholar] [CrossRef]
- Binks, B.P.; Rocher, A. Effects of temperature on water-in-oil emulsions stabilised solely by wax microparticles. J. Colloid Interface Sci. 2009, 335, 94–104. [Google Scholar] [CrossRef] [PubMed]
- Wang, Z.; Lin, X.; Rui, Z.; Xu, M.; Zhan, S. The role of shearing energy and interfacial Gibbs free energy in the emulsification mechanism of waxy crude oil. Energies 2017, 10, 721. [Google Scholar] [CrossRef]
- Djenouhat, M.; Hamdaoui, O.; Chiha, M.; Samar, M.H. Ultrasonication-assisted preparation of water-in-oil emulsions and application to the removal of cationic dyes from water by emulsion liquid membrane: Part 2. Permeation and stripping. Sep. Purif. Technol. 2008, 63, 231–238. [Google Scholar] [CrossRef]
- Vilasau, J.; Solans, C.; G’omez, M.J.; Dabrio, J.; Mújika-Garai, R.; Esquena, J. Stability of oil-in-water paraffin emulsions prepared in a mixed ionic/nonionic surfactant system. Colloids Surf. A Physicochem. Eng. Asp. 2011, 389, 222–229. [Google Scholar] [CrossRef]
- An, F.; Bai, J.; Qian, G.L. Study on the stability of W/O emulsion of Liu hua heavy oil. Petro-Chem. Equip. 2013, 16, 19–22. [Google Scholar]
- Yang, F.; Li, C.X.; Lin, M.Z.; Guo, G. Effect of emulsification conditions on rheology of O/W heavy oil emulsion. J. Petrochem. Univ. 2009, 22, 51–54. [Google Scholar]
- Yu, R.Y. Study on relationship between moisture content and stability of crude oil emulsion. Chem. Eng. Des. Commun. 2016, 42, 150. [Google Scholar]
- Duan, M.; Tao, J.; Fang, S.W.; Shi, P.; Li, K.; Song, X.; Tao, T. Effect of pH value on the stability of crude oil emulsion. Chem. Ind. Eng. Prog. 2015, 34, 1853–1857. [Google Scholar]


Publisher’s Note: MDPI stays neutral with regard to jurisdictional claims in published maps and institutional affiliations. |
© 2022 by the authors. Licensee MDPI, Basel, Switzerland. This article is an open access article distributed under the terms and conditions of the Creative Commons Attribution (CC BY) license (https://creativecommons.org/licenses/by/4.0/).