Article

Water Modification by Cold Plasma Jet with Respect to Physical and Chemical Properties

by
Panagiotis Svarnas
1,*,
Michael Poupouzas
1,
Konstantia Papalexopoulou
1,2,
Electra Kalaitzopoulou
3,
Marianna Skipitari
3,
Polyxeni Papadea
3,
Athina Varemmenou
4,
Evangelos Giannakopoulos
5,
Christos D. Georgiou
3,
Stavroula Georga
2 and
Christoforos Krontiras
2
1
High Voltage Laboratory, Department of Electrical and Computer Engineering, University of Patras, Rion, 26 504 Patras, Greece
2
Division of Condensed Matter, Department of Physics, University of Patras, Rion, 26 504 Patras, Greece
3
Department of Biology, University of Patras, Rion, 26 504 Patras, Greece
4
Department of Medicine, University of Patras, Rion, 26 504 Patras, Greece
5
Department of Agriculture, School of Agricultural Sciences, University of Patras, 30 200 Messolonghi, Greece
*
Author to whom correspondence should be addressed.
Appl. Sci. 2022, 12(23), 11950; https://doi.org/10.3390/app122311950
Submission received: 3 November 2022 / Revised: 20 November 2022 / Accepted: 21 November 2022 / Published: 23 November 2022
(This article belongs to the Special Issue Recent Advances in Atmospheric-Pressure Plasma Technology, 2nd Volume)

Abstract

:
This work is devoted to unbuffered and buffered water treatment by means of atmospheric pressure cold plasma of electrical discharges. The interest in the activation of these two liquids by plasma-induced, gaseous-phase chemistry ranges over a wide area of potential applications and interdisciplinary scientific fields. These include biology, medicine, sanitation, environmental restoration, agriculture, etc. Atmospheric pressure cold plasma is here produced in the form of a plasma jet and set into physical contact with the liquid specimens. The operational window of the treatment, in terms of plasma reactivity, is determined by means of UV-NIR optical emission spectroscopy, and the treated liquids are probed in a variety of respects. Evaporation rate, temperature, acidity and basicity, resistivity, and oxidation-reduction potential are measured as a function of the treatment time, either in-situ or ex-situ. The formation of principal reactive oxygen species, i.e., OH, H2O2 and O 2 , with a plasma jet mean power lower than 400 mW, is eventually demonstrated and their concentration is measured with original methods borrowed from the biology field. The experimental results are linked to reports published over the last ten years, which are compiled in a brief but meaningful review.

1. Introduction

Interest continues to grow worldwide in weakly ionized, low temperature, atmospheric pressure plasmas [1]. Plasmas generated and maintained at atmospheric pressure enjoyed a renaissance in the last decades mostly driven by the employment of dielectric-barrier discharges (DBDs) and plasma jets (DBD-based or not) as sources of high-density, reactive species. Such plasmas avoid the restrictions imposed by costly, cumbersome vacuum chambers and by destructively high temperatures, extending their applicability in the fields of defense [2], electronics [3], material science [4], environmental health [5], aviation [6], biomedicine [7], agriculture [8], food industry [9], etc. However, despite their apparent engineering simplicity, these systems vastly complicate the plasma physics and chemistry involved, particularly during their incidence on liquid-phase targets. The prominent interest in the latter case is prompted by attempts to interpret fundamental physicochemical phenomena along the plasma–liquid interface [10,11,12,13] and to properly exploit the properties of the plasma activated liquids for tailored applications [14,15,16].
Among the various liquids, a special focus has been given on the water treatment by atmospheric pressure cold plasmas with respect to remediation [17], sterilization [18], fertilizer alternatives [19], dentistry [20], food preservation [21], nanoscience [22], etc., and the concept has already been commercialized (e.g., VitalFluid BV). Although it is widely accepted that, in most applications, the plasma induced effects are mainly mediated via reactive oxygen and nitrogen species (ROS and RNS, respectively; cumulatively designated RONS), influencing redox regulated processes [23], detailed consideration of the physical and chemical impacts of the plasma species on the liquids is a prerequisite for any targeted application. This need is yet more pressing when living specimens are involved. Such dedicated, worthy representative studies, unveiling the potential plasma-induced modifications of water (and other liquids too), are laid out in Appendix A in chronological order over the last ten years. The works cited therein denote the wide interest in the topic of plasma-based modification of water, as well as the divergence of setups and diagnostic methods used in various case studies.
However, despite the intensive research investments during the recent decennia, the field is plagued by controversies and gaps in knowledge, which might restrict further progress [24]. Within this context, the present work is an attempt to enrich the available data by communicating experimental results acquired with one of the most popular plasma types employed in liquid treatment. Accordingly, an atmospheric pressure plasma jet, consuming mean power less than 400 mW, is optimized in terms of reactive species formation when the carrier gas is argon (Ar), and this optimal operational window is applied to the activation of demineralized, doubled-distilled water (DDW) and phosphate-buffered saline (PBS). The dynamic evolution of the evaporation rate, temperature, acidity and basicity, resistivity, and oxidation-reduction potential are recorded. Finally, the formation of principal ROS, i.e., OH, H2O2 and O 2 , is demonstrated and their concentration is measured by means of strict protocols that have not previously tried on plasma-treated liquids.

2. Experimental Setup and Materials

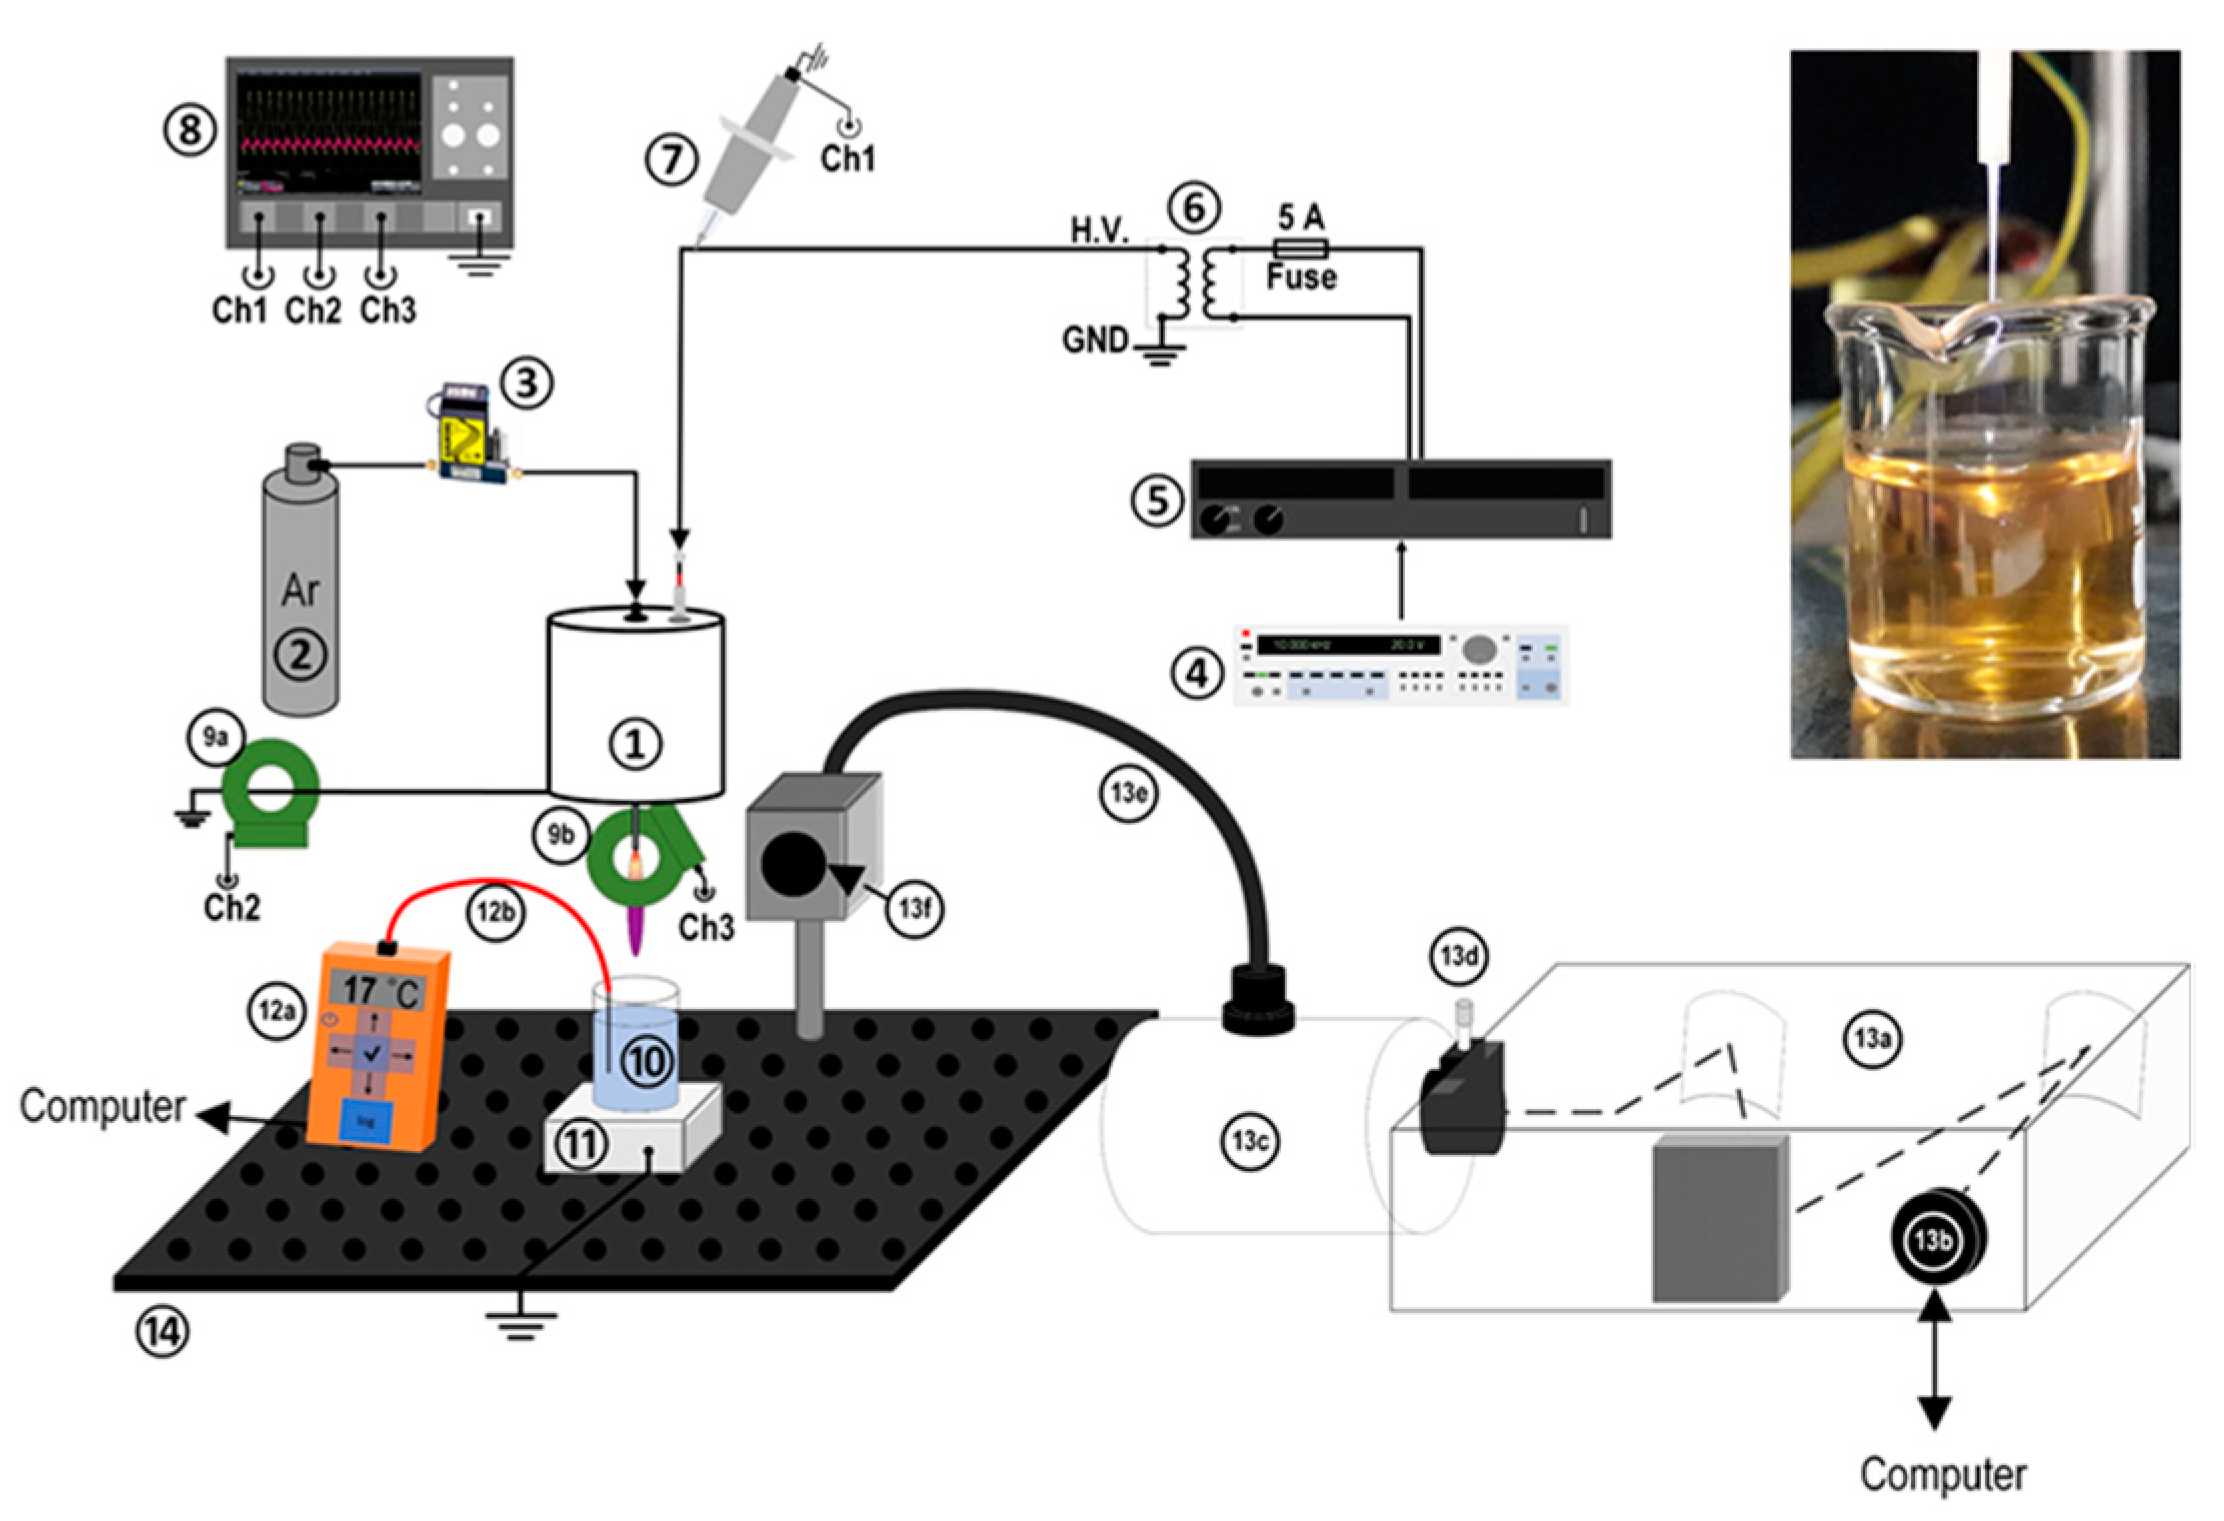
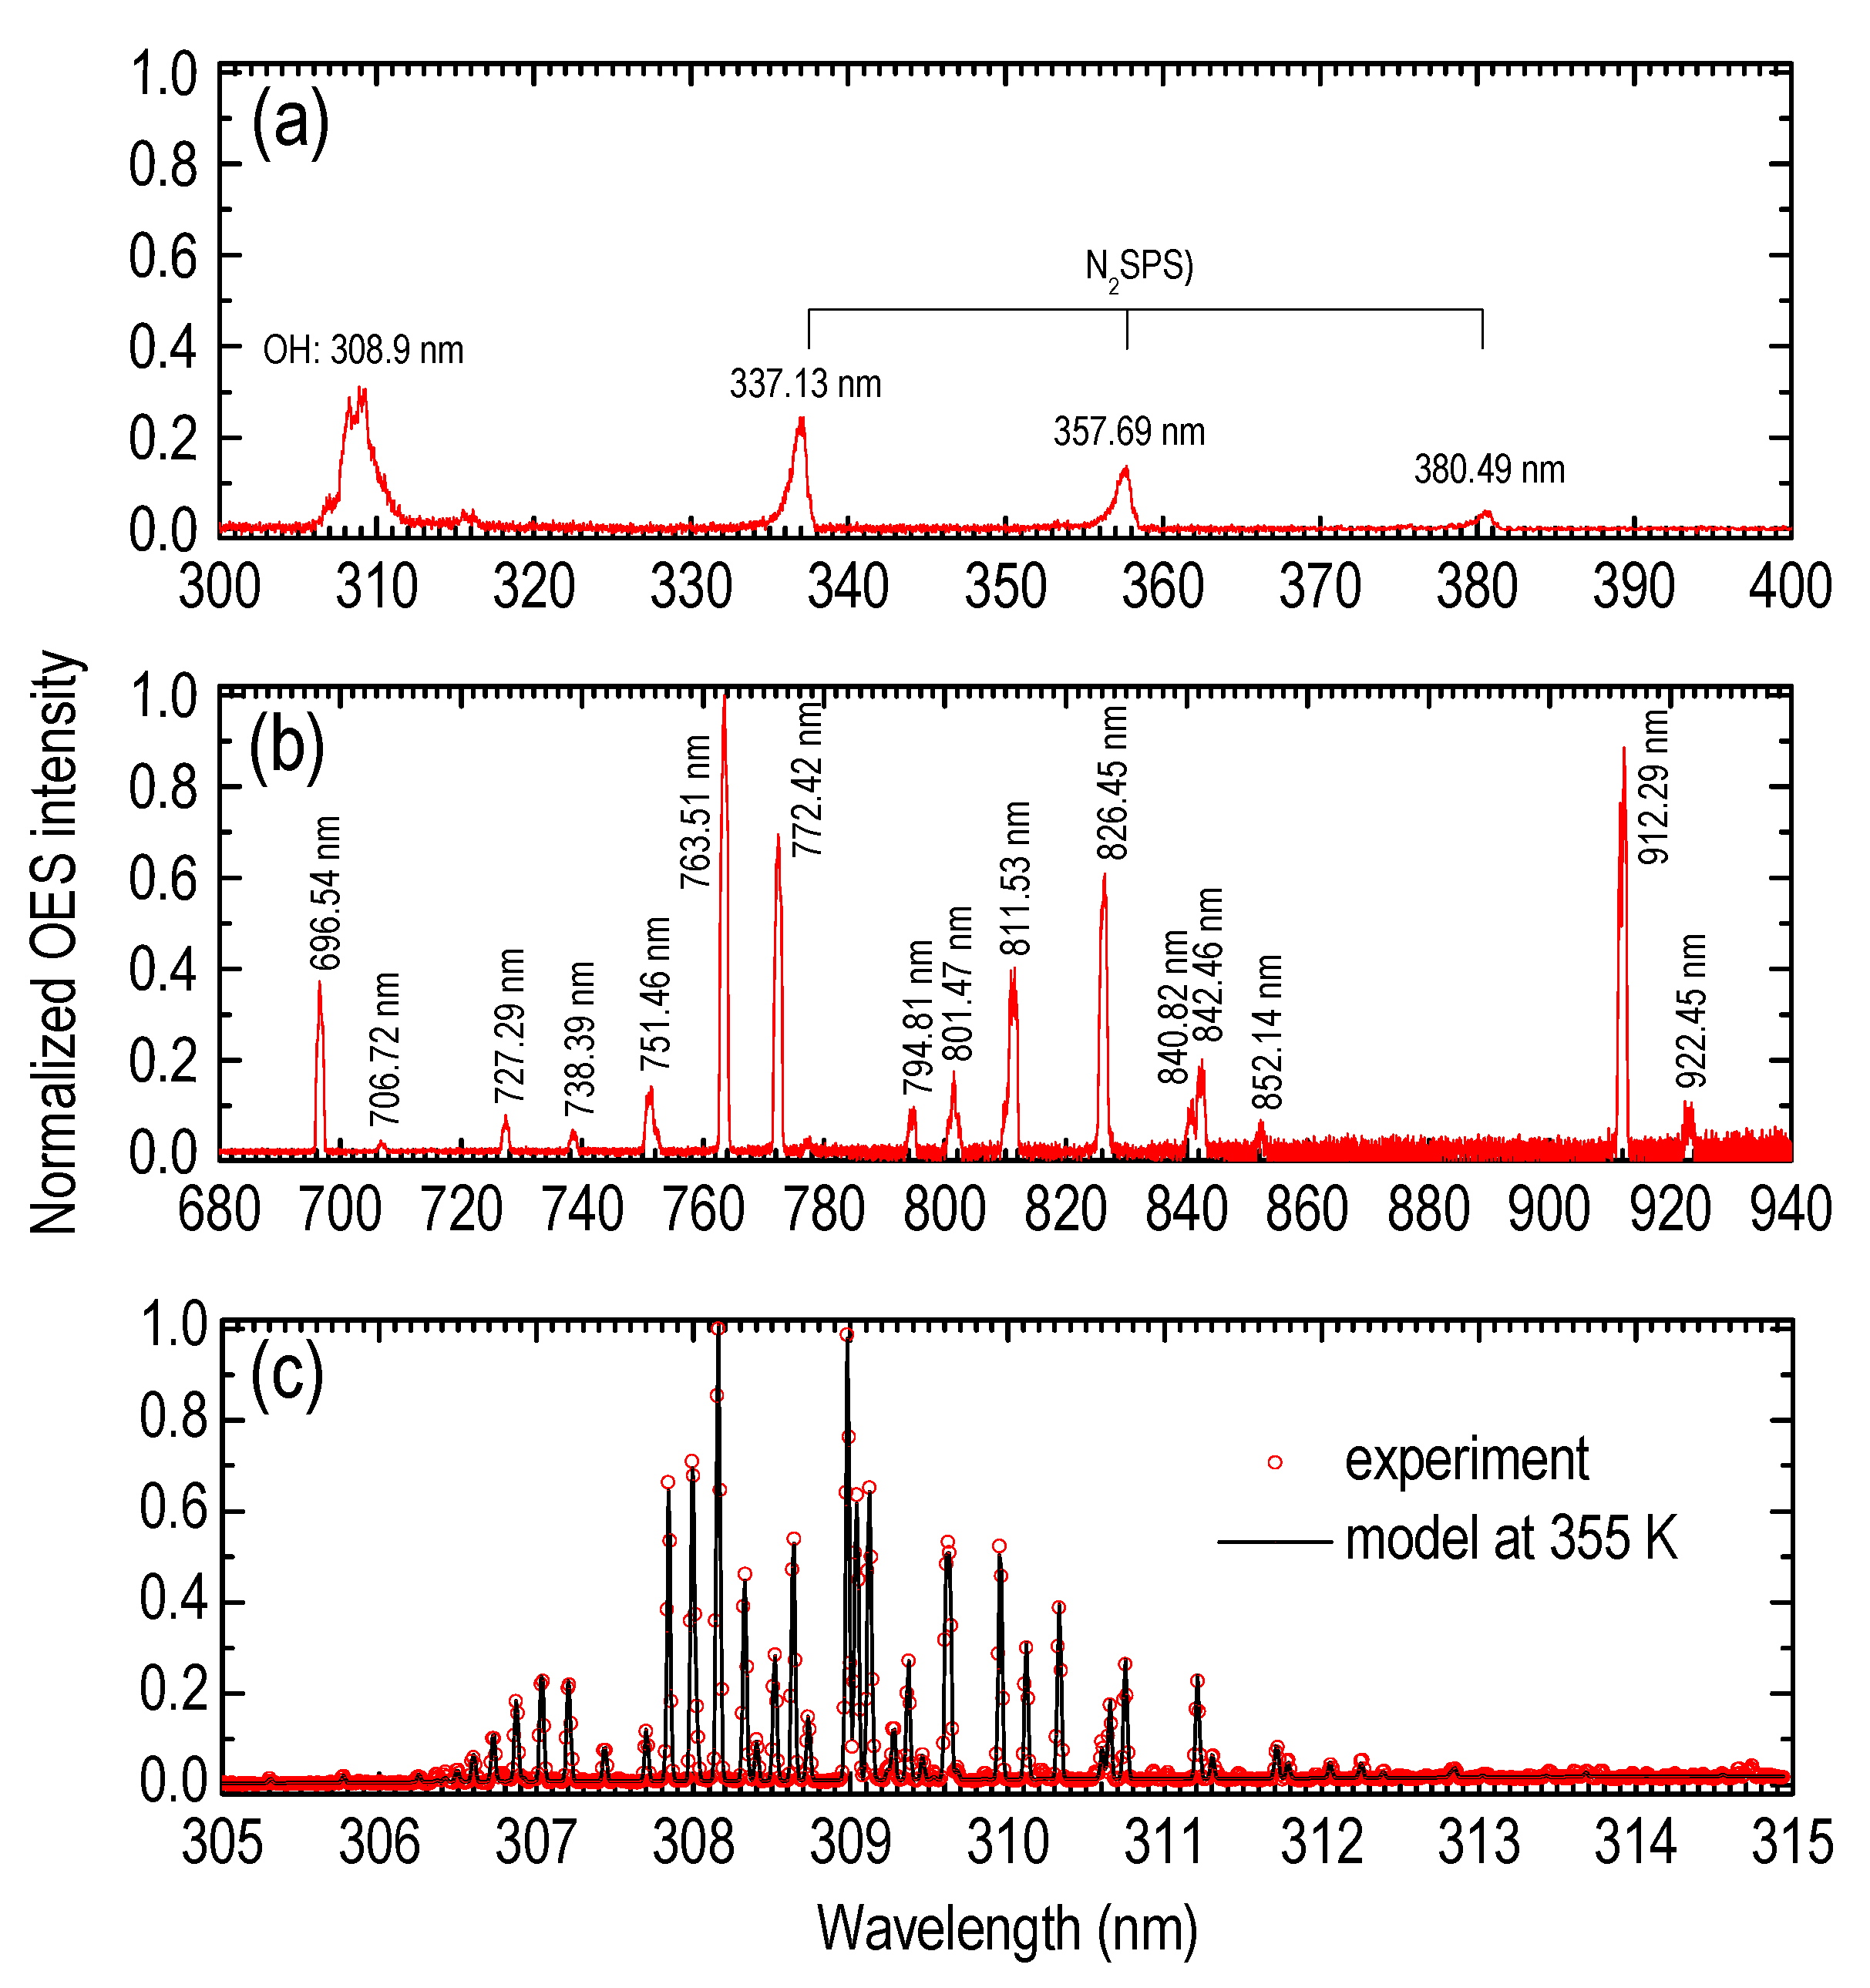
2.1. Plasma Setup and Diagnostics

Figure 1 depicts the concept of the experimental setup used for the plasma production and characterization. In the caption of the same figure, the distinct components are described.
The design of the plasma jet reactor is based on a coaxial DBD configuration. This reactor has been efficiently employed in the past for bacterium [25] and cancer cell [26] inactivation, human skin treatment [27], liposome disruption [28], and other studies in the field of biomedicine. It comprises: (i) a capillary alumina tube (Øout = 2.5 mm; Øin = 1.14 mm; length of 76 mm) acting as the dielectric barrier; (ii) a filamentary internal electrode (made of tungsten; Ø = 0.125 mm) inserted into the tube and terminated 20 mm behind the tube orifice; (iii) a cylindrical hollow external electrode (made of brass; Øout = 10 mm; length of 10 mm) tightly fixed around the tube. Its outer edge is placed 20 mm behind the tube orifice forming thus a 10 mm in length coaxial DBD with the internal electrode. The internal electrode is the driven one and the external is grounded directly. The power supply is designed by PlasmaHTec® (plasmahtec.com, accessed on 20 November 2022), and it consists of a signal generator (based on direct signal synthesis; DDS), a power amplifier of low harmonic distortion, and a step-up, ferrite-core, high voltage transformer of special design. The specifications refer to sinusoidal waveform, rated voltage 12 kV peak-to-peak, rated power 210 W, and frequency range 1–20 kHz. The working gas is high purity argon (Ar; 99.999%) and it is introduced into the dielectric tube through a digital mass flow controller (0–5 slm).
The voltage and current waveforms are continuously monitored during the experiments for consistency reasons (voltage divider: 1000:1, DC – 75 MHz; current monitor: 400 Hz–250 MHz; oscilloscope: 400 MHz, 5 GSamples s−1). Two identical current transformers are used for recording both the DBD and the plasma jet currents, as it is shown in Figure 1. At the same time, the mean power delivered to the system is measured as the mean value of the voltage-to-current product over successive periods. Thus, the DBD and the plasma jet consumed mean powers are distinguished and quantified. More concretely, the instantaneous power v ( t ) × i ( t ) is numerically integrated over 3 voltage cycles T and 30 such samples are averaged. The current i ( t ) stands for either the DBD current i DBD ( t ) or the jet current i JET ( t ) . Formulas (1) and (2) summarize the process.
P DBD ¯ = 1 30 1 30 [ 1 3 T 0 3 T v ( t ) × i DBD ( t ) d t ]          
P JET ¯ = 1 30 1 30 [ 1 3 T 0 3 T v ( t ) × i JET ( t ) d t ]    
Figure 2 provides representative waveforms of the corresponding quantities. The physical interpretation of these signals has been reported previously [29].
The optical emission of the plasma is probed with a 0.25-m imaging spectrograph equipped with two motorized gratings; one holographic (2400 grooves mm−1; blaze wavelength 250 nm; 180–700 nm) and one ruled (600 grooves mm−1; blaze wavelength 400 nm; 250–1300 nm). The photodetector is a linear charge-coupled device (200–1100 nm). A high-grade fused silica optical fiber is mounted on an axial translator for side-on observations. A fused silica lens, 19 mm focal length and F/1.7, collects light along an about 15 mm zone downstream of the reactor orifice. Alternatively, high resolution optical emission spectra are acquired with a 1-m monochromator equipped with a holographic grating (170–750 nm; 2400 grooves mm−1) and a photoelectron multiplier tube (185–900 nm). In both cases, the optical fiber is optimally aligned with the spectrometers using suitable F-number matchers. The assembly of the optical components is calibrated in terms of absolute wavelength and relative spectral efficiency, using Hg(Ar) and quartz–tungsten–halogen lamps, respectively. Rotational distributions of probe molecules are numerically constructed and fitted to the experimental ones with a home-built software [30].

2.2. Basic Characterization of the Liquids

The probed liquids in this work are lab-prepared, demineralized, double distilled water (DDW) and phosphate-buffered saline (PBS). Four different physicochemical parameters are studied. (i) Temperature: it is measured in-situ (during treatment) or ex-situ (before/after treatment) by employing a non-invasive technique, i.e., a GaAs-crystal based, optical thermometer (LumaSense Technologies Inc.; Santa Clara, CA, USA) [31]. The data are collected by a datalogger, with recommended standard 232 communication, and time resolution of 0.5 s. (ii) Conductivity: it is measured using a bench meter (Mettler–Toledo; FP30) equipped with a probe with an integrated temperature sensor (LE703); (iii) pH: it is measured using a bench meter (Mettler–Toledo; FP20) equipped with a pH micro-probe (LE422). (iv) Redox potential: it is measured by employing the same bench meter as for pH, but with an appropriate redox electrode (Mettler–Toledo; LE501). Quantities (ii)–(iv) are reduced to the actual temperature of the liquid, with the latter to be measured within the first 10 s before/after plasma treatment. Conductivity and pH meters are both calibrated before any series of experiments, using standard liquids provided by Mettler–Toledo (solution of σ = 1413 μS cm−1; buffers of pH = 4.0, 7.0, and 9.2).
Evaporation tests are realized with micro-balance measurements (Highland; HCB 123; readability 0.001 g; repeatability 0.002 g). The initial, i.e., the before plasma treatment, quantity of the water is fixed at 4.5 ± 0.007 g. As will be seen in the results below, liquid evaporation indeed takes place during plasma treatment; however, even for a prolonged time (30 min), it does not exceed a percentage of about 15%. Accordingly, the present treatment protocol makes a compromise and does not include any refill which could disturb the experiment.
It is noted that all experimental points in this work are obtained cumulatively, i.e., for each series of experiments, a water specimen of 4.5 ± 0.007 g is used and subjected to the process for successive time intervals. At the end of each interval, the liquid is probed ex-situ and then brought back to the process immediately. In this way, the study of the cumulative action of the plasma on a specific specimen is secured for each series of experiments. The liquid is inserted in a standard 10 mL beaker, while the distance between the orifice of the plasma reactor and the surface of the liquid is set at about 25 mm. The argon physical flow and the electro–hydrodynamic effects [32] induced by the plasma jet itself provide adequate agitation of the liquid specimen (see inset in Figure 1).

2.3. ROS Detection in the Liquids

Apart from the basic liquid characterization, before and after the plasma treatment, various reagents, standard, and special solutions are used for the detection of principal chemical radicals in both the DDW and the PBS. The materials and the procedures are given below in detail.
Reagents
-
Hydroethidine (HE; Fluka, Buchs, Switzerland; cat. no. 37291).
-
Dimethyl sulfoxide (DMSO, 99.9% or 14 M; ChemLab, Zedelgem, Belgium; cat. no. CL00.0422).
-
Hydrochloric acid (HCl, 37% w/w or 12 M; ChemLab, Zedelgem, Belgium; cat. no. CL00.0310).
-
2-hydroxy terephthalate (2-OH-TPA, 98%; TCI, Portland, USA; cat. no. H1385).
-
2-hydroxy ethidium (2-OH-E+, synthesized as described elsewhere [33]).
-
Sodium hydroxide (NaOH, pellets; Merck, New Jersey, USA; cat. no. 106498).
-
Phosphate Buffered Saline (PBS powder, for preparing 1 L, pH 7.4; Sigma-Aldrich, Burlington, MA, USA; P3813).
-
Terephthalic acid (TPA, 98+%; Alfa Aesar, Kandel, Germany; cat. no. A12527).
-
DDW, purified by a Milli-Q system (Millipore, Massachusetts, USA).
-
Acetonitrile (ACN, HPLC grade; Sigma-Aldrich, Burlington, MA, USA; cat. no. 34851).
-
Chloroform (CHCl3; Merck, New Jersey, USA; cat. no. 1.02445).
-
Methanol (MetOH, ≥99.9%; Merck, New Jersey, USA; cat. no. 106009).
Standard solutions
-
5 mM TPA, pH 7: Dissolve 4.15 mg TPA in 1 mL 0.1 M NaOH and ddH2O is added to 5 mL final volume. Adjust pH to 7, by dropwise addition of 0.5 M HCl. Long storage at −20 °C.
-
1 M DMSO: prepare 1 mL by mixing 71.4 μL 14 M DMSO with 928.6 μL DDW.
-
0.4 M HCl: prepare 2 mL by mixing 66.7 μL 12 M HCl with 1933.3 μL DDW.
-
5 M NaOH: dissolve 0.4 g in DDW to final 2 mL.
-
20 mM HE: dissolve 6.3 mg HE in 1 mL 0.4 M HCl. Long storage at −20 °C.
-
PBS, pH 7: mix the content of a PBS bag with 1 L DDW.
-
1 M DMSO in PBS, pH 7: prepare 1 mL by mixing 71.4 μL 14 M DMSO with 928.6 μL PBS.
-
5 mM 2-OH-TPA, pH 7: dissolve 1.4 mg HTPA in 0.3 mL 0.1 M NaOH and add DDW to final 1.5 mL. The pH is neutralized to 7, by addition of about 10 μL 1 M HCl. Long storage at −20 °C.
-
0.2 mM 2-OH-E+ (in 0.4 M HCl) prepared from synthetic 2-OH-E+ as described elsewhere [33]. Long storage at −20 °C.
-
50 mM Pi buffer, pH 7.8: dissolve 0.45 g Νa2HPO4.2H2O in about 48 mL DDW, final 50 mL DDW, adjust to pH 7.8 (dropwise with 1 M HCl) and bring to final 50 mL with DDW.
TPA-based ROS detection solutions: for OH and H2O2
-
100 μM TPA, pH 7: prepare 8 mL by mixing 0.16 mL 5 mM TPA with 7.84 mL DDW, and if needed adjust pH to 7.
-
100 μM TPA + 50 mM DMSO, pH 7: prepare 8 mL by mixing 0.16 mL 5 mM TPA with 0.4 mL 1 M DMSO and 7.44 mL DDW and, if needed, adjust pH to 7.
-
100 μM TPA in PBS, pH 7: prepare 8 mL for each experiment by mixing 0.16 mL 5 mM TPA with 7.84 mL PBS and, if needed, adjust pH to 7.
-
100 μM TPA + 50 mM DMSO in PBS, pH 7: prepare 8 mL for each experiment by mixing 0.16 mL 5 mM TPA with 0.4 mL 1 M DMSO and 7.44 mL PBS and, if needed, adjust pH to 7.
HE-based ROS detection solutions: for O 2
-
100 μM HE, pH 7: prepare 8 mL for each experiment by mixing 40 μL 20 mM HE with 7.96 mL DDW. Adjust pH to 7 by dropwise addition of 5 M NaOH.
-
100 μM HE in PBS, pH 7: prepare 8 mL for each experiment by mixing 40 μL 20 mM HE with 7.96 mL PBS and, if needed, adjust pH to 7.
Detection of OH and H2O2
OH and H2O2 are measured in the 8-mL ROS (detecting) solutions containing TPA (specific probe for OH), TPA+DMSO (DMSO is specific scavenger for OH; serves as plasma-generated OH elimination control), TPA in PBS, and TPA+DMSO in PBS, which are each placed in 10-mL glass beakers. After plasma exposure, OH formation in these solutions is measured by the fluorescence units (FU) of 2-OH-TPA (resulting from the reaction of 1 mole OH with 1 mole TPA; DMSO is used as negative control showing that it eliminates OH and cancels FU from 2-OH-TPA not formed due to the unavailability of OH). FU are measured at ex/em 315/425 nm (using a Shimadzu spectrofluorometer, model RF-1501, set at a 10 nm slit width and at low sensitivity) [34,35]. Specifically, in 0.3 mL fractions of each undiluted TPA-based ROS solution, 2-OH-TPA FUs are converted to molarity against the FU of 1 μM synthetic 2-OH-TPA. The TPA-containing ROS solutions are also tested (diluted at 4,000- to 16,000-fold) for H2O2 formation by a sensitive ferrous oxidation–xylenol orange (FOX) photometric assay, described elsewhere [36].
Detection of O 2
O 2 is measured in the 8-mL ROS solutions containing HE and HE in PBS, which are each placed in 10-mL glass beakers. After plasma exposure, the content of the beakers is tested for O 2 formation via the quantification of 2-OH-E+ (generated by the reaction of 2 moles O 2 with 1 mole HE). 2-OH-E+ is extracted from 1 mL of each HE-based ROS solution by a mixture of 333 μL 100% ACN and 1.333 mL CHCl3, and vacuum dried in centrifugal vacuum concentrator (CHRIST; model RVC 2–18), connected to a vacuum pump (KNF; N 820.3 FT.18). The resulting red pellet is solubilized in 50 μL CHCl3:MetOH 70%:30% and 2 μL are placed in an HPTLC silica gel plate (Merck 1.05644.0001), as described elsewhere [37], in order to verify and quantify 2-OH-E+ production. Following another independent methodology for O 2 quantification, the remaining 48 μL are vacuum-dried and resolubilized in 300 μL 50 mM Pi buffer, pH 7.8, and its FU are measured at ex/em 480/575 nm (using a Shimadzu spectrofluorometer, model RF-1501, set at a 10 nm slit width and at high sensitivity) as described elsewhere [33]. 2-OH-E+ is quantified via its fluorescence quenching after ± treatment with the horseradish peroxidase (HRP)/H2O2 system. 2-OH-E+ FU (after plasma exposure) are converted to molarity against the FU of a known concentration of synthetic 2-OH-E+.

3. Results and Discussion

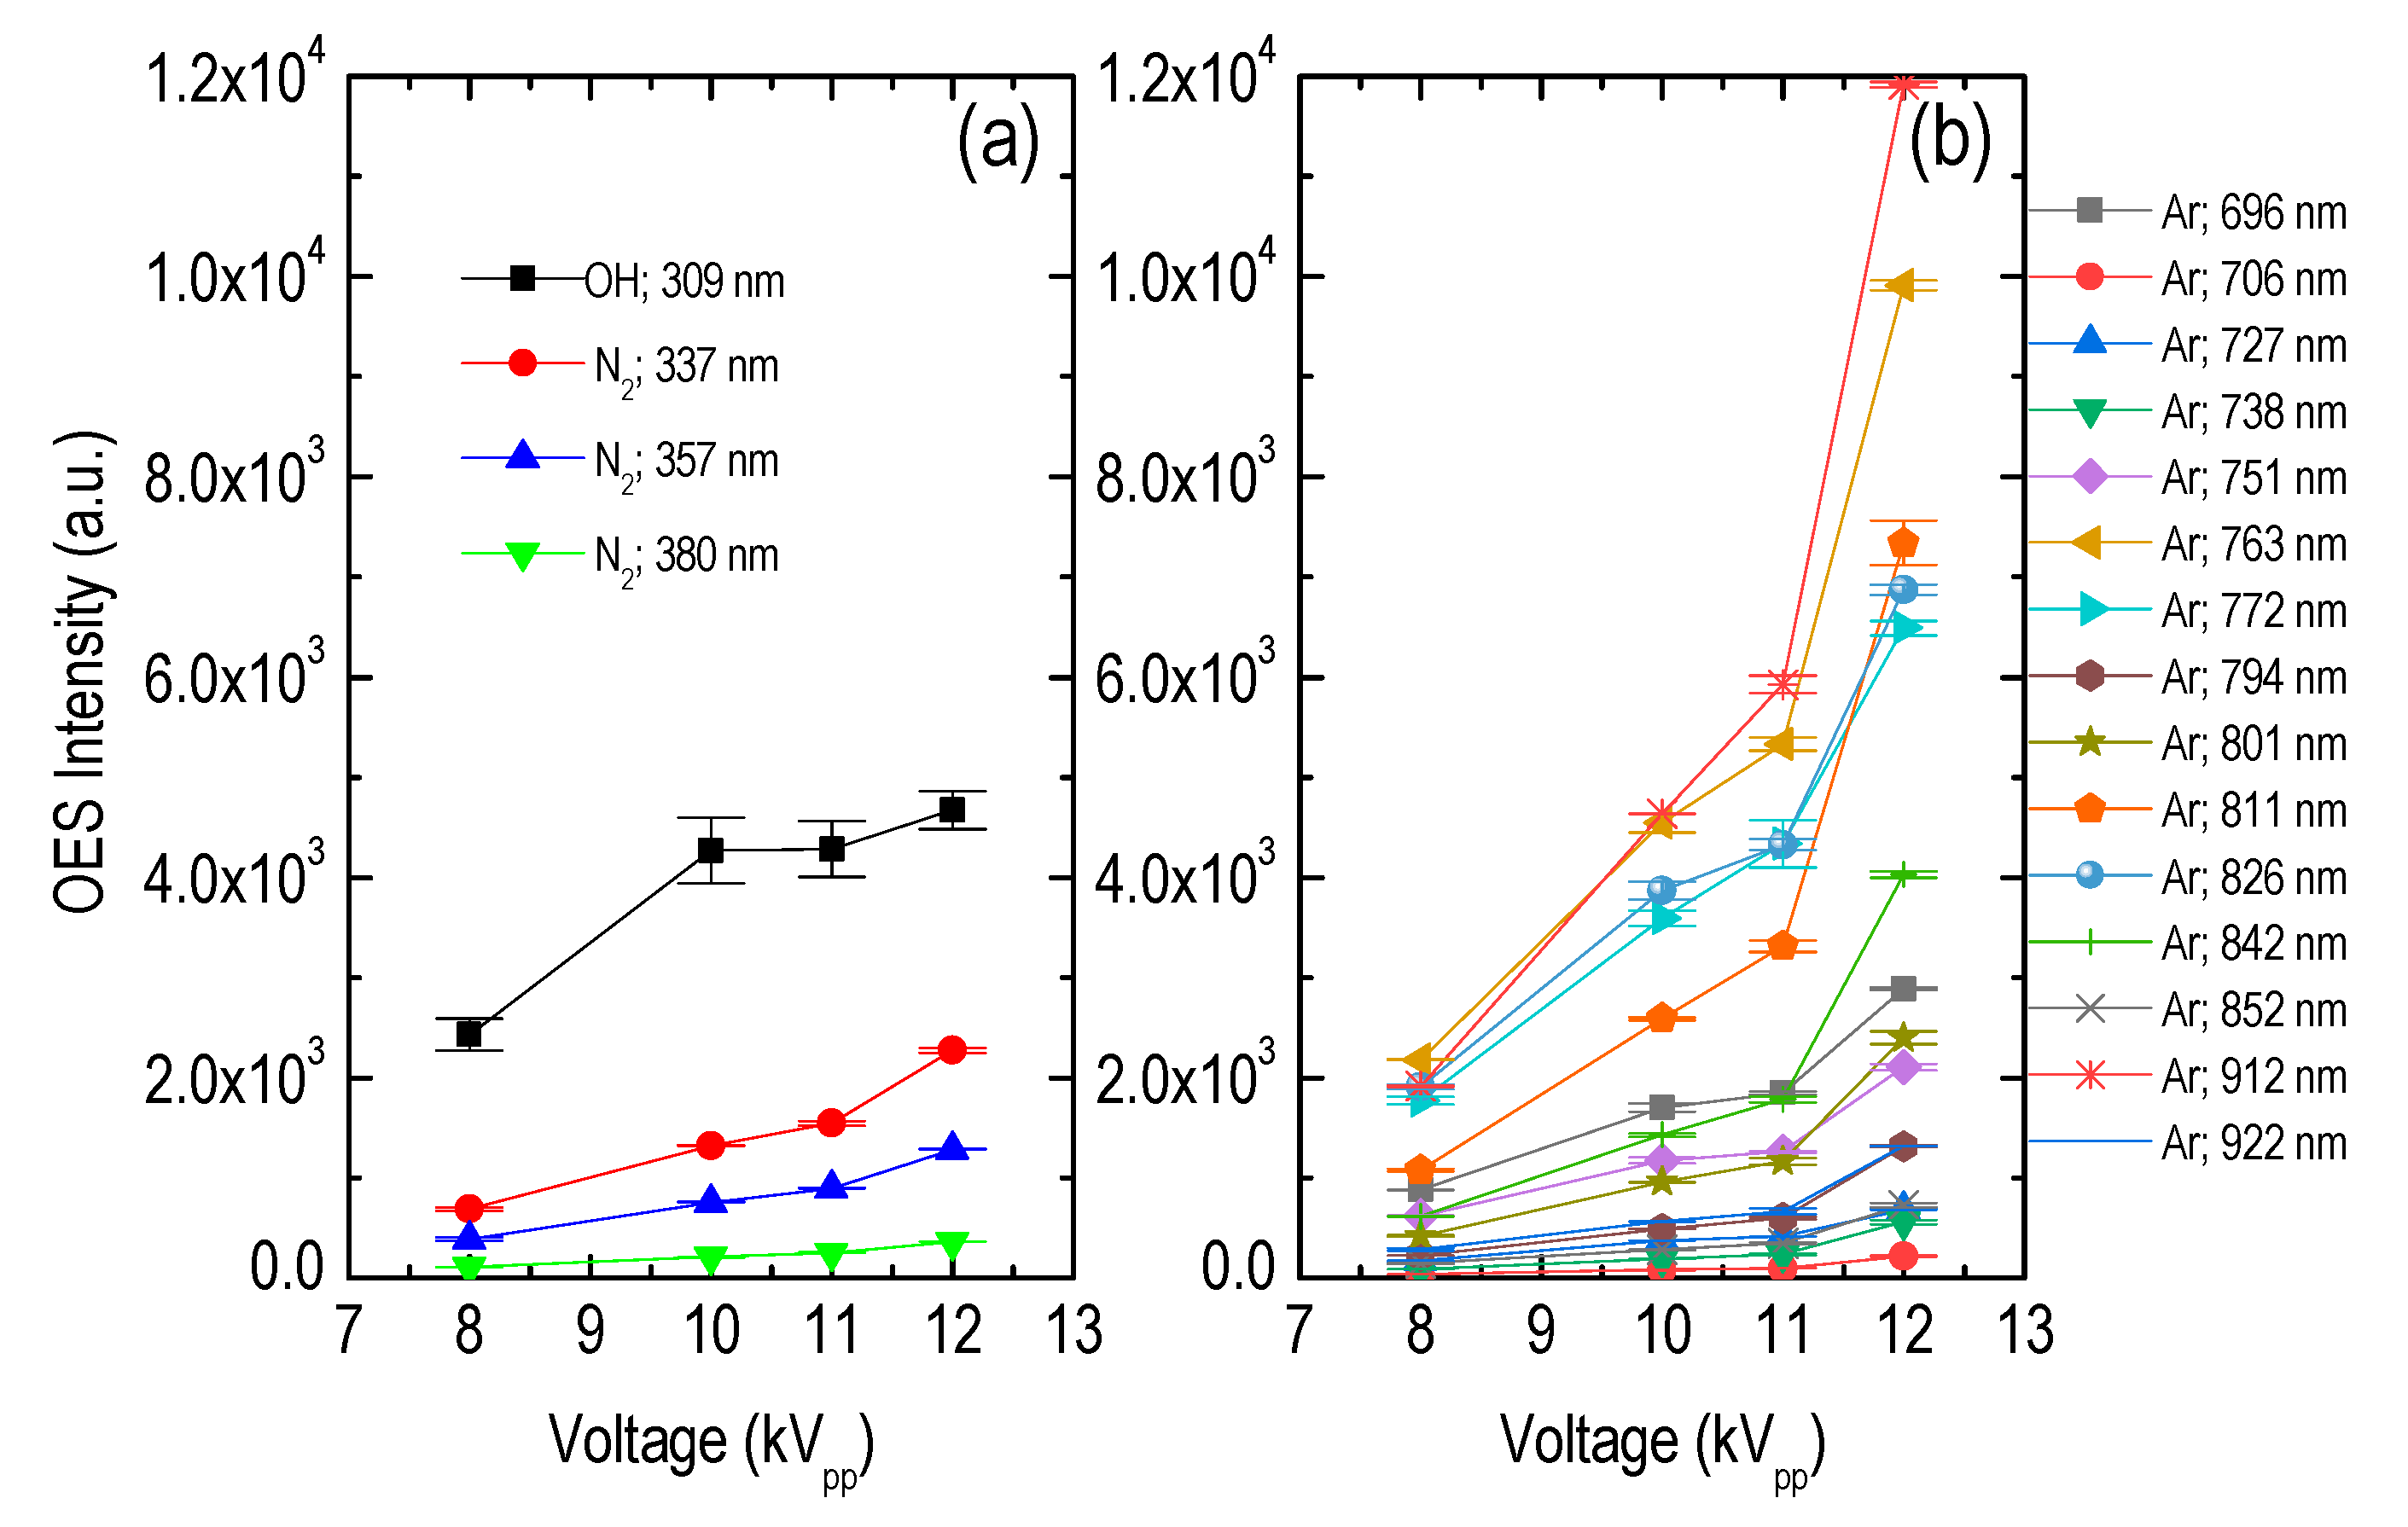
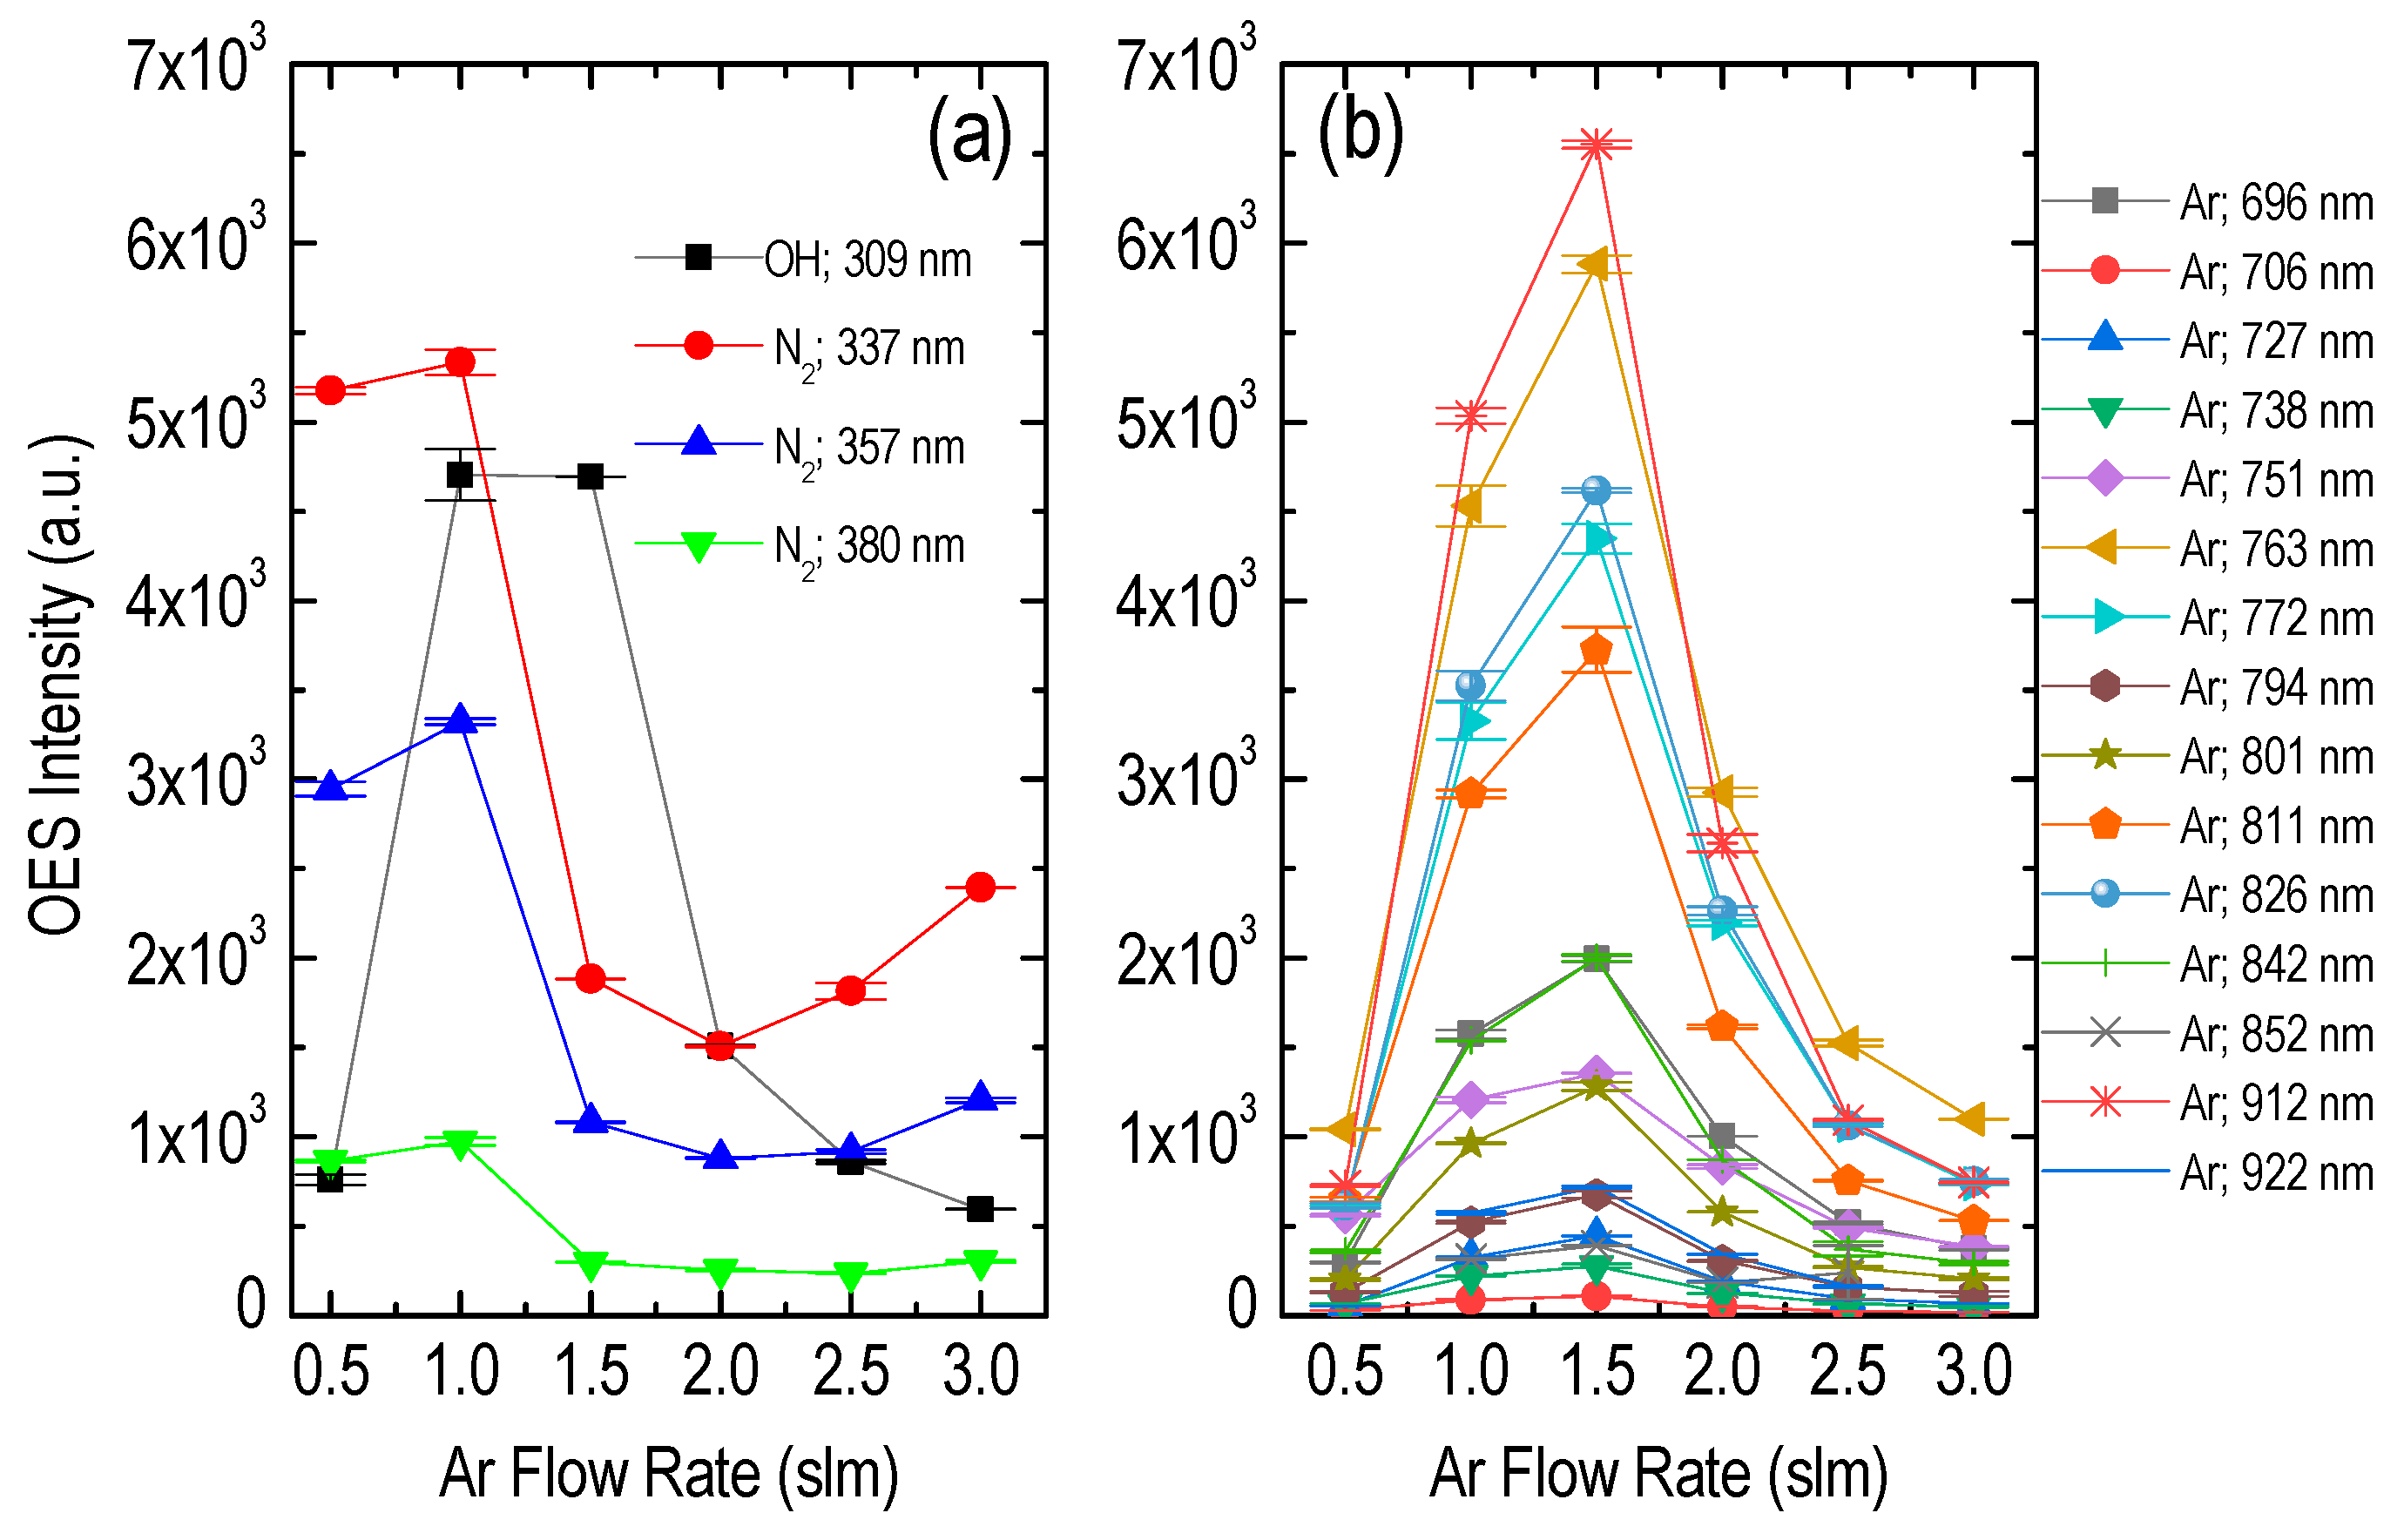
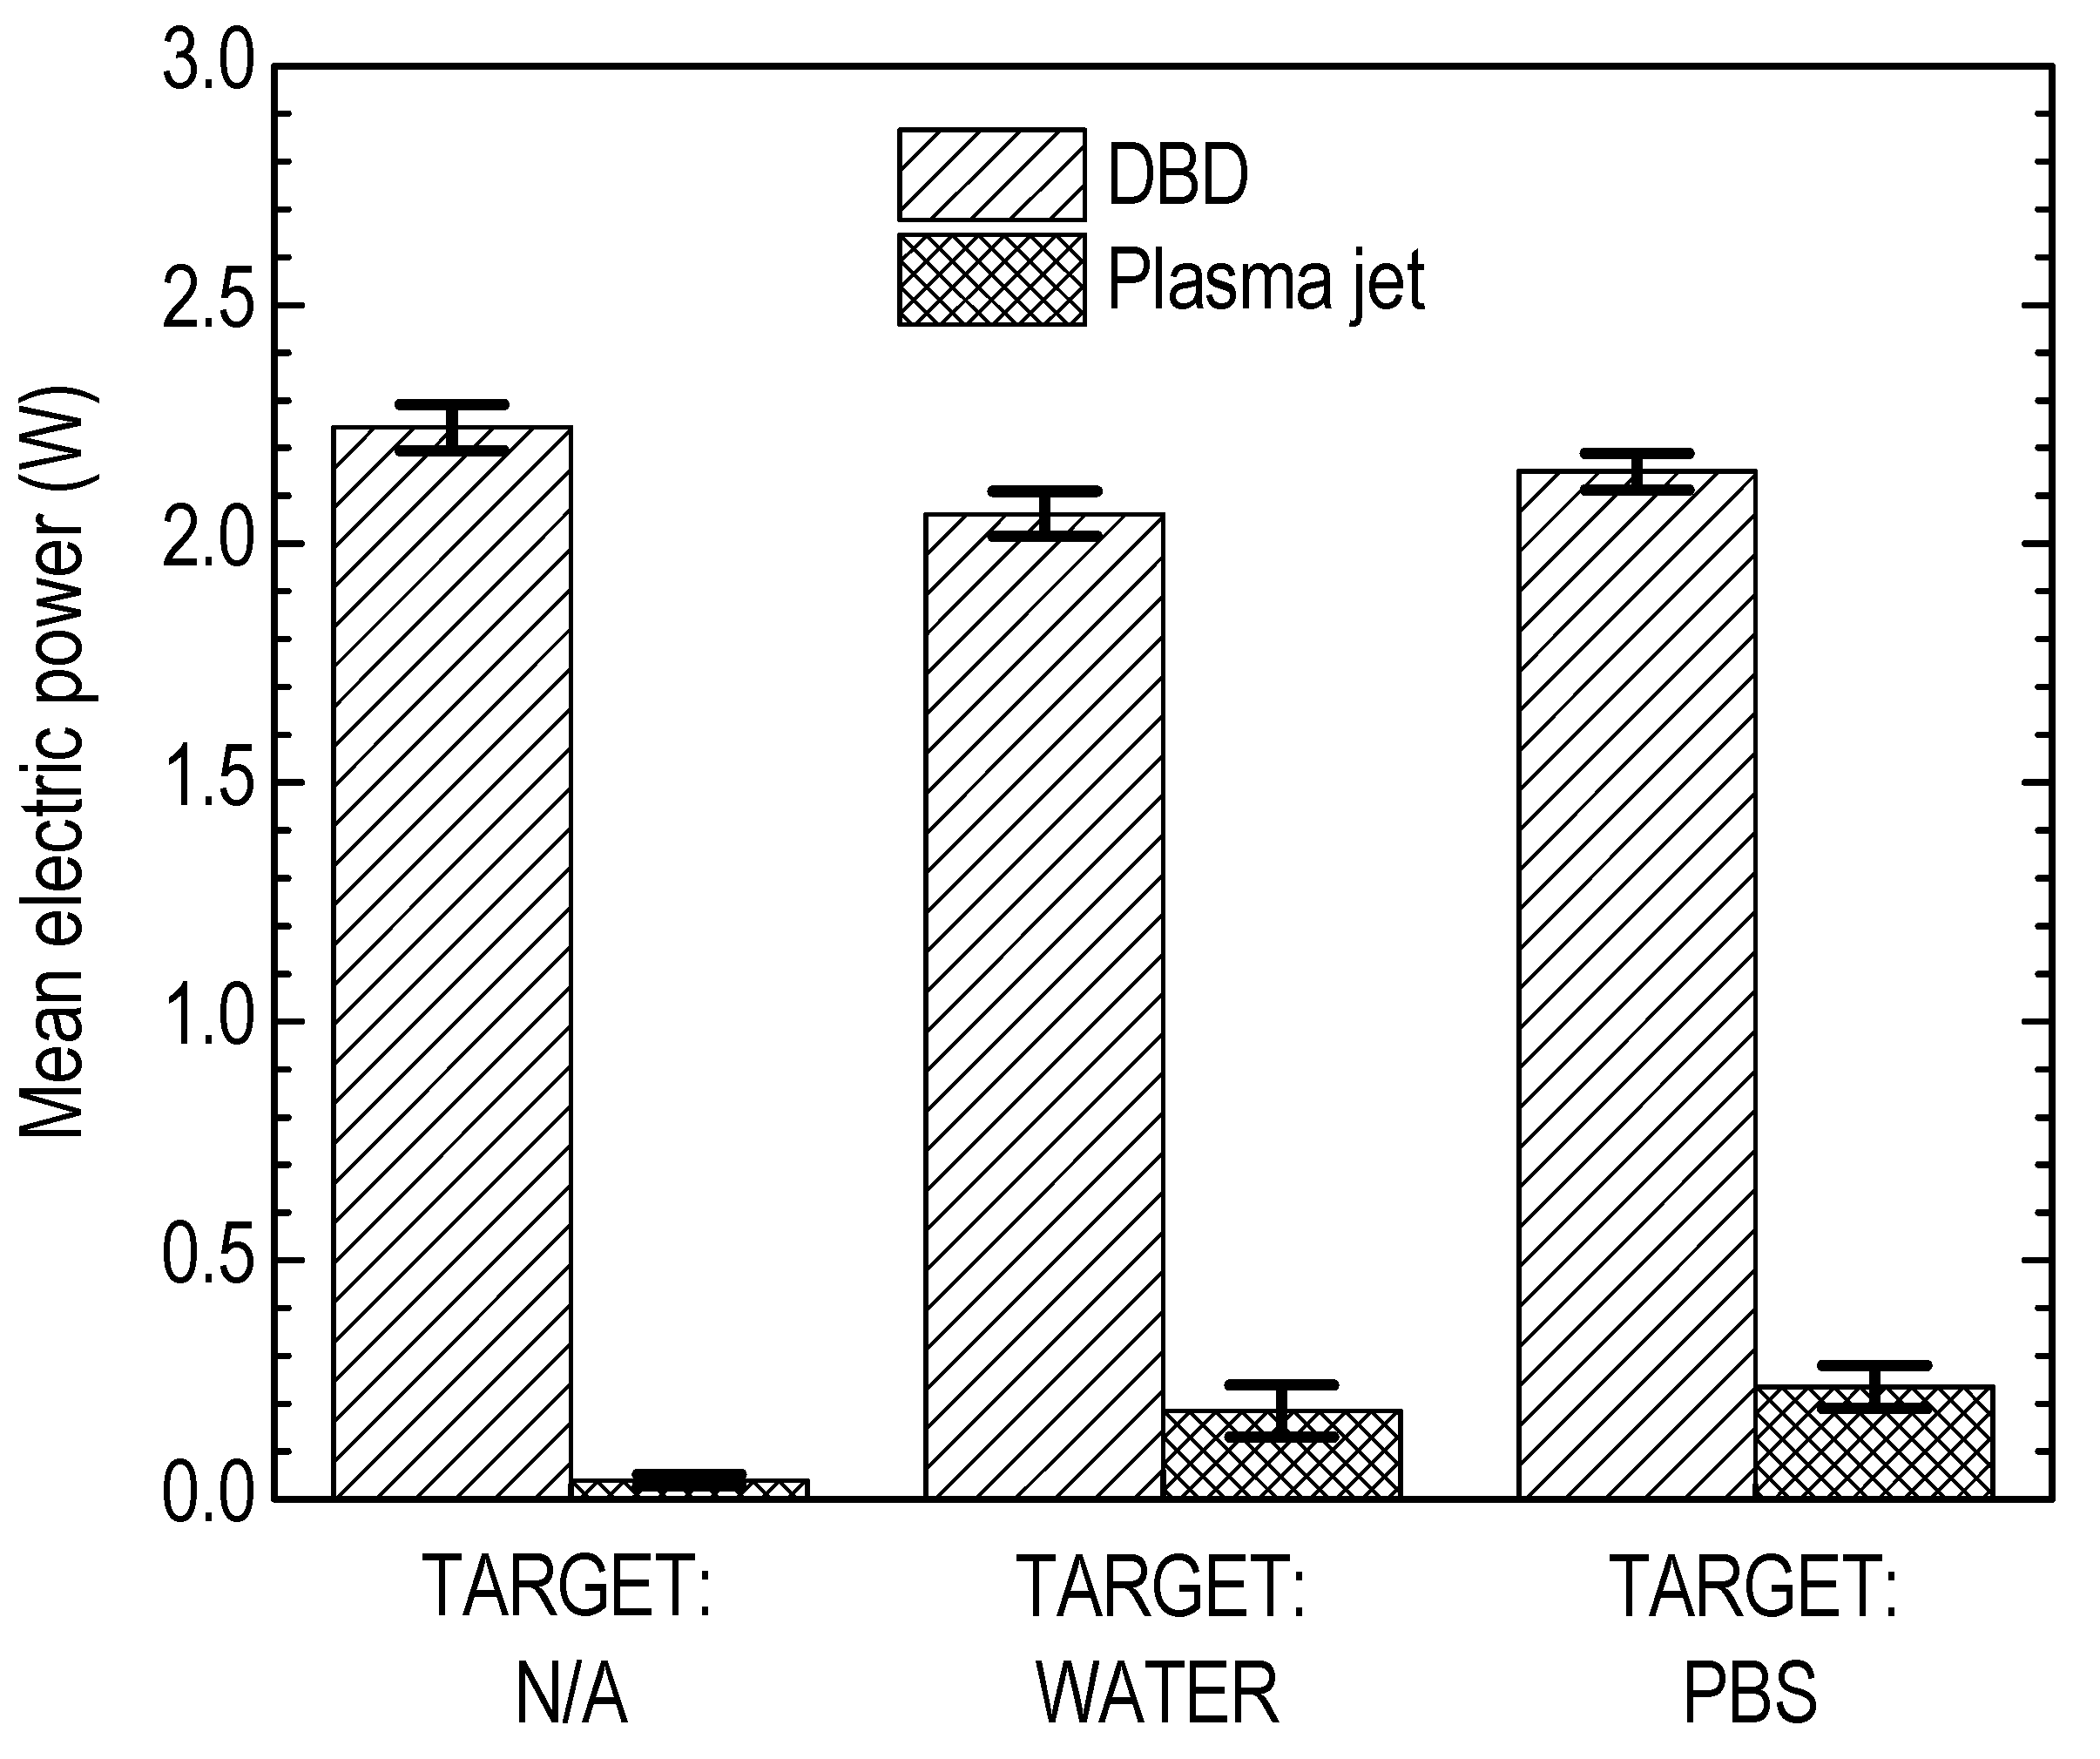
3.1. Plasma Jet Operational Window

The present DBD-based plasma jet setup has three adjustable operating parameters, namely: the applied voltage amplitude, the applied voltage frequency, and the gas flow rate. These parameters are here varied over the range 8–12 kV peak-to-peak, 5–20 kHz, and 0.5–3 slm, respectively, and the generating species emitting in the UV-NIR region are probed. Figure 3a,b unveil the principal emissive species detected downstream of the plasma jet. The species identification with the corresponding transitions are summarized in Table 1 [38,39,40]. Excited molecular nitrogen, hydroxyl, and abundant argon excited atoms are seen. Figure 3c presents both the experimentally recorded and the numerically reproduced rotational distribution of the hydroxyl molecule, OH(A), which has been accepted as a reliable molecule for rotational temperature measurements [41]. Hence, following the curve fitting shown in Figure 3c, an average gas temperature of around 350 ± 40 K is evaluated along the plasma jet. The data of Figure 3 refer to the optimal operational window, in terms of reactivity, which is determined as follows.
Figure 4, Figure 5 and Figure 6 provide the relative spectral intensity of the abovementioned species, as a function of the voltage amplitude, voltage frequency, and gas flow rate, respectively. In the case of amplitude variation, i.e., Figure 4, species population increases for higher externally applied electric field. This is due to intense ionizing waves, propagating along the argon channel, which outplace and penetrate the atmospheric air [29,42]. Thus, considering the power supply limit of 12 kV peak-to-peak and a rational safety factor, the voltage of 11 kV peak-to-peak is used hereafter.
In the case of frequency variation, i.e., Figure 5, the OES intensity peaks around 17.5 kHz for most of the species. In other words, while an increasing frequency promotes species production initially, possibly due to the higher power injected into the system, elevated frequency leads to adverse results eventually. This fact may be attributed to the transition from laminar to turbulent gas flow profile (see discussion on the frequency role in reference [42]), which provokes increased argon-air mixing and disturbs the ionization wave propagation. Thus, the value of 17.5 kHz is applied hereafter.
Regarding the gas flow rate, i.e., Figure 6, the intermediate value of 1.5 slm appears favorable to produce most species. The existence of an optimal gas flow is directly related with the breakdown of the laminar flow into turbulent flow for increased gas flow rates. This electro–hydrodynamic interplay between the plasma species and the gas jet has been studied extensively by our group [32,43,44]. Consequently, the value of 1.5 slm is considered henceforth.
Two comments should be made on the above spectroscopic analysis: (i) The emission which is related to the carrier gas (i.e., argon atomic lines) has consistent peaks and patterns against all the operating parameters. Similar patterns and peak locations are observed for the hydroxyl molecule too. However, the emission intensity which is related to the surrounding air (i.e., nitrogen molecule bands) deviates from the above patterns when either the frequency or the gas flow rate is being swept. Thus, it peaks at around 12.5 kHz and 1 slm (i.e., it then decays) and then it somewhat recovers when the frequency and gas flow rate get values close to those corresponding to the peaks of all other species (see N2 curves in Figure 5a for >17.5 kHz and Figure 6a for >2 slm; the peaks in Figure 5b and Figure 6b are around 17.5 kHz and 1.5 slm, respectively). These observations mirror once more the displacement of the nitrogen molecules by the argon atoms and vice versa, depending on the frequency and flow rate values contextually. (ii) The results of Figure 3, Figure 4, Figure 5 and Figure 6 refer to the free running plasma jet, i.e., without liquid target which could modify plasma features [45]. In the present work, comparative experimental series during months with and without DDW/PBS, showed that DDW/PBS does not promote the production of new emissive species. Furthermore, any variation in the relative spectral intensity of the above species when DDW/PBS is being treated remains within the typical standard deviations obtained in the case of the free running plasma jet. Finally, the patterns and the peak locations of Figure 4 to Figure 6 remain unchanged.
These observations are possibly related to the following facts: there is quite a long distance between the reactor orifice and the liquid surface (about 25 mm), resulting in weak immersion of the plasma jet into the liquid; the distance between the liquid surface and the beaker bottom is quite long (about 20 mm); between the liquid and the grounded holder, the glass dielectric bottom of the beaker is inserted (Figure 1).
However, the bar charts of Figure 7 picture the influence of the DDW and PBS on the DBD and the plasma jet in terms of power consumption. The system consumes a low power (<2.5 W) with the main fraction of this power being delivered always to the DBD, but the ratio of the plasma jet to the DBD power varies slightly. It is around 2%, 9%, and 11% in the case of the free plasma jet, the DDW, and the PBS target, respectively. Nevertheless, as the optimum operational window is unaffected (i.e., 11 kV, 17.5 kHz, and 1.5 slm), any further concern on the liquid-induced plasma modifications remains beyond the scope of the present study. This study focuses on the plasma-induced liquid modifications.

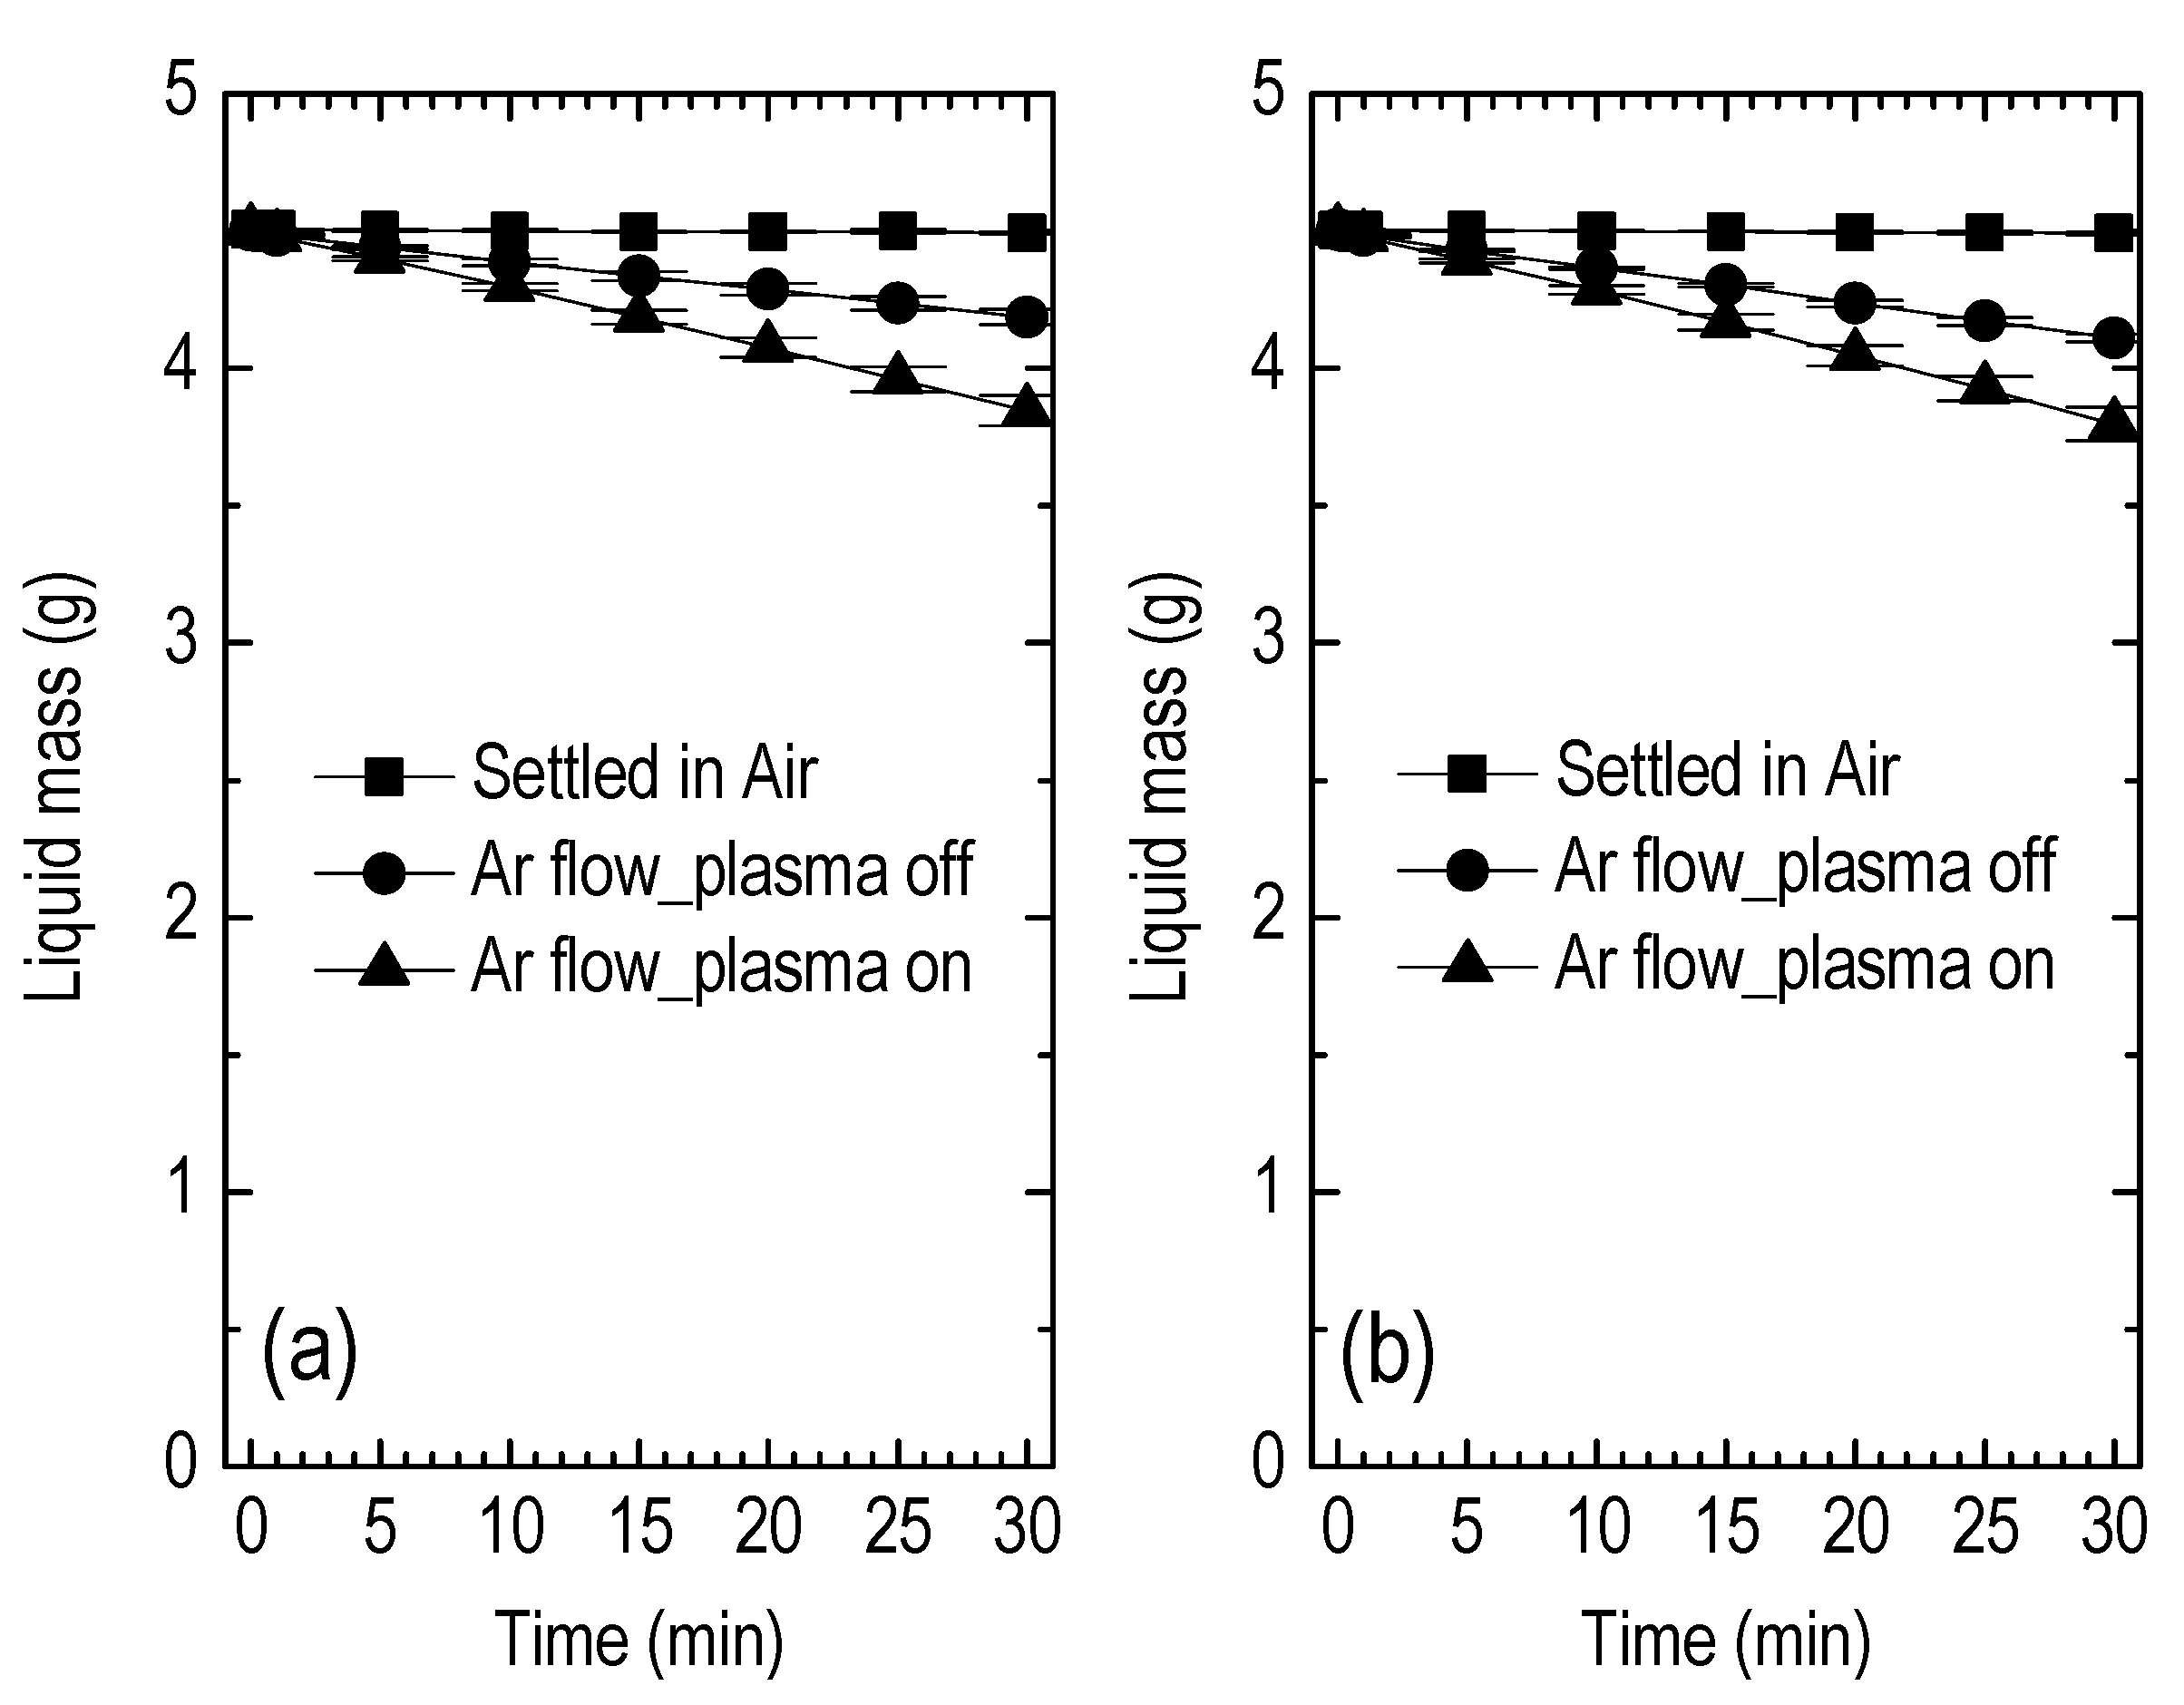
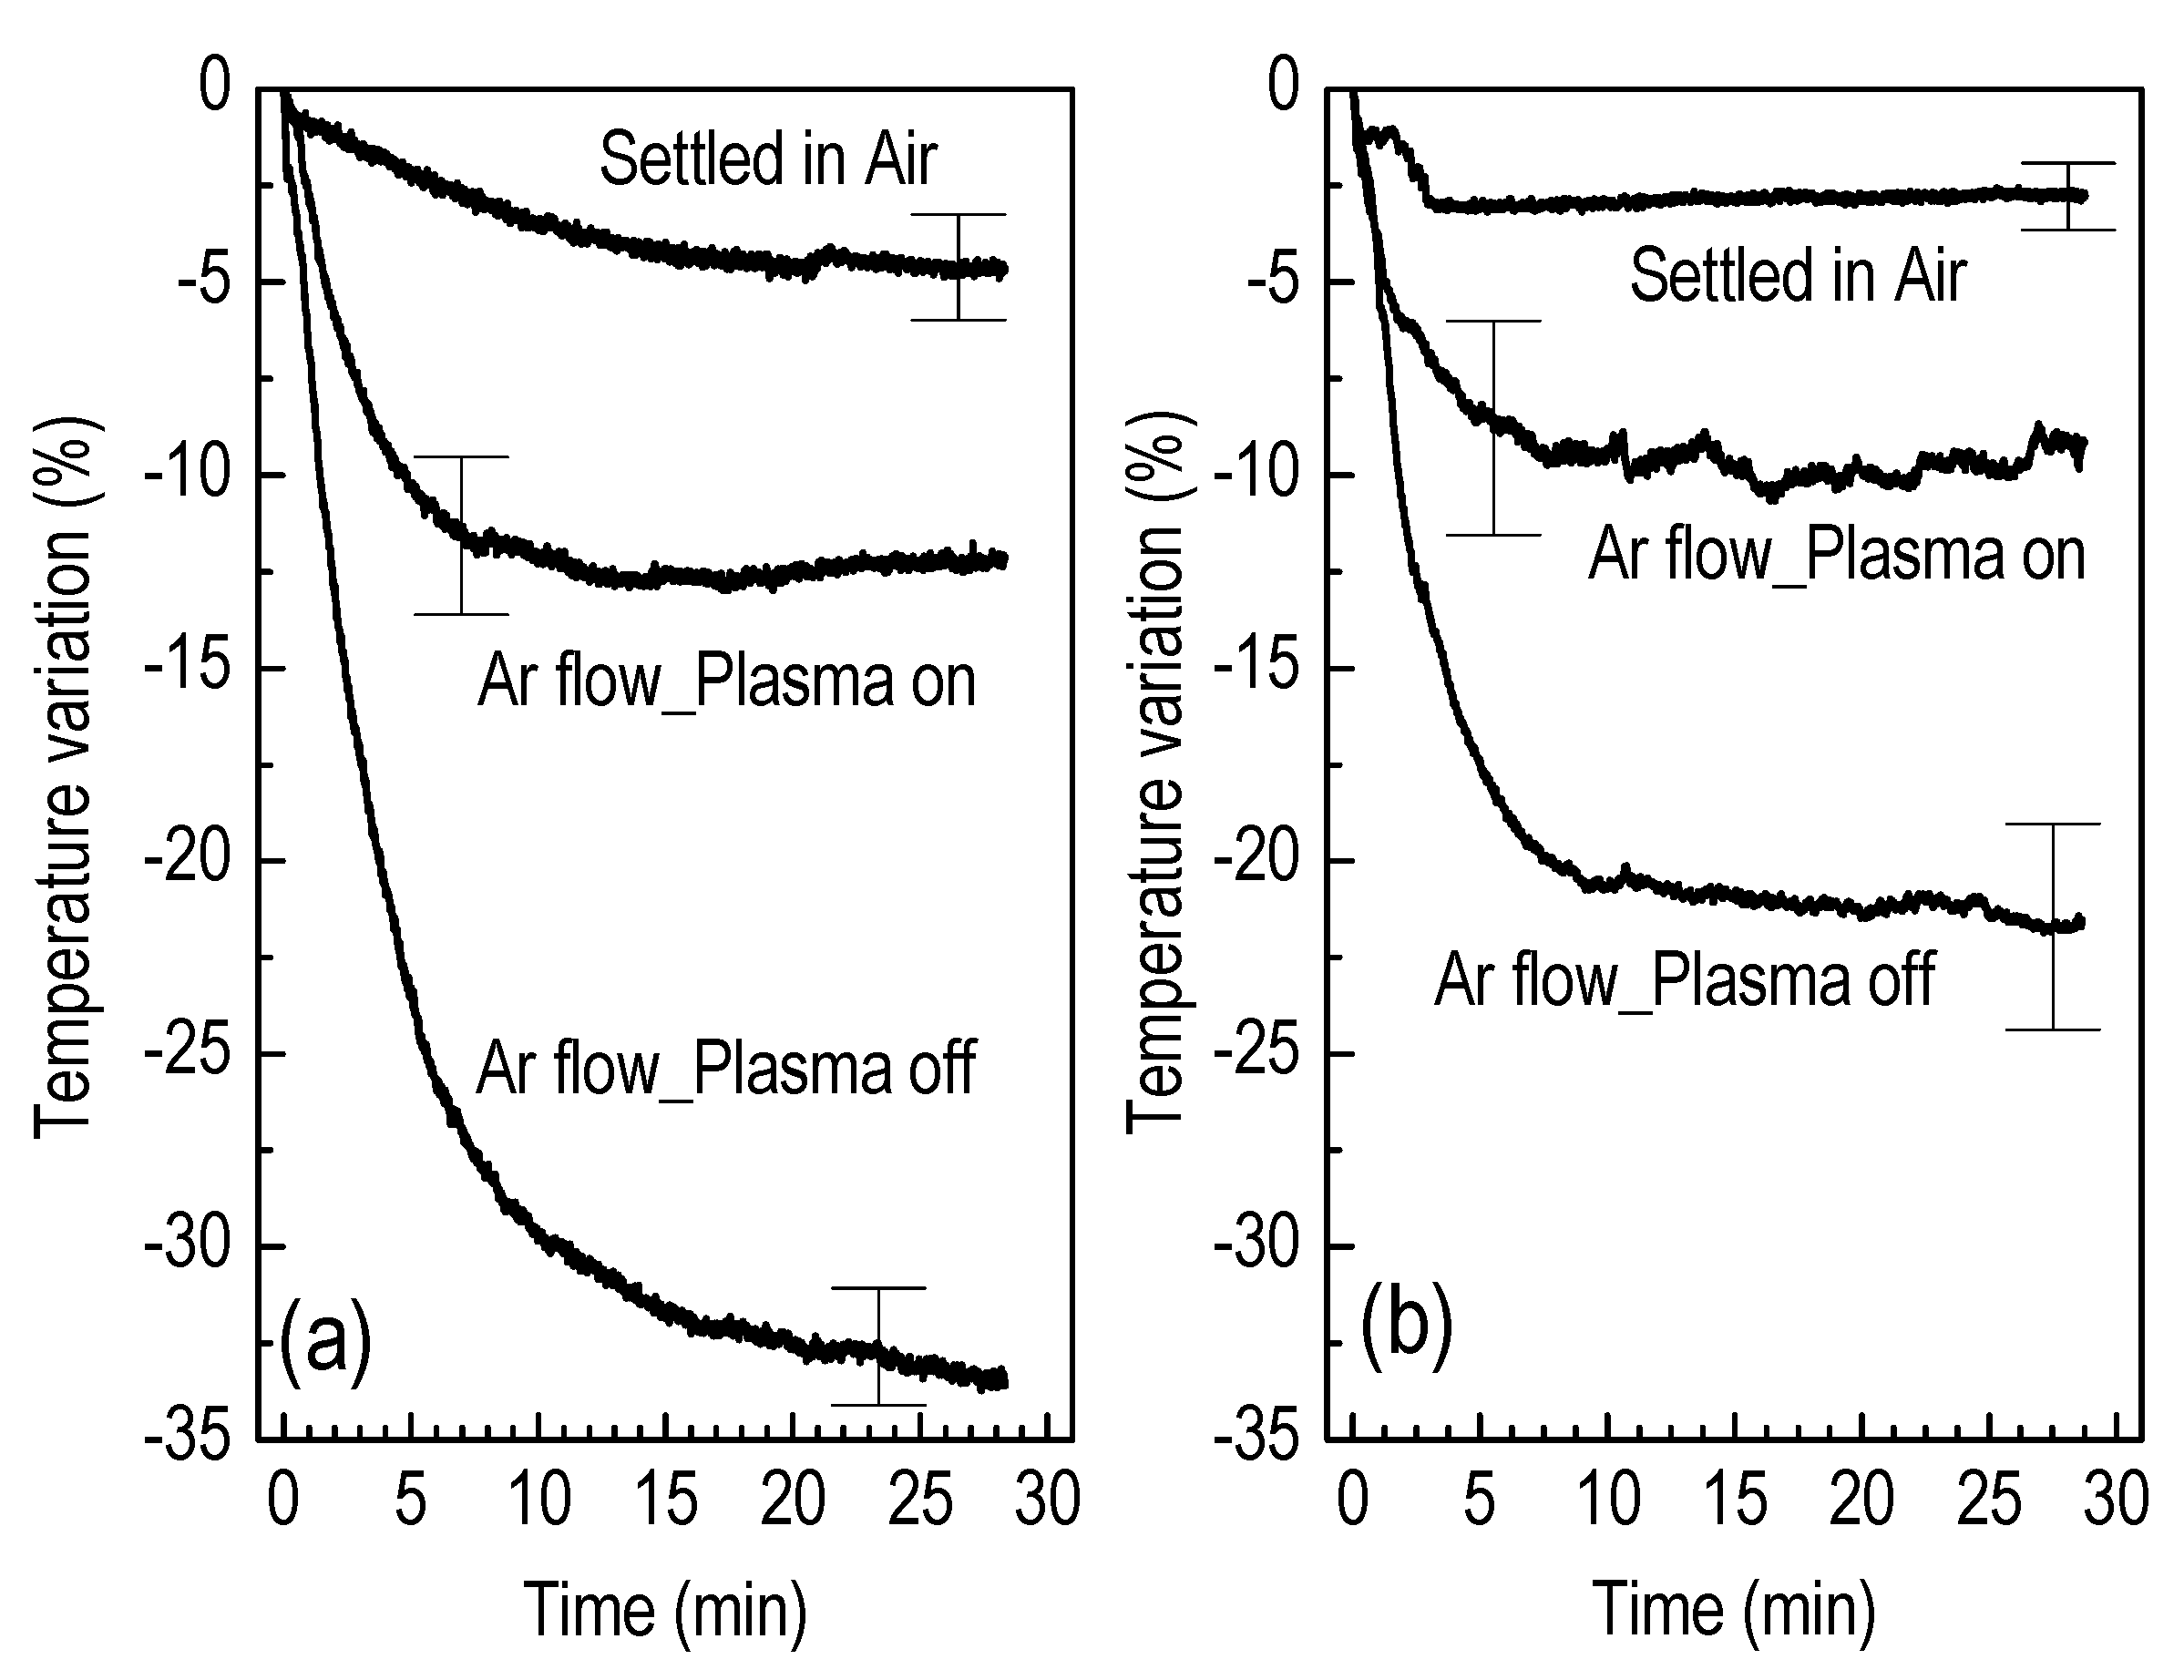
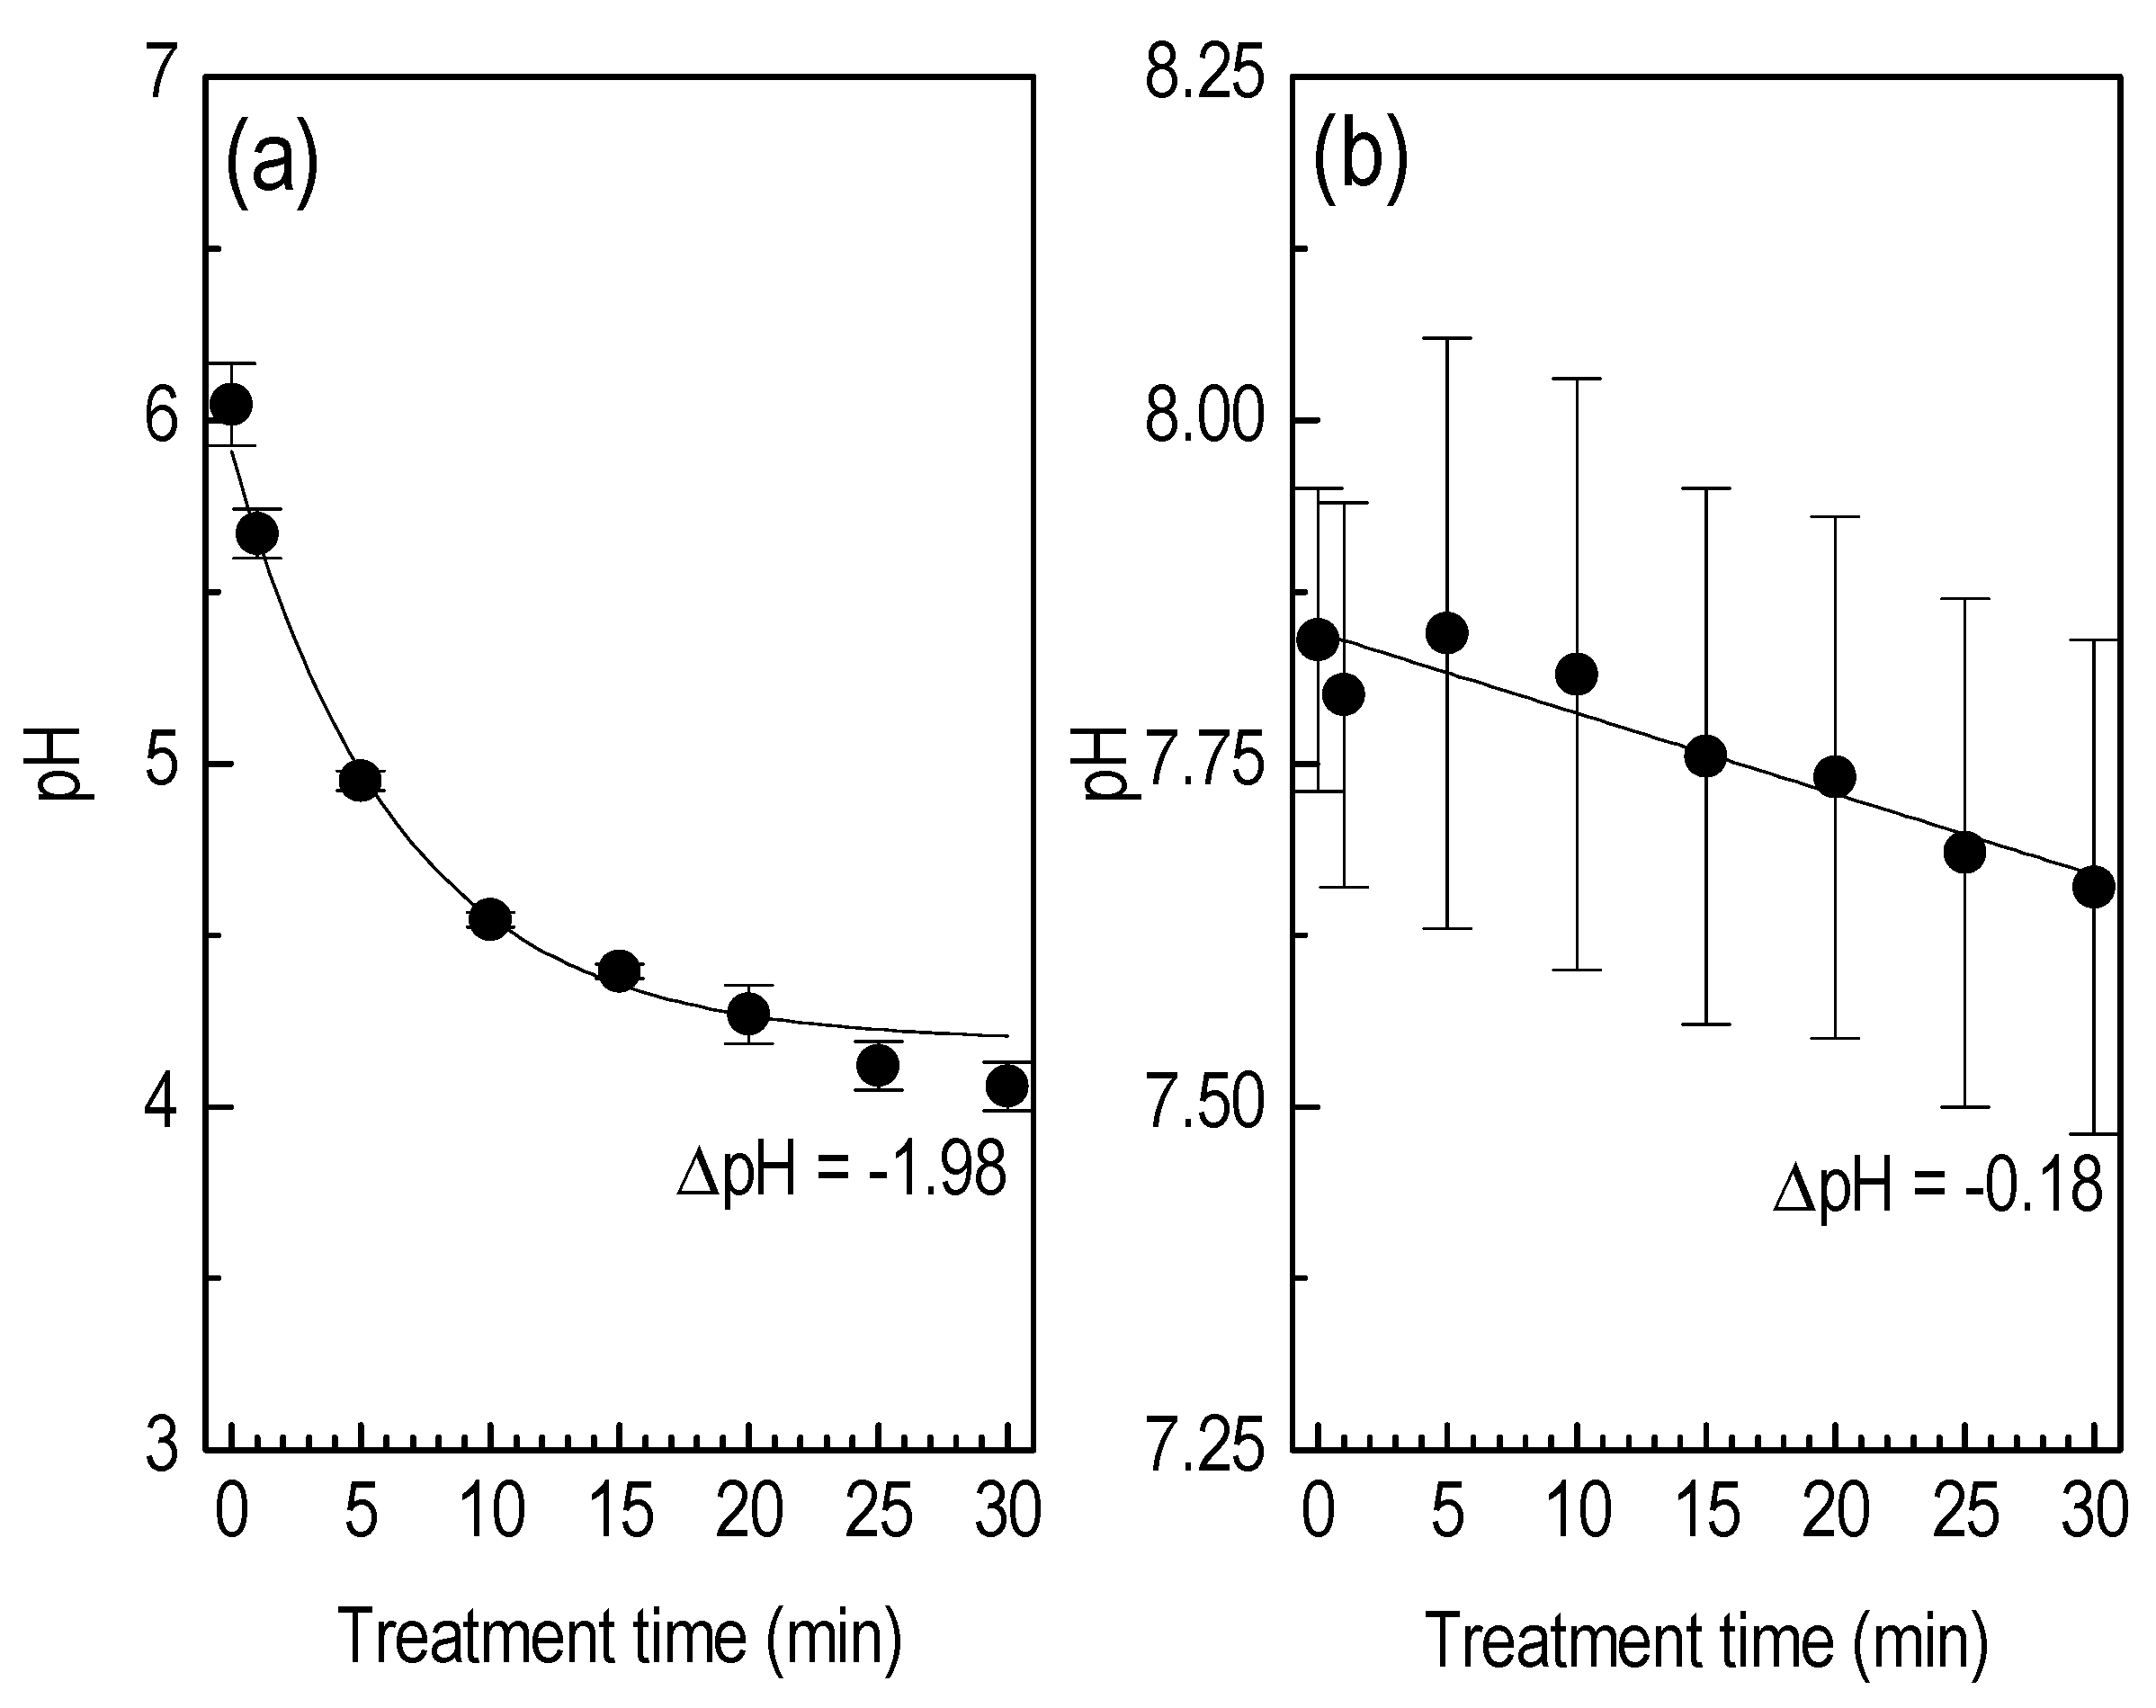
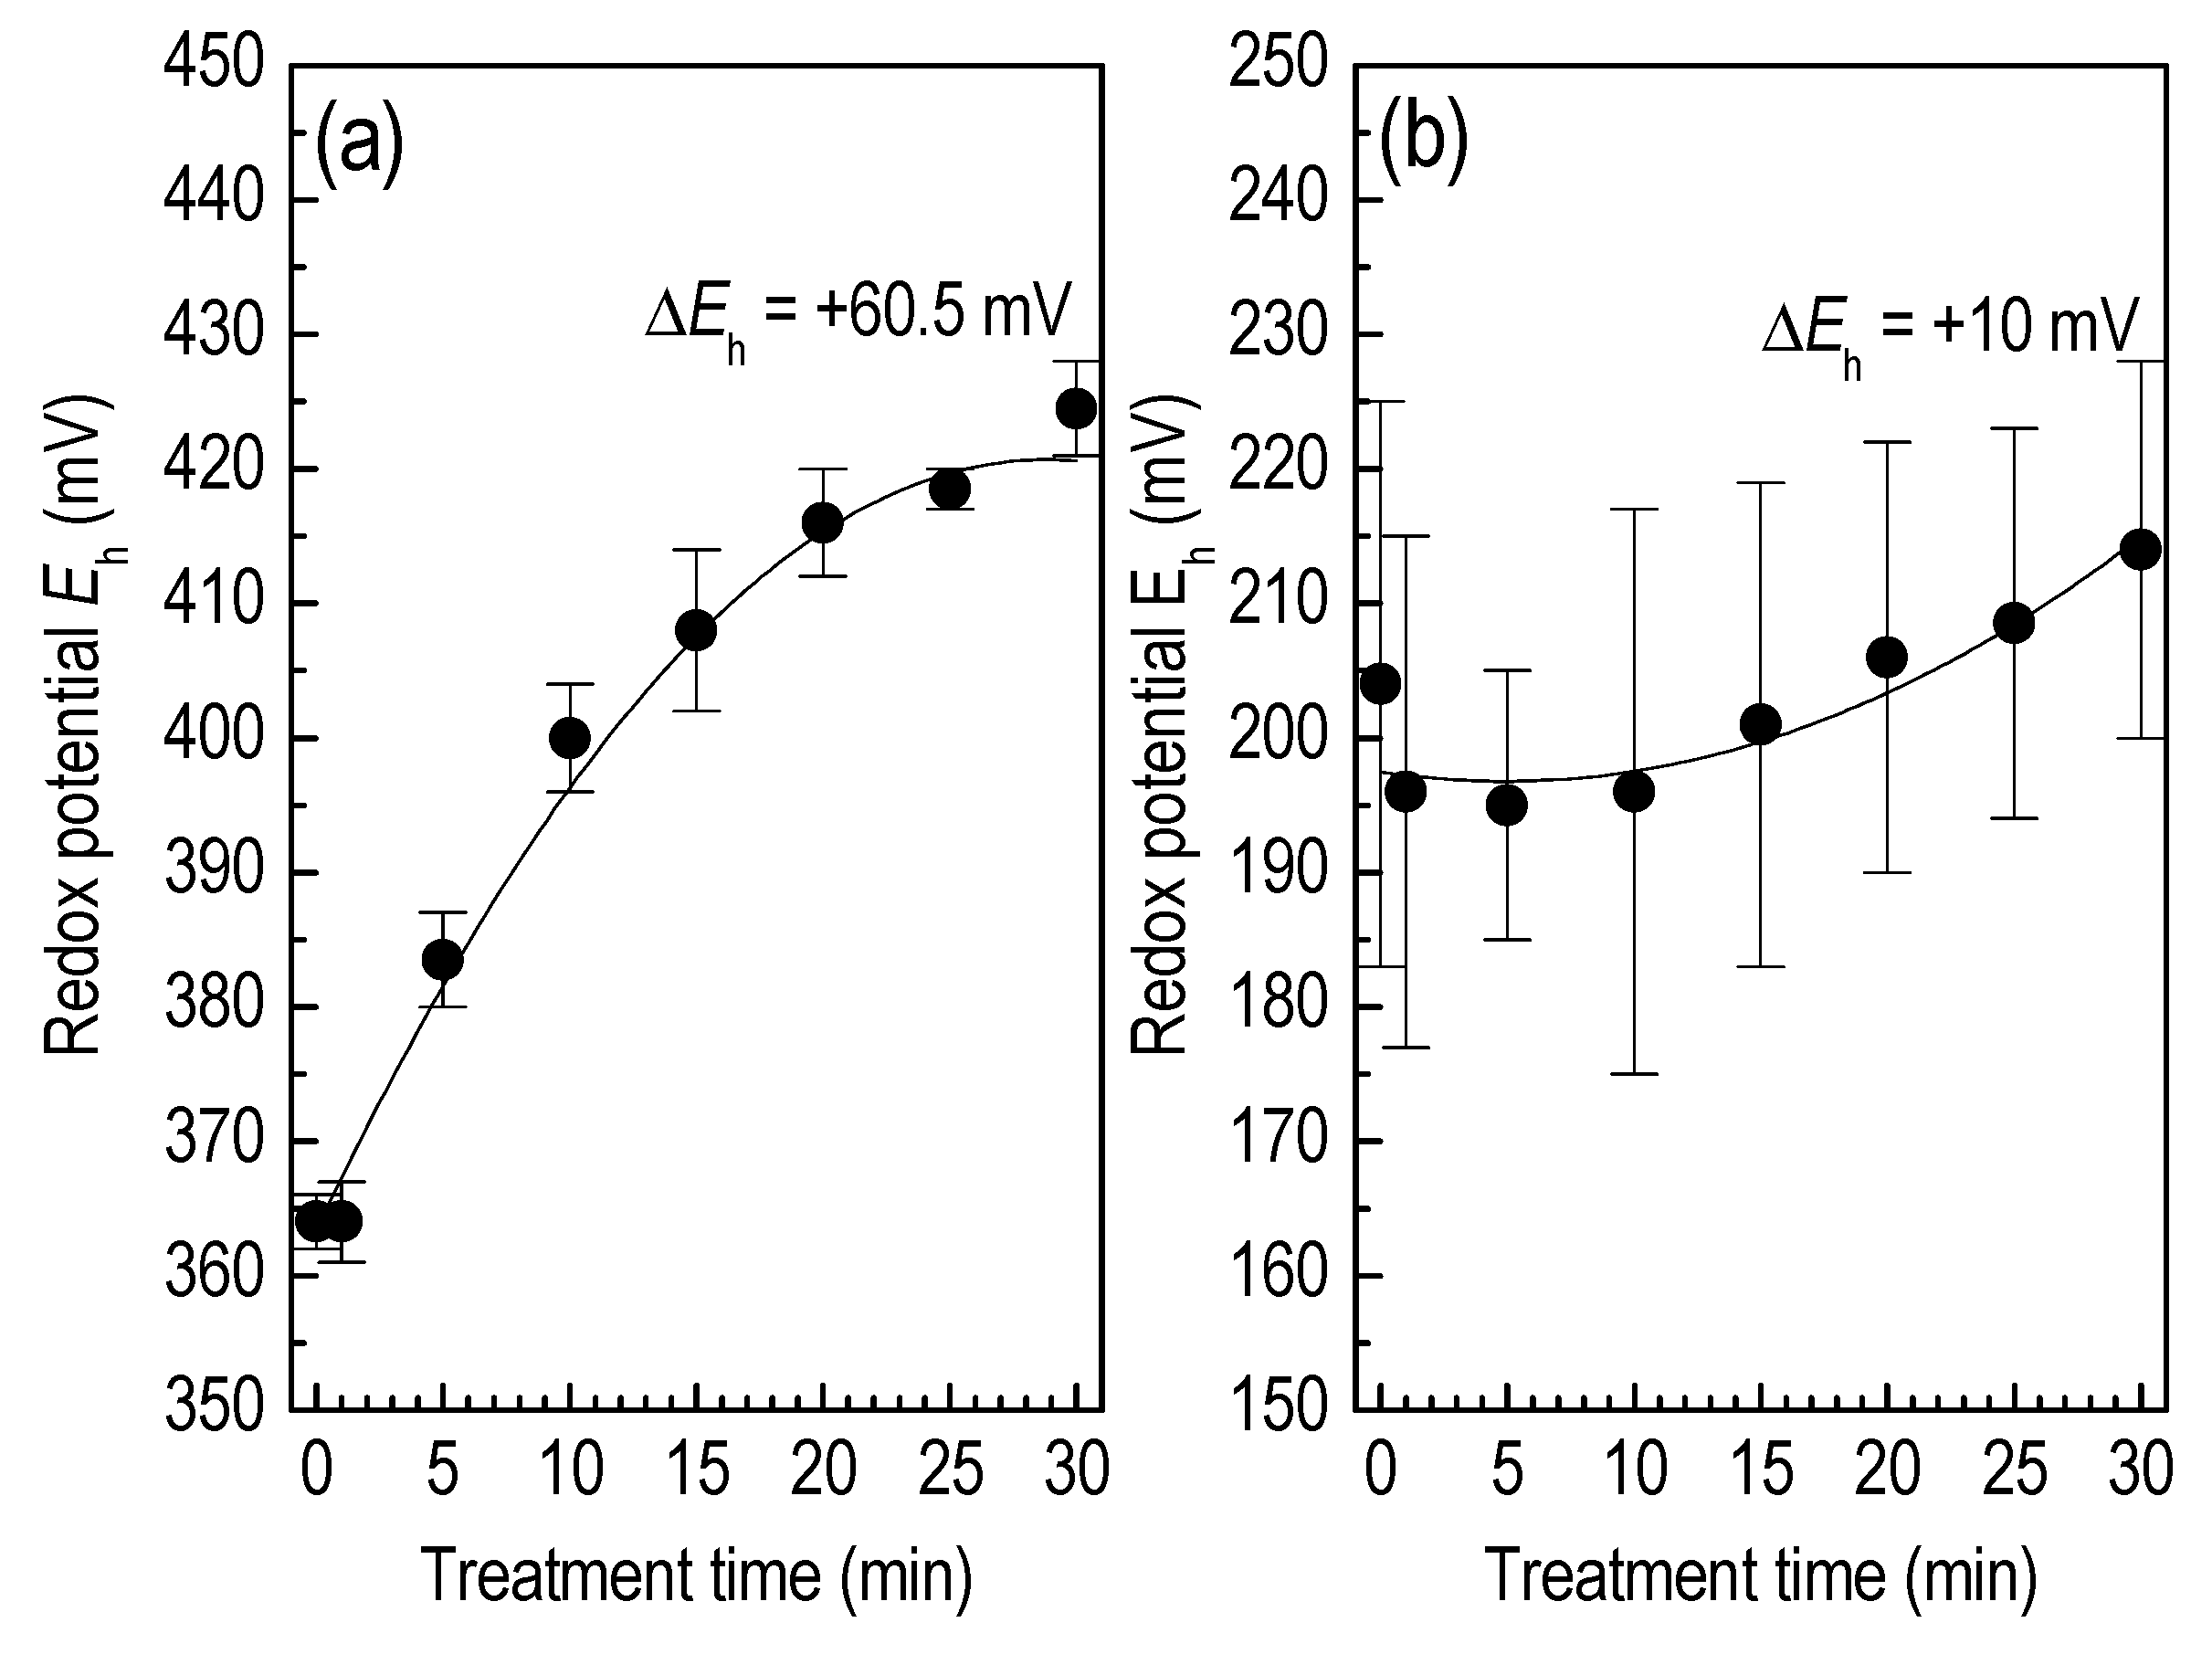
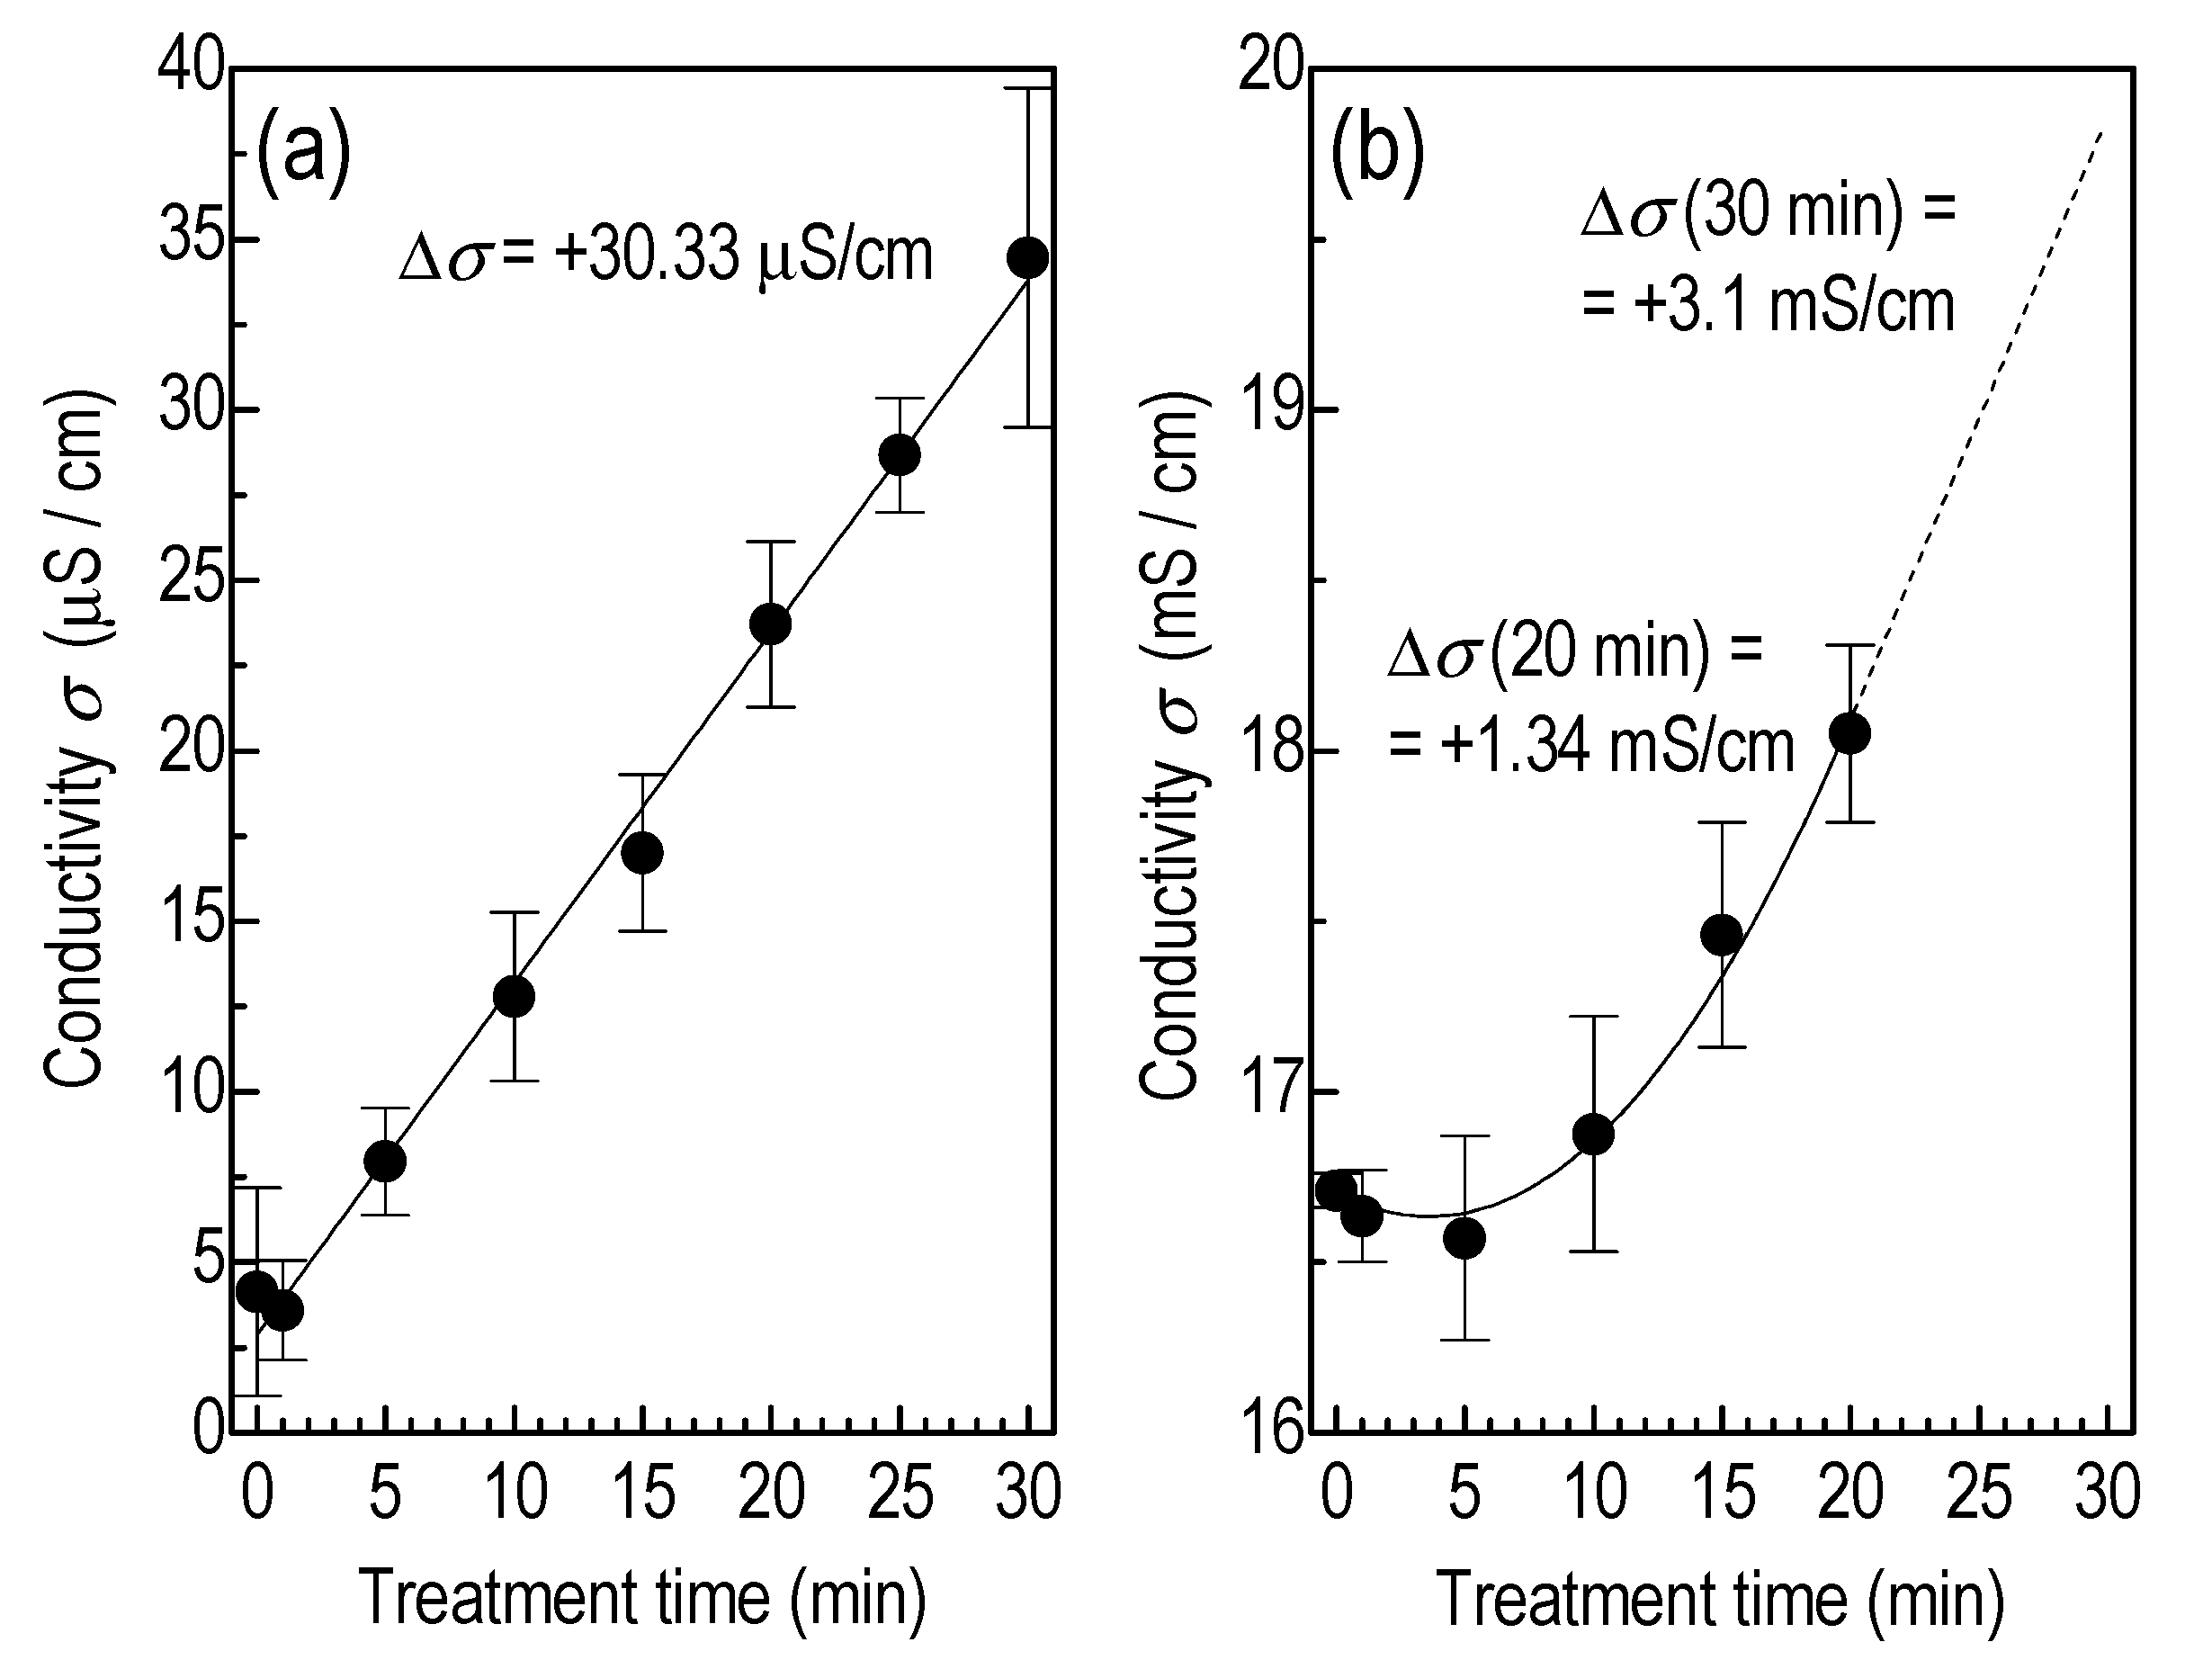
3.2. Liquid Treatment—Basic Characteristics

Hereafter, the specimens are treated at the optimized conditions found previously. Firstly, the liquid mass variation versus the time is given in Figure 8 for three different cases, i.e., the specimens are settled in the laboratory air, the specimens are subjected to the argon flow (plasma off) downstream of the reactor orifice, and the specimens are subjected to the argon plasma. For the prolonged time of 30 min, in the first case, the mass of both liquids remains constant, in the second case, a mass reduction of 7% in DDW and 8.5% in PBS is observed, and in the last case, the corresponding percentages are 14.5% and 15.6%.
Figure 9 gives the liquid temperature variation (%) at the corresponding cases, following in-situ measurements. The representation of the temperature relative variation instead of absolute values is preferable since it offsets the different ambient temperature on different dates. The given error bars indicate the highest (worst case) deviations found between two series of experiments. Both liquids slightly cool down when they are left in the laboratory air, whereas an important cooling is noted when they are subjected to argon flow downstream of the capillary tube. Interestingly, this cooling is intercepted when the plasma is activated. The effects are more intense in the case of unbuffered water.
It is known that when the molecules of a liquid collide, they transfer energy to each other based on how they collide with each other. When a molecule near the surface absorbs enough energy to overcome the vapor pressure, it escapes and enters the surrounding air as a gas. When evaporation occurs, the energy removed from the vaporized liquid reduces the temperature of the liquid, resulting in evaporative cooling. The evaporation continues until an equilibrium is reached when the evaporation of the liquid is equal to its condensation.
Based on the present experimental data, plasma results in a higher evaporation rate than does argon gas itself. At the same time, plasma cools the liquids less than does the argon gas. Thus, a simplified evaporative cooling mechanism is not consistent with these observations. Evaporation should be attributed to momentum and energy transfer from the plasma species to the liquid molecules. More importantly, it is well established that plasma jets increase the gas velocity and its mixing with the surrounding air due to electro–hydrodynamic forces [32,43,44]. Thus, above the liquid surface, the non-saturated air is renewed more efficiently, and the concentration of the liquid vapors goes down when the plasma is activated. This fact encourages faster evaporation. The more intense cooling effect induced by the argon gas is likely due to an “adiabatic-like” cooling that takes place as the gas is leaving the compressed gas reservoir in a short time. On the other hand, small amounts of heat induced by the plasma (see reference [46] and Figure 3c) compensate for this “adiabatic-like” cooling and the temperature variation appears lower.
Apart from the evaporation and the temperature variations, the DDW pH is exponentially decreases versus the treatment time (Figure 10). Within 30 min, a decrease of about two in the pH scale (ΔpH = −1.98) is obtained. Since the pH scale is defined as the decimal logarithm of the reciprocal of the hydrogen ion activity (at that level, this is essentially the number of moles of hydrogen ions per liter of solution), it is deduced that plasma induces an increase of the hydrogen ion concentration in the water. It should be underlined that the initial low pH (around 6.0) is not surprising since, if pure water is exposed to air, it becomes mildly acidic. This happens because water absorbs carbon dioxide from the air which is then slowly converted into carbonic acid (the chemical reaction is reversible). In any case, the observed plasma-induced acidification of water is a crucial result which can account for the deactivation of different biospecimens. On the other hand, PBS pH remains almost constant (ΔpH = −0.18), as was expected for an isotonic solution.
Furthermore, another quantity related to pH and the disinfection efficiency of a liquid is the redox potential, Eh. Redox potential is an indicator of the ability of a solution to oxidize and is related to the oxidizer concentration. Substances like dissolved oxygen will contribute to higher oxidation and higher redox. This substance has higher electronegativity (oxidizing agent) and will normally pull electrons from other substances like unwanted contaminants and bacteria. Under the present conditions, the redox potential of the DDW changes from about 360 mV to 430 mV (ΔEh = +60.5 mV), in an exponential manner, according to Figure 11a. Consistently with the pH measurements, the PBS redox is less affected even after 30 min of treatment (ΔEh = +10 mV); Figure 11b.
Finally, Figure 12 bears testament to the ionic species increase in both DDW and PBS as a function of the treatment time. In the case of DDW, an almost seven-fold conductivity is achieved within 30 min of plasma action (Δσ = +30.33 μS cm−1), whereas in the case of PBS, an increase Δσ = +1.34 mS cm−1 is obtained within 20 min. The dashed line in Figure 12b corresponds to a numerical extrapolation of the experimental data, because the remaining PBS in the 10-mL beaker after 20 min of treatment was not sufficient to cover the immersed probe and any measurement taken could not be considered as reliable. This extrapolation suggests an increase Δσ = +3.1 mS cm−1 for the 30-min treatment.

3.3. Liquid Treatment—ROS Detection

Following the above observations on the plasma induced modifications of the water, the next step is their interrogation in terms of ROS formation. Thus, here follows the identification and quantification of the ROS components OH, H2O2 and O 2 generated by the plasma jet in both DDW and PBS. Table 2 and Table 3 summarize the results for the treatment time of 30 min.
The radical OH is identified by its specific probe TPA against the control conditions (i) of non-exposure to the plasma and (ii) exposure in the presence of its specific scavenger DMSO. As OH is being produced in DDW or PBS due to the plasma exposure, in the presence of excess TPA, the concentration of 2-OH-TPA (thus, of OH) increases linearly over time, reaching about 550 nM in DDW at 30 min. H2O2 identification and quantification employ an established specific method [36], using as a control condition the non-exposure to the plasma. In addition, the use of the OH-specific scavenger DMSO [47,48] as an additional control condition ensures that H2O2 produced in the plasma-treated liquid is not produced by the recombination of 2 moles OH. This control translates to a concentration of about 350 μM of H2O2 in DDW after 30 min of plasma exposure. A similar approach to that of the OH is followed for the detection of O 2 by its specific probe HE with two independent innovative methodologies [33,37]. The non-exposure control condition is also used, and the produced concentration is around 850 nM in DDW after 30 min of plasma exposure. The corresponding concentrations in PBS are about 450 nM, 250 μM, and 80 nM (OH, H2O2, and O 2 , respectively).
However, the recorded OH and O 2 levels are considered minimum. The reasons being: (i) these radicals are only those being trapped by their respective probes TPA and HE during 30-min plasma exposure; (ii) their quantification is made by the respective 2-OH-TPA and 2-OH-E+ (i.e., products of the reaction of OH and O 2 with their respective probes TPA and HE) that survived plasma oxidation; and (iii) only part of HE forms 2-OH-E+ with O 2 while the other part is converted to non-specific oxidation products by 1 or 2 electron-oxidation [49,50,51]. Regarding H2O2, its concentration is similar in both the DDW and the PBS (about 25% lower in PBS). Another factor adding to the difficulty in obtaining absolute production values for OH, O 2 and H2O2 is their participation in numerous side reactions involving both their generation and destruction [12,14,15,16,52,53,54,55,56,57,58].
The following reactions are given as representative. Apart from the generation/destruction paths of the above-determined radicals, these reactions demonstrate the complicated interplay between the plasma induced species (electrons, photons, radicals, etc.) and the dissolved in the liquid species, which ultimately affect the ion concentration (pH and σ) and the oxidizer concentration (redox) in the liquid. However, the above results are coherent, since a decrease in pH is accompanied by an increase in Eh and σ, with a parallel increase in ROS.
H2O + hfH2O+ + e(01)
H2O+OH + H+(02)
UV + H2OH2O(03)
UV + H2OH+ + OH(04)
OHOH + e(05)
e + O2 O 2 (06)
e + O2 + H+ HO 2 (07)
e + H2OOH + H + e(08)
e + H2OOH + H+ + 2e(09)
e + H2OH + OH(10)
H + O2 HO 2 (11)
O 2   + O 2 + 2H+H2O2 + O2(12)
HO 2   + O 2 + H2OO2 + H2O2 + OH(13)
HO 2 + HO 2 H2O2 + O2(14)
O H + HO 2 H2O + 1O2(15)
O H + O 2 OH + O2(16)
H2O2 + HOH + H2O(17)
OH + H2O2 HO 2 + H2O(18)
OH + OHH2O2(19)
Finally, it is noted that participation in the various side reactions of either HO2 or O 2 or both, depends on their pKa (= 4.8 [59]) and on the pH of the unbuffered water, where their molar ratio is determined by the Henderson–Hasselbalch equation, i.e., pH = pKa + log([ O 2 ]/[HO2]). Thus, in the unbuffered water, for a pH drop from, e.g., 7 to 5, the molar ratio [ O 2 ]/[HO2] changes from about 158 to 1.58.

4. Conclusions

In the present report, buffered or unbuffered water was exposed to the species produced by an atmospheric pressure cold plasma in the form of a plasma jet, operating with argon, driven by audio frequency sinusoidal high voltage, and consuming less than 400 mW mean power. It was shown that radicals are produced in the gaseous phase and their interaction with the liquid targets leads to (i) evaporation, (ii) acidification, (iii) increased oxidizer concentrations, and (iv) increased ionic species, in agreement with previous reports. OH, H2O2, and O 2 were specifically identified and quantified by innovative methodologies.
Analytically, the above-mentioned quantities for 30 min plasma treatment of the unbuffered water were found to be: mass reduction 14.5%, pH decrease 1.98, redox potential increase 60.5 mV, conductivity increase 30.33 μS cm−1, OH concentration 550 nM, H2O2 concentration 350 μM, and O 2 concentration 850 nM. The corresponding values for the buffered solution were found to be: 15.6%, 0.18, 10 mV, 3.1 mS cm−1, 450 nM, 250 μM, and 80 nM. It was demonstrated that these physicochemical changes take place while both liquids maintain a low temperature. These combined features of the plasma activated water have important implications, both to biomedical and environmental fields.

Author Contributions

P.S.: conceptualization; investigation; methodology; project administration; funding acquisition; supervision; resources; writing—original draft preparation; writing—review and editing; validation. M.P.: investigation; methodology; software; data curation; formal analysis; validation; visualization. K.P.: investigation; methodology; software; data curation; formal analysis; visualization. E.K.: investigation; methodology; data curation; formal analysis. M.S.: investigation; methodology; data curation; formal analysis. P.P.: investigation; methodology; data curation; formal analysis. A.V.: investigation; methodology; data curation; formal analysis. E.G.: conceptualization; supervision; writing—review and editing; validation. C.D.G.: conceptualization; funding acquisition; supervision; resources; writing—original draft preparation; writing—review and editing; validation. S.G.: writing—review and editing; validation. C.K.: writing—review and editing; validation. All authors have read and agreed to the published version of the manuscript.

Funding

This work was supported by the Greek Ministry of Education. Part of the research conducted and presented in the present study was supported by the Hellenic Foundation for Research and Innovation (HFRI), under the HFRI PhD Fellowship grant (Number 653). Additionally, this work was supported by the "Andreas Mentzelopoulos Foundation" (Grant Number 33720000) of the University of Patras.

Institutional Review Board Statement

Not applicable.

Informed Consent Statement

Not applicable.

Data Availability Statement

The data presented in this study are available on request from the corresponding author. The data are not publicly available due to privacy.

Conflicts of Interest

The authors declare no conflict of interest.

Appendix A

Richmonds et al. [60] demonstrated that an atmospheric pressure micro-plasma can act as a gaseous, metal-free electrode to mediate electron transfer reactions in aqueous solutions. Ferricyanide was reduced to ferrocyanide by plasma electrons, and the reduction rate was found to depend on discharge current. They stated that the ability to initiate and control electrochemical reactions at the plasma–liquid interface opens a new direction for electrochemistry based on interactions between gas-phase electrons and ionic solutions.
Witzke et al. [61] used cell electrochemical setups consisting of direct current, atmospheric pressure micro-plasma jets sustained in a flow of argon gas. Micro-plasma was formed on the surface of the solution and operated as the cathode. Experimental evidence was presented that, in the case of water, plasma electrons are involved in electrolytic reactions leading to the conversion of protons (H+) to hydrogen gas. Reactions associated with water electrolysis were indirectly characterized by pH measurements that showed qualitatively and quantitatively that the liquid at the plasma interface increased in basicity, consistent with the reduction of protons by plasma electrons. Mass spectrometry measurements confirmed the evolution of hydrogen gas, directly providing evidence of water electrolysis. This work highlighted the critical role that plasma electrons can play in plasma–liquid interactions with broad implications for any plasma system involving an aqueous electrode.
Attri et al. [52] elucidated the mechanism of hydroxyl radicals (OH) generation and its lifetime measurements in bio-solution. They observed that plasma-initiated ultraviolet photolysis was responsible for the continuous generation of OH species which resulted in OH being major reactive species in the solution. The density and lifetime of OH species acted inversely proportional to one another with increasing depth inside the solution. The cause of increased lifetime of OH inside the solution is predicted using theoretical and semiempirical calculations. Further, to predict the mechanism of conversion of hydroxide ion ( O H ) to OH or H2O2 (hydrogen peroxide) and electron, they determined the current inside the solution of different pH values. Additionally, they investigated the critical criterion for OH interaction on cancer cell inducing apoptosis under effective OH exposure time.
Jablonowski et al. [53] reviewed a compilation of the work conducted between 2010 and 2015 in the field of plasma–liquid–tissue interaction, to reveal both the actual knowledge and the parts still missing for a complete understanding. They stated that, in general, independent of the atmospheric pressure plasma sources and the liquid system investigated, hydrogen peroxide (H2O2), as well as nitrite ( NO 2 ) and nitrate ( NO 3 ), were detected as stable reactive oxygen and nitrogen species (ROS, RNS/RONS). In non-buffered systems, pH decrease was found. They noted that, as most important precursors of hydrogen peroxide, as well as nitrite and nitrate, hydroxyl radicals(OH), superoxide anion radicals ( O 2 ), singlet oxygen (1O2), and nitric oxide(NO) have been identified and partially detected in different plasma-treated liquids. Finally, they mentioned that above all, peroxynitrite (ONOO) has been identified as playing a crucial role for biological effects of plasma-treated liquids.
Girard F. et al. [62] studied the interactions of a helium plasma jet (atmospheric ionization waves produced in a He:1%N2 mixture) with a commonly used physiological liquid in biology, i.e., phosphate buffered saline solution (PBS) at pH 7.4. Optical emission spectroscopy of the plasma phase revealed the formation in the He:1%N2 plasma jet of nitric oxide NO and hydroxyl HO derivatives which can lead to numerous RONS after dissolution in the exposed phosphate buffered saline. Experiments showed that an evaporation of the solution occurred under gas exposition and was amplified by the plasma, being mostly related to the interaction between the ionization waves and the gas flow. Further, UV-visible absorption spectroscopy was used to identify and quantify long-lived reactive oxygen and nitrogen species, namely nitrite (N O 2 ), nitrate (N O 3 ), as well as a short-lived species, i.e., peroxynitrite anion (ONOO).
Girard P. et al. [63] used a micro-plasma jet produced in helium and demonstrated that the concentration of H2O2, N O 2 and N O 3 can fully account for the majority of RONS produced in the plasma activated buffer. The role of these species on the viability of normal and tumor cell lines was investigated. Although the degree of sensitivity to H2O2 is cell type dependent, it was showed that H2O2 alone cannot account for the toxicity of helium plasma. Indeed, N O 2 , but not N O 3 , acts in synergy with H2O2 to enhance cell death in normal and tumor cell lines to a level similar to that observed after plasma treatment. These findings suggested that the efficiency of plasma treatment strongly depends on the combination of H2O2 and N O 2 in determined concentrations. It was also showed that the interaction of the helium plasma jet with the ambient air is required to generate N O 2 and N O 3 in solution.
Gorbanev et al. [64] addressed the analysis of the reactive species generated by nonthermal atmospheric pressure plasmas, which are widely employed in industrial and biomedical research, as well as first clinical applications. They summarized the progress in the detection of plasma-generated, short-lived, reactive oxygen, and nitrogen species in aqueous solutions, discussed the potential and limitations of various analytical methods in plasma–liquid systems, and provided an outlook on the possible future research goals in the development of short-lived, reactive species analysis methods.
Jablonowski et al. [65] stated that nitric oxide is a relatively stable free radical and an important signal molecule in plants, animals, and humans with high relevance for biological processes involving inflammatory processes, e.g., wound healing or cancer. The molecule can be detected in the gas phase of non-thermal plasma jets, making it a valuable tool for clinical intervention, but transport efficiency from the gas phase into the liquid phase or tissue remains to be clarified. To elucidate this fact, the nitric oxide concentration in buffered solutions was determined using electron paramagnetic resonance spectroscopy. The origin of the nitric oxide in the liquid could be excluded; therefore, potential precursors such as hydroxyl radicals, superoxide anions, atomic hydrogen, and stable species (nitrite, nitrate and hydrogen peroxide) were detected and the potential formation pathway, as well as ways of enhancing the production of nitric oxide by alteration of the feed gas and the surrounding gas composition during plasma treatment of the liquid, were pointed out.
Verlackt et al. [54] presented a 2D fluid dynamics model for the interaction between a plasma jet and liquid water. The results indicated that the formed reactive species originate either from the gas phase (with further solvation) or are formed at the liquid interface. A clear increase in the aqueous density of H2O2, HNO2/N O 2 and N O 3 was observed as a function of time, while the densities of O3, HO2/ O 2 and ONOOH/ONOO were found to quickly reach a maximum due to chemical reactions in solution.
Yoon et al. [66] investigated the mutual interaction between the plasma and plasma treated water, using a pin-to-liquid discharge system. It was found that plasma treated water affects not only the chemical properties but also the physical properties of the plasma, such as the breakdown voltage and the concentration of the plasma column. The decrease of the liquid surface tension of plasma treated water due to nitric oxide electrolyte ion from the plasma resulted in the increase of plasma current onto the surface of plasma treated water and vice versa. It was claimed that the feedback process is continued until the transition from normal discharge to abnormal discharge takes place.
Heirman et al. [55] presented the combination of a 0D chemical kinetics and a 2D fluid dynamics model to investigate the plasma treatment of a buffered water solution with the kINPen® plasma jet. Using this model, they calculated the gas and liquid flow profiles and the transport and chemistry of all species in the gas and liquid phases. Moreover, they evaluated the stability of the reactive oxygen and nitrogen species after plasma treatment. They found that of all species, only H2O2, HNO2/N O 2 and HNO3/N O 3 are stable in the buffered solution after plasma treatment. This is because both their production and loss processes in the liquid phase are dependent on short-lived radicals (e.g., OH, NO, and NO2).
Casado et al. [56] studied the interaction of an argon microwave plasma jet with a benzene layer on water. They found that the main products formed upon treatment were phenol, catechol, and nitrobenzene, proving that the jet was a source of radicals OH and NO2, inducing benzene oxidation and nitration.
Lin et al. [67] investigated the formation of aqueous hydrogen peroxide (H2O2aq) in a DC discharge plasma–liquid system with liquid as the anode. The theoretical analysis and experimental results showed that the H2O2aq formation process was mostly controlled by the aqueous electron-induced reactions in the liquid zone directly affected by the plasma. It was shown that the low H2O2aq yield in this system was caused by quenching the dissolved OH radicals through aqueous electrons and alkalization in the plasma-directly-affected liquid zone.
Oinuma et al. [57] stated that multiphase transfer of OH radicals is highly transport limited and, to overcome transport limits, the plasma activation of aerosols, small liquid droplets interspersed in the plasma, has been proposed. Thus, they reported a combined experimental and modeling study of a controlled plasma-droplet interaction experiment using a diffuse RF glow discharge in He:0.2%H2O with detailed plasma diagnostics, ex-situ analysis of the plasma induced chemistry in the droplet containing formate, droplet trajectory, and size measurements. This enabled a quantitative study of the reactivity transfer of OH from the gas phase plasma to the liquid phase and how its diffusion limitations impact formate decomposition in the water droplet. For a droplet with a diameter of 36 μm, they observed 50% reduction in formate concentration in the droplets after plasma treatment for droplet residence times in the plasma of about 10 ms. These short droplet residence times in the plasma allowed, in some cases, for droplet size reductions of about 5% in spite gas temperatures of 360 K. A one dimensional reaction–diffusion model was used to calculate the OH transport and formate oxidation inside the droplet and was able to predict the conversion of formate by plasma in a droplet without any fitting parameters. The model further showed that formate conversion is dominated by near-interfacial reactions with OH radicals and is limited by diffusion of formate in the droplet.
Ng et al. [68] realized two distinct discharge compositions by modifying the location of the ground electrode in a pin-to-liquid plasma system. Through this simple modification to the configurations, the spatiotemporal characteristics of the discharge were significantly affected which, in turn, affected the composition of the generated plasma activated water. Colorimetric testing of the plasma activated water generated from each system revealed that only one configuration was able to generate plasma activated water with a high concentration of H2O2. Using time-, space-, and wavelength-resolved imaging of excited plasma species [OH, N2(SPS), N 2 + (FNS), and atomic O], the differences in plasma activated water composition were linked to the differences observed in the discharge dynamics between the two configurations.
Rathore and Nema [58] studied the effect of process parameters, viz., air flow rate, water stirrer speed, and the temperature of water during plasma–water interaction on the reactivity and electrical conductivity of plasma activated water using a three-way full factorial design of experiments. They also attempted to optimize these process parameters. At optimum values of these parameters, they studied how the physicochemical properties of the plasma activated water vary by changing the volume of water and discharge power. Furthermore, they studied the physicochemical properties of the plasma-activated solution and how the electrical conductivity and pH of virgin solutions affect these properties. The obtained results showed that the flow rate of air, plasma treatment time with water, volume of water, and plasma discharge power, play a significant role in controlling the reactivity and electrical conductivity of plasma activated water. Moreover, the pH and electrical conductivity of virgin solution do not have a significant (p < 0.05) impact on the reactivity of plasma activated solution. This investigation also showed the effect of the aging time on the reactive oxygen-nitrogen species and the physicochemical properties of plasma activated water. The observed changes in physicochemical properties, and NO 3 ion and H2O2 concentrations in the plasma activated water were less than 10%. However, NO 2 ions and dissolved O3 concentration in the plasma activated water decreased significantly over time.
Volvok et al. [69] mentioned that there are three major multi-electron reactions in nature: nitrogen fixation by bacteria, water oxidation in photosynthesis, and oxygen reduction during respiration, whereas they found that a cold atmospheric pressure He-plasma jet can oxidize N2 to HNO3 and HNO2 at low temperature and atmospheric pressure at the plasma–air–water interface. Redox reactions induced by cold plasma occurred not only at the plasm–air and plasma–water interfaces, but also in the volume of the aqueous phase. Analysis of the images which displayed the presence of pH indicators in the aqueous phase showed that redox reactions and acid formation occur at the plasma–air–water interface and the products of electrochemical reactions slowly diffuse into the bulk of the aqueous solution. Acidification of an aqueous solution during the plasma treatment was correlated with an increase in HNOx concentration in the aqueous phase. HNO2 was found to be unstable and could be oxidized to HNO3 by plasma generated H2O2 or ozone. It was suggested that the plasma induced production of HNOx at the plasma–water interface at room temperature and atmospheric pressure can be used in the industry for nitrogen fixation and production of nitrogen compounds, replacing the expensive old technology processes.
Wartel et al. [70] worked towards the control of the plasma activated water chemical composition. To achieve this aim, a UV spectrophotometric method (190–255 nm) was implemented to simultaneously detect the nitrate and nitrite ions in plasma activated water by a gliding arc discharge reactor at atmospheric pressure. The method was tested in plasma activated distilled water and in plasma activated tap water and it showed significant increases of nitrite and nitrate concentrations. Preliminary results on both specimen kinetics evolutions highlighted a different behavior of the temporal post-discharge reactions leading to non-conversion of the nitrite ions in the case of plasma activated tap water. The near non-existence of acidification during and after plasma activation encountered in the latter specimen was due to high levels of carbonate species in tap water acting as a buffer solution. Indeed, the presence of hydrogen carbonate (HC O 3 ) led to the acidity consumption during plasma activation, whereas the presence of non-dissolved limestone in hard water (CaCO3) acted as carbonates reserve, and this induced the acidity consumption after plasma treatment.
Lamichhane et al. [71] adjusted the downstream length of a plasma jet to regulate reactive species production in an AC-driven argon plasma jet. Jets with short downstream lengths were found to be dominated by RNS, whereas longer ones were dominated by ROS. The energy impact collision between energetic electrons and diffused ambient air was primarily responsible for the generation of RNS in argon plasma. Short plasma jets had a higher electron temperature in the plasma effluent, allowing for better excitation and ionization of N2 molecules. In contrast, in longer jets, electrons transferred most of their energy to neutrals and moisture, even before the diffusion of ambient air. Thus, the production of OH radicals and H2O2 was dominant in longer plasma jets. Further, the ratio of NO 2 to H2O2 in plasma activated water decreased from 1.8 to 0.07, as the downstream length was increased from 1 cm to 10 cm. They stated that RNS-enriched short plasma jets were appropriate for immune cell activation, jets of intermediate length were suitable for gold nanoparticle formation because of the synergistic action of ROS and electron energy, and ROS-dominated longer plasma jets were excellent for methylene blue degradation.

References

  1. Becker, K.H.; Kogelschatz, U.; Schoenbach, K.H.; Barker, R.J. Non-Equilibrium Air Plasmas at Atmospheric Pressure. Institute of Physics; Series in Plasma Physics; CRC Press: Bristol, UK, 2005. [Google Scholar]
  2. NATO Report. In Plasma Based Flow Control for Performance and Control of Military Vehicles. AC/323(AVT-190)TP/866; NATO: Neuilly-sur-Seine, France, 2021.
  3. Shafique, A.; Rangasamy, V.S.; Vanhulsel, A.; Safari, M.; Gross, S.; Adriaensens, P.; Van Bael, M.K.; Hardy, A.; Sallard, S. Dielectric barrier discharge (DBD) plasma coating of sulfur for mitigation of capacity fade in lithium–sulfur batteries. ACS Appl. Mater. Interfaces 2021, 13, 28072–28089. [Google Scholar] [CrossRef] [PubMed]
  4. Dong, P.; Nie, X.; Jin, Z.; Huang, Z.; Wang, X.; Zhang, X. Dual dielectric barrier discharge plasma treatments for synthesis of Ag–TiO2 functionalized polypropylene fabrics. Ind. Eng. Chem. Res. 2019, 58, 7734–7741. [Google Scholar] [CrossRef]
  5. King, B.; Patel, D.; Chen, J.Z.; Drapanauskaite, D.; Handler, R.; Nozaki, T.; Baltrusaitis, J. Comprehensive process and environmental impact analysis of integrated DBD plasma steam methane reforming. Fuel 2021, 304, 121328. [Google Scholar] [CrossRef]
  6. Liu, Y.; Kolbakir, C.; Hu, H.; Hu, H. A comparison study on the thermal effects in DBD plasma actuation and electrical heating for aircraft icing mitigation. Int. J. Heat Mass Transf. 2018, 124, 319–330. [Google Scholar] [CrossRef]
  7. Kuchenbecker, M.; Bibinov, N.; Kaemlimg, A.; Wandke, D.; Awakowicz, P.; Viöl, W. Characterization of DBD plasma source for biomedical applications. J. Phys. D Appl. Phys. 2009, 42, 045212. [Google Scholar] [CrossRef]
  8. Yagyu, Y.; Hatayama, Y.; Hayashi, N.; Mishima, T.; Nishioka, T.; Sakudo, A.; Ihara, T.; Ohshima, T.; Kawasaki, H.; Suda, Y. Direct plasma disinfection of green mold spore on citrus by atmospheric pressure dielectric barrier discharge for agricultural applications. Trans. Mater. Res. Soc. 2016, 41, 127–130. [Google Scholar] [CrossRef] [Green Version]
  9. Roy, S.; Choudhury, B.; Johnson, J.; Schindler-Tyka, A. Application of dielectric barrier discharge for improving food shelf life and reducing spoilage. Sci. Rep. 2021, 11, 19200. [Google Scholar] [CrossRef]
  10. Rumbach, P.; Clarke, J.P.; Go, D.B. Electrostatic Debye layer formed at a plasma-liquid interface. Phys. Rev. E 2017, 95, 053203. [Google Scholar] [CrossRef]
  11. Akishev, Y.; Arefi-Khonsari, F.; Demir, A.; Grushin, M.; Karalnik, V.; Petryakov, A.; Trushkin, N. The interaction of positive streamers with bubbles floating on a liquid surface. Plasma Sources Sci. Technol. 2015, 24, 065021. [Google Scholar] [CrossRef]
  12. Bruggeman, P.J.; Kushner, M.J.; Locke, B.R.; Gardeniers, J.G.E.; Graham, W.G.; Graves, D.B.; Hofman-Caris, R.C.; Maric, D.; Reid, J.P.; Ceriani, E.; et al. Plasma-liquid interactions: A review and roadmap. Plasma Sources Sci. Technol. 2016, 25, 053002. [Google Scholar] [CrossRef]
  13. Yue, Y.; Santosh, V.S.; Kondeti, K.; Sadeghi, N.; Bruggeman, P.J. Plasma dynamics, instabilities and OH generation in a pulsed atmospheric pressure plasma with liquid cathode: A diagnostic study. Plasma Sources Sci. Technol. 2022, 31, 025008. [Google Scholar] [CrossRef]
  14. Kaushik, N.K.; Ghimire, B.; Li, Y.; Adhikari, M.; Veerana, M.; Kaushik, N.; Jha, N.; Adhikari, B.; Lee, S.J.; Masur, K.; et al. Biological and medical applications of plasma-activated media, water and solutions. Biol. Chem. 2019, 400, 39–62. [Google Scholar] [CrossRef] [PubMed]
  15. Rezaei, F.; Vanraes, P.; Nikiforov, A.; Morent, R.; De Geyter, N. Applications of plasma-liquid systems: A review. Materials 2019, 2, 2751. [Google Scholar] [CrossRef] [PubMed] [Green Version]
  16. Zhao, Y.M.; Patange, A.; Sun, D.W.; Tiwari, B. Plasma-activated water: Physicochemical properties, microbial inactivation mechanisms, factors influencing antimicrobial effectiveness, and applications in the food industry. Compr. Rev. Food Sci. Food Saf. 2020, 19, 3951–3979. [Google Scholar] [CrossRef]
  17. Wang, J.; Sun, Y.; Jiang, H.; Feng, J. Removal of caffeine from water by combining dielectric barrier discharge (DBD) plasma with goethite. J. Saudi Chem. Soc. 2017, 21, 545–557. [Google Scholar] [CrossRef] [Green Version]
  18. Bai, N.; Sun, P.; Zhou, H.; Wu, H.; Wang, R.; Liu, F.; Zhu, W.; Lopez, J.L.; Zhang, J.; Fang, J. Inactivation of Staphylococcus aureus in water by a cold, He/O2 atmospheric pressure plasma microjet. Plasma Process. Polym. 2011, 8, 424–431. [Google Scholar] [CrossRef]
  19. Stoleru, V.; Burlica, R.; Mihalache, G.; Dirlau, D.; Padureanu, S.; Teliban, G.-C.; Astanei, D.; Cojocaru, A.; Beniuga, O.; Patras, A. Plant growth promotion effect of plasma activated water on Lactuca sativa L. cultivated in two different volumes of substrate. Sci. Rep. 2020, 10, 20920. [Google Scholar] [CrossRef]
  20. Milhan, N.V.M.; Chiappim, W.; da Graça Sampaio, A.; da Cruz Vegian, M.R.; Pessoa, R.S.; Koga-Ito, C.Y. Applications of Plasma-Activated Water in Dentistry: A Review. Int. J. Mol. Sci. 2022, 23, 4131. [Google Scholar] [CrossRef]
  21. Rahman, M.; Hasan, M.S.; Islam, R.; Rana, R.; Sayem, A.S.M.; As Sad, M.A.; Matin, A.; Raposo, A.; Zandonadi, R.P.; Han, H.; et al. Plasma-activated water for food safety and quality: A review of recent developments. Int. J. Environ. Res. Public Health 2022, 19, 6630. [Google Scholar] [CrossRef]
  22. Acharya, T.R.; Lee, G.J.; Choi, E.H. Influences of plasma plume length on structural, optical and dye degradation properties of citrate-stabilized silver nanoparticles synthesized by plasma-assisted reduction. Nanomaterials 2022, 12, 2367. [Google Scholar] [CrossRef]
  23. von Woedtke, T.; Schmidt, A.; Bekeschus, S.; Wende, K.; Weltmann, K.D. Plasma medicine: A field of applied redox biology. In Vivo 2019, 33, 1011–1026. [Google Scholar] [CrossRef] [PubMed] [Green Version]
  24. Vanraes, P.; Bogaerts, A. Plasma physics of liquids—A focused review. Appl. Phys. Rev. 2018, 5, 031103. [Google Scholar] [CrossRef]
  25. Svarnas, P.; Spiliopoulou, A.; Koutsoukos, P.G.; Gazeli, K.; Anastassiou, E.D. Acinetobacter baumannii deactivation by means of DBD-based helium plasma jet. Plasma 2019, 2, 77–90. [Google Scholar] [CrossRef] [Green Version]
  26. Pefani-Antimisiari, K.; Athanasopoulos, D.K.; Marazioti, A.; Sklias, K.; Rodi, M.; de Lastic, A.-L.; Mouzaki, A.; Svarnas, P.; Antimisaris, S.G. Synergistic effect of cold atmospheric pressure plasma and free or liposomal doxorubicin on melanoma cells. Sci. Rep. 2021, 11, 14788. [Google Scholar] [CrossRef]
  27. Athanasopoulos, D.; Svarnas, P.; Ladas, S.; Kennou, S.; Koutsoukos, P. On the wetting properties of human stratum corneum epidermidis surface exposed to cold atmospheric-pressure pulsed plasma. Appl. Phys. Lett. 2018, 112, 213703. [Google Scholar] [CrossRef]
  28. Svarnas, P.; Matrali, S.H.; Gazeli, K. Aleiferis, S.; Clément, F.; Antimisiaris, S.G. Atmospheric-pressure guided streamers for liposomal membrane disruption. Appl. Phys. Lett. 2012, 101, 264103. [Google Scholar] [CrossRef]
  29. Gazeli, K.; Svarnas, P.; Vafeas, P.; Papadopoulos, P.K.; Gkelios, A.; Clément, F. Investigation on streamers propagating into a helium jet in air at atmospheric pressure: Εlectrical and optical emission analysis. J. Appl. Phys. 2013, 114, 103304. [Google Scholar] [CrossRef]
  30. Cardoso, R.P.; Belmonte, T.; Keravec, P.; Kosior, F.; Henrion, G. Influence of impurities on the temperature of an atmospheric helium plasma in microwave resonant cavity. J. Phys. D Appl. Phys. 2007, 40, 1394–1400. [Google Scholar] [CrossRef]
  31. Roland, U.; Renschen, C.P.; Lippik, D.; Stallmach, F.; Holzer, F. A new fiber optical thermometer and its application for process control in strong electric, magnetic, and electromagnetic fields. Sens. Lett. 2003, 1, 93–98. [Google Scholar] [CrossRef]
  32. Papadopoulos, P.K.; Athanasopoulos, D.; Sklias, K.; Svarnas, P.; Mourousias, N.; Vratsinis, K.; Vafeas, P. Generic residual charge based model for the interpretation of the electrohydrodynamic effects in cold atmospheric pressure plasmas. Plasma Sources Sci. Technol. 2019, 28, 065005. [Google Scholar] [CrossRef]
  33. Georgiou, C.D.; Papapostolou, I.; Grintzalis, K. Superoxide radical detection in cells, tissues, organisms (animals, plants, insects, microorganisms) and soils. Nat. Prot. 2008, 3, 1679–1692. [Google Scholar] [CrossRef] [PubMed]
  34. Linxiang, L.; Abe, Y.; Nagasawa, Y.; Kudo, R.; Usui, N.; Imai, K.; Mashino, T.; Mochizuki, M.; Miyata, N. An HPLC assay of hydroxyl radicals by the hydroxylation reaction of terephthalic acid. Biomed. Chromatogr. 2004, 18, 470–474. [Google Scholar] [CrossRef] [PubMed]
  35. Skipitari, M.; Kalaitzopoulou, E.; Papadea, P.; Varemmenou, A.; Gavriil, V.E.; Sarantopoulou, E.; Cefalas, A.-C.; Tsakas, S.; Rosmaraki, E.; Margiolaki, I.; et al. Titanium dioxide nanoparticle-based hydroxyl and superoxide radical production for oxidative stress biological simulations. J. Photochem. Photobiol. A Chem. 2022, 435, 114290. [Google Scholar] [CrossRef]
  36. Grintzalis, K.; Zisimopoulos, D.; Grune, T.; Weber, D.; Georgiou, C.D. Method for the simultaneous determination of free/protein malondialdehyde and lipid/protein hydroperoxides. Free Radic. Biol. Med. 2013, 59, 27–35. [Google Scholar] [CrossRef] [PubMed]
  37. Zisimopoulos, D.N.; Kalaitzopoulou, E.; Skipitari, M.; Papadea, P.; Panagopoulos, N.T.; Salahas, G.; Georgiou, C.D. Detection of superoxide radical in all biological systems by Thin Layer Chromatography. Arch. Biochem. Biophys. 2022, 716, 109110. [Google Scholar] [CrossRef]
  38. Gazeli, K.; Svarnas, P.; Held, B.; Marlin, L.; Clément, F. Possibility of controlling the chemical pattern of He and Ar “guided streamers” by means of N2 or O2 additives. J. Appl. Phys. 2015, 117, 093302. [Google Scholar] [CrossRef]
  39. NIST, Atomic Spectra Database Lines Form (Online). Available online: https://physics.nist.gov/PhysRefData/ASD/lines_form.html (accessed on 20 November 2022).
  40. Zhao, G.B.; Argyle, M.D.; Radosz, M. Optical emission study of nonthermal plasma confirms reaction mechanisms involving neutral rather than charged species. J. Appl. Phys. 2007, 101, 033303. [Google Scholar] [CrossRef] [Green Version]
  41. Xiong, Q.; Nikiforov, A.Y.; Lu, X.P.; Leys, C. High-speed dispersed photographing of an open-air argon plasma plume by a grating–ICCD camera system. J. Phys. D Appl. Phys. 2010, 43, 415201. [Google Scholar] [CrossRef]
  42. Gazeli, K.; Svarnas, P.; Lazarou, C.; Anastassiou, C.; Georghiou, G.E.; Papadopoulos, P.K.; Clément, F. Physical interpretation of a pulsed atmospheric pressure plasma jet following parametric study of the UV–to–NIR emission. Phys. Plasmas 2020, 27, 123503. [Google Scholar] [CrossRef]
  43. Papadopoulos, P.K.; Vafeas, P.; Svarnas, P.; Gazeli, K.; Hatzikonstantinou, P.M.; Gkelios, A.; Clément, F. Interpretation of the gas flow field modification induced by guided streamer (“plasma bullet”) propagation. J. Phys. D Appl. Phys. 2014, 47, 425203. [Google Scholar] [CrossRef]
  44. Logothetis, D.K.; Papadopoulos, P.K.; Svarnas, P.; Vafeas, P. Numerical simulation of the interaction between helium jet flow and an atmospheric-pressure “plasma-jet”. Comput. Fluids 2016, 140, 11–18. [Google Scholar] [CrossRef]
  45. Slikboer, E.; Walsh, J.L. Characterization of a kHz sinusoidal Argon plasma jet impinging on water using Thomson scattering and fast imaging. J. Phys. D Appl. Phys. 2021, 54, 325201. [Google Scholar] [CrossRef]
  46. Svarnas, P.; Papadopoulos, P.K.; Athanasopoulos, D.; Sklias, K.; Gazeli, K.; Vafeas, P. Parametric study of thermal effects in a capillary dielectric-barrier discharge related to plasma jet production: Experiments and numerical modelling. J. Appl. Phys. 2018, 124, 064902. [Google Scholar] [CrossRef]
  47. Babbs, C.F.; Steiner, M.G. Detection and quantitation of hydroxyl radical using dimethyl sulfoxide as molecular probe. Meth. Enzymol. 1990, 186, 137–147. [Google Scholar]
  48. Klein, M.S.; Cohen, G.; Cederbaum, I.A. The interaction of hydroxyl radicals with dimethylsulfoxide. FEBS Lett. 1980, 116, 220–222. [Google Scholar] [CrossRef] [Green Version]
  49. Papapostolou, I.; Patsoukis, N.; Georgiou, C.D. The fluorescence detection of superoxide radical using hydroethidine could be complicated by the presence of heme-proteins. Anal. Biochem. 2004, 332, 290–298. [Google Scholar] [CrossRef]
  50. Patsoukis, N.; Papapostolou, I.; Georgiou, C.D. Interference of non-specific peroxidases in the fluorescence detection of superoxide radical by hydroethidine oxidation: A new assay for H2O2. Anal. Bioanal. Chem. 2005, 381, 1065–1072. [Google Scholar] [CrossRef]
  51. Zielonka, J.; Vasquez-Vivar, J.; Kalyanaraman, B. Detection of 2-hydroxyethidium in cellular systems: A unique marker product of superoxide and hydroethidine. Nat. Prot. 2008, 3, 8–21. [Google Scholar] [CrossRef]
  52. Attri, P.; Kim, Y.; Park, D.; Park, J.H.; Hong, Y.J.; Uhm, H.S.; Kim, K.-N.; Fridman, A.; Choi, E.H. Generation mechanism of hydroxyl radical species and its lifetime prediction during the plasma-initiated ultraviolet (UV) photolysis. Sci. Rep. 2015, 5, 9332. [Google Scholar] [CrossRef] [Green Version]
  53. Jablonowski, H.; von Woedtke, T. Research on plasma medicine-relevant plasma–liquid interaction: What happened in the past five years? Clin. Plasma Med. 2015, 3, 42–52. [Google Scholar] [CrossRef]
  54. Verlackt, C.C.W.; Van Boxem, W.; Bogaerts, A. Transport and accumulation of plasma generated species in aqueous solution. Phys. Chem. Chem. Phys. 2018, 20, 6845–6859. [Google Scholar] [CrossRef]
  55. Heirman, P.; Van Boxem, W.; Bogaerts, A. Reactivity and stability of plasma-generated oxygen and nitrogen species in buffered water solution: A computational study. Phys. Chem. Chem. Phys. 2019, 21, 12881–12894. [Google Scholar] [CrossRef]
  56. Casado, E.; Garcia, M.C.; Krawczyk, D.A.; Romero-Salguero, F.-J.; Rodero, A. Study of the plasma–liquid interaction for an argon nonthermal microwave plasma jet from the analysis of benzene degradation. Plasma Process. Polym. 2020, 17, 2000030. [Google Scholar] [CrossRef]
  57. Oinuma, G.; Nayak, G.; Du, Y.; Bruggeman, P.J. Controlled plasma–droplet interactions: A quantitative study of OH transfer in plasma–liquid interaction. Plasma Sources Sci. Technol. 2020, 29, 14. [Google Scholar] [CrossRef]
  58. Rathore, V.; Nema, S.K. Optimization of process parameters to generate plasma activated water and study of physicochemical properties of plasma activated solutions at optimum condition. J. Appl. Phys. 2021, 129, 084901. [Google Scholar] [CrossRef]
  59. Bielski, B.H.J.; Cabelli, D.E.; Arudi, R.L.; Ross, A.B. Reactivity of HO2/ O 2 radicals in aqueous solution. J. Phys. Chem. Ref. Data 1985, 14, 1041–1100. [Google Scholar] [CrossRef]
  60. Richmonds, C.; Witzke, M.; Bartling, B.; Lee, S.W.; Wainright, J.; Liu, C.C.; Sankaran, R.M. Electron-transfer reactions at the plasma-liquid interface. J. Am. Chem. Soc. 2011, 133, 17582–17585. [Google Scholar] [CrossRef]
  61. Witzke, M.; Rumbach, P.; Go, D.B.; Sankaran, R.M. Evidence for the electrolysis of water by atmospheric-pressure plasmas formed at the surface of aqueous solutions. J. Phys. D Appl. Phys. 2012, 45, 442001. [Google Scholar] [CrossRef] [Green Version]
  62. Girard, F.; Badets, V.; Blanc, S.; Gazeli, K.; Marlin, L.; Authier, L.; Svarnas, P.; Sojic, N.; Clément, F.; Arbault, S. Formation of reactive nitrogen species including peroxynitrite in physiological buffer exposed to cold atmospheric plasma. RSC Adv. 2016, 6, 78457–78467. [Google Scholar] [CrossRef]
  63. Girard, P.M.; Arbabian, A.; Fleury, M.; Bauville, G.; Puech, V.; Dutreix, M.; Sousa, J.S. Synergistic effect of H2O2 and NO2 in cell death induced by cold atmospheric He plasma. Sci. Rep. 2016, 6, 29098. [Google Scholar] [CrossRef] [PubMed] [Green Version]
  64. Gorbanev, Y.; Privat-Maldonado, A.; Bogaerts, A. Analysis of short-lived reactive species in plasma-air-water systems: The Dos and the Do Nots. Anal. Chem. 2018, 90, 13151–13158. [Google Scholar] [CrossRef] [PubMed]
  65. Jablonowski, H.; Schmidt-Bleker, A.; Weltmann, K.-D.; von Woedtkeb, T.; Wende, K. Non-touching plasma–liquid interaction—Where is aqueous nitric oxide generated? Phys. Chem. Chem. Phys. 2018, 20, 25387–25398. [Google Scholar] [CrossRef] [Green Version]
  66. Yoon, S.Y.; Jeon, H.; Yi, C.; Park, S.; Ryu, S.; Kim, S.B. Mutual interaction between plasma characteristics and liquid properties in AC-driven pin-to-liquid discharge. Sci. Rep. 2018, 8, 12037. [Google Scholar] [CrossRef] [PubMed] [Green Version]
  67. Lin, J.; He, X.; Chen, Q.; Xiong, Q.; Li, J.; Xin, W.; Guolong, C.; Liu, Q.H.; Ostrikov, K. The formation mechanism of aqueous hydrogen peroxide in a plasma-liquid system with liquid as the anode. Eur. Phys. J. D 2020, 74, 80. [Google Scholar] [CrossRef]
  68. Ng, S.W.; Slikboer, E.; Dickenson, A.; Walsh, J.L.; Lu, P.; Boehm, D.; Bourke, P. Characterization of an atmospheric pressure air plasma device under different modes of operation and their impact on the liquid chemistry. J. Appl. Phys. 2021, 129, 123303. [Google Scholar] [CrossRef]
  69. Volkov, A.G.; Bookal, A.; Hairston, J.S.; Roberts, J.; Taengwa, G.; Patel, D. Mechanisms of multielectron reactions at the plasma/water interface: Interfacial catalysis, RONS, nitrogen fixation, and plasma activated water. Electrochim. Acta 2021, 385, 138441. [Google Scholar] [CrossRef]
  70. Wartel, M.; Faubert, F.; Dirlau, I.D.; Rudz, S.; Pellerin, N.; Astanei, D.; Burlica, R.; Hnatiuc, B.; Pellerin, S. Analysis of plasma activated water by gliding arc at atmospheric pressure: Effect of the chemical composition of water on the activation. J. Appl. Phys. 2021, 129, 233301. [Google Scholar] [CrossRef]
  71. Lamichhane, P.; Acharya, T.R.; Kaushik, N.; Nguyen, L.N.; Lim, J.S.; Hessel, V.; Kaushik, N.K.; Choi, E.H. Non-thermal argon plasma jets of various lengths for selective reactive oxygen and nitrogen species production. J. Environ. Chem. Eng. 2022, 10, 107782. [Google Scholar] [CrossRef]
Figure 1. Main components of the experimental setup. 1: plasma jet reactor; 2: carrier gas reservoir; 3: mass flow controller; 4: signal generator; 5: power amplifier; 6: step-up transformer; 7: high voltage divider; 8: oscilloscope; 9: current transformer; 10: specimen; 11: specimen holder; 12a: optical thermometer circuitry; 12b: optical fiber; 13a: spectrometer; 13b: CCD camera; 13c: optical matcher; 13d: micro-slit; 13e: optical fiber; 13f: optical probe; 14: optical breadboard. The top-right inset illustrates the plasma-DDW interaction. Swirling-induced agitation is distinguishable, whereas the yellowish color is due to the reaction between HE and O 2 , which forms 2-OH-E+.
Applsci 12 11950 g001
Figure 2. Representative discharge waveforms in absence of liquid target. (a) Voltage (black) and DBD current (red). (b) Voltage (black) and Jet current (red). Operating conditions: 11 kVpp, 17.5 kHz, and 1.5 slm.
Applsci 12 11950 g002
Figure 3. (a) and (b) Optical emission wide scan spectra in the UV-NIR range and species identification; all atomic lines in (b) refer to Ar (see Table 1 for details on species identification and transitions). (c) Experimentally and numerically determined rotational distributions of the O H :   A 2 Σ + ( 0 ) Χ 2 Π ( 0 ) molecule. Operating conditions: 11 kVpp, 17.5 kHz, and 1.5 slm.
Applsci 12 11950 g003
Figure 4. Optical emission intensity of the main emissive species detected as a function of the applied voltage amplitude. (a) N2 and OH species. (b) Ar species. Operational conditions: 17.5 kHz and 1.5 slm. Mean values and standard deviations are calculated from two series of experiments carried out on different dates.
Applsci 12 11950 g004
Figure 5. Optical emission intensity of the main emissive species detected as a function of the applied voltage frequency. (a) N2 and OH species. (b) Ar species. Operational conditions: 11 kVpp and 1.5 slm. Mean values and standard deviations are calculated from two series of experiments carried out on different dates.
Applsci 12 11950 g005
Figure 6. Optical emission intensity of the main emissive species detected as a function of the argon flow rate. (a) N2 and OH species. (b) Ar species. Operational conditions: 11 kVpp and 17.5 kHz. Mean values and standard deviations are calculated from two series of experiments carried out on different dates.
Applsci 12 11950 g006
Figure 7. Distinction between the mean electric power consumed by the coaxial DBD and the plasma jet in three different cases: (i) free running plasma jet; (ii) plasma jet impinging onto water; (iii) plasma jet impinging onto buffer solution. Mean values and standard deviations are calculated from 30 (voltage × current) waveform pairs, with each pair to be recorded over 3 voltage periods. Operating conditions: 11 kVpp, 17.5 kHz, and 1.5 slm.
Applsci 12 11950 g007
Figure 8. Liquid mass evolution versus time in the case of (a) DDW and (b) PBS. Three different scenarios are examined: (i) liquid settled in ambient air; (ii) liquid is impinged by Ar flow only; (iii) liquid is impinged by Ar plasma jet. Mean values and standard deviations are calculated from 3 series of experiments carried out on different dates. Operating conditions: 11 kVpp, 17.5 kHz, and 1.5 slm.
Applsci 12 11950 g008
Figure 9. Liquid temperature variation (%) with respect to the ambient temperature versus time in the case of (a) DDW and (b) PBS. Three different scenarios are examined: (i) liquid settled in ambient air; (ii) liquid is impinged by Ar flow only; (iii) liquid is impinged by Ar plasma jet. Mean values and standard deviations are calculated from two series of experiments carried out on different dates (we show here only the maximum, i.e., the worst case, standard deviation observed in each case). Operating conditions: 11 kVpp, 17.5 kHz, and 1.5 slm.
Applsci 12 11950 g009
Figure 10. pH evolution versus the treatment time in the case of (a) DDW and (b) PBS. Mean values and standard deviations are calculated from two series of experiments carried out on different dates. Operating conditions: 11 kVpp, 17.5 kHz, and 1.5 slm.
Applsci 12 11950 g010
Figure 11. Redox potential evolution versus the treatment time in the case of (a) DDW and (b) PBS. Mean values and standard deviations are calculated from two series of experiments carried out on different dates. Operating conditions: 11 kVpp, 17.5 kHz, and 1.5 slm.
Applsci 12 11950 g011
Figure 12. Conductivity evolution versus the treatment time in the case of (a) DDW and (b) PBS (see text for discussion on the extrapolation curve between 20 and 30 min). Mean values and standard deviations are calculated from two series of experiments carried out on different dates. Operating conditions: 11 kVpp, 17.5 kHz, and 1.5 slm.
Applsci 12 11950 g012
Table 1. Principal emissive species in the argon plasma jet.
Speciesλ (nm)Vibrational Transition [38]
v′–v″ (Δv)
Lower Level
El (eV)
Upper Level
Eu (eV)
Radiative Lifetime
τ (ns)
OH :   A 2 Σ + X2Π309 [38]0–0(0)-4 [38]690 [38]
N 2 ( SPS ) :   C 3 Π u   B3Πg337.13 [38]0–0(0)- 36.6–42 ± 2 [38]
N 2 ( SPS ) :   C 3 Π u B3Πg357.69 [38]0–1(−1)- -
N 2 ( SPS ) :   C 3 Π u B3Πg380.49 [38]0–2(−2)- -
Ar I: (2P01/2)4p → (2P03/2)4s696.54 [39]-11.54 [39]13.32 [39]-
Ar I: (2P01/2)4p → (2P03/2)4s706.72 [39]-11.54 [39]13.30 [39]29 [38,40]
Ar I: (2P01/2)4p → (2P03/2)4s727.29 [39]-11.62 [39]13.32 [39]28.3 [38,40]
Ar I: (2P01/2)4p → (2P03/2)4s738.39 [39]-11.62 [39]13.30 [39]29 [38,40]
Ar I: (2P03/2)4p → (2P03/2)4s751.46 [39]-11.62 [39]13.27 [39]24.4 [38,40]
Ar I: (2P03/2)4p → (2P03/2)4s763.51 [39]-11.54 [39]13.17 [39]29.4 [38,40]
Ar I: (2P01/2)4p → (2P01/2)4s772.42 [39]-11.72 [39]13.32 [39]28.3 [38,40]
Ar I: (2P01/2)4p → (2P01/2)4s794.81 [39]-11.72 [39]13.28 [39]29.3 [38,40]
Ar I: (2P03/2)4p → (2P03/2)4s801.47 [39]-11.54 [39]13.09 [39]30.6 [38,40]
Ar I: (2P03/2)4p → (2P03/2)4s811.53 [39]-11.54 [39]13.07 [39]30.7 [38,40]
Ar I: (2P01/2)4p → (2P01/2)4s826.45 [39]-11.82 [39]13.32 [39]28.3 [38,40]
Ar I: (2P01/2)4p → (2P01/2)4s840.82 [39]-11.82 [39]13.30 [39]29 [38,40]
Ar I: (2P03/2)4p → (2P03/2)4s842.46 [39]-11.62 [39]13.09 [39]30.6 [38,40]
Ar I: (2P01/2)4p → (2P01/2)4s852.14 [39]-11.82 [39]13.28 [39]29.3 [38,40]
Ar I: (2P03/2)4p → (2P03/2)4s912.29 [39,40]-11.54 [39,40]12.90 [39,40]-
Ar I: (2P03/2)4p → (2P01/2)4s922.45 [39,40]-11.82 [39,40]13.17 [39,40]29.4 [40]
Table 2. Plasma generated OH and H2O2 in DDW and PBS; values are averages from 5 repeats, with standard deviation around 5%.
OH (2-OH-TPA) (nM)H2O2 (μM)ΔpH
Plasma-exposed: TPA in DDW565 (565) ± 27359 ± 172 ± 0.02
Plasma-exposed: TPA + DMSO
(OH scavenger) in DDW
0 (0)336 ± 152 ± 0.01
Plasma-non-exposed: TPA in DDW0 (0)0 (0)0 ± 0.02
Plasma-exposed: TPA in PBS481 (481) ± 23255 ± 110 ± 0.02
Plasma-exposed: TPA + DMSO
(OH scavenger) in PBS
0 (0)263 ± 130 ± 0.02
Plasma-non-exposed: TPA in PBS0 (0)0 (0)0 ± 0.01
Table 3. Plasma generated O 2 in DDW and PBS; values are averages from 5 repeats, with standard deviation around 5%.
O 2   ( 2 - OH - E + )   ( nM )
ΔpH
Plasma-exposed: HE in DDW873 ± 40 (1745 ± 80)3 ± 0.02
Plasma-non-exposed: HE in DDW0 (0)0 ± 0.02
Plasma-exposed: HE in PBS80 ± 4 (160 ± 8)0 ± 0.02
Plasma-non-exposed: HE in PBS0 (0)0 ± 0.01
Publisher’s Note: MDPI stays neutral with regard to jurisdictional claims in published maps and institutional affiliations.

